Article

A Qualitative Assessment of the Trends, Distribution and Sources of Methane in South Africa

by
Lerato Shikwambana
1,2,*,
Boitumelo Mokgoja
1 and
Paidamwoyo Mhangara
1
1
School of Geography, Archaeology and Environmental Studies, University of the Witwatersrand, Johannesburg 2050, South Africa
2
Earth Observation Directorate, South African National Space Agency, Pretoria 0001, South Africa
*
Author to whom correspondence should be addressed.
Sustainability 2022, 14(6), 3528; https://doi.org/10.3390/su14063528
Submission received: 9 February 2022 / Revised: 1 March 2022 / Accepted: 10 March 2022 / Published: 17 March 2022

Abstract

:
Methane (CH4) is the second most important greenhouse gas (GHG) in terms of its concentration and impact on the climate. In the present study, we investigate the trends, sources and distribution of CH4 in South Africa. The study uses satellite datasets from Sentinel-5P and the Atmospheric Infrared Sounder (AIRS). The study also uses credible datasets from the World Bank, Statistics South Africa and the Global Methane Initiative (GMI). The results show an increasing trend of CH4 from 1970–1989. A turning point is observed in 1989, where a decreasing trend is observed from 1989–2001. An increasing trend is then observed from 2001 to 2021. A high concentration of CH4 is observed in the northern and interior parts of South Africa. The results also show that CH4 concentration is influenced by seasonal variations. The September–October–November (SON) season has the highest CH4 concentration distribution in South Africa. The World Bank, Statistics South Africa and the GMI CH4 indictors show that agricultural activities, i.e., involving livestock, are the greatest emitters of CH4 in South Africa, followed by landfill sites. From the livestock data, sheep are the highest emitters of CH4. The increasing CH4 trend is a concern and efforts need to be made to drastically reduce emissions, if South Africa is to meet the 1997 Kyoto Protocol, 2015 Paris Agreement, sustainable development goal 13 (SDG 13) and the COP26 outcome agreements.

1. Introduction

Greenhouse gases (GHGs) absorb and emit radiant energy within the thermal infrared range, causing the greenhouse effect. The main gases responsible for the greenhouse effect are carbon dioxide (CO2), nitrous oxide (N2O), water vapor and methane (CH4). An increase in the atmospheric concentrations of GHG produces a positive climate forcing. CH4 is the second most important greenhouse gas in terms of its concentration and impact on the climate [1,2]. In 2019, global CH4 was estimated at around 570 million tons (Mt) [3]. It was found that about 60% of global CH4 was influenced by anthropogenic sources (i.e., landfill, oil and natural gas systems, agricultural activities, coal mining, and wastewater treatment), and 40% was influenced by natural sources (i.e., wetlands, volcanoes, ocean sediments and wildfires) [4,5,6,7,8]. In addition to the climate impact, high levels of CH4 have an impact on human health. In fact, high levels of methane can reduce the amount of oxygen breathed from the air, which can change the breathing and heart rate conditions that might lead to death.
Livestock is agriculture’s largest CH4 contributor by 98% [2]. On the other hand, wetlands are the world’s largest natural sources for methane, accounting for 20–40% of global methane emissions [5,6,7]. Parker et al. [6] revealed that CH4 trends have shown no growth, but rather a decline between the 1980s and 2000s, and this is due to the balance between different sources and sinks. In contrast, an abrupt increase in atmospheric CH4 occurred between 2007 and 2014 [5,6,7,9,10]. This increase was caused by the prominence of wetlands, production of fossil fuel, and livestock [6]. Africa is occupied by 4.7% of wetlands, while South Africa is occupied by 2.4% [11]. African wetlands are confirmed to be the largest global contributors of CH4 emissions [4,8]. Moreover, CH4 content has been declared to be significant in developing countries due to inadequate manure management and feed production [1]. Forabosco et al. [1] estimated that it is most probable for animals to increase globally to approximately 34 billion by 2050. When that occurs, an improved feed production and manure management is required. Another concerning factor is rapid population growth and development activities, which may see a potential increase in the CH4 emission level [12].
South Africa is not exempt from the rise in CH4 emission levels, in fact, the largest quantity of CH4 was detected in the Eastern Cape province of South Africa in 2010, as a result of the rapid increase in the number of cattle [2]. Furthermore, CH4 in the Gauteng province was also declared as high, due to feedlot emissions [2]. Therefore, this study intends to focus on the CH4 trends in South Africa from 1970 to 2021 using several data sources, including the World Bank indicators, Statistics South Africa (Stas SA) indicators and satellite data. This study is of paramount significance not only because CH4 is the second most important GHG, but also because CH4 traps heat 28 times more than CO2, thus increasing global warming [2,4,5,6,8,13]. Additionally, CH4 has a much shorter atmospheric lifetime than CO2 [1,2,8], but can trap heat more effectively. If the world aspires to meet the sustainable development goal 13 (SDG 13), the 2015 Paris Agreement, and the 1997 Kyoto Protocol, then CH4 needs to be managed by advocating for rigorous CH4 reduction.

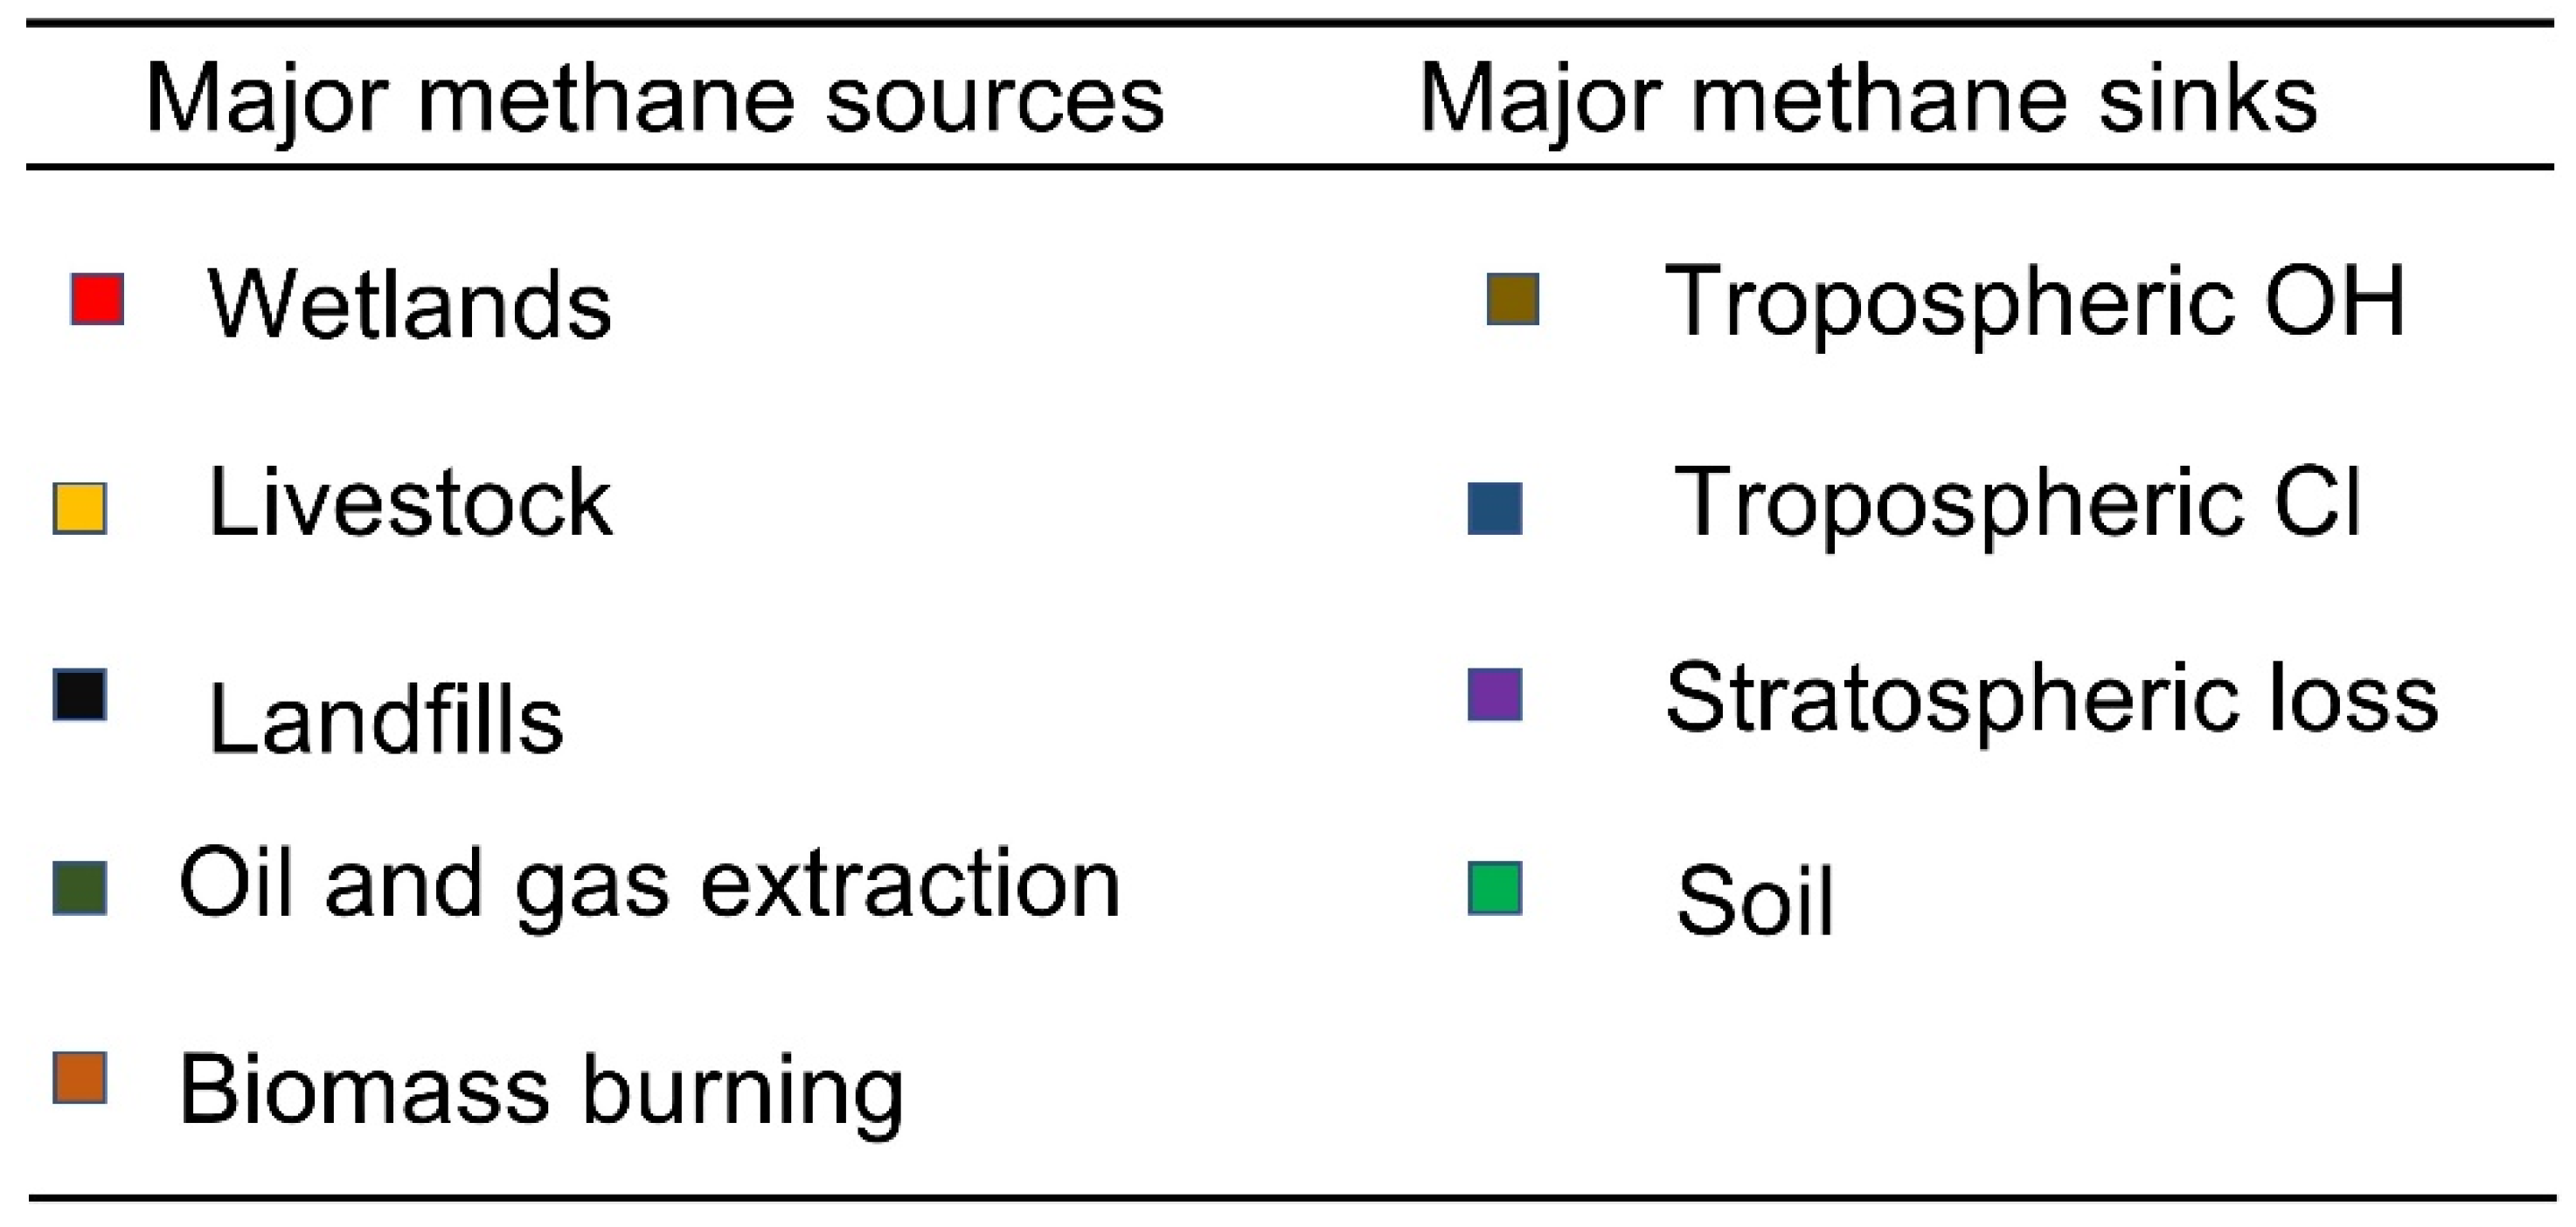
2. Methane Sources and Sinks

CH4 emissions can be broadly grouped into three categories: (1) biogenic, (2) pyrogenic and (3) thermogenic [14]. Biogenic emissions are produced and released from living organisms, such as plants and animals. Pyrogenic emissions are produced by the incomplete combustion of biomass and soil carbon during wildfires. Thermogenic emissions, on the other hand, are formed over millions of years through geological processes. CH4 is emitted from the subsurface into the atmosphere through natural features (such as terrestrial seeps, marine seeps and mud volcanoes), and through the exploitation of fossil fuels, such as coal, oil and natural gas [14]. Figure 1 shows some major sources of CH4 emissions. Livestock, such as cattle, sheep, and goats, emit the largest quantity of CH4 gas because they are ruminants [15,16,17]. Ruminants have microorganisms in their stomachs called methanogens, which produce CH4 through methanogenesis [16,18]. Hook et al. [16] showed that ruminants emit about 86 million tons (Tg) of atmospheric CH4 annually, making ruminants account for 30% of the CH4 emitted into the atmosphere daily [15]. Another major source of CH4 is landfills and open dumps. The decomposition of municipal solid waste (MSW) in developed countries usually ends up in landfills, which emit CH4 gas during the decomposing stages [19,20,21]. However, in developing countries, open dumps are still being used as the final disposal method for solid waste [22]. Another major source of CH4 is oil and gas extraction and production activities. The main activities that produce CH4 occur during upstream production, which include venting, incomplete combustion during flaring and fugitive emissions [23].
The major sinks of CH4 are shown in Figure 1. The troposphere is the largest sink for CH4. CH4 in the troposphere reacts with hydroxyl (OH) radicals, forming mainly water and CO2. Other CH4 sinks include methanotrophic bacteria in soils, oxidation by chlorine radicals in the marine boundary layer, and photochemical destruction in the stratosphere [24].
There are a variety of possible methods to balance sources and sinks of CH4 to produce what is termed “net zero emissions”. The two most suggested approaches are, firstly, to gradually reduce global anthropogenic CH4 emissions towards zero. It is anticipated that slowing down the emission rate of CH4 increases the rate of CH4 uptake by natural sinks. Secondly, develop methods (which are still undeveloped) to remove large concentrations of CH4 gas from the atmosphere. This method requires a thorough understanding of atmospheric chemistry and atmospheric science engineering. It must be noted that there some uncertainties still exist in the identification and quantification of individual sources and sinks. Most importantly, there is much that is still unknown about CH4 sources and sinks and their evolution over time [25].

3. Data and Methods

3.1. Sentinel-5P (TROPOMI)

The TROPOspheric Monitoring Instrument (TROPOMI) is an instrument on board the Copernicus Sentinel-5 Precursor (5P) satellite. Sentinel-5P was launched on 13 October 2017 with a mission to perform atmospheric measurements with a high spatio-temporal resolution to be used for air quality, ozone and UV radiation, and climate monitoring and forecasting. It consists of a high-resolution spectrometer system operating in the ultraviolet-to-shortwave infrared range with 7 different spectral bands: UV-1 (270–300 nm), UV-2 (300–370 nm), VIS (370–500 nm), NIR-1 (685–710 nm), NIR-2 (745–773 nm), SWIR-1 (1590–1675 nm) and SWIR-3 (2305–2385 nm). TROPOMI, on board Sentinel-5p, maps the global atmosphere daily with a resolution of 7 km × 3.5 km (which is 13 times better than the Ozone Monitoring Instrument (OMI)) [26]. This allows for the resolution of fine details to be obtained, including the detection of much smaller methane (CH4) plumes. Other main TROPOMI data products include carbon monoxide (CO), ozone (O3), nitrogen dioxide (NO2), sulfur dioxide (SO2), formaldehyde (HCHO) and aerosols. More details on Sentinel-5P can be found in Theys et al. [26], Tilstra et al. [27] and Verhoelst et al. [28]. In this study, the CH4 product was used. The processing of CH4 TROPOMI data was carried out in the Google Earth Engine (GEE), which is a cloud-based platform that enables the large-scale processing of satellite data. TROPOMI uses absorption information from the Oxygen A Band (760 nm) and the SWIR spectral range to monitor CH4 abundances in the Earth’s atmosphere. Uncertainties for XCH4 are only based on the single sounding precision due to the measurement noise. The current data release only provides XCH4 over land. In the Level 2 processing of the data, clouds are removed; hence, in the GEE platform, no filters were used. TROPOMI has a measurement frequency of one day. A total of 1277 days of observation, from 1 July 2018 to 31 December 2021, was used.

3.2. AIRS

The Atmospheric Infrared Sounder (AIRS) was launched on the Earth Observing System (EOS) aqua satellite in May 2002. The AIRS instrument was designed to provide continuous global observations with an accuracy equal to that of radiosondes [29]. Most importantly, AIRS was developed to address (1) the global water and energy cycle, (2) climate weather connection, (3) atmospheric composition and (4) weather prediction [29]. AIRS is an infrared grating spectrometer that operates in the thermal infrared portion of the spectrum, from 3.7 µm to 15.4 µm. It has 2378 channels covering about 314 in this range, with a spectral resolution (λ/Δλ) of about 1200. AIRS has a frequency of one day. More details on AIRS can be found in Lambrigtsen et al. [29] and Morse et al. [30]. The AIRS data is obtained from the Giovanni platform (https://giovanni.gsfc.nasa.gov/giovanni/ (accessed on 10 January 2022)) and the data is Level 2 processed and is cloud free, so no filters were used.

3.3. Statistics South Africa (Stats SA) Indicators

Stats SA is the national statistical service for South Africa, which produces timely, accurate and official statistics (http://www.statssa.gov.za/ (accessed on 10 January 2022)). In this study, Stats SA data was used to retrieve the livestock data from the years 1996 to 2020. The livestock data included the number of cattle, sheep and goats in South Africa per year. Pigs’ CH4 emission data were omitted as it has been shown that pigs emit far less CH4 compared to cattle, sheep and goats [2].

3.4. World Bank Indicators

World Development Indicators (WDIs) is the primary World Bank collection of development indicators, compiled from officially recognized international sources (https://databank.worldbank.org/home.aspx (accessed on 10 January 2022)). It presents the most current and accurate global development data available, and includes national, regional and global estimates. The World Bank data is accurate and reliable, however, developing countries still face a number of problems in providing statistics that meet these criteria. South Africa, as a developing country, has managed to produce resources that enable them to produce quality-controlled data. More on the quality of the World Bank data can be accessed via (https://datahelpdesk.worldbank.org/knowledgebase/articles/906534-data-quality-and-effectiveness (accessed on 10 January 2022)) In this study, the total CH4 emission data over South Africa between the years 1970 to 2018 were used.

3.5. Global Methane Initiative

The Global Methane Initiative (GMI) is an international public–private initiative that advances cost-effective, near-term methane abatement and the recovery and use of methane as a clean energy source in three sectors: (1) biogas (including agriculture, municipal solid waste, and wastewater), (2) coal mines, and (3) oil and gas systems (https://www.globalmethane.org/ (accessed on 11 January 2022)). GMI was launched in 2004 with the aim of identifying and quantifying methane emission sources to reduce greenhouse gas (GHG) emissions, improve air quality, increase energy security and enhance economic growth. GMI has 46 partner countries and over 700 Project Network members with whom they exchange information and technical resources. GMI also uses data obtained from the U.S. Environmental Protection Agency (U.S. EPA) report (https://www.epa.gov/global-mitigation-non-co2-greenhouse-gases (accessed on 11 January 2022)). The EPA technical report provides a consistent and comprehensive set of historical and projected estimates of emissions and technical and economic mitigation estimates of non-CO2 GHGs from anthropogenic sources for 195 countries. The analysis provides information that can be used to understand national contributions of GHG emissions, historical progress of the reductions, and mitigation opportunities. In this study, the CH4 emission by type was used. Specifically, energy, landfill waste, water waste, livestock enteric emissions and livestock manure were analyzed.

3.6. Sequential Mann–Kendall (SQMK) Test

The Sequential Mann–Kendall (SQMK) test proposed by Sneyer [31] was used to identify the abrupt changes in significant trends [32,33]. This test sets up two series: a progressive u ( t ) and a retrograde (backward) series u ( t ) . If they cross each other and diverge beyond the specific threshold value, then there is a statistically significant trend. The point at which they cross each other indicates the approximate year in which the trend begins [34]. The threshold values in this study are ±1.96 (p = 0.05), with the crossing point estimating the year in which the trend begins. The SQMK test has the following steps:
i
At each comparison, the number of cases xi > xj is counted and indicated by n i , where xi (i = 1,2,…n) and xj (1,2,…n) are the sequential values in a series, respectively.
ii
The test statistic ti is calculated by
t i = j = 1 i n j
iii
The mean E(t) and the variance var(ti) of the test statistic are calculated by
E ( t ) = n ( n 1 ) 4
var ( t i ) = i ( i 1 ) ( 2 i + 5 ) 72
iv
The sequential progressive value can be calculated as
u ( t ) = t i E ( t ) var ( t i )
Similarly, the values of u ( t ) are computed backward, starting from the end of the series. In this study, SQMK was performed on CH4 emission data in South Africa. The CH4 concentration data used were retrieved from AIRS.

4. Results and Discussion

4.1. Trends and Spatial Distribution of CH4 in South Africa

Figure 2a shows a linear trend of CH4 emissions in South Africa. An increase in CH4 emissions is observed between the years 1970 and 1989. There are a number of likely factors that could have led to the gradual increase in CH4 in the period from 1970–1989. Firstly, the increasing population growth meant an increase in electricity demand, food security (increase in agricultural activities) and waste management (landfill and dumping sites). The increase in energy demand means an increase in the production of electricity. South Africa is dominated by coal-fired power plants [35], therefore more coal mining activities would increase, thus releasing more CH4. Food security leads to the production of more crops, plants and livestock. The increase in the livestock would add to the increase in CH4 emissions, as it is known that livestock emit large quantities of CH4. An increase in solid waste from the public would lead to an increase in landfill and dumping sites. The decomposition of the solid waste releases CH4 into the atmosphere. All these factors combined can increase the CH4 emission drastically over time. However, between 1989 and 2001, a gradual decrease in CH4 emissions can be observed. The decrease could be attributed to the improvements to waste management in landfills and open dumping sites. Furthermore, CH4 reducing feed additives and supplements inhibiting methanogens in the rumen could have been used to reduce enteric CH4 emissions. After the year 2000, an increase in CH4 emissions was observed yet again.
The AIRS instrument, from 2002 to 2021, also showed an increasing trend of CH4 concentration (see Figure 2b). Overall, the SQMK trend in Figure 2b shows that the CH4 concentration increased year on year. Shikwambana et al. [36] showed that the economy of any country is linked to the emission regime. The more the economy grows, measured by the gross domestic product (GDP), the more emissions there are, if non-clean technologies are used. However, in South Africa, the economy grew substantially in the 2000s. This resulted in more investments in the country and more people coming in to set up various companies. This again resulted in more demand for food security, energy and waste disposal sites. With no strict measures for emissions, industries and emerging farmers did not take heed of the CH4 emissions, as they were not publicized as CO2 emissions. Only recently, in the last twenty years, has enough noise been generated about the global warming dangers of CH4. New spaceborne instruments as well as ground-based instruments were developed to actively measure CH4 emission hotspots. TROPOMI and AIRS are good examples of recent satellite technologies that were developed to measure CH4 concentrations at mid-to-high resolutions. The sudden rise in CH4 emissions in the 2000s was a global phenomenon, which is still not understood, and efforts are being made to establish the trend. There was a hypothesis that stated that a decline in OH contributed to the rise in CH4 concentrations [24]. However, in this work, we further speculate on the possible CH4 emission increase scenarios over time in South Africa.
The mean spatial distribution of CH4 concentrations in South Africa for the period from 2018–2021 is shown in Figure 2c. High concentrations of CH4, 1826–1850 ppbV, are observed in the interior and northern parts of South Africa. The Northern Cape (NC), North-West (NW), Mpumalanga (MP), Gauteng (GP), Free State (FS) and Limpopo (LP) provinces have areas with high concentrations of CH4. The high concentration of CH4 in NC, NW, LP and FS can be attributed to livestock farming. Mining activities emitting CH4 can also be observed in NC, LP and MP. The Ephemeral Wetlands in NC also contribute to CH4 concentrations. Energy-emitting activities can be found in MP and GP. GP is one of the most densely populated provinces in South Africa. This large population of people results in various landfill and dumping sites across the province. Therefore, solid waste disposal sites greatly contribute to the emission of CH4 in this region. Overall, the observed CH4 concentration distribution in South Africa results from various sources. However, agriculture, landfill, energy production and wetlands are the main drivers of CH4 emissions across the country.
A year-on-year trend for the spatial distribution of CH4 concentration in South Africa is shown in Figure 3. Data for the year 2018 was available from June; this is why there are white gaps in Figure 3a. The white gaps mean that no data is available. However, the figure still shows some dominance of CH4 concentration in the NC, NW and LP provinces. Although CH4 was not prevalent in 2018, the figure shows the emergence of CH4 in these regions. In 2019, as can be observed in Figure 3b, the presence of CH4 is starting to be dominant in the NC province. The emergence of CH4 can also be noticed in the GP and MP provinces. By the year 2020 (see Figure 3c), the interior and northern parts of South Africa have a high CH4 concentration. The year 2021 (see Figure 3d) shows an even more horrifying picture of CH4 concentrations dominating most of South Africa. This is of serious concern and needs to be addressed at a policy-maker level. Unless drastic actions are taken to mitigate this issue, the trend suggests that CH4 concentrations may continue to increase year-on-year. The continuous increase in CH4 concentrations is caused by the continuous emissions of CH4 from various sectors, such as agriculture, energy, waste management and natural sources, such as wetlands. The consequences of such a significant rise in CH4 concentrations is a rapid rise in the regional temperature, which may lead to a reginal global warming scenario and climate change.

4.2. Averaged Seasonal Spatial Distribution of CH4 over South Africa

Sweeney et al. [37] stated that CH4 emissions are sensitive to temperature, thus CH4 concentrations vary seasonally. Dangal et al. [38] showed that the rise in CH4 concentrations in China and Mongolia from May to September was due to rising temperatures. Furthermore, Akimoto et al. [39], Ganesan et al. [40] and Tian et al. [41] also showed the seasonal variation of CH4 concentrations. They attributed these changes to rice cultivation, wetlands, microbial activity and burning biomass, to name a few. Figure 4 shows the seasonal distribution of CH4 concentrations in South Africa. The largest distribution of CH4 concentrations is observed during the September–October–November (SON) season (see Figure 4d), while the least CH4 concentration distribution is observed during the December–January–February (DJF) season (see Figure 4a). The majority of South Africa, except the southwestern regions, experience rainfall in the SON season. South Africa also experiences moderate temperatures ~23 °C. Unlike some studies in which temperature drives the seasonal variation of CH4 concentration, these results show that water availability in terms of the precipitation–evaporation ratio can also play a more vital role than temperature [42]. Therefore, the large CH4 concentration in the SON season can be attributed to an increase in rainfall, which likely increases the wetlands, and thereby increases CH4 released from wetlands. Furthermore, biomass burning that occurs in the late-June–July–August (JJA) season and the SON season [43] also contributes to the total CH4 concentration. On the contrary, both DJF and the March–April–May (MAM) seasons (see Figure 4a,b) show relatively lower CH4 concentrations (1784 ppbV and 1805 ppbV), except for the NC province. A higher CH4 uptake system (sinks) could exist in these seasons, compared to the other seasons. Firstly, well-aerated soils, such as in forests, grasslands and arable lands, are considered as the sink of atmospheric CH4 [44]. This process could slightly contribute to the sink process during these seasons. Secondly, speculation with very little certainty suggests that OH is more dominant during these seasons, and thus removes some CH4 from the atmosphere. Globally, the OH-related uncertainties in the CH4 budget still remain. This is because OH has a relatively short lifespan; therefore, it is difficult to gather global OH concentrations using direct observations.

4.3. Sources of CH4 in South Africa

Figure 5 shows the total contribution and linear trends of CH4 emissions by category and livestock. It is important to identify the main contributor of CH4 emissions as this helps in the mitigation stages. The trend obviously assists in determining whether there is an increase, decrease or no change in the emission regime. Depending on the outcome, necessary measures by policy makers need to be taken to mitigate the situation. Figure 5a shows that agricultural activities, i.e., livestock farming, are the greatest source of CH4 emissions in South Africa. Specifically, livestock enteric emissions are the greatest contributor, with 52% of the total emissions. Du Toit et al. [2] showed that the CH4 emission from livestock is dependent on the dry matter intake. Landfill sites, on the other hand, are the next biggest emitter producing 40% of the total CH4 emissions in South Africa. Waste disposed into landfill sites undergoes aerobic decomposition, which produces a small amount of CH4. Thereafter, the anaerobic condition prevails, and due to methanogen activities, the waste emits CH4 for years, even if the landfill site is closed [45]. Livestock manure contributes 5% of the total CH4 emissions, while energy production and wastewater each contribute 2% of the total CH4 emission. The linear trend in Figure 5b shows no change in the trend of CH4 emissions in the livestock enteric emissions, livestock manure, wastewater and energy source. These sources do not show any major changes in the emission regime from 1990 to 2020. The landfill waste, however, showed a decreasing trend in CH4 emissions from 1995 to 2000. This trend is observed in Figure 2a as well. It is anticipated that the decrease might have been caused by stronger CH4 sinks during that period. However, from 2001 to 2020, a steady increase in CH4 emissions can be observed. This increase implies that the emission sources are greater than the CH4 sinks. Again, this trend follows the global increasing trend of CH4. There are still, however, uncertainties of the cause of the increasing CH4 concentrations year-on-year.
From the agricultural activities, livestock is further categorized as the highest CH4 emitter. Figure 5c shows that sheep are the highest emitters of CH4 compared to the other livestock. Cattle are the second highest livestock emitters, followed by goats, which are the third highest emitters of CH4. To make the issue even more complex, Figure 5d shows that there are more sheep than cattle and goats. Depending on the rate of emission from sheep, this implies that sheep could have a higher CH4 emission. On the brighter side, the number of sheep trend shows a steady decreasing number of sheep from 1996 to 2020. The number of sheep decreased from ~2.89 × 10⁷ in 1996 to ~2.16 × 10⁷ in 2020, a decrease of ~25.3 %. The cattle and goat trend shows no changes in their numbers from 1996 to 2020. The number of cattle remained at ~1.33 × 10⁷ and the number of goats remained at ~6.4 × 10⁶.
The current issue is to reduce the CH4 emissions from livestock. Breeding less livestock might solve the emission problem, but this might cause food security problems. One solution would be to use feed additives that can inhibit the microorganisms that produce CH4 in the rumen, which can then reduce CH4 emissions.

5. Overall Remarks to CH4 over South Africa

Although some of the CH4 sources in South Africa might not be quantified, South Africa has many sources of CH4. One of the emitters is coal mines. South Africa is heavily dependent on coal for energy production, which means there are lots of coal mines that supply the power stations. Underground coal mines account for most CH4 emissions. There are three ways CH4 can be released from mining activities: (1) by degasification systems, (2) by ventilation systems and (3) by abandoned mines. South Africa has ~19 active coal mines. According to Stats SA, coal production amounted for 306 million metric tons in 2019. Another important source of CH4 is landfill or waste sites. Waste sites in South Africa were estimated at 1085 in 2015; this was up from 42 in 2008. The rate of new waste sites, especially in metropolitan cities, is alarming. The new sites are a result of rural–urban migration. Migrants from the poor rural settings occupy land at the boundaries of the city and set up informal dwelling households. Their aim is to be near the city and look for employment. However, during their stay, they accumulate waste that needs to be disposed. They then set up informal dumping sites in which all the waste is disposed. The decomposing waste releases all sorts of chemicals, which, firstly, creates a health problem for the community and, secondly, releases CH4 into the atmosphere. Most of the dumping sites are established in this way. The most globally discussed CH4 source, including South Africa, is the emissions from livestock. The results presented in Section 4 show that livestock has a vast impact on the concentration of CH4. Therefore, significant efforts need to be made to reduce the amount of CH4 emitted by these animals. One of the proposed methods is to change the feed intake of livestock. Feed the animals with food that emits less CH4, e.g., adding fat to the diet of cows and reducing methanogens or other microbes involved in methanogenesis.
More work needs to be conducted to understand the sources and sinks of CH4 in South Africa. This knowledge helps to assess the levels of CH4 concentrations and what mitigation and adaptation strategies need to be implanted to reduce and/or obtain to ‘non-zero’ emissions of CH4. The creation and/or enhancement of artificial and natural CH4 sinks need to be rapidly implemented. CH4 is a harmful gas that needs our immediate attention.

6. Conclusions

The study shows an increasing trend of CH4 concentrations in South Africa. This trend is observed globally, but the exact reasons for the increase are still unclear. However, this study attempts to suggests some possible CH4 sources and activities responsible for the increase in CH4 emissions in South Africa between the years 2000 and 2021. The decrease in CH4 sinks is one factor that results in an increase in CH4 concentration. The other factor is the high emission of CH4 from the agricultural sector and the waste management sectors. Population growth and migration into the cities are the key drivers for the increase. CH4 emissions show some seasonal variations, with the SON season showing the highest CH4 concentration distribution. The rainy conditions are attributed to the high concentration of CH4. The World Bank, Stats SA indicators and the GMI data were crucial in showing the contribution of the total methane sources by category and livestock in South Africa. Overall, the study presents a high-level view of the trends and distribution of CH4 in South Africa. The study is good enough for policy makers in the country to understand the scenario of CH4 emissions and make informed decisions. This paper presents a high-level perspective on the distribution and trends of CH4 in South Africa. A detailed quantitative study needs to be carried out to understand the amounts of CH4 released from the hotspots in South Africa. This will then lead to a plan of action to introduce various strategies to reduce the amount of CH4 emissions.
One of the gaps in this study is the lack of CH4 emission data. More CH4 monitoring stations should be setup to fully understand the sources and trends of CH4 emissions at a local level. Furthermore, a follow-up study should investigate the relationship between CH4 emissions and concentrations with meteorological and vegetation parameters, such as temperature, precipitation, radiation forcing and the Normalized Difference Vegetation Index (NDVI). This study contributes to the understanding of the CH4 emission increase or decrease over time.

Author Contributions

Conceptualization, L.S., B.M. and P.M.; methodology, L.S. and B.M.; software, L.S.; formal analysis, L.S.; investigation, B.M.; writing—original draft preparation, L.S.; writing—review and editing, B.M. and P.M. All authors have read and agreed to the published version of the manuscript.

Funding

This research received no external funding.

Institutional Review Board Statement

Not applicable.

Informed Consent Statement

Not applicable.

Data Availability Statement

The data that support the findings of this study are openly available at https://giovanni.gsfc.nasa.gov/giovanni/ (accessed on 10 January 2022), https://code.earthengine.google.com/ (accessed on 10 January 2022), http://www.statssa.gov.za/ (accessed on 10 January 2022), https://databank.worldbank.org/home.aspx (accessed on 15 January 2022) and, https://www.globalmethane.org/ (accessed on 14 January 2022).

Acknowledgments

We thank and acknowledge the ESA for the Sentinel-5P/TROPOMI data. The author acknowledges the GES-DISC Interactive Online Visualization and Analysis Infra-structure (Giovanni) for providing the AIRS data. We also thank the World Bank, Statistics South Africa and the Global Methane Initiative for making their data freely available.

Conflicts of Interest

The authors declare no conflict of interest.

References

  1. Forabosco, F.; Chitchyan, Z.; Mantovani, R. Methane, nitrous oxide emissions and mitigation strategies for livestock in developing countries: A review. S. Afr. J. Anim. Sci. 2017, 47, 268–280. [Google Scholar] [CrossRef] [Green Version]
  2. du Toit, C.J.L.; van Niekerk, W.A.; Meissner, H.H. Direct greenhouse gas emissions of the South African small stock sectors. S. Afr. J. Anim. Sci. 2013, 43, 340–361. [Google Scholar] [CrossRef] [Green Version]
  3. IEA. Methane Tracker; IEA: Paris, France, 2020; Available online: https://www.iea.org/reports/methane-tracker-2020 (accessed on 27 January 2022).
  4. Lunt, M.F.; Palmer, P.I.; Feng, L.; Taylor, C.M.; Boesch, H.; Parker, R.J. An increase in methane emissions from tropical Africa between 2010 and 2016 inferred from satellite data. Atmos. Chem. Phys 2019, 19, 14721–14740. [Google Scholar] [CrossRef] [Green Version]
  5. Krüger, J.P.; GEROLD, G.; Beckedahl, H.; Jungkunst, H.F. Effect of environmental conditions on methane and nitrous oxide fluxes of two South African wetlands. GEO-ÖKO 2012, 33, 66–88. [Google Scholar]
  6. Parker, R.J.; Boesch, H.; McNorton, J.; Comyn-Platt, E.; Gloor, M.; Wilson, C.; Chipperfield, M.P.; Hayman, G.D.; Bloom, A.A. Evaluating year-to-year anomalies in tropical wetland methane emissions using satellite CH4 observations. Remote Sens. Environ. 2018, 211, 261–275. [Google Scholar] [CrossRef]
  7. Davidson, J. African Wetlands a Major Source of Methane Emissions, Study Finds. EcoWatch. 2019. Available online: https://www.ecowatch.com/africa-wetlands-methane-emissions-2641589543.html (accessed on 27 January 2022).
  8. Achieng, B. Methane Gas Emissions Increase in Tropical Africa. Science and Development Network. 2019. Available online: https://www.scidev.net/sub-saharan-africa/news/methane-gas-emissions-increase-in-tropical-africa/ (accessed on 27 January 2022).
  9. Saunois, M.; Stavert, A.R.; Poulter, B.; Bousquet, P.; Canadell, J.G.; Jackson, R.B.; Raymond, P.A.; Dlugokencky, E.J.; Houweling, S.; Patra, P.K.; et al. The Global Methane Budget 2000–2017. Earth Syst. Sci. Data 2020, 12, 1561–1623. [Google Scholar] [CrossRef]
  10. Turner, A.J.; Frankenberg, C.; Kort, E.A. Interpreting contemporary trends in atmospheric methane. Proc. Natl. Acad. Sci. USA 2019, 116, 2805–2813. [Google Scholar] [CrossRef] [Green Version]
  11. Dini, J.; Everard, M. National Wetland Policy: South Africa. In The Wetland Book; Finlayson, C.M., Everard, M., Irvine, K., McInnes, R., Middleton, B., van Dam, A., Davidson, N.C., Eds.; Springer: Dordrecht, The Netherlands, 2016; pp. 1–6. [Google Scholar]
  12. EPA. 2012. Available online: https://www.epa.gov/gmi/epa-global-methane-initiative-grants (accessed on 27 January 2022).
  13. Stocker, T. Climate Change 2013: The Physical Science Basis: Working Group I Contribution to the Fifth Assessment Report of the Intergovernmental Panel on Climate Change; Cambridge University Press: Cambridge, UK, 2014. [Google Scholar]
  14. Kirschke, S.; Bousquet, P.; Ciais, P.; Saunois, M.; Canadell, J.G.; Dlugokencky, E.J.; Bergamaschi, P.; Bergmann, D.; Blake, D.R.; Bruhwiler, L.; et al. Three decades of global methane sources and sinks. Nat. Geosci. 2013, 6, 813–823. [Google Scholar] [CrossRef]
  15. Black, J.L.; Davison, T.M.; Box, I. Methane Emissions from Ruminants in Australia: Mitigation Potential and Applicability of Mitigation Strategies. Animals 2021, 11, 951. [Google Scholar] [CrossRef]
  16. Hook, S.E.; Wright, A.D.G.; McBride, B.W. Methanogens: Methane producers of the rumen and mitigation strategies. Archaea 2010, 2010, 945785. [Google Scholar] [CrossRef] [Green Version]
  17. Mirzaei-Aghsaghali, A.; Maheri-Sis, N. Factors affecting mitigation of methane emission from ruminants I: Feeding strategies. Asian J. Anim. Vet. Adv. 2011, 6, 888–908. [Google Scholar] [CrossRef] [Green Version]
  18. Danielsson, R.; Dicksved, J.; Sun, L.; Gonda, H.; Müller, B.; Schnürer, A.; Bertilsson, J. Methane production in dairy cows correlates with rumen methanogenic and bacterial community structure. Front. Microbiol. 2017, 8, 226. [Google Scholar] [CrossRef] [PubMed]
  19. Rajkumar, N.; Subramani, T.; Elango, L. Groundwater contamination due to municipal solid waste diposal—A GIS based study in Erode City. Int. J. Environ. Sci. 2010, 1, 39–55. [Google Scholar]
  20. Scheehle, E.A.; Kruger, D. Global anthropogenic methane and nitrous oxide emissions. Energy J. Multi-Greenh. Gas Mitig. Clim. Policy 2006, 27, 33–44. [Google Scholar] [CrossRef]
  21. Singh, C.K.; Kumar, A.; Roy, S.S. Quantitative analysis of the methane gas emissions from municipal solid waste in India. Sci. Rep. 2018, 8, 2913. [Google Scholar] [CrossRef]
  22. Bogner, J.E.; Spokas, K.A.; Burton, E.A. Kinetics of Methane Oxidation in a Landfill Cover Soil: Temporal Variations, a Whole-Landfill Oxidation Experiment, and Modeling of Net CH4 Emissions. Environ. Sci. Technol. 1997, 31, 2504–2514. [Google Scholar] [CrossRef]
  23. MacKay, K.; Lavoie, M.; Bourlon, E.; Atherton, E.; O’Connell, E.; Baillie, J.; Fougère, C.; Risk, D. Methane emissions from upstream oil and gas production in Canada are underestimated. Sci. Rep. 2021, 11, 8041. [Google Scholar] [CrossRef]
  24. Rigby, M.; Montzka, S.A.; Prinn, R.G.; White, J.W.C.; Young, D.; O’Doherty, S.; Lunt, M.F.; Ganesan, A.L.; Manning, A.J.; Simmonds, P.G.; et al. Role of atmospheric oxidation in recent methane growth. Proc. Natl. Acad. Sci. USA 2017, 114, 5373–5377. [Google Scholar] [CrossRef] [Green Version]
  25. Fernandez-Cortes, A.; Cuezva, S.; Alvarez-Gallego, M.; Garcia-Anton, E.; Pla, C.; Benavente, D.; Jurado, V.; Saiz-Jimenez, C.; Sanchez-Moral, S. Subterranean atmospheres may act as daily methane sinks. Nat. Commun. 2015, 6, 7003. [Google Scholar] [CrossRef] [Green Version]
  26. Theys, N.; Hedelt, P.; De Smedt, I.; Lerot, C.; Yu, H.; Vlietinck, J.; Pedergnana, M.; Arellano, S.; Galle, B.; Fernandez, D. Global monitoring of volcanic SO2 degassing with unprecedented resolution from TROPOMI onboard Sentinel-5 Precursor. Sci. Rep. 2019, 9, 2643. [Google Scholar] [CrossRef]
  27. Tilstra, L.G.; de Graaf, M.; Wang, P.; Stammes, P. In-orbit Earth reflectance validation of TROPOMI on board the Sentinel-5 Precursor satellite. Atmos. Meas. Tech. 2020, 13, 4479–4497. [Google Scholar] [CrossRef]
  28. Verhoelst, T.; Compernolle, S.; Pinardi, G.; Lambert, J.-C.; Eskes, H.J.; Eichmann, K.-U.; Fjæraa, A.M.; Granville, J.; Niemeijer, S.; Cede, A. Ground-based validation of the Copernicus Sentinel-5p TROPOMI NO2 measurements with the NDACC ZSL-DOAS, MAX-DOAS and Pandonia global networks. Atmos. Meas. Tech. 2021, 14, 481–510. [Google Scholar] [CrossRef]
  29. Lambrigtsen, B.; Fetzer, E.; Fishbein, E.; Lee, S.-Y.; Pagano, T. AIRS—The Atmospheric Infrared Sounder. IEEE Int. Geosci. Remote Sens. Symp. 2004, 3, 2204–2207. [Google Scholar] [CrossRef]
  30. Morse, P.G.; Bates, J.C.; Miller, C.R.; Chahine, M.T.; O’Callaghan, F.; Aumann, H.H.; Karnik, A.R. Development and test of the Atmospheric Infrared Sounder (AIRS) for the NASA Earth Observing System (EOS). In Proceedings of the SPIE 3870 Sensors, Systems, and Next-Generation Satellites III, Florence, Italy, 20–23 September 1999. [Google Scholar] [CrossRef]
  31. Sneyers, R. On the Statistical Analysis of Series of Observations; Technical Note No. 143; World Meteorological Organization (WMO): Geneva, Switzerland, 1990. [Google Scholar]
  32. Sneyers, R. Climate chaotic instability: Statistical determination and theoretical background. Environmetrics 1997, 8, 517–532. [Google Scholar] [CrossRef]
  33. Sneyers, R.; Tuomenvirta, H.; Heino, R. Observations inhomogeneities and detection of climate change the case of the Oulu (Finland) air temperature series. Trans. Res. Record J. Trans. Res. Board 1998, 34, 159–178. [Google Scholar]
  34. Mosmann, V.; Castro, A.; Fraile, R.; Dessens, J.; Sanchez, J. Detection of statistically significant trends in the summer precipitation of mainland Spain. Atmos. Res. 2004, 70, 43–53. [Google Scholar] [CrossRef]
  35. Shikwambana, L.; Mhangara, P.; Mbatha, N. Trend analysis and first time observations of sulphur dioxide and nitrogen dioxide in South Africa using TROPOMI/Sentinel-5P data. Int. J. Appl. Earth Obs. Geoinf. 2020, 91, 102130. [Google Scholar] [CrossRef]
  36. Shikwambana, L.; Mhangara, P.; Kganyago, M. Assessing the Relationship between Economic Growth and Emissions Levels in South Africa between 1994 and 2019. Sustainability 2021, 13, 2645. [Google Scholar] [CrossRef]
  37. Sweeney, C.; Dlugokencky, E.; Miller, C.E.; Wofsy, S.; Karion, A.; Dinardo, S.; Chang, R.Y.W.; Miller, J.B.; Bruhwiler, L.; Crotwell, A.M.; et al. No significant increase in long-term CH4 emissions on North Slope of Alaska despite significant increase in air temperature. Geophys. Res. Lett. 2016, 43, 6604–6611. [Google Scholar] [CrossRef] [Green Version]
  38. Dangal, S.R.; Tian, H.; Zhang, B.; Pan, S.; Lu, C.; Yang, J. Methane emission from global livestock sector during 1890–2014: Magnitude, trends and spatiotemporal patterns. Glob. Chang. Biol. 2017, 23, 4147–4161. [Google Scholar] [CrossRef]
  39. Akimoto, H.; Kurokawa, J.I.; Sudo, K.; Nagashima, T.; Takemura, T.; Klimont, Z.; Amann, M.; Suzuki, K. SLCP co-control approach in East Asia: Tropospheric ozone reduction strategy by simultaneous reduction of NOx/NMVOC and methane. Atmos. Environ. 2015, 122, 588–595. [Google Scholar] [CrossRef]
  40. Ganesan, A.L.; Rigby, M.; Lunt, M.F.; Parker, R.J.; Boesch, H.; Goulding, N.; Umezawa, T.; Zahn, A.; Chatterjee, A.; Prinn, R.G.; et al. Atmospheric observations show accurate reporting and little growth in India’s methane emissions. Nat. Commun. 2017, 8, 836. [Google Scholar] [CrossRef] [PubMed] [Green Version]
  41. Tian, H.; Chen, G.; Lu, C.; Xu, X.; Ren, W.; Zhang, B.; Banger, K.; Tao, B.; Pan, S.; Liu, M.; et al. Global methane and nitrous oxide emissions from terrestrial ecosystems due to multiple environmental changes. Ecosyst. Health Sustain. 2015, 1, 1–20. [Google Scholar] [CrossRef] [Green Version]
  42. Pal, S.; Debanshi, S. Methane emissions only negligibly reduce the ecosystem service value of wetlands and rice paddies in the mature Ganges Delta. Environ. Sci. Pollut. Res. 2022, 1–15. [Google Scholar] [CrossRef]
  43. Aurela, M.; Beukes, J.P.; van Zyl, P.; Vakkari, V.; Teinilä, K.; Saarikoski, S.; Laakso, L. The composition of ambient and fresh biomass burning aerosols at a savannah site, South Africa. S. Afr. J. Sci. 2016, 112, 1–8. [Google Scholar] [CrossRef] [Green Version]
  44. Dutaur, L.; Verchot, L.V. A global inventory of the soil CH 4 sink Glob. Biogeochem. Cycles 2007, 21, GB4013. [Google Scholar] [CrossRef]
  45. Chynoweth, D.P.; Owens, J.M.; Legrand, R. Renewable methane from anaerobic digestion of biomass. Renew. Energy. 2001, 22, 1–8. [Google Scholar] [CrossRef]
Figure 1. Some major sources and sinks of methane [4,5,6,7,8].
Sustainability 14 03528 g001
Figure 2. (a) Trend of CH4 emissions from 1970–2018. Data retrieved from stats SA. (b) SQMK trend of CH4 concentration, data retrieved from AIRS. (c) Mean spatial distribution of CH4 concentration in South Africa for the period of 2018–2021. Data was retrieved from TROPOMI.
Sustainability 14 03528 g002
Figure 3. Mean spatial distribution of CH4 concentrations in South Africa in (a) 2018 (June–December), (b) 2019, (c) 2020 and (d) 2021. Data was retrieved from TROPOMI.
Sustainability 14 03528 g003
Figure 4. Mean spatial distribution of CH4 concentrations for the period of 2018–2021 during (a) DJF; (b) MAM; (c) JJA; and (d) SON seasons. Data was retrieved from TROPOMI.
Sustainability 14 03528 g004
Figure 5. (a) Contribution of the total methane sources by category from GMI. (b) Linear trend of methane emissions by category from GMI. (c) Contribution of livestock type to the methane emissions from Stats SA. (d) Linear trend of methane emissions by livestock type from Stats SA.
Sustainability 14 03528 g005
Publisher’s Note: MDPI stays neutral with regard to jurisdictional claims in published maps and institutional affiliations.

