Article

Subregion-Scale Geothermal Delineation Based on Image Analysis Using Reflection Seismology and Well Data with an Outlook for Land Use

1
Institute of Water and Environmental Management, Faculty of Agricultural and Food Sciences and Environmental Management, University of Debrecen, Böszörményi Str. 138, 4032 Debrecen, Hungary
2
Department of Mineralogy and Geology, Institute of Earth Sciences, Faculty of Natural Sciences and Technology, University of Debrecen, Egyetem Tér 1, 4032 Debrecen, Hungary
3
Institute of Crop Sciences, University of Debrecen, 138 Böszörményi St., 4032 Debrecen, Hungary
4
Arid Land Research Centre, University of Debrecen, 138 Böszörményi St., 4032 Debrecen, Hungary
5
Institute of Plant Protection, University of Debrecen, 138 Böszörményi St., 4032 Debrecen, Hungary
*
Author to whom correspondence should be addressed.
Sustainability 2022, 14(6), 3529; https://doi.org/10.3390/su14063529
Submission received: 31 January 2022 / Revised: 24 February 2022 / Accepted: 15 March 2022 / Published: 17 March 2022
(This article belongs to the Special Issue Applying Remote Sensing for Sustainable Land Use Changes)

Abstract

:
The role of geothermal energy is smaller in the global energy mix than what its potential would indicate, but it can be improved by incorporating geothermal energy potential assessments into spatial planning. For adequate decision support and sustainable utilisation, subregion-scale assessments should be applied due to the high variability in geothermal characteristics. Different GIS tools were used for the interpretation and integration of the different spatial data into one model showing areas with their geothermal characteristics on maps. Considering the present study site with a size of 83 km × 103 km located in NE Hungary, 39 2D reflection seismic sections and high-resolution geological data of 137 thermal wells were interpreted in OpendTect and then in ArcGIS to define spatial differences in geothermal potential. It was found that nine geothermal subregions (GSRs) can be distinguished in the present study site based on the applied GIS algorithms. Each GSR was characterised and land-use structure was studied based on Corine Land Cover 2018. The exploitation of water with at least 30 °C is possible in all GSRs, while the maximum achievable temperature and reservoir geometry vary; a subregion-scale delineation framework is required for regional planning.

1. Introduction

Geothermal energy utilisation is considered to be a renewable resource generally with low environmental impact, and increasing its ratio in the energy mix is an important part of energy strategies [1,2]. Maximising efficiency and minimising environmental effects—mainly the significant water level drop—the widest possible utilisation should be carried out [3,4,5,6,7,8]. One of the ways to ensure this is to rely on geological and geothermal studies on regional and subregional scales and its incorporation into spatial planning linking together with further socio-economic and land-use characteristics. For decision making, sharp and clean outcomes, such as geothermal favourability maps, are the most useful [2,9].
Various forms of geothermal plays exist, and there are several tools and examination possibilities to study the systems [10], such as logging methods along deep boreholes/wells (e.g., thermal, electrical, self-potential measurements), magnetic and gravity measurements (anomaly detection), seismic methods and even traditional remote sensing and gamma-ray spectrometry. Kanra et al. [11] summarised these methods in their review study and also emphasised that geothermal explorations are similar to CH explorations due to the similarities of the two energy resources. Reflective seismics is the primary geophysical method for understanding deep geological structures, studying the propagation, reflection and return of mechanical waves generated on the surface [2], which is in a way similar to remote sensing.
The identification of sand bodies suitable for water production is based on the interpretation of reflection seismic data and deep borehole data [12,13,14,15]. Reservoir structure, e.g., boundaries of sand bodies, can be tracked horizontally on 2D seismic sections resulting in the frame of 3D models. The 3D model allows us to determine the spatial distribution of the (hydro-geothermal) energy stored in the water, i.e., the energy density, and, with the help of a database supplemented with other features, to delineate areas of different potentials. Seismic surveys are useful not only for determining the major geometry of reservoirs but also for inferring finer internal reservoir structures that cannot be determined solely from borehole data.
In Hungary, Upper Pannonian porous reservoirs are among the most important geothermal energy sources [16,17,18,19]. This unconsolidated sediment series is relatively homogeneous with a significant sand content and relatively high porosity. The depth of these sediments makes possible the exploitation of water with a temperature of at least 30 °C which is the lower limit of thermal water definition in Hungary.
Many recent studies have focused on the geothermal conditions of the Pannonian region including the geological and hydrological conditions, temperature distribution and determining the size of the reserved heat. Apart from research focusing on the entire or almost entire Pannonian area [20,21,22,23,24], the role of research focusing on the Great Hungarian Plain is also significant, the data density of which becomes scarce or almost zero north of the Derecske Trough where the thickness of the layers is significantly smaller than that of the layers in the southern part of the Great Hungarian Plain [12,25,26,27]. Regional and local research has traditionally been more significant in the vicinity of hydrocarbon occurrences and in the south-eastern Great Hungarian Plain, characterised by higher yield and wellhead temperatures [4,28,29,30], and recently in the southern and Transdanubian parts as a result of cross-border cooperation [31,32,33,34,35].
There are also significant thermal water utilisation centres north of the Derecske Trough [7,36]. This less-studied marginal area has a more diverse development in the sandy Upper Pannonian formation, which has an impact on the exploitability due to reservoir geometry and is thus worth examining. Negative impacts on productivity are well-known in the vicinity of bathing areas and other large-scale users in most parts of Hungary including this north-eastern area [4,7,37]. However, those negative impacts could be mitigated and avoided by applying the results of complex studies and spatial planning for a more sustainable geothermal energy resource management based on detailed geological and hydrogeological models. Therefore, we consider reservoir descriptions based on the widest possible seismic and deep borehole geophysical measurements necessary [38,39,40,41].
The aim of the study was to map the pattern of the geological structure of the geothermal reservoirs and define geothermal subregions with different characteristics and analyse potential geothermal energy utilisation profiles in perspective of land use in a certain study area.

2. Materials and Methods

2.1. Geological Background

In general, fairly good geothermal reservoirs can be found in Miocene to Quaternary basin fill sediments and in Mesozoic karstified carbonates, which can be explained on the basis of the geodynamic evolution of the Pannonian Basin [18]. Studying the regional details, however, reveals differences in exploiting the above reservoirs. Fodor [42] identified twelve deformation phases from the Jurassic until the Pliocene with at least two rotation phases. According to stress field analyses, NE-SW, N-S and NW-SE compression alternated with N-S and NW-SE extension with extrusion towards E and NE. As a result, various micro- and macro-tectonic structures were formed. Later stress fields sometimes re-activated the preserved earlier structures while forming their own structural features as well. Due to this complex tectonic history, the size, type and orientation of structural elements (e.g., folds and multiple superposed folds, horizontal and transfer faults, normal and thrust faults, positive and negative flower structures in transpression and transtension zones) can be extremely diverse anywhere in the Pannonian Basin. As a result, it is essential to identify the basic characteristics and roles of the structural elements when geothermal subregions are determined and typified.
Neogene magmatism induced by the structural evolution of the Pannonian Basin produced volcanic and volcanic-sedimentary depositions now found at variable depths in the Tiszántúl region. Repeated volcanic activities during the Miocene resulted in a variable lithology in the region. The presence of volcanic features can be explained by subsequent compressive motions with NNW vergence, forming volcanic depressions [43,44]. There are certain areas where these Tertiary volcanites form the bedrock of the Pannonian sediments (Figure 1); however, in most cases, pre-Neogene crystalline rocks are the bedrock features.
In distal, deep parts of the basin of Lake Pannon, fine sediments were accumulated which are basal marls in significant amount and are considered to be the opening features of the variable Lower Pannonian sedimentary series [14,20]. It is followed by features deposited on the seafloor, which are turbidites generated mostly owing to slope movements and have a cyclically fining-upward characteristic, vertically upwards and towards the shore margins. This characteristic is visible on the geophysicial well logs, i.e., self-potential and resistivity logs, showing several fining-upward patterns.
The delta-related sedimentary series of the Lower Pannonian sediments deposited in a deltaic slope palaeoenvironment are typically fine-grained with sigmoidal boundaries and may include lenticular sand bodies. Lower Pannonian clayey assemblages have a high self-potential and low resistivity, which are locally modified by sand lenses in the opposite direction.
The term Upper Pannonian refers to a sedimentary unit characterised by delta front and delta plain facies, accumulated in Lake Pannon (Figure 1). As a result of relative water level changes, several delta front and delta plain facies units can be seen within a vertical column; however, erosion modified them in some places. Slight differences in the age of these facies can be seen throughout the basin: delta units become younger from the marginal areas towards the basin centre corresponding to the stages of infilling [14,20].
Relative vertical movements, such as subsidence and uplift, played a decisive role in the development of a highly complex Pannonian sedimentation. According to the comprehensive basin analysis of [29], Late Pannonian geological evolution was controlled by a complex system of climatic factors and intrabasinal tectonic movements with the dominance of tectonic movements and climatic factors in the development of the greater sedimentary units (3rd-order sequences) and the smaller units (4th-order sequences), respectively. According to [29], the absence of convincing analogies hinders the correlation of water level changes within the basin with the global sea-level changes during the Pannonian stage.
Considering the Late Pannonian geological development of the basin, the pre-sedimentary state and the syn- and post-sedimentary development are mostly treated separately. Syn-sedimentary development is characterised by variable palaeoenvironments and relative water level changes and influenced by local morphology and climate. In contrast, post-sedimentary development is dominated by tectonic movements, compaction and subsidence. The above post-sedimentary factors may also influence syn-sedimentary development. The rate of crustal heating processes and the rate of subsidence should be considered as well, as lower geothermal gradient values are typical in areas with fast and long-term subsidence.
The 83 km × 103 km study area is a Quaternary plain in NE Hungary, in the Pannonian Basin (Figure 2). Belts of crystalline rocks, Mesozoic carbonates and siliciclastic rocks and flysch compose the pre-Neogene basement of the basin, the depth of which varies between 1000 m and 5500 m [45,46]. The structurally complex (with major faults, imbricated zones, nappe boundaries) basement units are partially covered by Neogene volcanic rocks, the depth of which varies between 500 m and 3000 m [43,44]. The average thickness of the overlying Pannonian sediments varies between 500 m and 2500 m [47]. The covering Quaternary sediments have a thickness of 200–400 m.
The marginal position of the study area and the cyclic character of the relative water level changes in the Pannonian development caused the order of the Pannonian formations to be somewhat different from what would be expected based on the general concept. For example, delta slope and delta front sediments, known as Lower and Upper Pannonian sediments, respectively, occur repeatedly in a vertical profile because they are interfingered. Elsewhere, delta front and delta plain sediments are pinching out; however, this influences geothermal potential and utilisation only moderately. Consequently, the subregion-scale division presented in this paper could be more useful for potential thermal water users than a facies-based one.

2.2. Data Management and Analysis

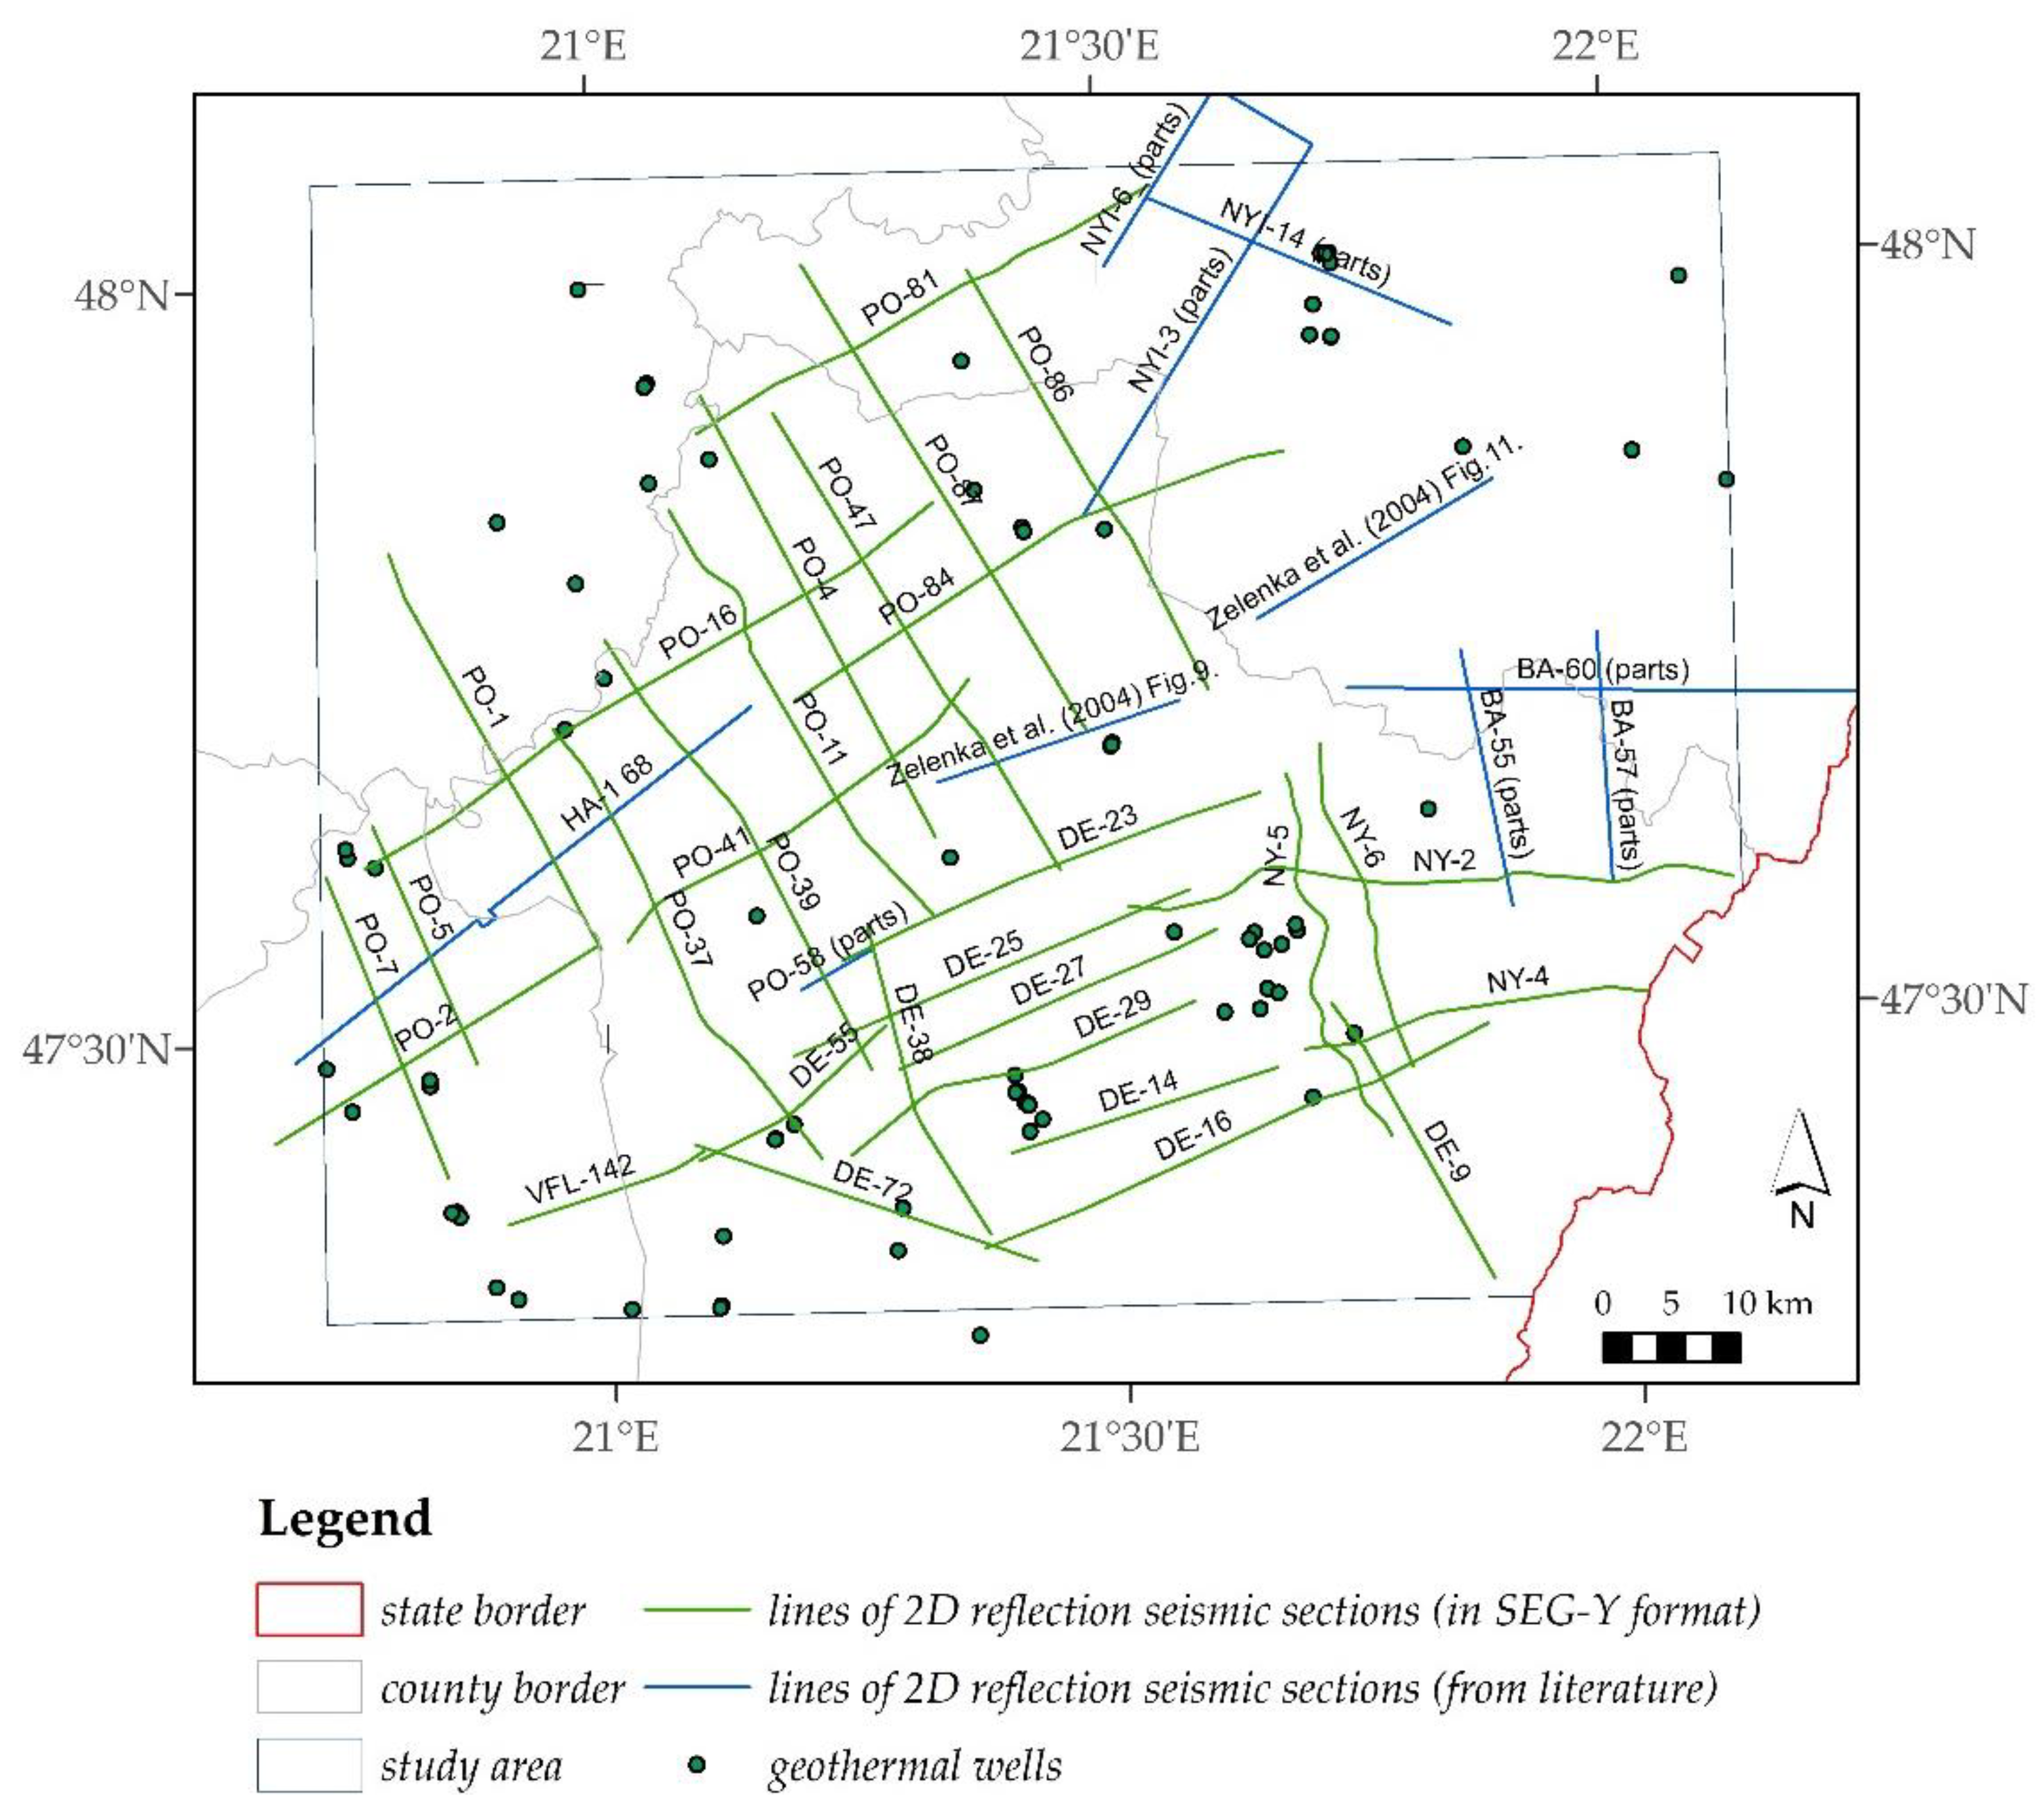
The delineation of geothermal conditions was based on 39 seismic reflection sections and 137 thermal water well data (Figure 3). The vast majority of the sections were obtained from the State Geological, Geophysical and Mining Data Store in SEGY format. These were completed with non-digital sections found in the literature or used in our earlier research. From the large number of sections available [48], 30 seismic sections were selected which are parallel with and perpendicular to the main structural directions typical for Hungary.
The 2D reflection seismic sections had a depth of 5000 ms on two-way time (TWT) scale, the vertical reference level was at 50 m above sea level, and time–depth conversion was calculated based on VSP measurement of Monostorpályi D1 located on the south-east corner of the study area.
OpendTect, an open-source software, is used for interpreting and visualizing seismic data, seismic attribute extraction, seismic picture conversion and seismic image visualization and interpretation because of its complete characteristics [49,50].
To understand the structure and evolutionary history of the area, the isochronous surfaces and seismic stratigraphic units were determined [26,29,39,51,52]. In addition to these, interpretation was carried out to define tectonic elements and the presence of volcanic units. The location of the bedrock boundary of the Upper Pannonian sediments was investigated providing the reservoir geometry and identifying whether tectonic or volcanic elements have an influence on them. In zones where seismic reflections are interrupted, tectonic anomalies, e.g., normal fault, reverse fault, flower structure or others, are mapped. Moreover, the types of the various sedimentary units can be mapped based on the seismic patterns, that is, the reflection seismic signs (discordant units, relative positions).
The interpretation of the reflection levels was aided by stratigraphic series extracted from the hydrogeological logs of thermal wells in the area and by deep borehole geophysical curves (Figure 4). Their distribution is mainly aligned to the spatial locations of the thermal spas and is therefore less favourable compared to the spatial distribution of the seismic sections. Since some of the thermal water wells were terminated in the Upper Pannonian reservoir, data from other exploration wells were used to determine the bedrock of the thermal water reservoir more accurately. For both the stratigraphy and the geophysical curves, the purpose of the drilling also limits the level of detail; thus data harmonisation between groups was limited.
In addition to the stratigraphic series, the hydrogeological logs also contain data from the depth temperature measurements. The geothermal gradient can be determined from these data, and the official average geothermal gradient values are also included in the thermal well cadastre [48]. Based on the measured data and previous studies [7,38], the vertical heat transport process in the study area is dominated by thermal conduction, with a linear temperature gradient. Water level and pressure tests for the wells indicate that the area is in a gravity regime, with slight overpressure in the layers due to gas content and compression, which decreases over time during water production.

2.3. GIS Calculations to Delineate Geothermal Subregions and to Provide Land Cover Type Characterisation

Calculations were carried out using a raster calculator, the resolution of which is 500 m × 500 m. The digital elevation model is based on the 1:10,000 Hungarian topographical map. Based on seismic and deep borehole data, the depth map of the upper and lower boundary of Upper Pannonian sediments was composed. The thickness map of the Upper Pannonian sediments was drawn from the difference between the two maps mentioned above. Based on the data of geothermal wells at least 500 m deep [48], the geothermal gradient (GG) map of the study area was prepared. Using the distribution of geothermal gradient values, the map of the depth required to reach the temperature of 30 °C was drawn based on Equation (1). The temperature distribution of the lower and upper boundaries of the Pannonian sediments was determined based on Equation (2):
z = (30 − 10.5)/GG,
T = 10.5 + GG × depth/1000,
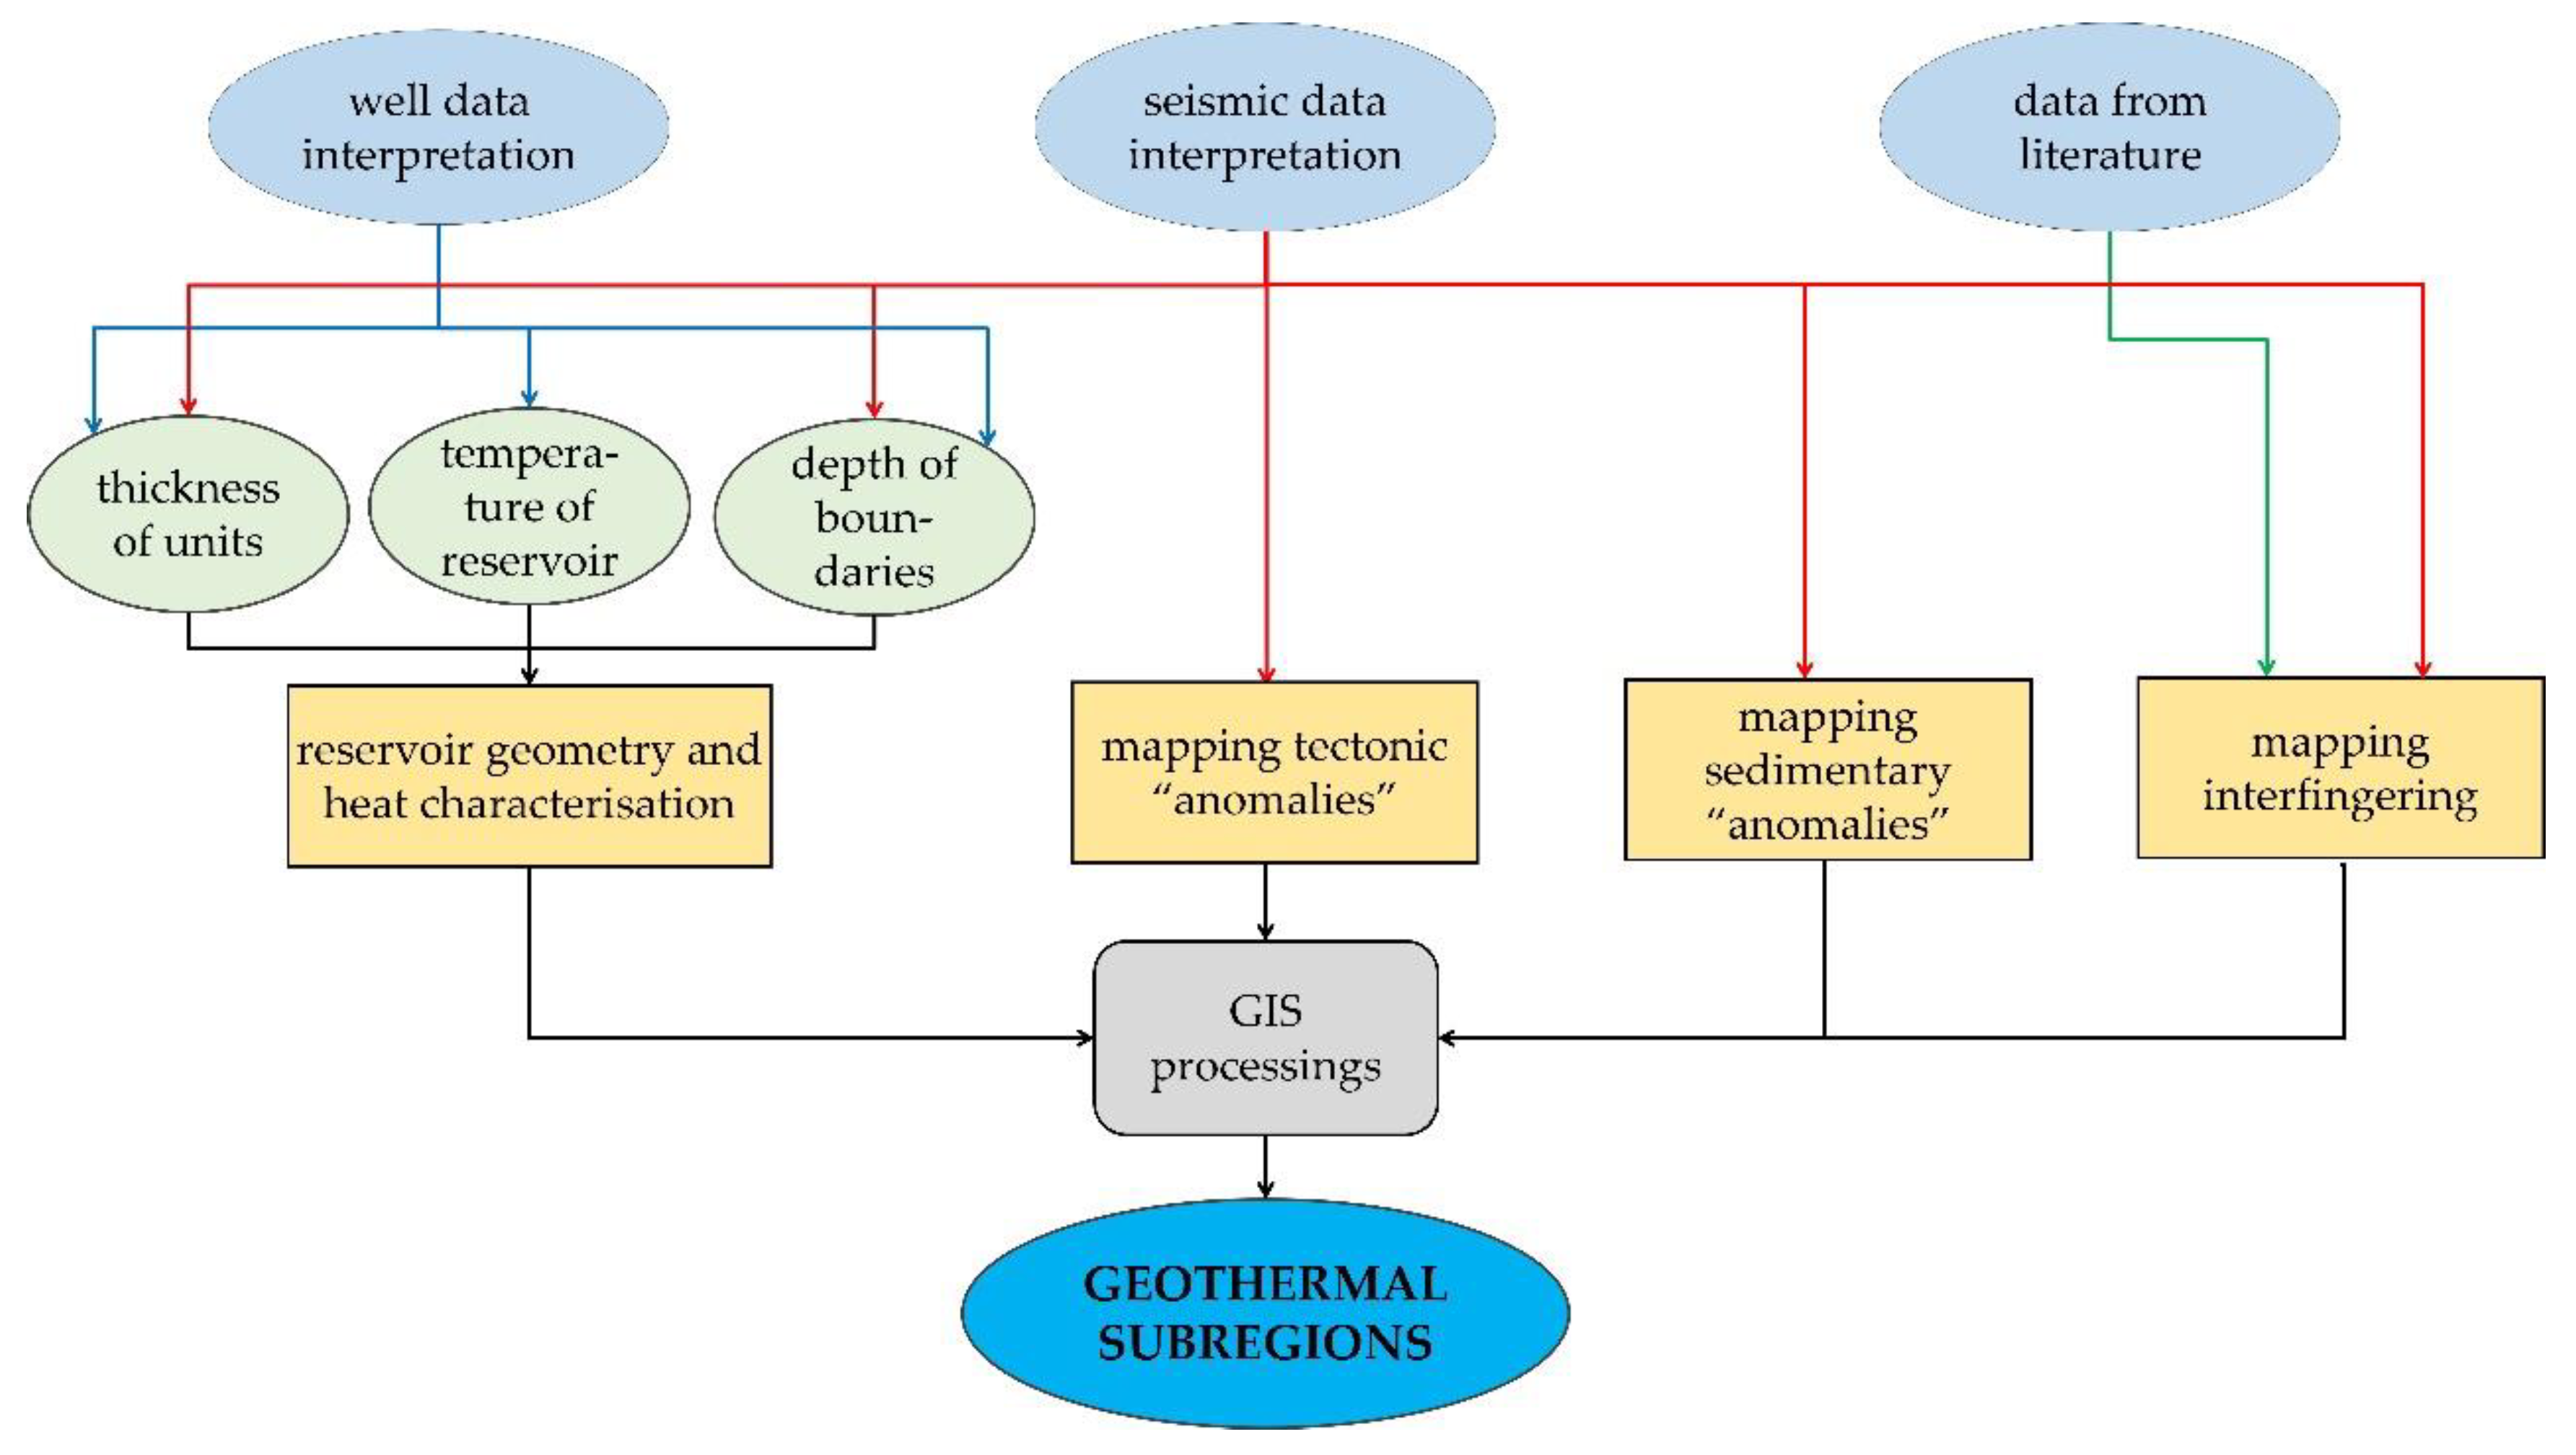
Recognised depositional anomalies and important tectonic and volcanological features are projected on the surface as well. Technically, it meant multiple export and import steps for each thematic feature group from 3D environment of OpendTect to 2D environment of ArcGIS. While seismic interpretation and well log interpretation were carried out in OpendTect, further GIS processing steps were performed in ArcGIS (Figure 5).
Since the available heat utilisation methods depend mainly on the temperature of the extractable water, maximum temperature was taken into account primarily and, secondly, the boundary-forming effects of the elements hindering or modifying the horizontal water supply of reservoirs appearing in the seismic image in the course of defining geothermal subregions.
Land use was analysed in the defined subregions based on the Corine land cover (CLC) database for the year 2018. This classification based on remote sensing gives uniform and thematically comprehensive data on land cover and trends throughout Europe [53]. The dataset has a role in protecting ecosystems, halting biological diversity loss, tracking climate change impacts, monitoring urban land take, assessing agricultural developments and dealing with water resources directives. In the present study, CLC2018 map [54] was used to determine land cover type structure of the geothermal subregion areas by clipping one with the other. With the percentage of the different classes, the character of the subregion could be described.
Besides land use, the possibilities of geothermal energy utilisation were reviewed using the Lindal diagram (Figure 6), in which the utilisation methods are assigned to temperature ranges [55,56]. The most important ways of utilising thermal water in the expected temperature range are balneotherapy (20–50 °C), agricultural heating (20–80 °C), heating and water heating (40–120 °C), industrial (drying) processes (60–150 °C) and binary power plant (>90 °C).

3. Results

3.1. Interpretation of Seismic Sections

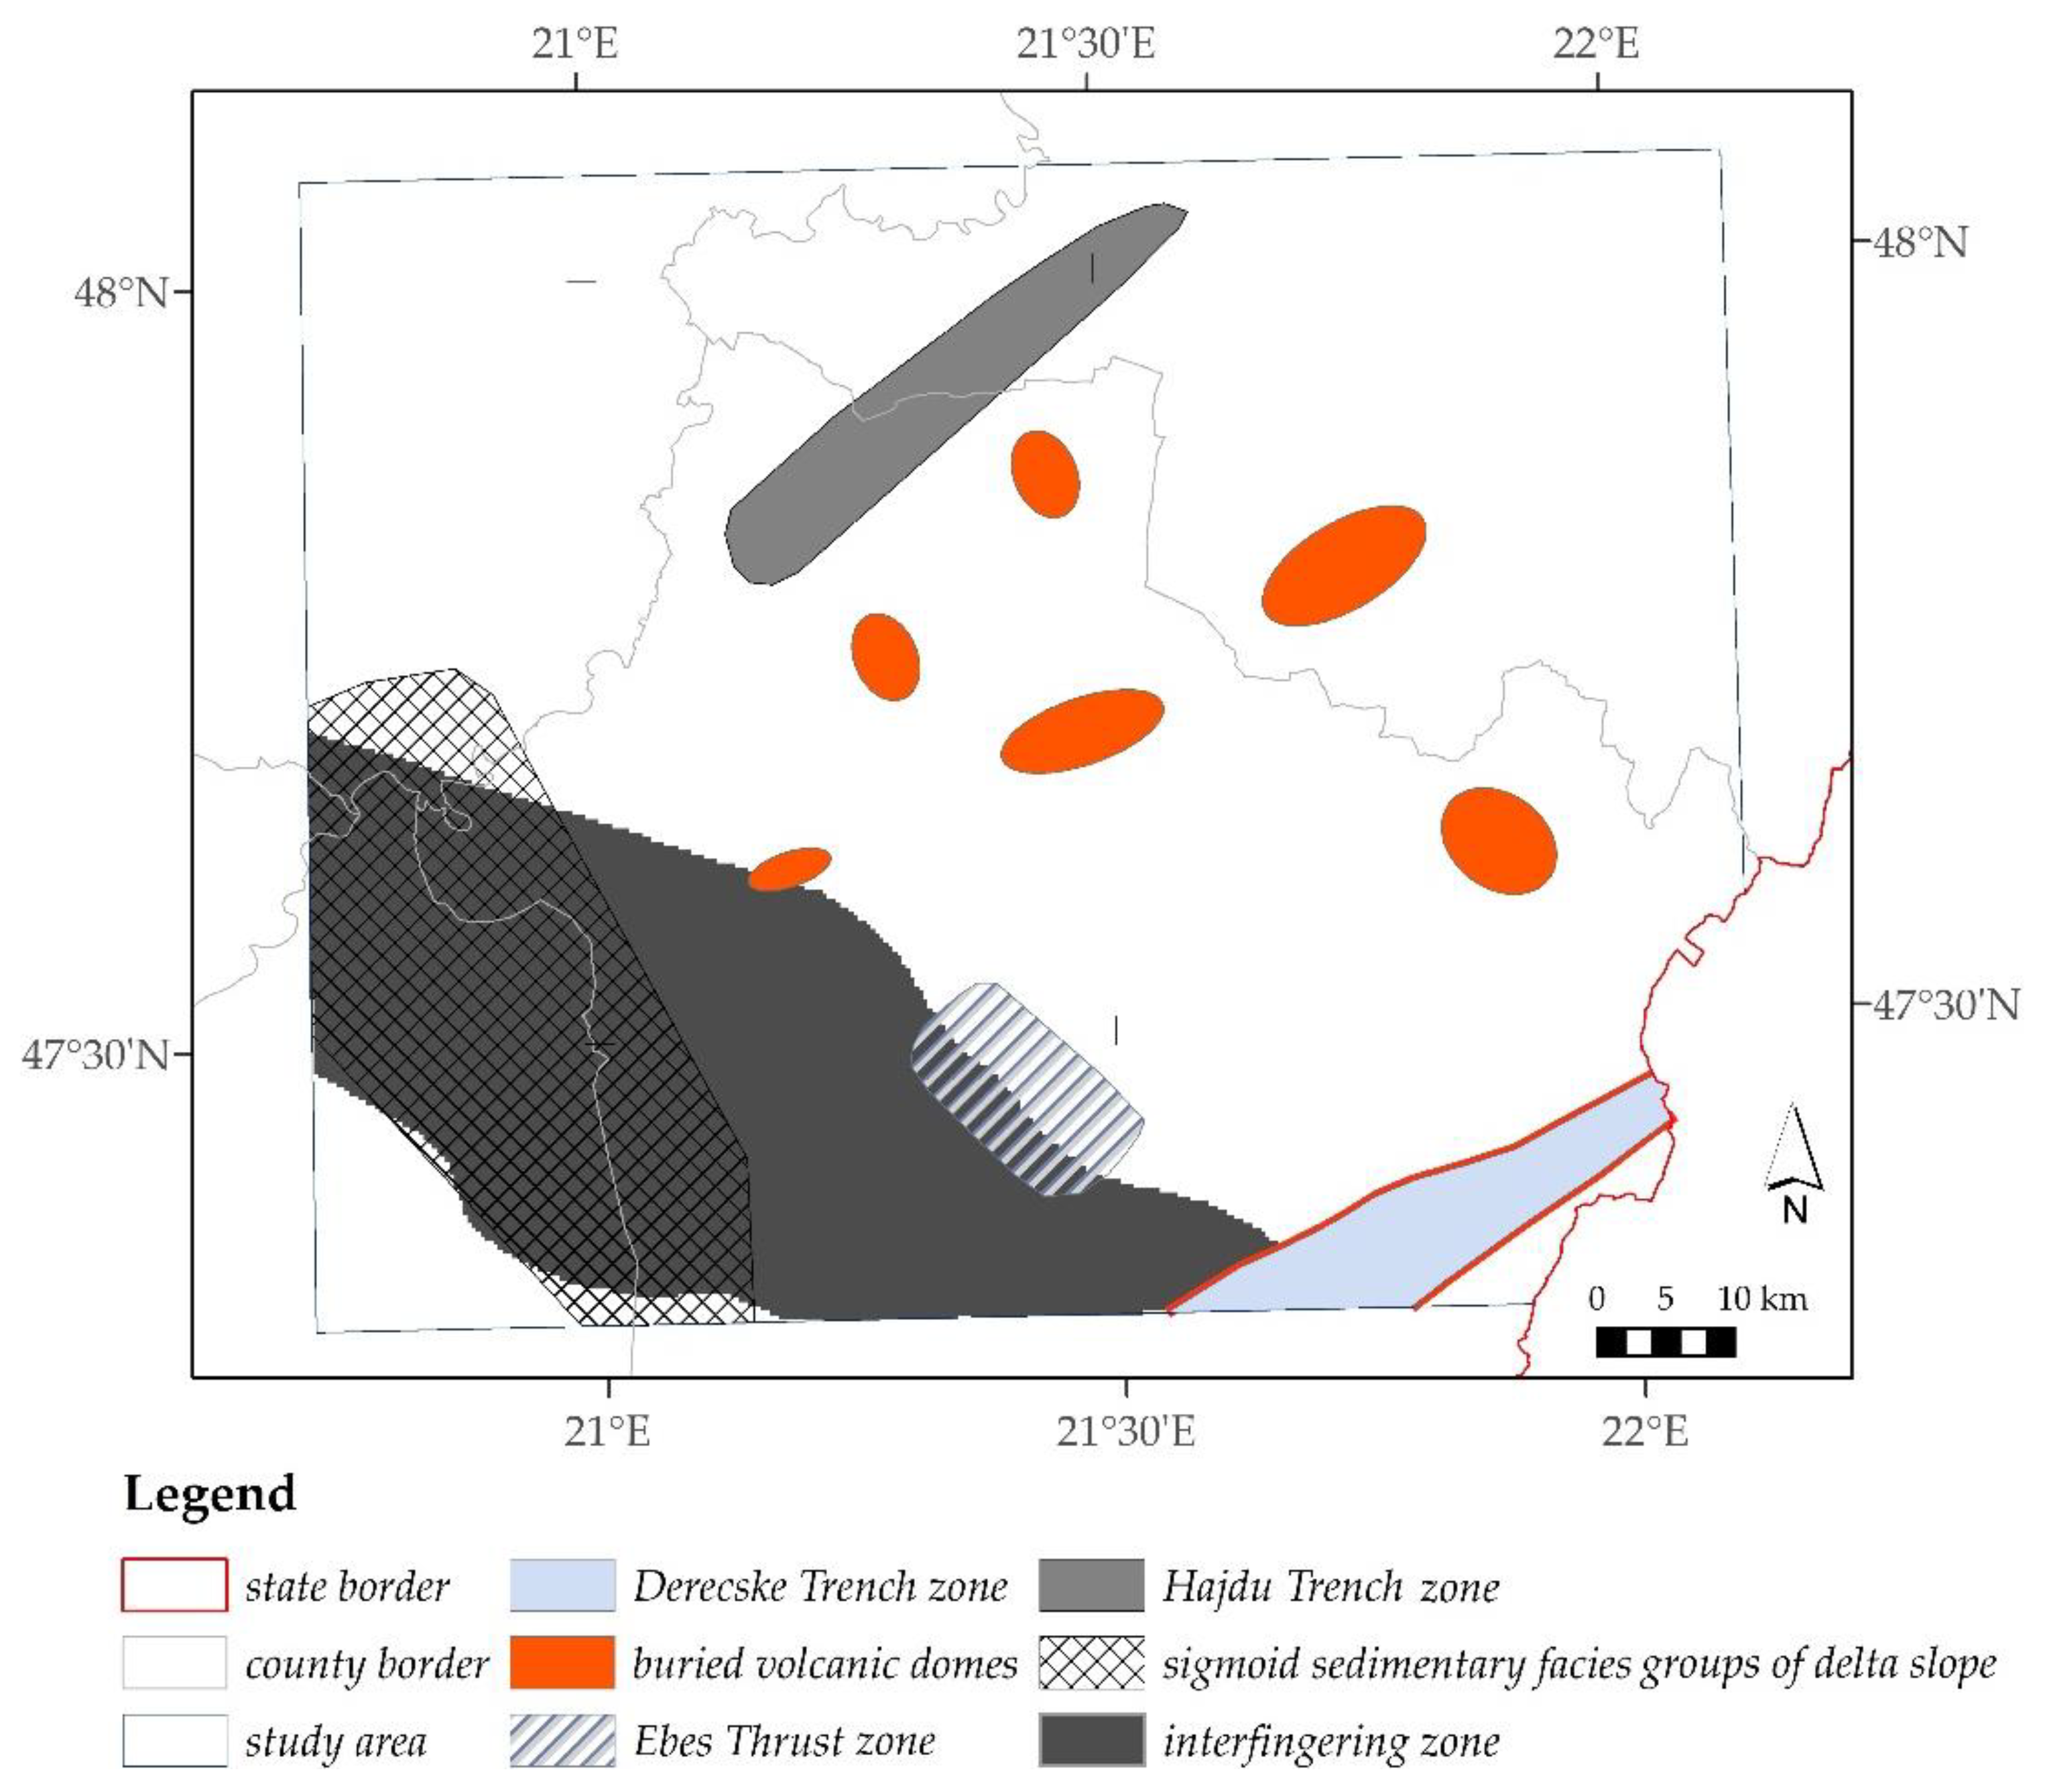
Sedimentary and tectonic elements, which can be considered anomalies from the aspect of geothermal reservoir modelling, were mapped in the reflection images. These are sub-marine canyon systems on the top of Lower Pannonian, prograding delta slope units with the typical sigmoidal pattern, buried Neogene volcanic bodies, normal and reverse faults and flower structures (Figure 7).
These may be significant local factors since they are very different from continuous horizontal units of the Pannonian sedimentary rocks parallel to each other. The size of canyon system units reaches 500 m in thickness and 4 km horizontally in the study area. The size of delta slope sigmoidal units may vary in a wide range but can exceed 800 m vertically and 8 km horizontally.
For the entire study area, the locations of all here-identified tectonic and sedimentary anomalies and the interfingering zone mapped by [14] are summarised on a map (Figure 8). The map also contains the location of the Ebes Thrust, Hajdu Trench and Derecske Trough zones.

3.2. Interpretation of Temperature and Depth Maps

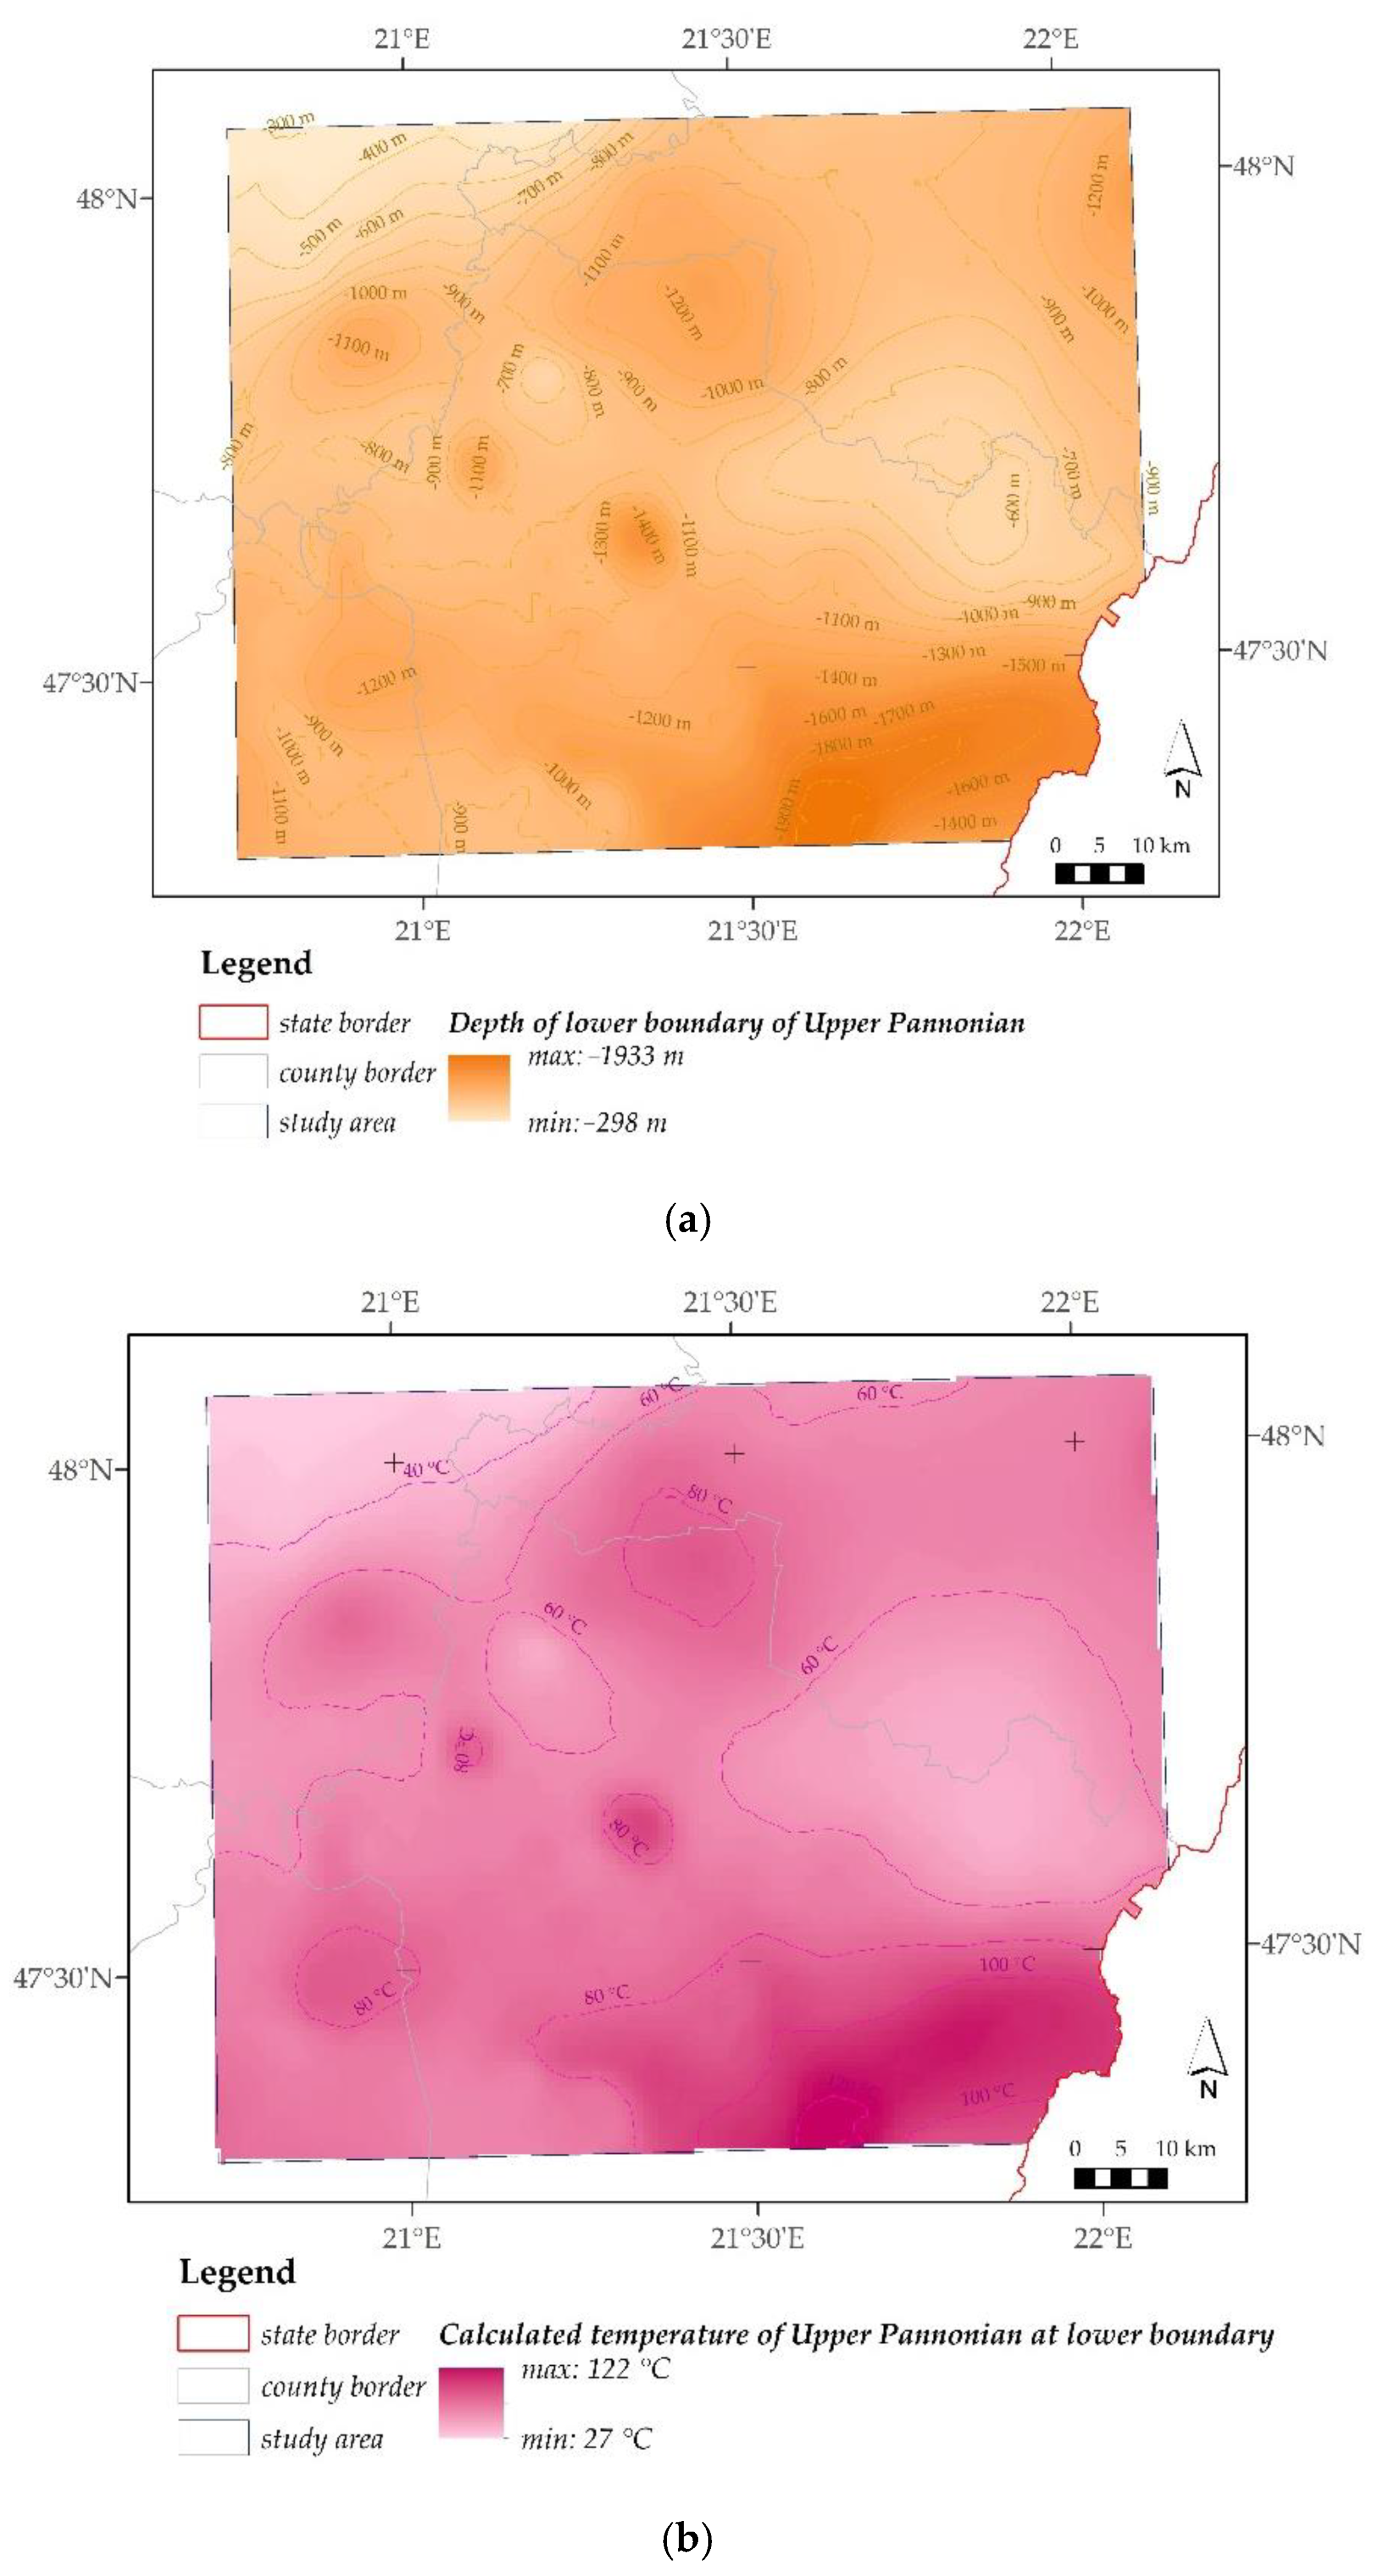
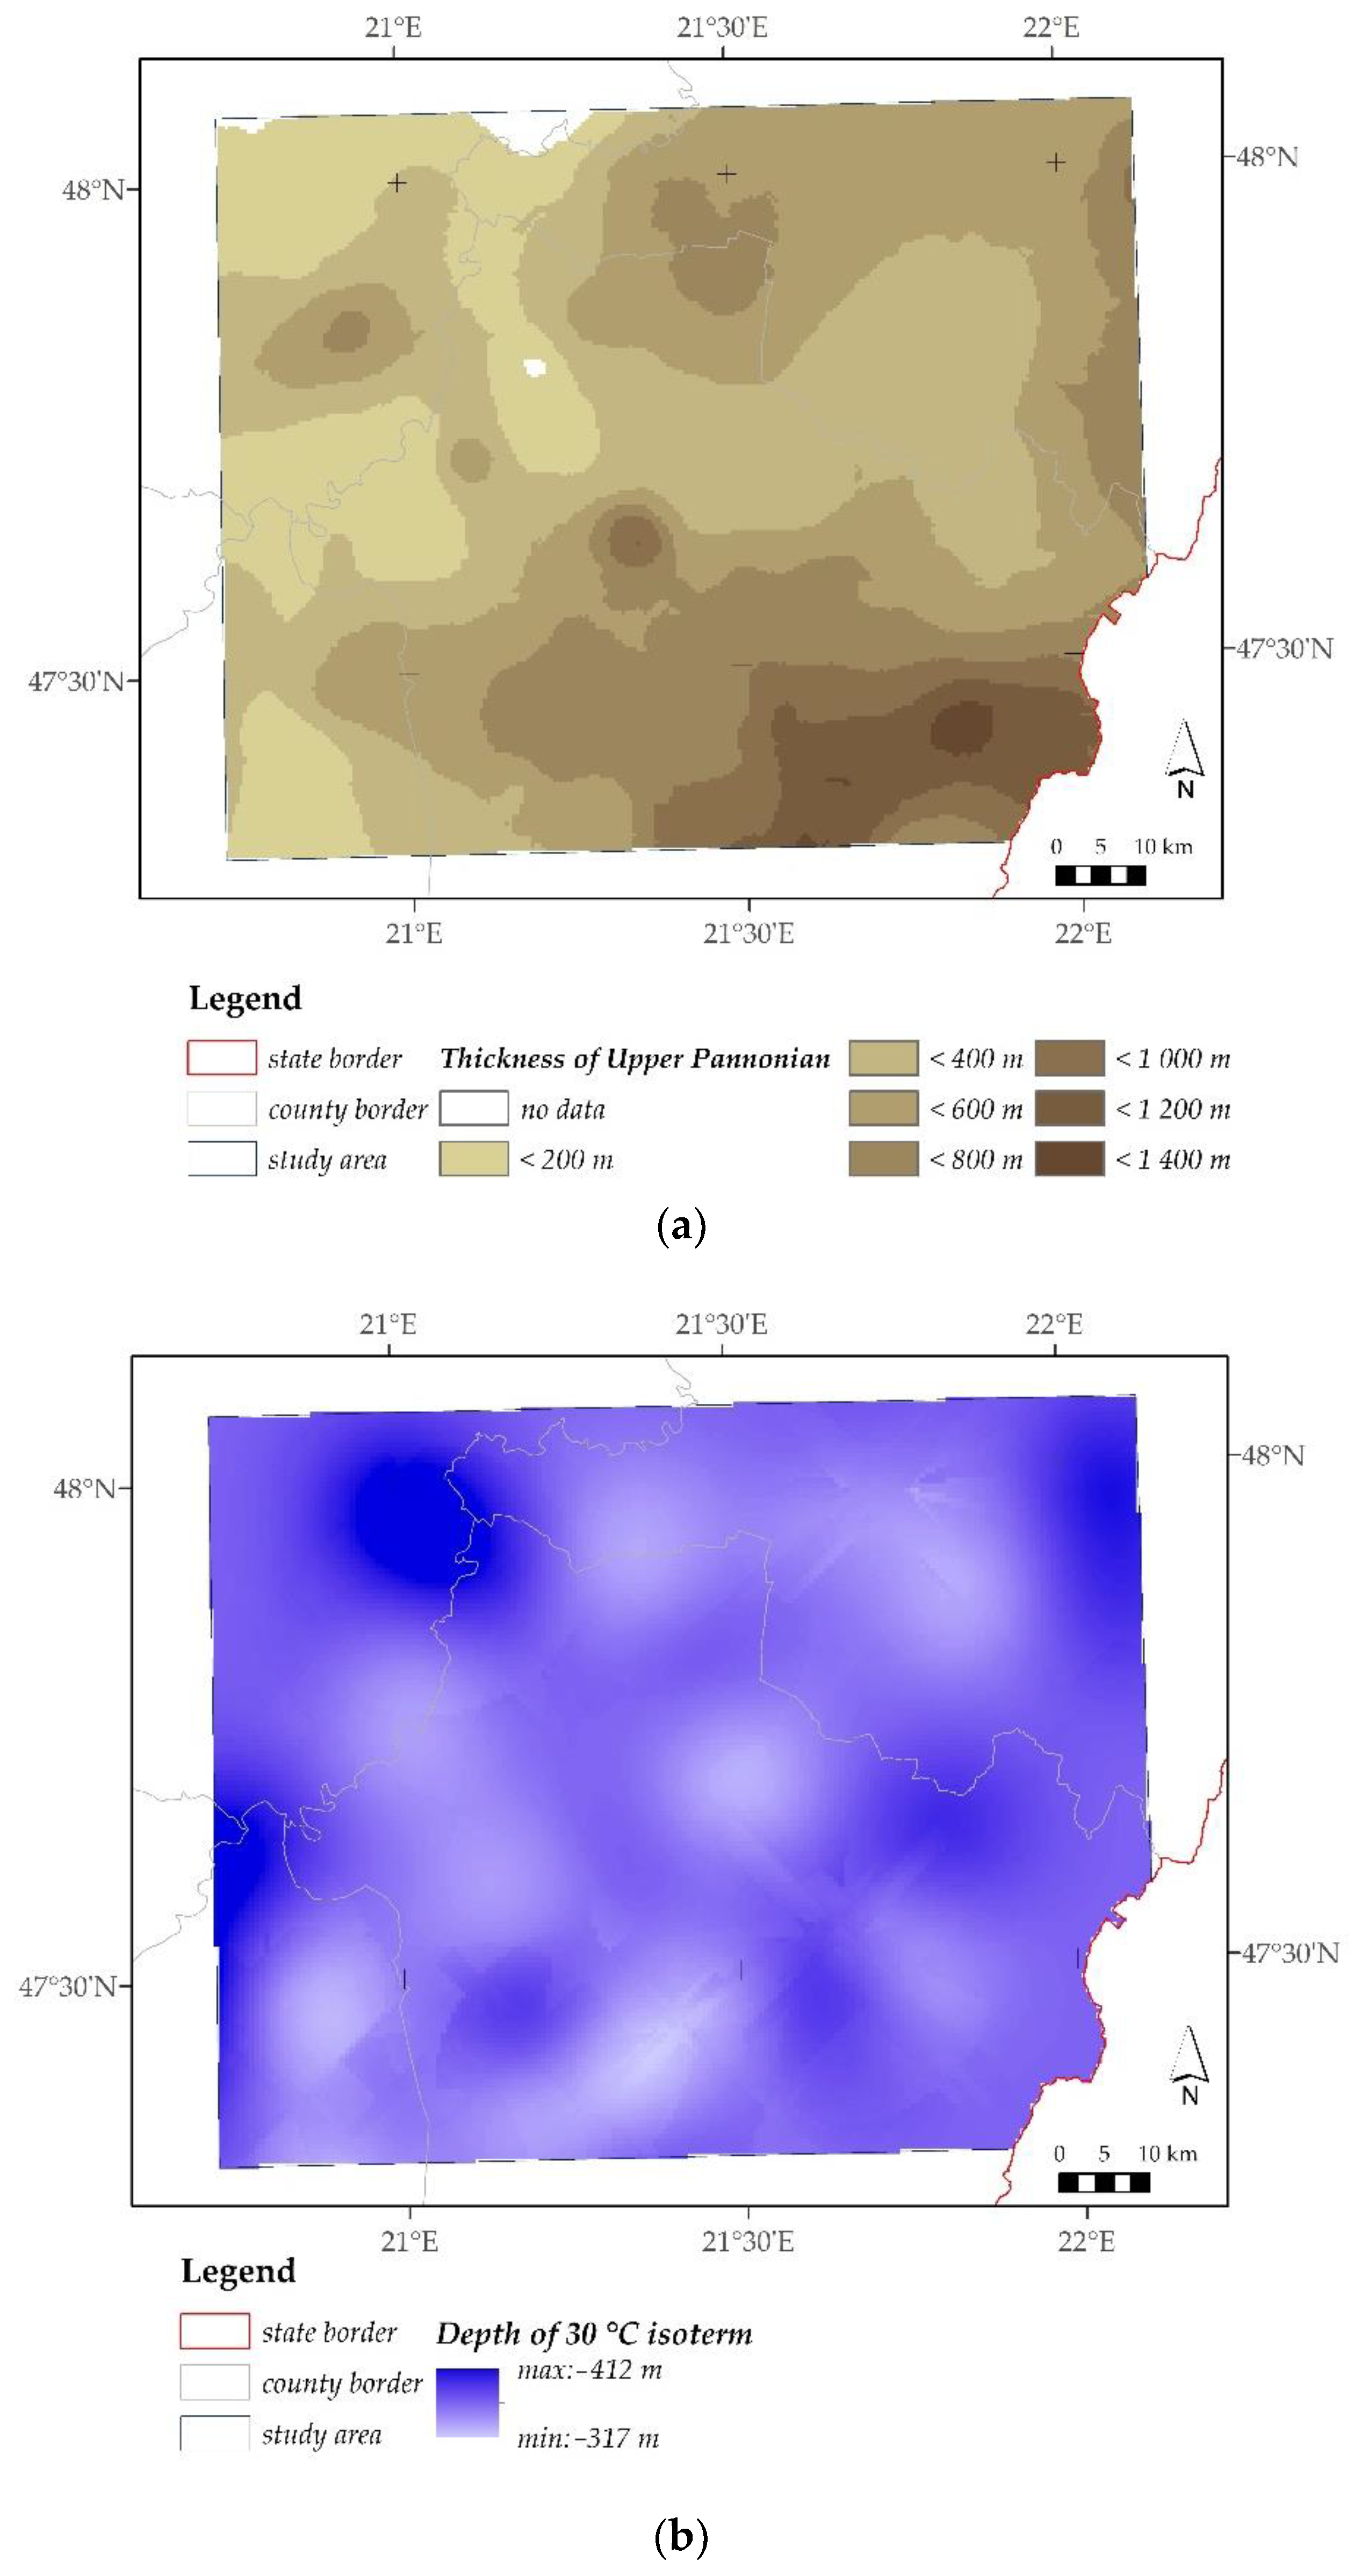
The upper boundary of the Upper Pannonian sediments as primary reservoirs can be found between −203 m and −1103 m in the study area (Figure 9). This variation is the result mainly of the pattern caused by post-sedimentation processes. The boundary is found deeper in areas with significant subsidence indicated by the former and current course of river Tisza, while in the eastern part of the study area, the boundary is found at a smaller depth. The position of the lower boundary of the Upper Pannonian sediments depends on the syn-sedimentary morphology and tectonics in addition to post-tectonic movements (Figure 10). The maximum depth of this lower boundary is −298 m in the central zones, and the minimum depth is found in the southern zones at −1950 m. The pattern of the lower boundary is more variable than that of the upper boundary, with the occurrence of small depressions as well. The thickness of the Upper Pannonian sediments is between 0 to 1400 m (Figure 11). The smallest values occur in the western part of the area, while the highest values occur in the Derecske Trough.
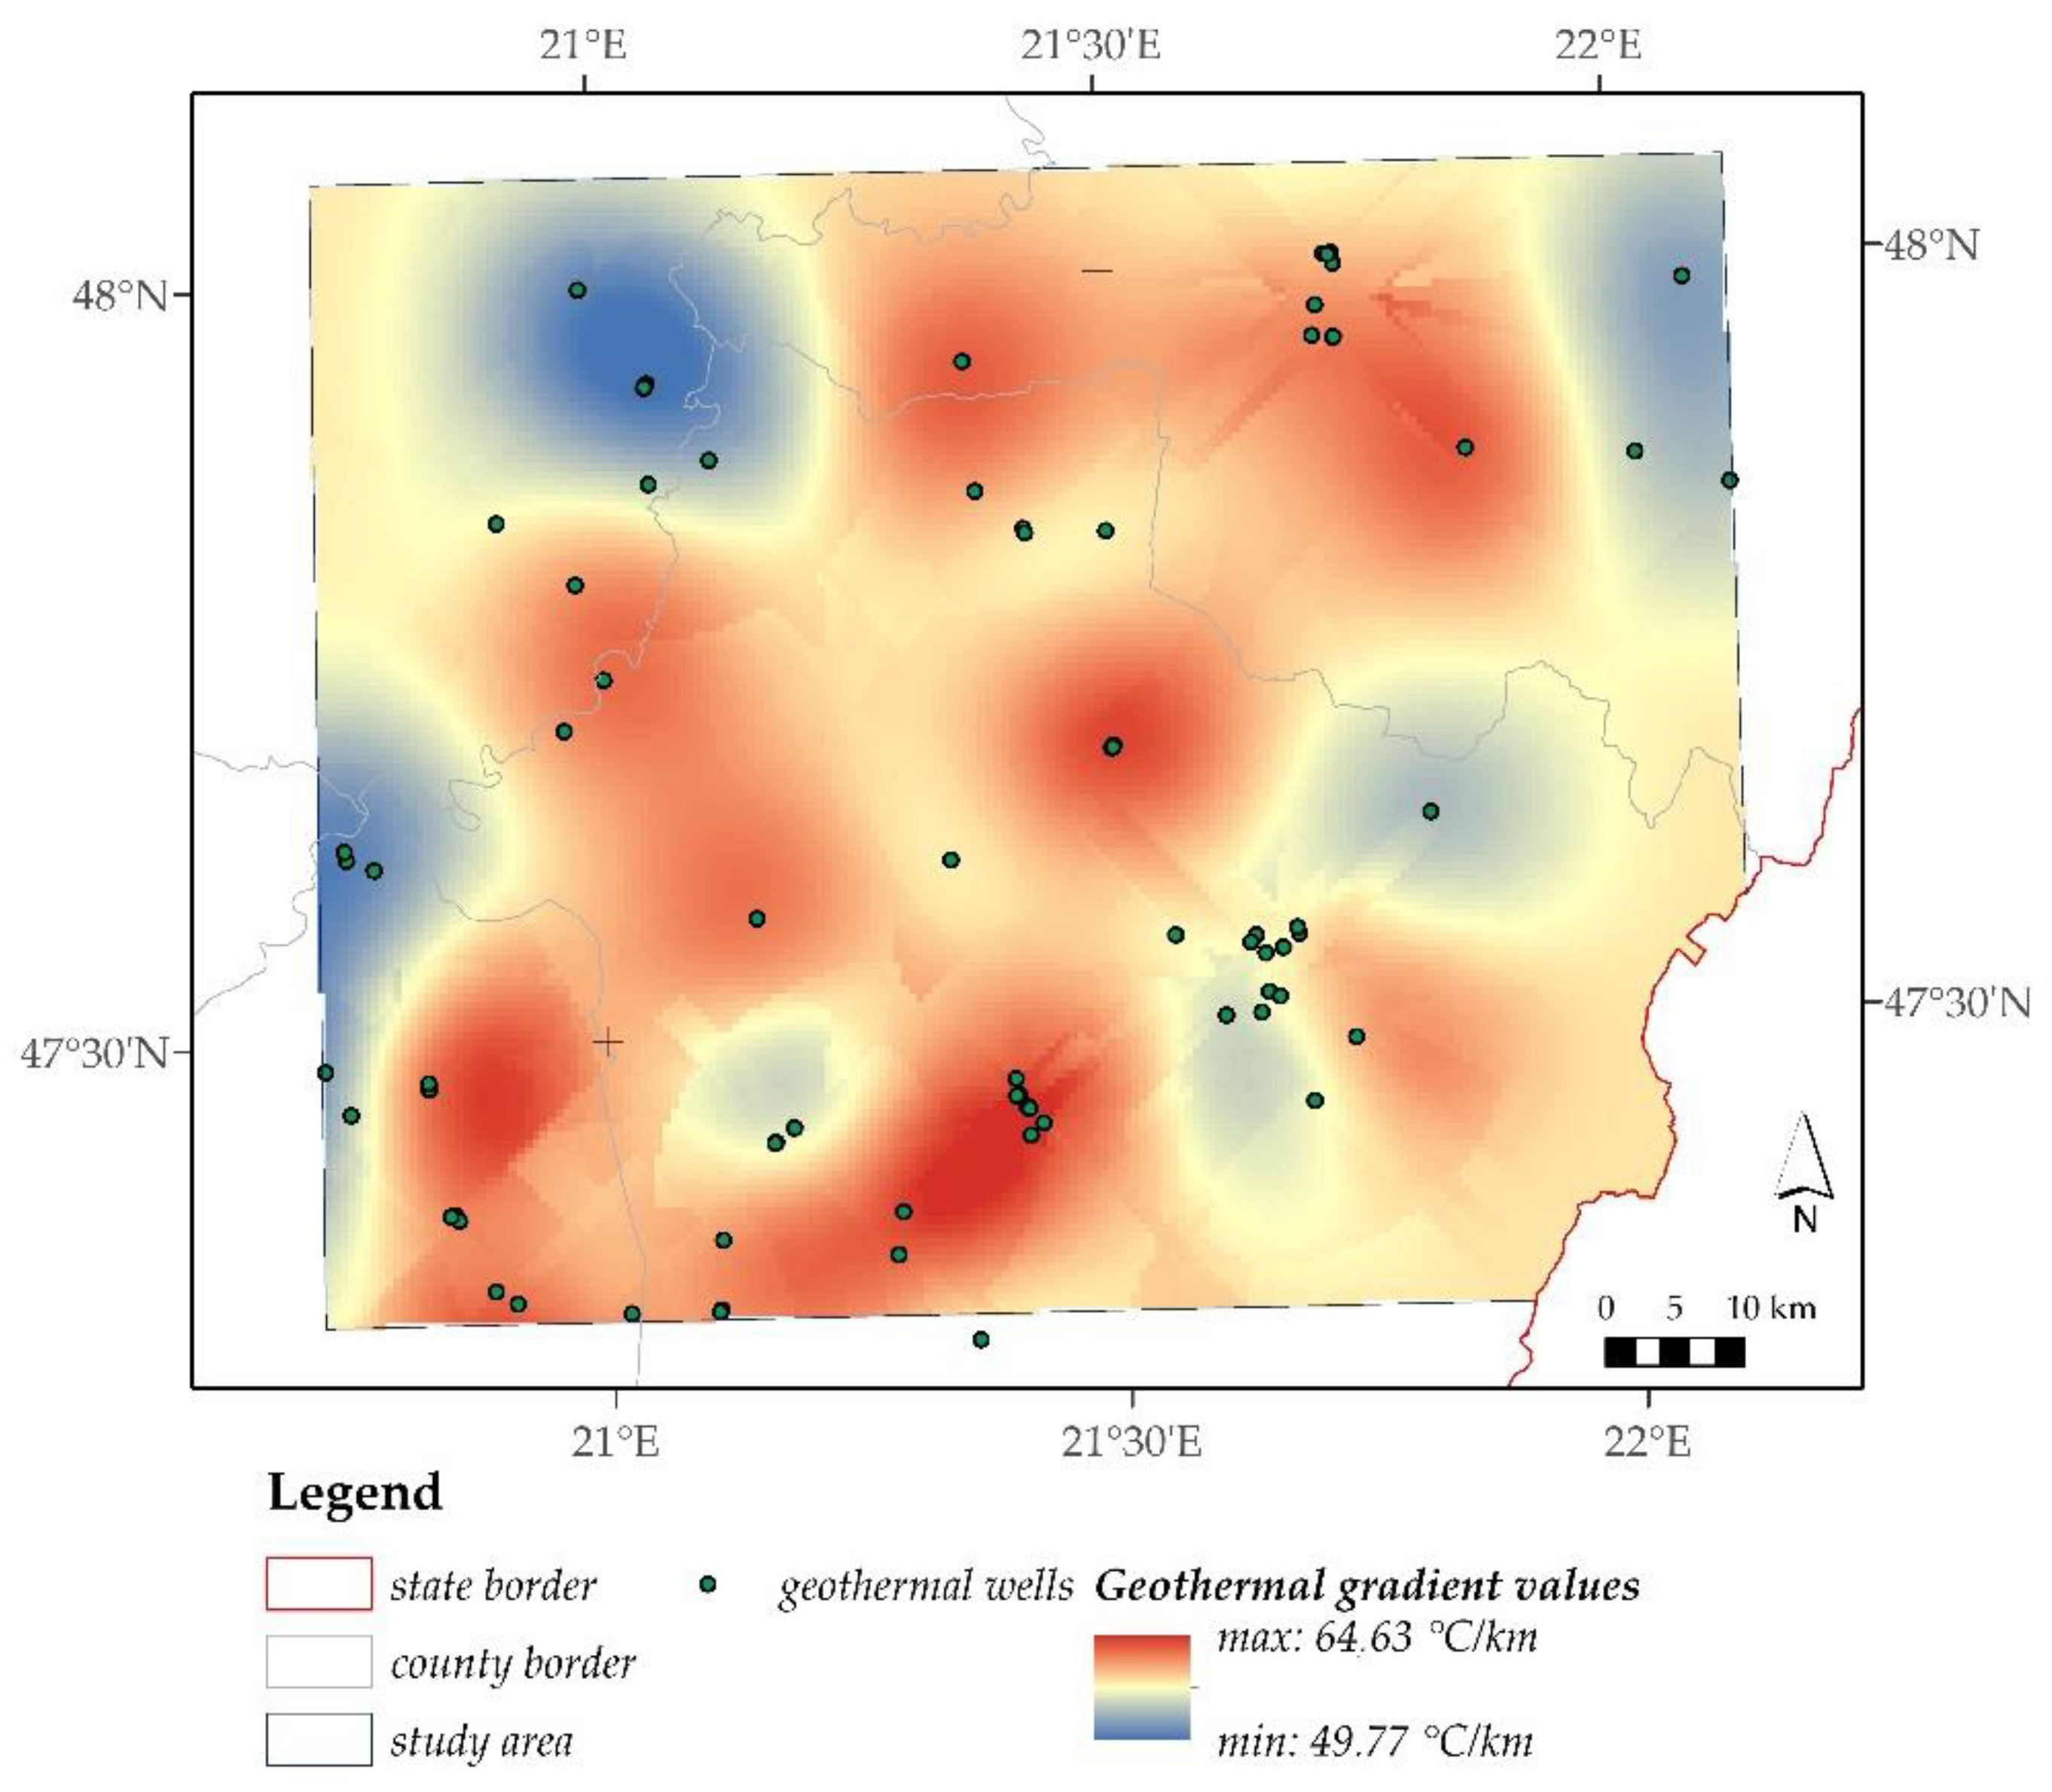
Geothermal gradient ranges between 49.77 °C/km and 64.63 °C/km (Figure 12). Higher values are found in the central part of the study area, while the lowest values appear along the Tisza, where the rate of subsidence has been significant even in recent times resulting in a cooling effect. The minimum temperature calculated for the upper boundary of the Upper Pannonian sediments is 22 °C in the central part of the study area, i.e., it does not exceed 30 °C, which defines thermal water. In contrast, the maximum values occur along the Derecske Trough and the Tisza. In these areas, therefore, thermal waters can be obtained not only from the Upper Pannonian reservoir but also from the sand bodies of the fluvial sediments above it. The temperature of the lower boundary of the Upper Pannonian sediments is found between 30 °C and 122 °C, with minimum values in the eastern part of the study area and maximum values in the southern part, in the Derecske Trough.

3.3. Geothermal Subregions of the Study Area

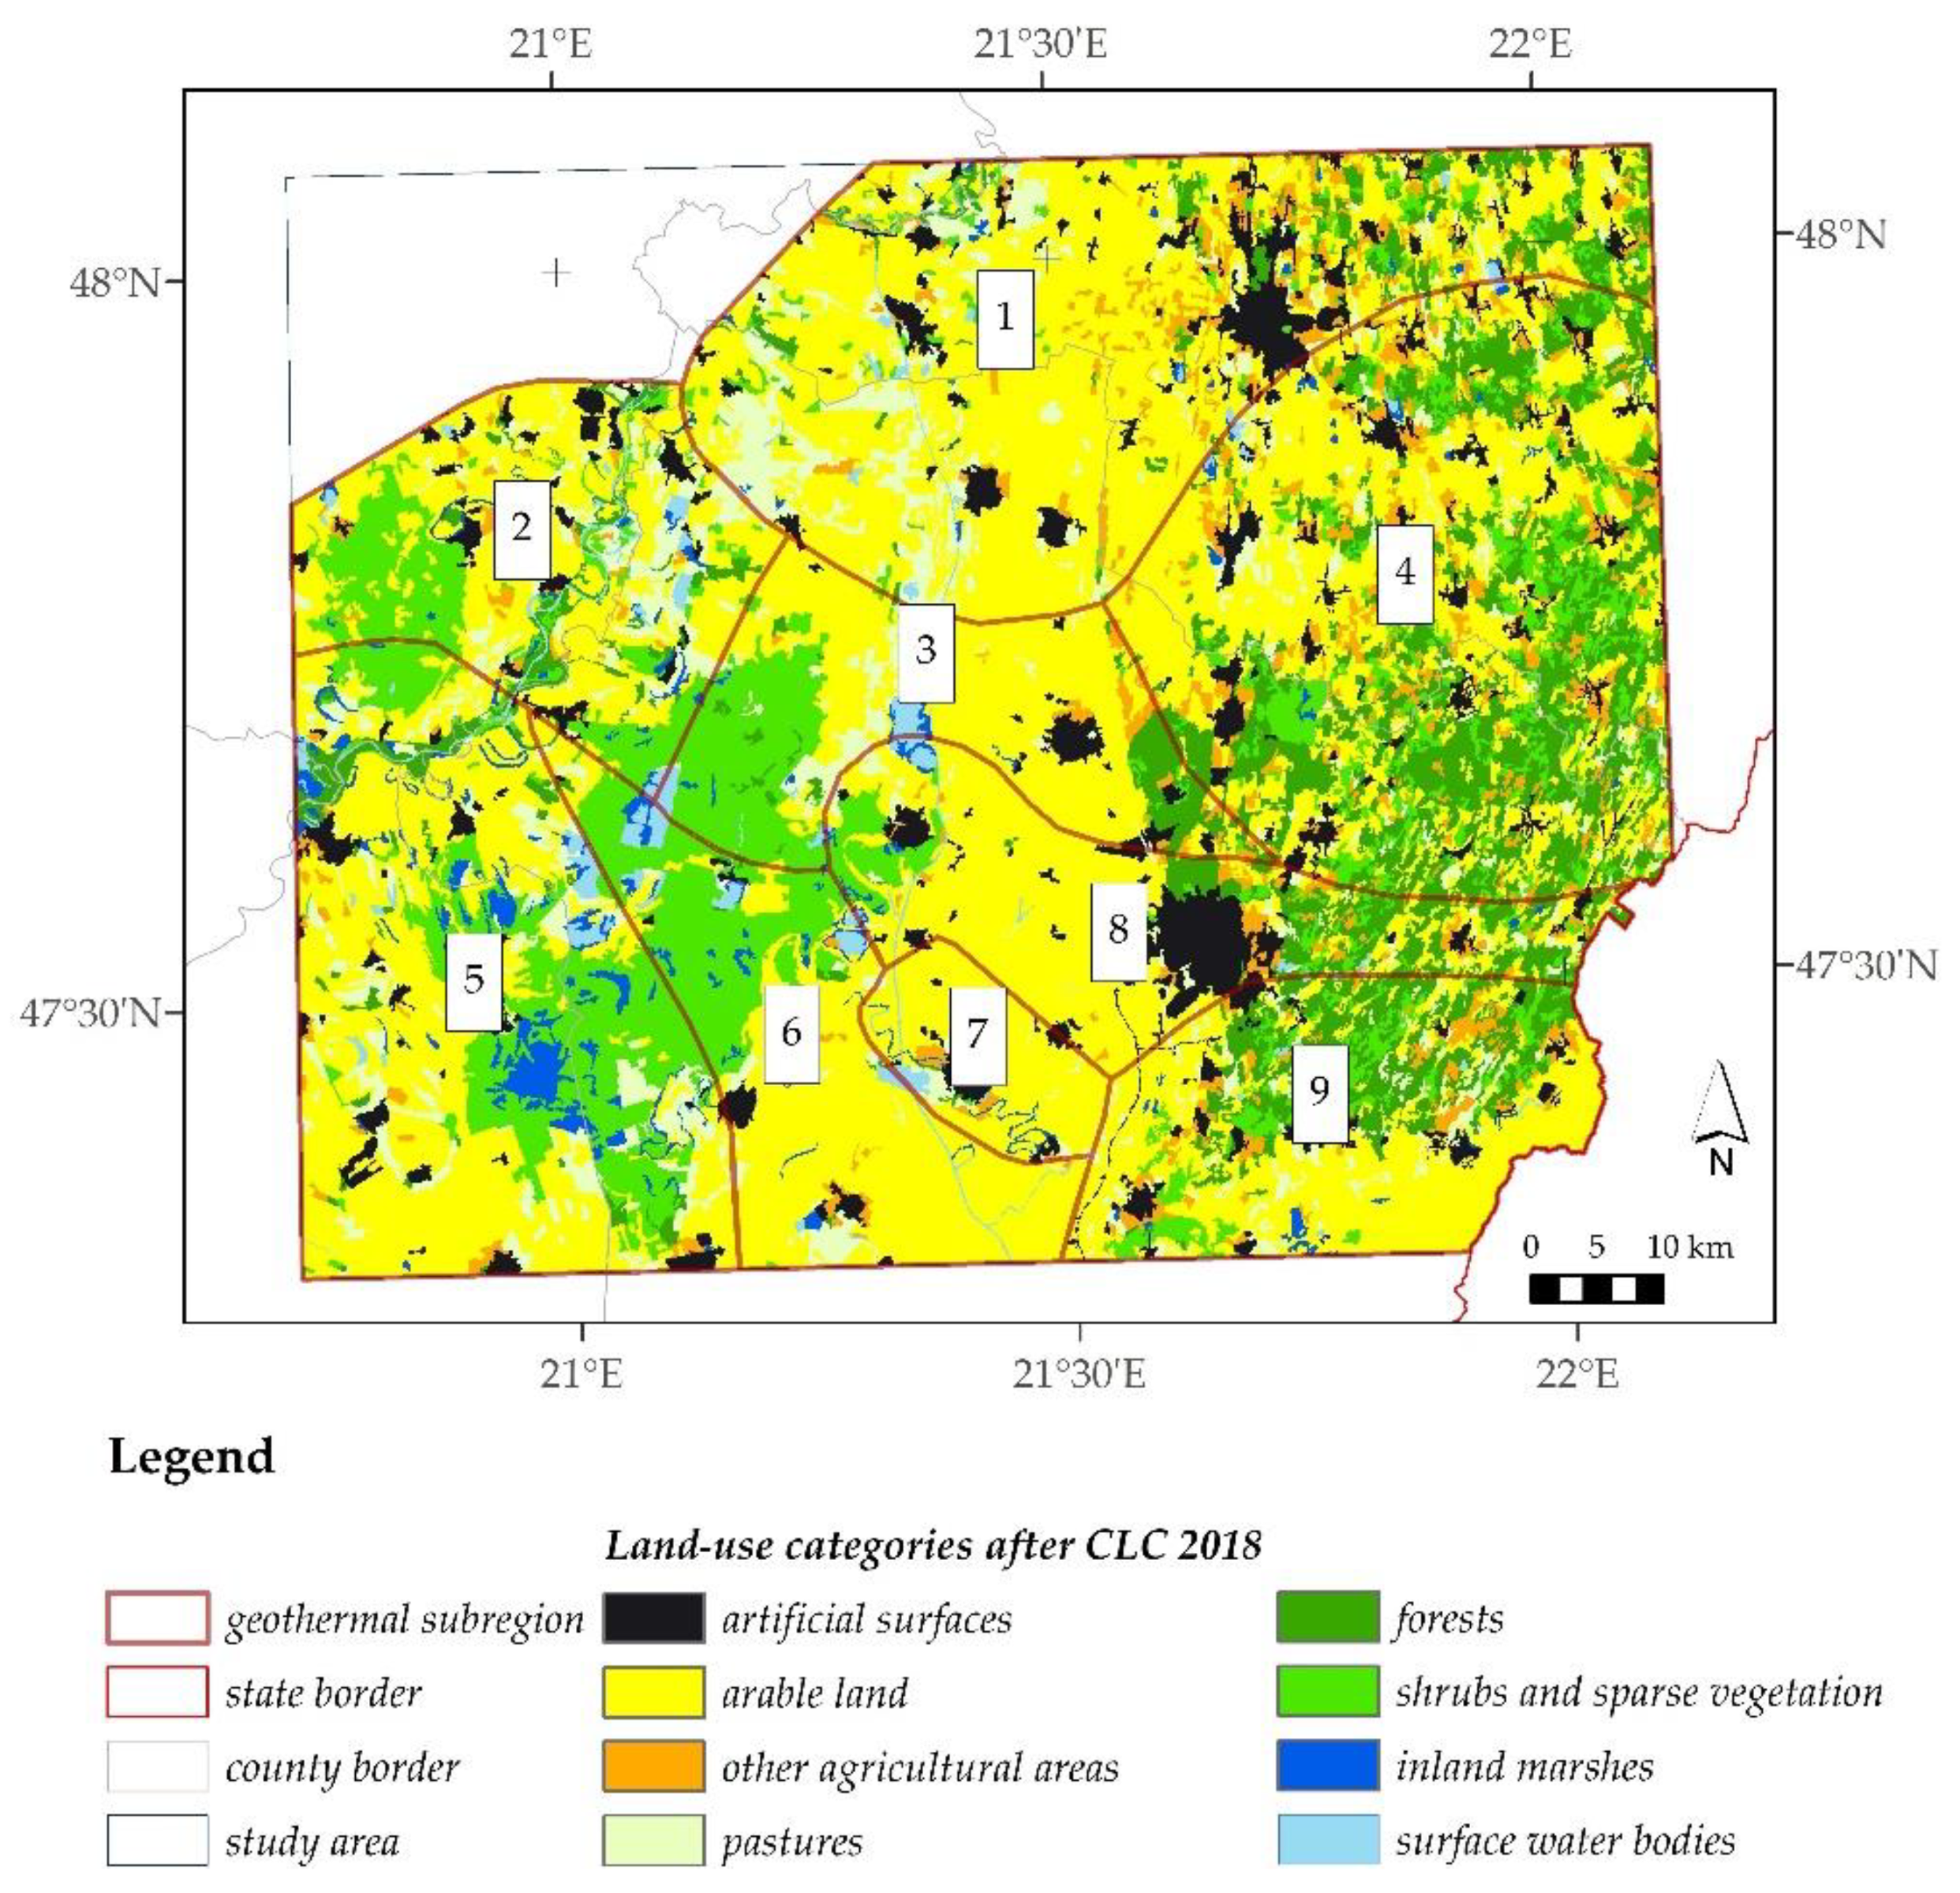
Nine geothermal subregions were delineated based on available temperature and reservoir geometries. Significant geological and geothermal information on the subregions is summarised in Table 1. The land-use categories for each geothermal subregion are presented in Figure 13 and Table 2.

3.3.1. GSR1

The area has relatively favourable geothermal conditions with its maximum reservoir temperatures (up to 85 °C in the western part of the area); however, the effect of the basement and the volcanites varies in terms of both reservoir thickness (145 m to 670 m) and maximum temperature. Basement morphology separates it from the surrounding subregions, and the supply of reservoirs in the marginal zones of the subregion is less favourable than in the central zones due to the nearby boundaries. Arable cultivation dominates the subregion, but it has high diversity in its eastern area. Besides Nyíregyháza, the county centre, there are several small towns with spas. The screening of bath wells is usually installed in deeper zones providing water with temperatures above 60 °C; their energy utilisation is partially solved, and increasing the number of spas is not justified. Due to the motorway crossing the subregion, significant industrial investments have arrived and are coming to the region, the lower temperature heat demands of which will be met with the help of geothermal energy, primarily in the vicinity of Nyíregyháza and Hajdúnánás. Most possible utilisations will be related to greenhouse heating, husbandry and the food industry (e.g., drying, sterilisation, canning industry).

3.3.2. GSR2

The subregion is located close to the marginal areas of the former Pannonian Lake, and the tectonic movements of the nearby mountains cause a diverse pattern of the basement and thus that of the Upper Pannonian layers. For this reason, the horizontal continuity of reservoirs, and thus water supply, could be limited. The characteristic maximum reservoir temperature is 60–75 °C, higher values occur in a small basin in the south, while lower values are associated with the north-west regions and an uplifted area. Tiszaújváros is an industrial centre in the subregion but mainly uses non-renewables and biomass for heating. The economic potential of the rest of the settlements is small, mainly related to agriculture, which could be the main user of geothermal energy (e.g., husbandry). There are several extended protected areas in the subregion, which limit the advance of investments.

3.3.3. GSR3

The subregion is characterised by a thin Upper Pannonian sediment series, the thickness of which increases towards the south. However, the depth of the bottom of the sediment series is medium; therefore the maximum temperature of thermal waters is around 70 °C in the south and 45 °C in the north-east. The area has low population expect the only one town in the eastern half and a small population; thus the heat demand is very low. Besides the arable lands, pastures and meadows are important mainly for extensive husbandry and nature conservation. Consequently, thermal water is suitable for bathing, agricultural production and possibly heating mainly in the eastern part of the subregion.

3.3.4. GSR4

The subregion is characterised by shallow-depth Upper Pannonian reservoirs with the lowest reservoir temperatures in the study area with maximum values of 46 °C in the central and 70 °C in the southern part of the subregion. The impact of tectonics and former volcanism on the extent of the reservoirs is significant. The subregion has a varied topography and a significant proportion of forest areas, and agricultural production takes place on plots with smaller average sizes. Settlements in the central part of the subregion are small in size, with a small heat demand; therefore, comparing the possibilities and needs, geothermal utilisation can be primarily for bathing purposes or as auxiliary energy in drying processes.

3.3.5. GSR5

The subregion is characterised by a thick delta with a large horizontal extent. The delta front, which is considered to be Upper Pannonian, is relatively thin, but sand bodies also appear in the delta slope. These sand bodies, however, have a limited size and water supply. The temperature of these deeper sand bodies is up to 86 °C, but the reservoir temperature of more appropriate reservoirs may be significantly lower locally. On the eastern side of the area, there is a national park, which can be considered an area practically without heat demand. Agricultural areas can be found in the western part, where geothermal energy utilisation may occur, but mainly in the form of lower temperature and water-intensive agricultural utilisations, as well as existing bathing purposes due to the geological conditions and heat demands.

3.3.6. GSR6

The subregion is characterised by Upper Pannonian sediments with medium thickness and with interfingering clayey sediments and sand bodies with a limited size in the lower zones. In the northern part of the subregion where a national park can be found, thermal water utilisation is expected only in the core settlement, Hortobágy, where some thermal wells already exist with the wellhead temperature up to 61 °C. In the southern part, where there are bath wells and agricultural areas as well, it is possible to increase geothermal heat utilisation, even with higher temperatures (>90 °C) mainly in agriculture and food processing. In the case of the deepest and warmest sand bodies, the limits of the horizontal extent of the reservoirs have to be taken into account due to interfingering; thus it is especially recommended to re-inject used thermal water.

3.3.7. GSR7

The subregion is located within the zone of the Ebes Thrust, which separates it from the reservoirs to the west of it. The subregion has favourable temperature conditions (maximum temperatures are in the range of 72–99 °C from north to south), but water production only provides the water supply of the Hajdúszoboszló spa, causing a significant effect on reservoir pressure and supply. Since the spa produces water from several thermal reservoirs and its operating and development are primary in the region, further use of thermal water in significant amounts that is not related to bathing is unlikely.

3.3.8. GSR8

The subregion is characterised by deepening reservoirs and rising temperatures towards the south from 59 °C to 97 °C. On the western side of the subregion, agricultural areas can be found; in the central part of the subregion, the county centre, Debrecen, has a complex urban structure with residential, industrial and recreational areas. In the eastern part of the area, small settlements are found with mixed land use. Thermal water reservoirs are used significantly in the northern part of Debrecen for bathing purposes, especially in the deeper zones, which have to be protected from overuse. In the western and southern areas, geothermal conditions are favourable for both agricultural and industrial use, and the most diverse use of geothermal energy can be developed here in the study area from low-temperature agricultural use to high-temperature industrial use.

3.3.9. GSR9

The subregion is characterised by significantly deepening boundaries towards the Derecske Trough, and the most favourable values of the presented research are found here. The best values appear in the axis of the trough where the horizontal interconnectivity of the reservoirs is low due to former tectonic events. In the northern part of the area, there is no significant heat demand because of the small population and forestry- and agriculture-based economy. There is a series of small settlements along the landscape borders in the central and western parts; to the south of them, arable cultivation dominates. In accordance with high temperatures (up to 122 °C in the axis of the trough), a wide range of geothermal energy utilisation can be imagined, even a binary power plant, of which heating and agricultural utilisation are the most likely; however, the fragmented reservoirs might supply a limited amount of water without re-injection.

4. Discussion

The delineation of nine geothermal subregions was carried out in the present study. From the eight land-use classes formed based on CLC 2018 categories, the arable lands category has the highest proportion in each geothermal subregion. The categories with the second highest geographical shares show a more varied picture. The shrubs and sparse vegetation category has the second highest proportion, considering the area, in four subregions, which are GSR2 (20.4%), GSR3 (23.8%), GSR5 (22.7%) and GSR6 (25.5%), the forest areas category is second in two subregions, GSR4 (26.7%) and GSR9 (21%), the artificial areas category also in two subregions, GSR7 (8.8%) and GSR8 (13.8%), and finally, the pastures category is in one subregion, GSR1 (13%).
Geothermal energy utilisation is typically not directly linked to arable land cultivation activities. However, it can play a role in crop storage, drying and, in some cases, other processing operations. The shrubs and sparse vegetation category includes a national park and other protected areas where demands and development are limited. In areas belonging to these categories, a considerable need for geothermal energy utilisation may not be expected. On the contrary, the geothermal energy utilisation associated with conventional agriculture is related to the heating of greenhouses and livestock farms and the processing of vegetables and fruits. They are emerging in additional agribusiness categories, whose growth at the expense of arable crops could mean an increase in geothermal heat demand. These could be expected mainly in the subregions GSR1, GSR4, GSR8 and GSR9, which are characterised by diverse land use, while adequate potential has been demonstrated only in GSR1, GSR8 and GSR9. Based on the results of the study, the CLC database can provide spatial information on areas where geothermal energy utilisation is preferred or prohibited. Application of CLC or other land-use databases seems to be useful for both thermal water-based geothermal energy utilisation and shallow geothermal heat pump systems [40,57,58,59,60].
The entire study area is suitable for the supply of thermal water at temperatures above 30 °C, while 50 °C is available in most subregions except certain parts of GSR2, GSR3 and GSR4 and can be used for some agricultural purposes and drying of agricultural crops in addition to forestry. Temperatures above this level are also found in the vicinity of several spa towns, but here the priority is often given to spa exploitation, especially in the case of spas. Here, in the peripheral areas of dynamically developing cities, the thermal needs of certain industrial operators may also be considered. In the south, temperatures are high enough to be used for heating and in small binary power plants.
The spatial delineation of subregions cannot be fully algorithmised due to their multifactorial nature and because 2D reflection seismology interpretation is a rather qualitative tool providing direct information only along 2D sections instead of continuous 3D surfaces. The parts around subregion boundaries are more like transition zones rather than sharply separated examples of two separate areas. The geographical micro-region characters are well aligned with the boundaries of some subregions, but for some subregions, they are less strong [61].

5. Conclusions

A detailed understanding of geothermal characteristics helps to optimise geothermal energy use. This study area is a good example of the justification for planning on the basis of subregional delimitation, as the characteristics of close settlements can vary greatly. This can be well studied using a dense network of 2D reflection seismics and a large amount of deep-drilling data. Based on the results obtained, the variability of the basement, such as tectonics, the presence of volcanic centres and basement outcrops, has a significant influence on the hydrogeological and geothermal properties of the reservoirs on a subregional scale.
Delineation of geothermal subregions provides help in the first phase of regional planning. In the case of a certain project aiming at actual geothermal energy utilisation, study must be carried out similarly to the presented series of methodological steps, such as data management, interpretation and calculations, based on similar types of input data. Important to note that geothermal potential estimations on different scales should be harmonised with each other.
For future research, the use of more detailed land cover categorisation is recommended in which various remote sensing applications, such as satellite and unmanned aircraft systems (UAS), can be involved besides other land development data sources. Further considerable issues are the environmental impact of the extracted water, gas, salt and heat and the treatment and utilisation possibilities of the treated water even in agriculture [36,62,63]. The presented results may be involved in the investigation focusing on how the potential and needs meet.

Author Contributions

Conceptualization, E.B.-B. and T.B.; methodology, E.B.-B., T.B., J.C., C.J. and A.S.; software, E.B.-B., T.B., Z.Z.F. and J.C.; validation, E.B.-B. and T.B.; formal analysis, E.B.-B. and T.B., A.I., Z.Z.F. and J.C.; resources, E.B.-B., T.B., A.I. and Z.Z.F.; data curation, E.B.-B., T.B., Z.Z.F. and R.W.M.; writing—original draft preparation, E.B.-B. and T.B.; writing—review and editing, E.B.-B., T.B., A.I., Z.Z.F., R.W.M. and A.S.; visualization, E.B.-B., T.B., Z.Z.F., J.C. and A.I.; supervision, T.B., R.W.M., J.C., C.J. and L.R.; project administration, T.B. All authors have read and agreed to the published version of the manuscript.

Funding

This research was supported by the EFOP-3.6.1-16-2016-00022 Project. The project was co-financed by the European Union and the European Social Fund.

Institutional Review Board Statement

Not applicable.

Informed Consent Statement

Not applicable.

Conflicts of Interest

The authors declare no conflict of interest. The funders had no role in the design of the study; in the collection, analyses or interpretation of data; in the writing of the manuscript or in the decision to publish the results.

References

  1. Rybach, L. Geothermal sustainability. In Proceedings of the European Geothermal Congress, Unterhaching, Germany, 30 May–1 June 2007; pp. 1–5. [Google Scholar]
  2. Stober, I.; Bucher, K. Geothermal Energy. From Theoretical Models to Exploration and Development, 2nd ed.; Springer Nature: Cham, Switzerland, 2021; 390p. [Google Scholar]
  3. Axelsson, G. Sustainable geothermal utilization–Case histories; definitions; research issues and modelling. Geothermics 2010, 39, 283–291. [Google Scholar] [CrossRef]
  4. Szanyi, J.; Kovács, B. Utilization of geothermal systems in South-East Hungary. Geothermics 2010, 39, 357–364. [Google Scholar] [CrossRef]
  5. Rubio-Maya, C.; Ambríz Díaz, V.M.; Pastor Martínez, E.; Belman-Flores, J.M. Cascade utilization of low and medium enthalpy geothermal resources–A review. Renew. Sustain. Energy Rev. 2015, 52, 689–716. [Google Scholar] [CrossRef]
  6. Fabbri, P.; Pola, M.; Piccinini, L.; Zampieri, D.; Roghel, A.; Dalla Libera, N. Monitoring, utilization and sustainable development of a low-temperature geothermal resource: A case study of the Euganean Geothermal Field (NE, Italy). Geothermics 2017, 70, 281–294. [Google Scholar] [CrossRef]
  7. Buday, T.; Szűcs, P.; Kozák, M.; Püspöki, Z.; McIntosh, R.W.; Bódi, E.; Bálint, B.; Bulátkó, K. Sustainability aspects of thermal water production in the region of Hajdúszoboszló-Debrecen, Hungary. Environ. Earth Sci. 2015, 74, 7511–7521. [Google Scholar] [CrossRef]
  8. Halaj, E. Characteristics and sustainable utilisation prospects of geothermal waters of the liassic formations in the Mogilno–Lodz Trough, Poland. Sustain. Water Resour. Manag. 2019, 5, 1537–1553. [Google Scholar] [CrossRef] [Green Version]
  9. Boguniewicz-Zabłocka, J.; Łukasiewicz, E.; Guida, D. Analysis of the Sustainable Use of Geothermal Waters and Future Development Possibilities—A Case Study from the Opole Region, Poland. Sustainability 2019, 11, 6730. [Google Scholar] [CrossRef] [Green Version]
  10. Szűcs, P.; Szabó, N.P.; Zubair, M.; Szalai, S. Innovative Hydrogeophysical Approaches as Aids to Assess Hungarian Groundwater Bodies. Appl. Sci. 2021, 11, 2099. [Google Scholar] [CrossRef]
  11. Kana, J.D.; Djongyang, N.; Raïdandi, D.; Njandjock Nouck, P.; Dadjé, A. A review of geophysical methods for geothermal exploration. Renew. Sustain. Energy Rev. 2015, 44, 87–95. [Google Scholar] [CrossRef]
  12. Vakarcs, G. Sequence Stratigraphy of the Cenozoic Pannonian Basins. Ph.D. Thesis, Rice University, Houston, TX, USA, 1997. [Google Scholar]
  13. Pogácsás, G.; Lakatos, L.; Újszászi, K.; Vakarcs, G.; Várkonyi, L.; Várnai, P.; Révész, I. Seismic facies, electro facies and Neogene sequence chronology of the Pannonian Basin. Acta Geol. Hung. 1988, 31, 175–207. [Google Scholar]
  14. Juhász, G. A pannóniai (s.l.) formációk térképezése az Alföldön: Elterjedés, fácies és üledékes környezet. Pannonian (s.l.) lithostratigraphic units in the Great Hungarian Plain: Distribution, facies and sedimentary environment. Földtani Közlöny 1992, 122, 133–165. [Google Scholar]
  15. Juhász, G.; Magyar, I. A pannóniai (s.l.) litofáciesek és molluszka-biofáciesek jellemzése és korrelációja az Alföldön. Review and correlation of the Late Neogene (Panonian s.l. lithofacies and mollusc biofacies in the great Hungarian Plain. Földtani Közlöny 1992, 122, 167–194. [Google Scholar]
  16. Lenkey, L.; Zsemle, F.; Mádl-Szőnyi, J.; Dövényi, P.; Rybach, L. Possibilities and limitations in the utilization of the Neogene geothermal reservoirs in the Great Hungarian Plain, Hungary. Cent. Eur. Geol. 2008, 51, 241–252. [Google Scholar] [CrossRef] [Green Version]
  17. Szanyi, J.; Kovács, B.; Scharek, P. Geothermal Energy in Hungary: Potentials and barriers. Eur. Geol. 2009, 27, 15–19. [Google Scholar]
  18. Horváth, F.; Musitz, B.; Balázs, A.; Végh, A.; Uhrin, A.; Nádor, A.; Koroknai, B.; Pap, N.; Tóth, T.; Wórum, G. Evolution of the Pannonian basin and its geothermal resources. Geothermics 2015, 53, 328–352. [Google Scholar] [CrossRef]
  19. Tóth, A.N. Country Update for Hungary. In Proceedings of the World Geothermal Congress 2020+1, Reykjavik, Iceland, 21–26 May 2021; pp. 1–10. [Google Scholar]
  20. Magyar, I. A Pannon-Medence Ősföldrajza és Környezeti Viszonyai a Késő Miocénben; Geolitera, SZTE TTIK Földrajzi és Földtani Tanszékcsoport: Szeged, Hungary, 2010; 140p. [Google Scholar]
  21. Dövényi, P.; Horváth, F. A review of temperature, thermal conductivity, and heat flow data for the pannonian basin. In The Pannonian Basin; A Study in Basin Evolution; Royden, L.H., Horváth, F., Eds.; American Association of Petroleum Geologists Memoir: Tulsa, OK, USA, 1988; Volume 45, pp. 195–233. [Google Scholar]
  22. Rezessy, G.; Szanyi, J.; Hámor, T. Report on Development of Geothermal Energy Inventory; Hungarian Geological Survey: Budapest, Hungary, 2005; 82p. (In Hungarian) [Google Scholar]
  23. Zilahi-Sebess, L.; Merényi, L.; Gulyás, Á.; Paszera, G.; Tóth, G.; Boda, E.; Budai, T. Nemzeti Energiastratégia, Készlet gazdálkodási és hasznosítási cselekvési terv. In Nyersanyag Készletek, A Hazai Ásványi Nyersanyag-Potenciál, 5. Geotermikus Energia; Manuscript; Magyar Földtani és Geofizikai Intézet: Budapest, Hungary, 2012; 84p. [Google Scholar]
  24. Békési, E.; Lenkey, L.; Limberger, J.; Porkoláb, K.; Balázs, A.; Bonté, D.; Vrijlandt, M.; Horváth, F.; Cloetingh, S.; van Wees, J.-D. Subsurface temperature model of the Hungarian part of the Pannonian Basin. Glob. Planet. Change 2018, 171, 48–64. [Google Scholar] [CrossRef]
  25. Juhász, G.; Pogácsás, G.; Magyar, I.; Vakarcs, G. Integrált-sztratigráfiai és fejlődéstörténeti vizsgálatok az Alföld pannóniai s.l. rétegsorában (Integrated stratigraphy and sedimentary evolution of the Late Neogene sediments of the Hungarian Plain, Pannonian Basin). Földtani Közlöny 2006, 136, 51–86. [Google Scholar]
  26. Mattick, R.E.; Phillips, R.L.; Rumpler, J. Seismic stratigraphy and depositional framework of sedimentary rocks in the Pannonian Basin in southeasterns Hungary. In The Pannonian Basin; A Study in Basin Evolution; Royden, L.H., Horváth, F., Eds.; American Association of Petroleum Geologists Memoir: Tulsa, OK, USA, 1988; Volume 45, pp. 117–145. [Google Scholar]
  27. Tóth, J.; Almási, I. Interpretation of observed fluid potential patterns in a deep sedimentary basin under tectonic compression: Hungarian Great Plain, Pannonian Basin. Geofluids 2001, 1, 11–36. [Google Scholar] [CrossRef]
  28. Csató, I.; Tóth, S.; Catuneanu, O.; Granjeon, D. A sequence stratigraphic model for the Upper Miocene–Pliocene basin fill of the Pannonian Basin, eastern Hungary. Mar. Pet. Geol. 2015, 66, 117–134. [Google Scholar] [CrossRef]
  29. Balázs, A.; Matenco, L.; Magyar, I.; Horváth, F.; Cloetingh, S. The link between tectonics and sedimentation in back-arc basins: New genetic constraints from the analysis of the Pannonian Basin. Tectonics 2016, 35, 1526–1559. [Google Scholar] [CrossRef] [Green Version]
  30. Willems, C.J.L.; Cheng, C.; Watson, S.M.; Minto, J.; Williams, A.; Walls, D.; Milsch, H.; Burnside, N.M.; Westaway, R. Permeability and Mineralogy of the Újfalu Formation, Hungary, from Production Tests and Experimental Rock Characterization: Implications for Geothermal Heat Projects. Energies 2021, 14, 4332. [Google Scholar] [CrossRef]
  31. Rman, N.; Gál, N.; Marcin, D.; Weibold, J.; Schubert, J.; Lapanje, A.; Rajver, D.; Benková, K.; Nádor, A. Potentials of transboundary thermal water resources in the western part of the Pannonian basin. Geothermics 2015, 55, 88–98. [Google Scholar] [CrossRef]
  32. Tóth, G.; Rman, N.; Rotár-Szalkai, Á.; Kerékgyártó, T.; Szőcs, T.; Lapanje, A.; Černák, R.; Remsík, A.; Schubert, G.; Nádor, A. Transboundary fresh and thermal groundwater flows in the west part of the Pannonian Basin. Renew. Sustain. Energy Rev. 2016, 57, 439–454. [Google Scholar] [CrossRef]
  33. Rotár-Szalkai, Á.; Nádor, A.; Szőcs, T.; Maros, G.; Goetzl, G.; Zekiri, F. Outline and joint characterization of transboundary geothermal reservoirs at the western part of the Pannonian basin. Geothermics 2017, 70, 1–16. [Google Scholar] [CrossRef]
  34. Szőcs, T.; Rman, N.; Rotár-Szalkai, Á.; Tóth, G.; Lapanje, A.; Černák, R.; Nádor, A. The upper pannonian thermal aquifer:Cross border cooperation as an essential step to transboundary groundwater management. J. Hydrol. Reg. Stud. 2018, 20, 128–144. [Google Scholar] [CrossRef]
  35. Rman, N.; Bălan, L.L.; Bobovečki, I.; Gál, N.; Jolović, B.; Lapanje, A.; Marković, T.; Milenić, D.; Skopljak, F.; Rotár-Szalkai, Á.; et al. Geothermal sources and utilization practice in six countries along the southern part of the Pannonian basin. Environ. Earth Sci. 2020, 79, 1. [Google Scholar] [CrossRef] [Green Version]
  36. Buday-Bódi, E.; Buday, T.; Magyar, T.; Molnár, L.; Tamás, J. Possible environmental aspects of thermal water utilization in north-east Hungary. Nat. Resour. Sustain. Dev. 2019, 9, 17–26. [Google Scholar] [CrossRef]
  37. Tóth, G. Case study: XL groundwater model of the Pannonian basin and its use for transboundary consultations. Workshop Groundw. Model. TAIEX-INFRA 2009, 32389. [Google Scholar]
  38. Buday, T.; Kozák, M.; McIntosh, R.W.; Püspöki, Z. Possibilities of geothermal energy utilization around Létavértes. Acta GGM Debrecina Geol. Geomorphol. Phys. Geogr. Ser. 2012, 6–7, 63–70. [Google Scholar]
  39. Bódi, E.; Buday, T. Upper Pannonian formations in 2D seismic sections in Middle Trans-Tisza Region, East Hungary. Acta GGM Debrecina Geol. Geomorphol. Phys. Geogr. Ser. 2014, 9, 57–66. [Google Scholar]
  40. Buday, T.; Buday-Bódi, E.; McIntosh, R.W.; Kozák, M. Geoinformatic background of geothermal energy utilization and its applications in East Hungary. Landsc. Environ. 2016, 10, 145–152. [Google Scholar] [CrossRef] [Green Version]
  41. Buday-Bódi, E.; Buday, T.; Mcintosh, R.W. Geothermal Subregions in Upper Pannonian Sediments: A Case Study from East Hungary. Eur. Geol. in press. Available online: https://eurogeologists.eu/european-geologist-journal-43-bodi-geothermal-subregions-upper-pannonian-sediments-case-study-east-hungary/ (accessed on 22 February 2022).
  42. Fodor, L. Mezozoos-Kainozoos Feszültségmezők és Törésrendszerek a Pannon-Medence ÉNy-i Részén–Módszertan és Szerkezeti Elemzés (Mesozoic-Cenozoic Stress Fields and Fault Systems in the NW Pannonian Basin–Methodology and Structural Analysis). Ph.D. Thesis, Hungarian Academy of Sciences, Budapest, Hungary, 2010. [Google Scholar]
  43. Zelenka, T.; Balogh, K.; Kozák, M.; Pécskay, Z.; Ravasz, C.; Újfalussy, A.; Balázs, E.; Kiss, J.; Nemesi, L.; Püspöki, Z.; et al. Buried Neogen volcanic structures in Hungary. Acta Geol. Hung. 2004, 47, 177–219. [Google Scholar] [CrossRef] [Green Version]
  44. Széky-Fux, V.; Kozák, M.; Püspöki, Z. Covered Neogene magmatism of East Hungary. Acta GGM DebrecinaGeol.Geomorphol. Phys. Geogr. Ser. 2007, 2, 79–104. [Google Scholar]
  45. EGDI. 1:1 Million Pan-European Surface Geology, Harvested from INSPIRE Conformant National WFS Services on GeologicUnit. Available online: https://www.europe-geology.eu/map-viewer/ (accessed on 22 February 2022).
  46. Haas, J.; Budai, T.; Csontos, L.; Konrád, G. Pre-Cenozoic Geological Map of Hungary, 1:500,000; Geological Institute of Hungary: Budapest, Hungary, 2010. [Google Scholar]
  47. Bérczi, I.; Phillips, R.L. Processes and depositional environments within Neogene deltaic-lacustrine sediments, Pannonian Basin, Southeast Hungary. Geophys. Trans. 1985, 31, 55–74. [Google Scholar]
  48. OGRE. Geothermal Information System. The Mining and Geological Survey of Hungary (MBFSZ). 2020. Available online: https://map.mbfsz.gov.hu/ogre/ (accessed on 25 January 2022).
  49. Chen, Y.; Zhang, S.; Fu, Q.; Gao, Y. Application of OpendTect system in sequence stratigraphy research. Prog. Geophys. 2009, 24, 1768–1775. [Google Scholar] [CrossRef]
  50. Aziz, I.A.; Jaafar, J.; Gilal, A.R. The Study of OpendTect Seismic Data Interpretation and Visualization Package in Relation to Seismic Interpretation and Visualization Models. IJCSNS Int. J. Comput. Sci. Netw. Secur. 2017, 17, 124–134. [Google Scholar]
  51. Vail, P.R.; Mitchum, R.M., Jr. Overview. In Seismic Stratigraphy—Applications to Hydrocarbon Exploration; Payton, C.E., Ed.; AAPG Memoir: Tulsa, OK, USA, 1977; pp. 51–52. [Google Scholar]
  52. Alvarenga, R.d.S.; Kuchle, J.; Iacopini, D.; Goldberg, K.; Scherer, C.M.d.S.; Pantopoulos, G.; Ene, P.L. Tectonic and Stratigraphic Evolution Based on Seismic Sequence Stratigraphy: Central Rift Section of the Campos Basin, Offshore Brazil. Geosciences 2021, 11, 338. [Google Scholar] [CrossRef]
  53. Büttner, G. CORINE Land Cover and Land Cover Change Products. In Land Use and Land Cover Mapping in Europe: Practices & Trends; Manakos, I., Braun, M., Eds.; Springer: Dordrecht, The Netherlands, 2014; pp. 55–74. [Google Scholar]
  54. Corine Land Cover–Copernicus Programme. Available online: https://land.copernicus.eu/pan-european/corine-land-cover/clc2018?tab=download (accessed on 25 January 2022).
  55. Lindal, B. Industrial and other applications of geothermal energy. In Geothermal Energy; Armstead, H.C.H., Ed.; UNESCO: Paris, France, 1973; pp. 135–148. [Google Scholar]
  56. Friedleifsson, B.I. Direct Use of Geothermal Energy around the World. GHC Bull. 1998, 19, 4–9. [Google Scholar]
  57. Gemelli, A.; Mancini, A.; Diamantini, C.; Longhi, S. GIS to Support Cost-Effective Decisions on Renewable Sources; Springer: Berlin/Heidelberg, Germany, 2013; 80p. [Google Scholar] [CrossRef]
  58. Arola, T.; Eskola, L.; Hellen, J.; Korkka-Niemi, K. Mapping the low enthalpy geothermal potential of shallow Quaternary aquifers in Finland. Geotherm. Energy 2014, 2, 9. [Google Scholar] [CrossRef] [Green Version]
  59. Schiel, K.; Baume, O.; Caruso, G.; Leopold, U. GIS-based modelling of shallow geothermal energy potential for CO2 emission mitigation in urban areas. Renew. Energy 2016, 86, 1023–1036. [Google Scholar] [CrossRef]
  60. Novelli, A.; D’Alonzo, V.; Pezzutto, S.; Poggio, R.A.E.; Casasso, A.; Zambelli, P. A Spatially-Explicit Economic and Financial Assessment of Closed-Loop Ground-Source Geothermal Heat Pumps: A Case Study for the Residential Buildings of Valle d’Aosta Region. Sustainability 2021, 13, 12516. [Google Scholar] [CrossRef]
  61. Csorba, P. Magyarország Kistájai; Meridián Táj-és Környezetföldrajzi Alapítvány: Debrecen, Hungary, 2021; 409p. [Google Scholar]
  62. Iancu, C.V.; Popovici, M.; Venig, A. Research related to the malt drying using geothermal water. Nat. Resour. Sustain. Dev. 2011, 1, 181–186. [Google Scholar]
  63. Tamás, J.; Nagy, A.; Fehér, J. Agricultural biomass monitoring on watersheds based on remote sensed data. Water Sci. Technol. 2015, 72, 2212–2220. [Google Scholar] [CrossRef]
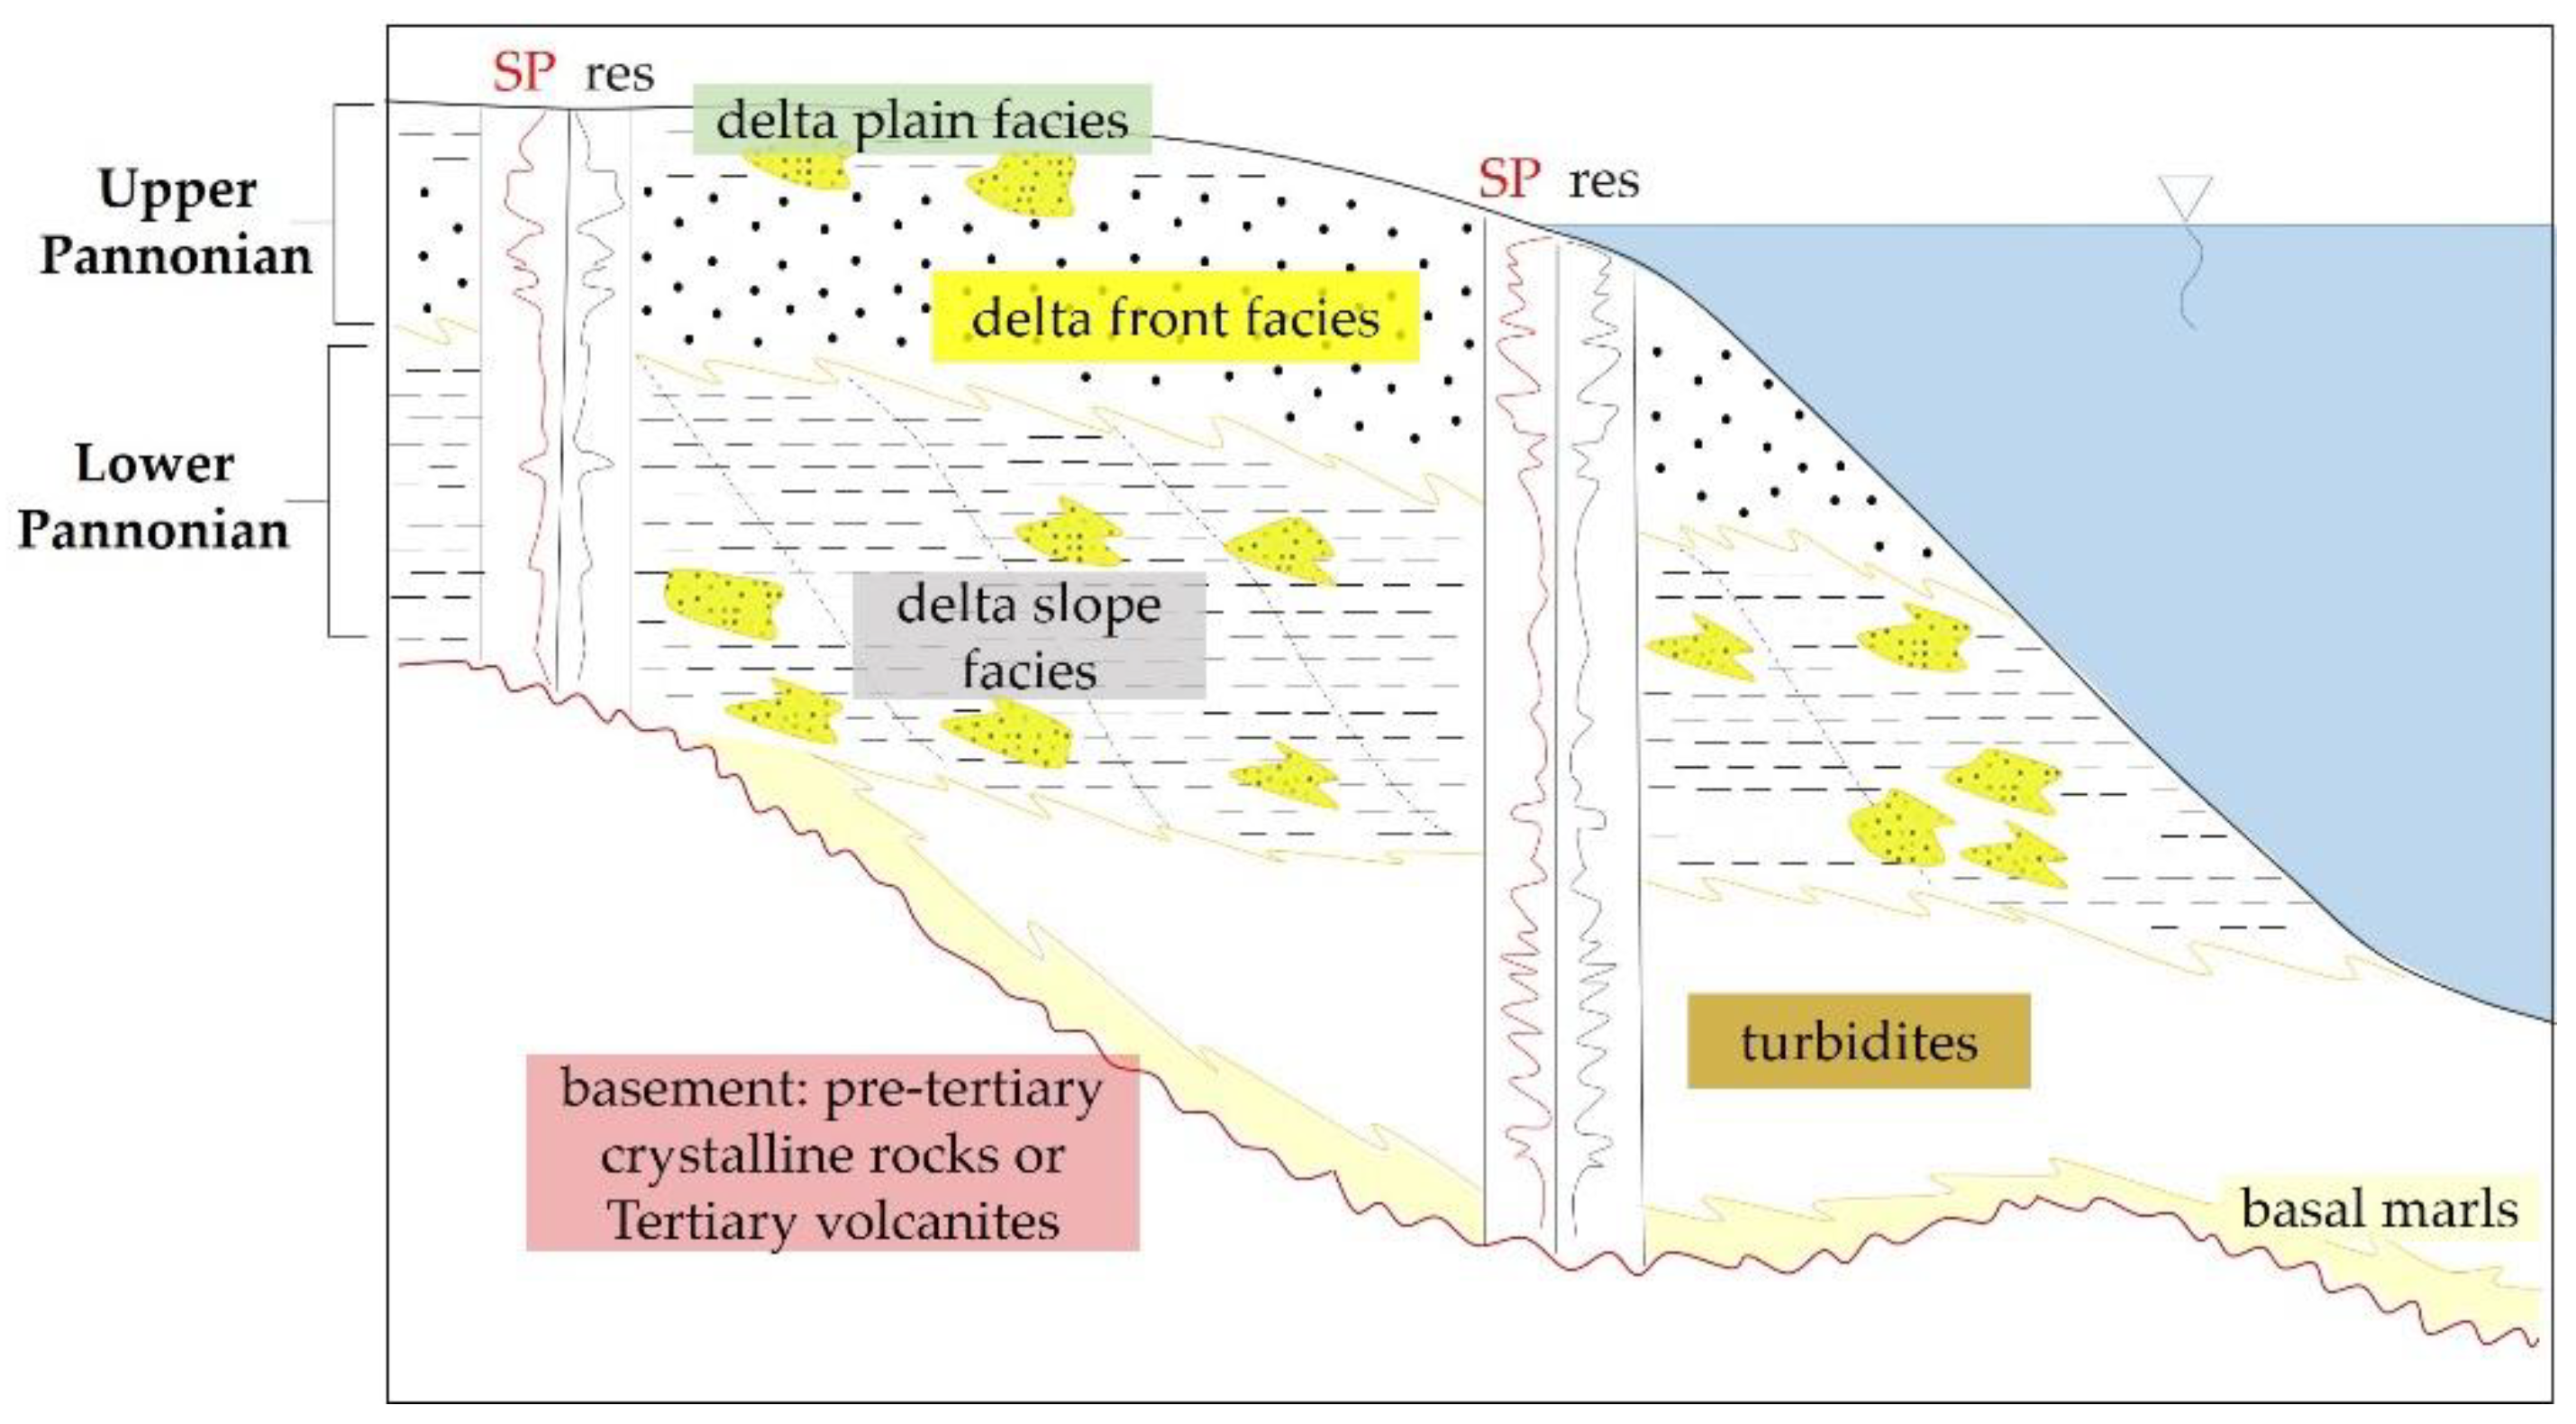
Figure 1. Schematic geological cross-section of the Pannonian sediments accumulated in Lake Pannon. SP and res refer to self-potential and resistivity, respectively, of the rocks along the borehole section. (Modified after [15]).
Sustainability 14 03529 g001
Figure 2. Location of the study area in NE Hungary with Surface Geological Unit Lithology map (1:1M) (based on [45]).
Sustainability 14 03529 g002
Figure 3. Study area and the location of the used datasets: thermal water wells and 2D reflection seismic sections.
Sustainability 14 03529 g003
Figure 4. Deep borehole geophysical log of thermal water well (Hajduboszormeny-B270, projected) and 2D seismic reflection section (PO-87) interpretation to delineate Upper Pannonian lower and upper boundaries.
Sustainability 14 03529 g004
Figure 5. Flow chart of data management and processing to delineate geothermal subregions.
Sustainability 14 03529 g005
Figure 6. Thermal water utilisation diagram in simplified form (based on [55,56]).
Sustainability 14 03529 g006
Figure 7. (a) Seismic pattern of sub-marine canyon sedimentary units (PO-7) and (b) prograding delta slope with sigmoid sedimentary facies groups (PO-16), (c) tectonic fault (DE-72) and (d) buried volcanic dome (NY-6).
Sustainability 14 03529 g007
Figure 8. Location of tectonic and sedimentary anomalies and interfingering in the study area based on reflection seismic interpretation and analysis and literature data.
Sustainability 14 03529 g008
Figure 9. (a) Depth of upper boundary of the Upper Pannonian and (b) calculated temperature of the Upper Pannonian at its upper boundary surface.
Sustainability 14 03529 g009
Figure 10. (a) Depth of lower boundary of the Upper Pannonian and (b) calculated temperature of the Upper Pannonian at its lower boundary surface.
Sustainability 14 03529 g010
Figure 11. (a) Thickness map of Upper Pannonian and (b) the depth map of 30 °C isotherm.
Sustainability 14 03529 g011
Figure 12. Geothermal gradient map (GG) of the study area calculated based on thermal well data.
Sustainability 14 03529 g012
Figure 13. Land-use categories based on Corine Land Cover 2018 and the delineated geothermal subregions (from no. 1 to no. 9) within the study area.
Sustainability 14 03529 g013
Table 1. Summarised description of the delineated geothermal subregions (from GSR1 to GSR2).
SubregionMax. Reservoir Temp.Max. Reservoir DepthReservoir ThicknessSeismic Character
GSR155 °C to
85 °C
790 m to
1280 m
145 m to
670 m
Generally well mapped parallel reflections, fault structures and volcanic domes disturbed the geometry
GSR245 °C to
83 °C
600 m to
1200 m
0 m to
680 m
Tectonically not disturbed Pannonian sequences, uplifted basement, thinned out sediments
GSR346 °C to
70 °C
600 m to
1000 m
20 m to
620 m
Volcanic domes, medium-sized fault systems, parallel reflection units
GSR442 °C to
70 °C
580 m to
1000 m
220 m to
680 m
Folded pattern of reflection units and medium-sized fault systems, volcanic domes
GSR555 °C to
86 °C
790 m to
1200 m
70 m to
640 m
Large delta system with sigmoidal pattern, modified by faults and a large sub-marine canyon system
GSR666 °C to
105 °C
880 m to
1600 m
70 m to
890 m
Interfingering, parallel reflection units disturbed by medium-sized tectonic faults
GSR772 °C to
99 °C
1000 m to
1490 m
600 m to
930 m
Ebes Thrust zone, uplifted chrystalline basement, parallel reflection units
GSR859 °C to
97 °C
850 m to
1500 m
534 m to
1000 m
Minimal presence of tectonic faults and volcanic domes without significant effect on the reflection units
GSR984 °C to
122 °C
1200 m to
1933 m
780 m to
1390 m
First-order tectonic faults cause deepening of the basement and thickening of the Upper Pannonian sediment, divergent strata pattern
Table 2. The share of land-use categories in each geothermal subregion (from GSR1 to GSR9) in percentage (The two highest values of each GSR are bold).
CategoryGSR1GSR2GSR3GSR4GSR5GSR6GSR7GSR8GSR9
Artificial surfaces8.06.23.86.53.62.38.813.85.9
Arable lands61.248.050.741.349.159.275.653.847.9
Pastures13.012.88.24.711.34.66.33.98.0
Other agricultural areas6.32.72.89.01.31.23.14.36.5
Forests6.75.17.426.73.70.70.813.321.0
Shrubs and sparse vegetation3.220.423.811.122.725.50.18.29.6
Inland marshes0.52.01.00.66.22.62.31.00.9
Surface water bodies1.12.82.30.22.04.03.01.70.3
Publisher’s Note: MDPI stays neutral with regard to jurisdictional claims in published maps and institutional affiliations.