Review

Freight Transport Decarbonization: A Systematic Literature Review of System Dynamics Models

by
Verônica Ghisolfi
1,
Lóránt Antal Tavasszy
2,
Gonçalo Homem de Almeida Correia
3,
Gisele de Lorena Diniz Chaves
4 and
Glaydston Mattos Ribeiro
1,*
1
Transportation Engineering Program, Federal University of Rio de Janeiro, Rio de Janeiro 21941-594, Brazil
2
Section of Transport and Logistics, Faculty of Technology, Policy and Management, Delft University of Technology, 2628 BX Delft, The Netherlands
3
Department of Transport and Planning, Faculty of Civil Engineering and Geosciences, Delft University of Technology, 2628 CN Delft, The Netherlands
4
Department of Engineering and Technology, Federal University of Espírito Santo, São Mateus 29932-900, Brazil
*
Author to whom correspondence should be addressed.
Sustainability 2022, 14(6), 3625; https://doi.org/10.3390/su14063625
Submission received: 26 February 2022 / Revised: 11 March 2022 / Accepted: 16 March 2022 / Published: 19 March 2022
(This article belongs to the Section Sustainable Transportation)

Abstract

:
Freight transport decarbonization is currently an urgent challenge. Decarbonization strategies have a specific time to take effect, and it is essential to consider their time dependence. The system dynamics approach is well suited to represent feedback, lagged responses, and the time dependence of decarbonization strategies. We carried out a systematic literature review of system dynamics models in relation to strategies for freight decarbonization to identify the treatment of relevant dynamics of the system within the models. The 50 studies that fulfilled our search criteria were categorized by decarbonization strategies, the external factors needed to support them, and simulated policy instruments. The results show that no model presented a broad view of the system, addressing a limited combination of strategies. Most importantly, system dynamics models do not clarify how time-dependent behavior is determined, which indicates a significant research gap that can be critical for understanding the policy’s urgency and impacts.

1. Introduction

The freight transport sector contributes to resource consumption, pollution, and climate change, mainly due to the increasing demand for, and burning of, fossil fuels [1]. Road freight alone accounts for about 7% of the world’s energy-related carbon dioxide (CO2) emissions [2], with a likelihood of increasing in the future despite progress in mobility electrification. This continued growth in emissions is mainly due to globally increasing consumption and, therefore, an increase in freight trips, which are still primarily based on internal combustion vehicles [3].
Decarbonization of the transport sector can only be achieved by combining several strategies with top-down policies [2]. The green logistics framework presents five strategies as the forward path to decarbonizing freight transportation [4]: (1) reducing freight transport demand; (2) shifting freight to lower-carbon transport modes; (3) improving assets utilization; (4) increasing energy efficiency; (5) switching to lower-carbon energy. Different policy instruments deal with the implementation of each decarbonization strategy. Modal shift, for example, can be achieved by employing fiscal measures (e.g., rail freight funding), regulatory measures (e.g., regulation of truck weight or size), and infrastructure investment [5]. Regardless of the decarbonization strategy adopted, decision makers must be aware that their policies, decisions, and actions may have second-order effects on the system, leading to the need for a macro view that enables addressing the problem in a systemic and integrated way.
To illustrate the problem, in some countries, the discussion focuses on using larger and heavier trucks to transport more freight instead of shifting to rails or waterways [6]. Increasing the payload of trucks can decrease environmental impacts, as evidenced by a case study in China [7], and operating costs of the road mode by ton–km, as evidenced by the case study of the transport of ornamental stones in Brazil [8]. However, the efficiency increase leads to a rebound effect over freight transport demand [9], worsening the system’s general state. This example demonstrates that a change in the vehicle system, without considering the freight demand mechanism, may not achieve the expected goal. Moreover, reducing road freight operating costs discourages the modal shift to cheaper modes, such as rail and waterways [6], which can hinder achieving global environmental goals imposed by climate change. On the other hand, if transport agents direct efforts toward a modal shift from road to rail, they must consider possible reactions from road haulers. Otherwise, the existing economic competition can undermine rail operation, whose competitive advantage depends on a constant freight flow. Freight transport decarbonization is a dynamic, complex system; in the decision-making process, one strategy may impact the other.
Besides the impacts of second-order effects, the system’s dynamics are also determined by the speed of change of its subsystems, i.e., the time that each decision or action takes to be implemented and take effect. In this sense, developing cleaner technologies and alternative fuels are relevant strategies for freight decarbonization, but knowing how long these technologies will take to be adopted by transport companies and used on a large scale is critical for crafting more realistic decarbonization targets and addressing the problem more efficiently. For example, in Brazil, ethanol and biodiesel have a long trajectory as national fuels, which were initially used to reduce dependence on oil imports during the oil crisis in the 1970s. In later decades, the ethanol and biodiesel industries suffered several political and economic impacts that delayed their full development [10]. Currently, the legislation requires the use of a minimum of 27% ethanol in gasoline and 10% biodiesel in diesel [11], failing to meet previously established targets.
Given the presented context, Ref. [12] highlights the importance of studies involving time-definite policy objectives and their impact on the dynamics of freight systems. The system dynamics (SD) modeling approach is suitable for investigating the effects of policies and strategies over a continuous time in complex systems [13,14]. SD has been a powerful tool for policymakers to predict system changes and future scenarios in different contexts, the most well-known being the Limits to Growth study by the Club of Rome in 1972 [15]. In Ref. [16], the authors were the first to discuss and evaluate the strengths and weaknesses of SD in relation to its suitability and appropriateness for transportation systems modeling, pointing out that it is well suited for modeling strategic issues, supporting policy analysis, and decision-making processes. In Ref. [17], a review of SD studies was presented, categorizing them by area of application in transportation studies and summarizing insights and recommendations for future application of the SD approach in this field. Interestingly, Ref. [17] mentioned just one study related to freight transport and environmental impacts. The discussion about alternative fuel vehicles was kept around the passenger transport system, which shows the lack of sufficient research in freight transport and decarbonization with this approach.
Other literature reviews on specific strategies of transport emission mitigation generally cover only a very particular component of the system or the measures to reduce emissions. SD models regarding alternative powertrain technology, particularly electric vehicles, have been reviewed by Ref. [18], evidencing that the models differ in purpose and assumptions, particularly in relation to consumer choice of powertrains. In Ref. [19], the authors reviewed different modeling approaches, which focused on the interaction of the market diffusion of alternative fuel vehicles and their refueling infrastructure; dynamics for truck fleet change were not considered. Some authors reviewed top-down and bottom-up models for carbon emissions measurement from road traffic [20,21,22,23] and summarized the main factors influencing traffic carbon emissions, including vehicle speed, load, acceleration, and road slope. In Ref. [24], the authors reviewed SD models in developing and implementing urban policies focused on sustainable transportation, specifically the economy, environment, land use, social, and traffic congestion policies for motorized and non-motorized modes. In Ref. [25], the authors provide a review of sustainable supply-chain-management-related SD models, including forward, reverse, and closed-loop supply chains that include environmental or social aspects of sustainability. Interestingly, none of these literature reviews covered the dynamics involved in a broad range of decarbonization strategies for freight transportation. The time dependency of measures and their impacts are modeled in some cases but not explicitly discussed as a component of the policies under investigation.
Considering the importance of decarbonizing freight transport and SD’s contribution to its dynamic analysis, the absence of a review dedicated to this problem motivated this study. The research question is: How have the dynamic aspects of freight transport decarbonization systems been modeled using the system dynamics approach? This systematic literature review aims to identify the feedback responses that have been modeled, how the dynamics have been addressed by SD models so far, and what research is still necessary to improve the representation of decarbonization pathways with SD models.
To accomplish this objective, the remainder of this paper is organized as follows. Section 2 details the methods adopted in this systematic literature review. Section 3 presents the main results according to different decarbonization strategies. Finally, Section 4 sets out the conclusions drawn from this paper and indicates future research directions.

2. Materials and Methods

This paper is based on a systematic literature review focused on studies that evaluate decarbonization strategies for freight transport using an SD approach. PRISMA guidelines were used for the literature review process [26]. The portfolio was built in July 2021 using the Google Scholar database covering the available online journals, unpublished studies, conference proceedings, industry trials, technical reports, and similar publications, with neither time nor geographical constraints. Thus, criteria such as journal rankings were not used for exclusion purposes because this review aims to give a comprehensive overview of the system dynamics models of freight transport decarbonization. Moreover, other databases were not used to avoid repeated papers in the portfolio, considering that Google Scholar makes all electronic resources available [27].
The search procedure was performed using the following keywords: “decarboni*”, “emission”, “freight transport*”, and “system dynamics”. The truncated words were used to obtain their possible variations and different spellings. The search resulted in 980 studies. All repeated studies, books, and non-English materials were removed from the sample. Then, the inclusion criteria were checked by reading all the titles, abstracts, and keywords. Finally, the portfolio of studies to be reviewed and analyzed in more detail was obtained by applying the exclusion criteria. Figure 1 shows the flow diagram of the literature review process based on the PRISMA guidelines [26].
In the first screening step, we applied the inclusion criteria to select papers containing system dynamics models regarding the freight transport sector and emissions issue or decarbonization strategies, which resulted in 740 exclusions and 111 publications being assessed for eligibility. In the second screening step, despite citing freight transport, a few studies were identified concerning passenger transport and were disregarded for review by applying the exclusion criteria. Specific and well-established models, such as ASTRA and ESCOT, were used in many case studies; however, only the studies regarding the models’ development were included instead of all their case study applications. The literature-review-selected papers were already described in the first section. In summary, 50 studies of decarbonization strategies for freight transport using the SD approach remained in the portfolio to be reviewed in the following section.
The papers were identified and analyzed by each decarbonization strategy. Different frameworks support managers and policymakers in conceptualizing and formulating coherent decarbonization strategies to assess various drivers and opportunities for reducing emissions. The green logistics framework [4] was used because it includes a wide range of aspects of freight transport with five strategies: (i) reducing freight transport demand—within the bounds of logistics management, this involves reducing the freight transport intensity of economic activity; (ii) shifting freight to lower-carbon transport modes—taking advantage of the wide variations in carbon intensity between modes; (iii) improving assets utilization—using vehicle and warehouse capacity more effectively; (iv) increasing energy efficiency—reducing energy consumption relative to freight ton–km and warehouse throughput; (v) switching to lower-carbon energy—reducing the carbon content of the energy used in logistics. This framework incorporates diversified approaches in multi-disciplinary green road freight transportation research [28].
Besides the green logistics framework, the TIMBER (acronym for technology, infrastructure, market, behavior, energy, and regulation) framework [4] was also used to identify external forces needed to support the previous strategies. In addition to decarbonization strategies and the necessary external factors to support them, the policy instruments simulated in the SD models were also identified. Four policy categories were considered based on [29]: economic, legal, knowledge-based, and societal instruments. Economic instruments concern internalizing external costs by imposing taxes, charges, fees, tax exemptions, subsidies, etc. Legal instruments are laws, regulations, and norms, such as size and weight restrictions of vehicles, obligation schemes of fuel composition, maintenance, and performance-based standards. Knowledge-based instruments are information and research and development (R&D). Information can influence behavior and knowledge, hence increasing acceptance for other instruments. R&D relates to creating and finding new solutions, such as improving energy efficiency and making transport independent of fossil fuels. Finally, societal instruments are infrastructure investments in alternative modes, carbon-neutral techniques, such as electrical roads, and infrastructure for loading/filling up electric or hydrogen-gas-driven vehicles.
Figure 2 depicts the interactions between external factors, decarbonization strategies, and policy instruments identified in the SD models.
The following section describes the SD models and dynamics of freight transport decarbonization. The dynamic aspects assessed in the SD models included assumptions made to build the feedback loops, causal loop diagrams, stock and flow diagrams, time-related variables, or delay equations. These factors influence the system’s behavior over time and the results achieved in the long term.

3. Results

This section discussed and analyzed the selected papers to construct a view of the state-of-the-art factors in modeling freight transport decarbonization using SD. Table 1 presents the selected studies, their case study, geographic level, simulation period, SD software used, and whether or not the model diagrams (causal loop diagrams—CLD and stock and flow diagrams—S and F) were fully or partially presented.
Table 2 summarizes the classification of the studies according to the green logistics framework, where decarbonization strategies correspond to (1) reducing freight transport demand; (2) shifting freight to lower-carbon transport modes; (3) improving assets utilization; (4) increasing energy efficiency; (5) switching to lower-carbon energy. The TIMBER framework refers to (T) technology; (I) infrastructure; (M) market; (B) behavior; (E) energy; (R) regulation, and policies are related to (ECO) economic; (SOC) social; (LEG) legal; and (KNL) knowledge-based instruments.
Table 2 presents the decarbonization strategies considered in each study, highlighting one of the major impacts. None of the studies simultaneously addressed the five decarbonization strategies.
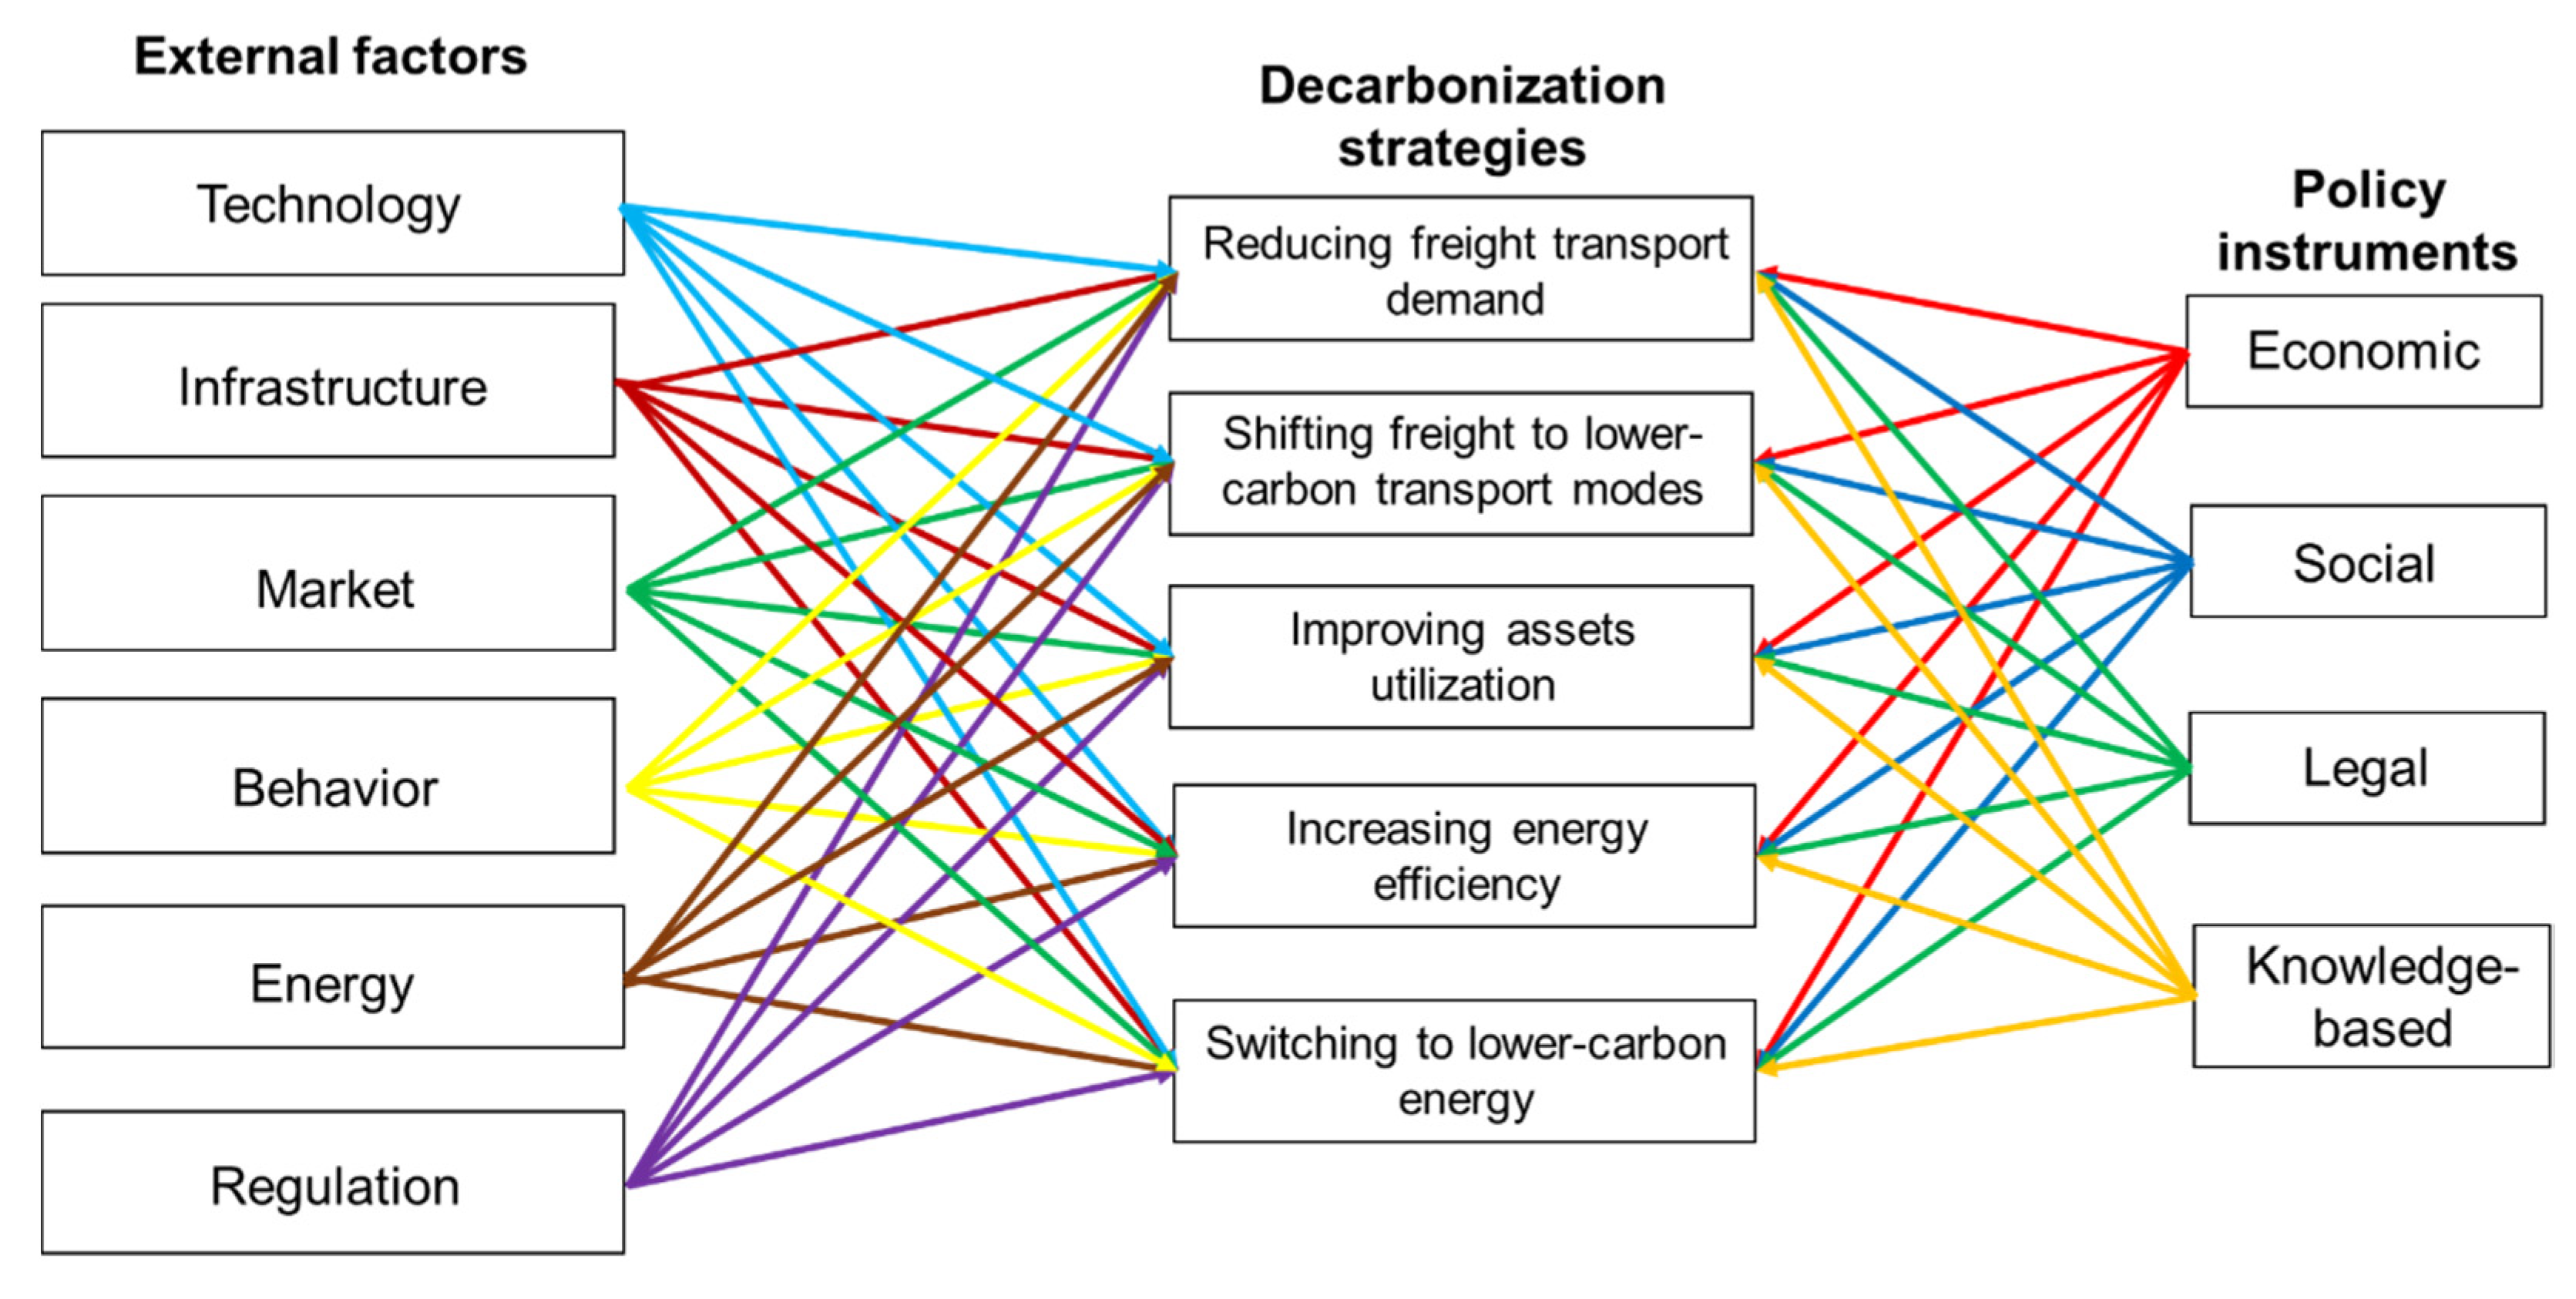
The most common decarbonization strategy for freight transport considered in the SD models is mode shift, with 15 models concerning this measure and 11 studies considering it a secondary option. Analyzing external forces, a high dependence on the infrastructure factor to implement this strategy can be observed. Social policy regarding infrastructure investments is usual among these models, although other policies are also applied, such as economic incentives, taxation, technologies, and legal requirements.
The second most common decarbonization strategy addressed by 13 SD models is alternative fuels, with the other 7 models considering this measure in conjunction with different strategies. As expected, the principal external forces needed to implement this strategy are technology and energy availability, although infrastructure availability and market acceptance are also of concern. The policies simulated in the models are mostly related to economic incentives (subsidies for alternative fuels, taxes on fossil fuels, and others) and knowledge-based investments in the R&D field. Social and legal policies were also found regarding refueling/recharging infrastructure investments and obligation schemes, such as blend targets (i.e., biodiesel with diesel).
Vehicle and asset utilization appears in eight SD models, and seven studies cite this as a secondary decarbonization strategy. Behavior is the main external force supporting this strategy. It depends on the business culture and willingness to establish partnerships for sharing assets, logistics centers, warehouses, transport infrastructure, load optimization, and consolidation. Policies simulated in the SD models include economic incentives to improve efficiency and encourage companies with financial benefits. Infrastructure and technology investments, as well as legal requirements, were also considered.
Reducing or managing the freight transport demand is the decarbonization strategy of 10 SD models and appears in 4 other studies as a secondary measure. The external force that supports this strategy is market acceptance, as freight transport demand is highly related to consumption patterns and prices that will affect demand according to the price elasticities of each product category. The policies simulated are related to economic measures, increasing fees and transport costs, reducing goods and transport demand, and knowledge-based instruments, for instance, simulating the impacts that information and communication technologies will have on freight transport demand.
Lastly, 4 SD models presented the strategy of improving vehicle efficiency, with 14 other studies considering it secondarily. Similarly to alternative fuel promotion, the implementation of this strategy requires the availability of technology and energy as external forces. Market acceptance, infrastructure, behavior, and regulation are of minor concern in these models. Simulated policies include knowledge-based instruments with technology investment, social instruments with infrastructure investment, and economic instruments with both incentives to adopt innovation and discourage old and outdated technologies.
The following subsections are related to the specific decarbonization strategies of the green logistics framework, describing the main impact on mechanisms and pathways, including how models deal with dynamics aspects.

3.1. Reducing Freight Transport Demand

Reducing the freight transport demand requires a range of processes to minimize the physical amount of goods to be delivered, such as material efficiency, including making products last longer, recycling, digitization, designing products with less material, and postponement of product customization [4]. Other measures can include price increases, which affect transport demand according to cost elasticity. Table 3 summarizes the SD models’ objectives, policy elements, contributions, and limitations for reducing freight transport demand.
The models differ in terms of boundaries delimitation, inputs, and outputs. Consequently, distinct structures of causal loop diagrams or stock and flow diagrams were found according to their goals. In Refs. [43,51], the authors assessed the rebound effects of efficiency gained with information and communication technologies over freight demand stimulation, which counterbalances or even outweighs positive environmental benefits.
As people get used to traveling more and having access to more goods due to gross domestic product (GDP) improvement, the social norm increases, influencing travel and consumption in a reinforcement feedback loop [45]. Moreover, as fleet efficiency increases, travel costs decrease, leading to a rebound effect on transport demand. On the other hand, road congestion limits the growth in transport demand. A high volume of urban transport will lead to more traffic and reduce environmental quality [56]. It would require legal regulations (e.g., higher taxes) to reduce transport demand. On the other hand, if the freight transport volume is high, the efficiency of logistics operations is likely to grow, improving economic performance and increasing freight transport demand.
In Refs. [74,75], the authors modeled the interdependencies of relevant stakeholders in the freight transport market. The main focus was on decision processes regarding freight demand (e.g., private households, retailers, and shippers) and the resulting freight transport demand of the logistics service provider, which affects freight transport volume, traffic, and environment problems at an urban level. According to Ref. [30], the increase in fuel price affects per capita income, thereby reducing vehicle purchases. However, due to population increase, positive economic growth, and annual investment in road infrastructure, changes in the fuel price are not sufficient to reduce transport demand.
According to Ref. [50], CO2 emissions are related to the urban freight volume powered by e-commerce. Their assumptions show that the urban freight volume will directly influence GDP, leading to higher product consumption, and e-commerce orders will likely increase, affecting urban freight volume in a reinforcing feedback loop. These factors will induce greater energy consumption and CO2 emissions, increasing urban logistics transport costs through the internalization of a carbon tax, resulting in a demand decrease.
The GDP increases transport investment, which will decrease traffic congestion, energy consumption, and emissions, leading to an improvement of GDP [79]. Moreover, the increasing population will decrease GDP per capita, reducing the number of private cars, traffic volume, energy consumption, and emissions. It was also assumed that population growth would increase the use of non-motorized travel [79], which is debatable, since slow modes depend on land use and suitable infrastructure. In Ref. [54], the authors assessed the dynamics between product prices and freight demand. The authors argued that the mark-up variation might further lead to an increase or decrease in prices, causing an inverse effect on the product demand, which is also influenced by logistic costs.
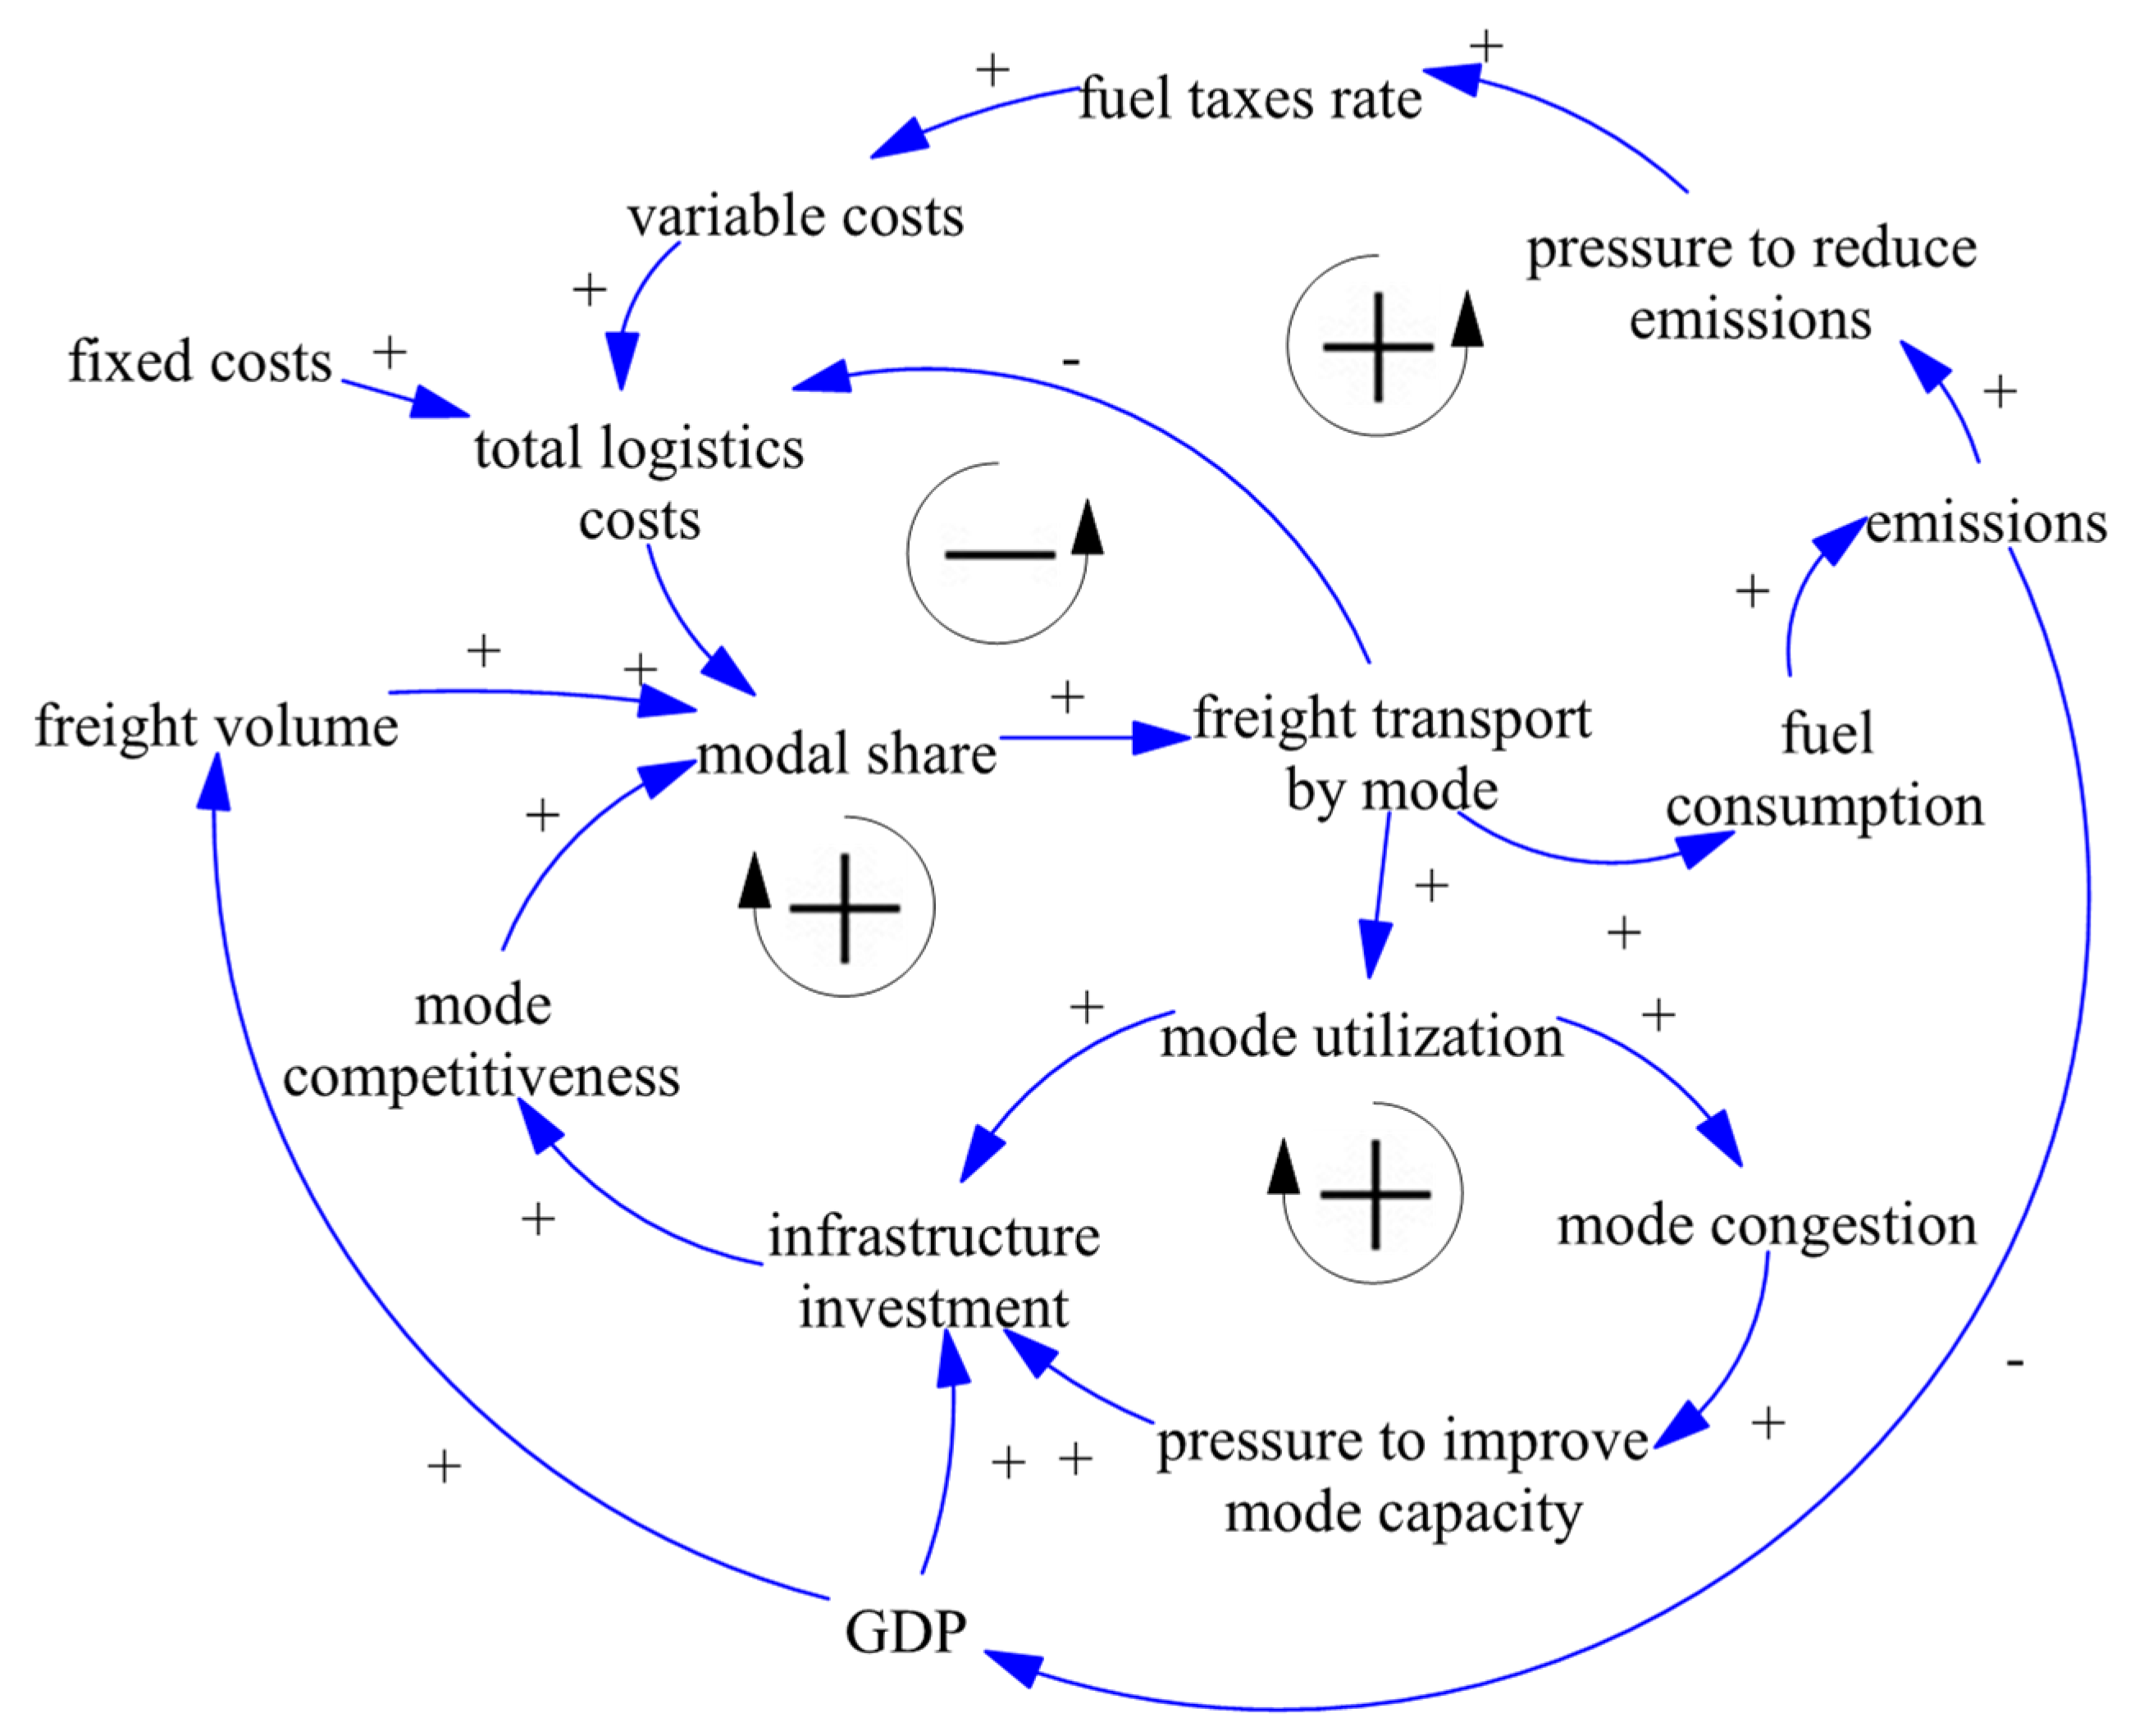
Despite the differences found in the presented literature, some usual variables and assumptions can be highlighted regarding the dynamic relationships in freight transport demand modeling that form the feedback loops in Figure 3. In a summarized form, emissions are affected directly by fleet efficiency and fuel consumption. Fleet efficiency depends on environmental regulations balancing freight emissions. However, fuel consumption varies according to transport demand, which is affected by other feedback loops, including those with delay effects.
Regarding the quantitative and simulation aspects, most of the studies did not present the model equations, except for Ref. [79], which makes it challenging to analyze, replicate, or apply the models. Moreover, there is no information about integration techniques or time steps used. Another difficulty is the identification of delays. Although some delays are represented in the diagrams (arrows with hash marks), their estimations were not provided. Other relevant measures, such as the internalization of emission costs, are supposed to take some time to be implemented; however, their delays were not even pointed out in the diagrams. The discussion about time responses, an essential dynamic aspect, requires better exploration.

3.2. Shifting Freight to Lower-Carbon Transport Modes

It is important to increase the performance of railway, waterway, and combined multimodal transport in terms of the comparable price, quality, service, and flexibility of roadway transport to increase the use of alternative modes. Using synchromodality that focuses on optimal and flexible use of multiple modes is expected to contribute to this solution area [80]. Table 4 summarizes the SD models’ objectives, policy elements, contributions, and limitations for shifting mode modeling.
Analyzing the SD diagrams of the models regarding shifting freight to lower-carbon transport modes, their boundaries, variables, and interrelations that form the feedback loops or stock and flow structures can be identified.
The system dynamics model for economic assessment of sustainability policies of transport (ESCOT) was developed by Ref. [68] to assess the economic impacts of a sustainable transport system, considering macroeconomic, regional economic, transport, environmental, and policy aspects. The SD diagrams were not provided, but the results show that the growth of freight transport tends to be absorbed by rail and ship transport, since these alternative modes are attractive enough.
In Ref. [49], the authors evaluated CO2 emissions, considering factors that affect the modal share, such as freight volume, network length, fuel price, and fuel intensity. However, no information regarding the dynamics of changes in the system was provided, compromising the interactions between policies, mode choice, and emission mitigation discussions. Additionally, the modal share modeling does not consider the mode’s capacity and its influence on the mode choice.
In Ref. [40], the authors analyzed the modal shift process, driven by investment in the modes’ capacities. As the mode shift increases demand, it was assumed that increasing the competitiveness of the mode used would reinforce the mode shift. According to the authors, the inertia for the modal change is long; however, it was not evidenced how the pressure and policies to shift modes were quantified. The time to promote modal shift is randomly assumed as two years. However, its endogenous impact was not demonstrated, thus raising the question of how fast other decisions and actions must occur to achieve a good balance of modal share.
In Ref. [57], the authors explored strategies for emission reductions and determined the barriers to the mode switch, taking into account company types, decision-making behavior, generalized cost by mode, reliability, functionality, dynamic fleet model, and bands of high-, medium-, and low-cost interventions. The model was then applied, and the results show that there is more perception of reliability than cost changes [58]. The relationship between price and mode shift is not linear, capturing different companies’ responses, including their tolerance of cost increases, the time lag to implement the mode shift due to contractual considerations, and the need for implementing new systems.
In Ref. [77], the authors simulated the modal shift from road to rail through increased investments in the rail network. The benefits of this shift would include the reduction in trucks using the road network, better pavement conditions, and road safety. Such a transition would require significant investment to upgrade and maintain the rail track. The dynamic relationships could not be analyzed, since the SD diagrams were not provided.
In Ref. [33], the authors analyzed the emissions from the vehicle fleet on intercity highways. The scenario devoted to freight was to reduce vehicle kilometers traveled by increasing fuel price, promoting mode shift, and educating drivers to plan their routes and schedules. Therefore, this study does not provide the impact of the isolated freight scenario in freight transport demand reduction and emissions mitigation. The model description does not show the feedback loops described, and there is no clear relation between the fuel price and the average distance traveled. Moreover, it is not clear how assumptions or time lags for mode shift and route planning were designed, compromising policy evaluations.
The impact of policy measures on promoting the modal shift from road to rail, such as the increased road cost and containerization, was also examined [39]. Increases in the imposition of taxes generally cause an increase in the total logistics cost of road transport. In contrast, containerization causes a decrease in the entire logistics cost of intermodal transport. The rate to implement the policy measures was not provided, but the results showed that the modal shift by containerization occurred more rapidly than by all kinds of road taxation.
The mode shift and sustainability of urban transportation were analyzed by Ref. [42]. The model assumes that the increasing economy leads to more freight volume, truck trips, and vehicle kilometers traveled, which increases congestion, delivery travel time, and emissions, all impacting economic development. However, the increasing economy also leads to more rail investments; then, the truck trip is reduced together with vehicle kilometers traveled, congestion, delivery travel time, and emissions, resulting in better economic development. The results show that the high-density development of the rail network leads to the best performance of urban transport sustainability.
In Refs. [60,61,62], the authors evaluated modal shift policies to eliminate overloaded trucking. According to the initial modal share, the freight volume by mode is converted into the modal traffic, impacting congestion levels and transport time and determining the next modal split. The results show that the modal shift increases sustainability. However, the reduced freight volume of highway systems would make highway carriers react, e.g., reducing trucking prices to compete with railway transport. Further studies could address the gaming processes of multiple stakeholders.
In Ref. [52], the authors simulated logistics activities integrated into passenger rail networks. The growth of the rail network improves its competitiveness and market share. External benefits stimulate more investment and subsidies, which accelerate the modal shift. On the other hand, negative impacts, such as job reductions and decreases in fuel tax revenue, decrease the investments. Although dynamics have not been analyzed, the results show that the railway system mitigates emission costs.
In Ref. [76], the authors explored the decarbonization goal, considering that economic development increases transportation demand and provides funds for infrastructure construction. The gap between supply and demand restricts the economic level, leading to more infrastructure investments increasing transport supply. It was also assumed that economic development guarantees technological investment, improves transportation efficiency, and reduces energy consumption using alternative modes and technological innovations. The results indicate that the mode shift is the most significant measure, although time lags were not taken into account.
In Ref. [53], the authors simulated the mode shift by levying taxes on carbon emissions. The increasing economy leads the government to invest in railway freight transport. The government also imposes a carbon tax based on CO2 emissions, encouraging the modal shift, promoting the demand and growth of railway freight transport revenue, thereby raising the economy level and reducing road transport demand and CO2 emissions. The policies investigated have a positive effect on reducing emissions; however, exceeding the carbon levy rate will cause the transfer of short-distance trips from road to rail. This result indicates that the model could be improved by considering other relevant factors, such as trip distance and freight flow. Moreover, no time lag was mentioned for the mode shift, although the companies’ resistance, time for adaptation, and inertia play a role in the mode choice process.
Despite the differences presented in the literature, some common variables and feedback loops that rule the dynamic relationships in shifting freight to lower-carbon transport modes can be highlighted, as shown in Figure 4. In this case, emissions and fuel consumption depend on the mode used, according to the modal share. Factors influencing modal share include logistics costs, freight volume, and mode competitiveness. Economic development and pressure to reduce emissions also play a role in the feedback loops.
Some studies only presented the main equations (not detailed) of their models [33,39,40,43,52,53,60,61,62,76], making it challenging to analyze, replicate, or apply them. Moreover, there is no information about integration techniques or time steps used. Regarding the delays, no information was found; despite pressure to reduce emissions, the pressure to improve mode capacity, infrastructure investment, and fuel taxes may take time to be implemented. A general lack of discussion about the dynamic aspect of policy impacts in all mode choice SD models was found, i.e., how quickly or slowly the systems may change over time to achieve the results in a specific time.

3.3. Improving Assets Utilization

Optimizing assets utilization accommodates more freight transport demand with the same infrastructure and capital investment. It can be achieved through load optimization and consolidation, asset sharing, and better management of logistics centers, warehouses, and transport infrastructure. Transport predictability and flexibility are important enablers for this solutions area [80]. Table 5 summarizes the SD models’ objectives, policy elements, contributions, and limitations for improving vehicle utilization modeling.
Different assumptions can be identified by analyzing the SD diagrams of the models, their variables, feedback loops, and stock and flow structures. In Ref. [41], the authors evaluated the impacts of longer, heavier vehicles (LHVs) on emissions. For the market entry of LHVs, adaptation processes in logistic sectors have to take place. An unavoidable delay between legal permission and full market penetration occurs. This delay is longer for railways, since more complex logistics processes must be refined. The results show that depending on the rail freight demand and costs by transport unit, the modal shift may take place from rail to road, undermining CO2 reduction gains. However, the discussed delays for the logistics adaptation process were not estimated.
In Refs. [31,
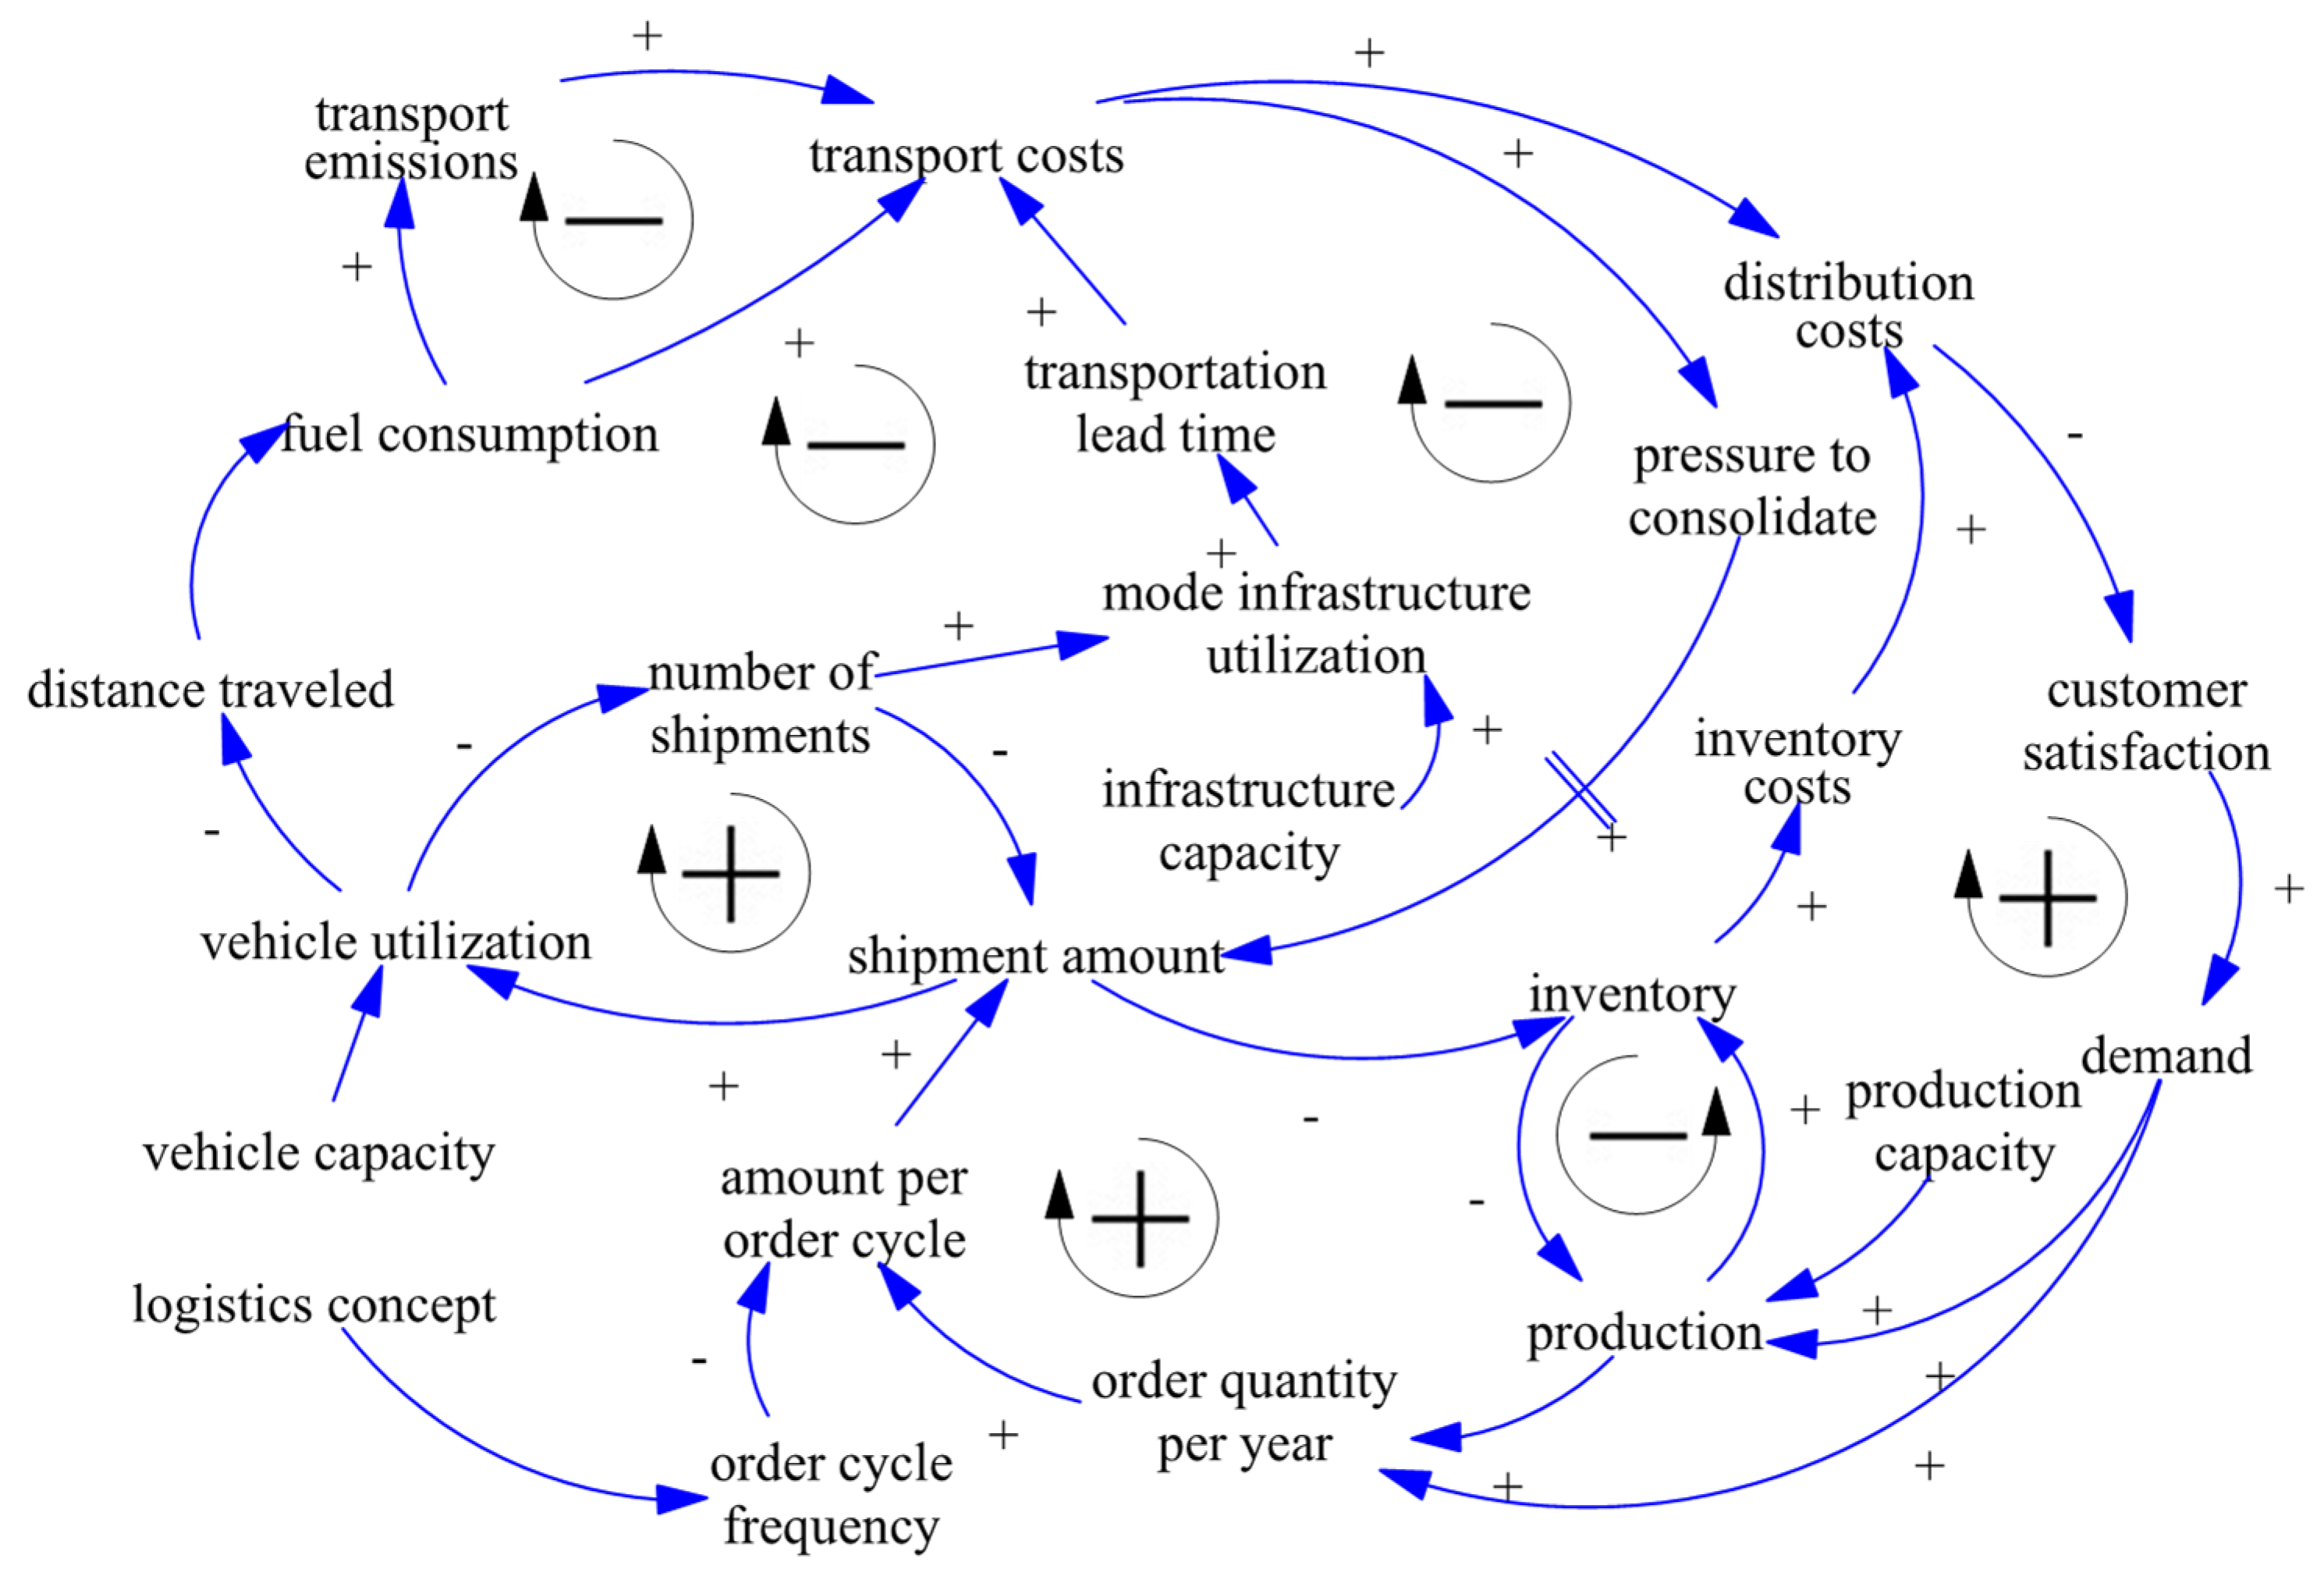
32], the authors modeled logistics strategies toward more efficient transport operations and higher utilization of trucks. The shipment amount is influenced by the operating logistics concept (i.e., just in time), which affects the order cycle frequency and the amount per order cycle. Small shipment amount means a low utilization of trucks, which influences the transport distances traveled, the fuel consumption, emissions, transportation costs, and the pressure to consolidate. If consolidation pressure increases, the shipment amount also increases, which takes time, as companies have to identify consolidation potential. This response time has to be further explored.
CO2 emissions for inbound and outbound logistics based on shipment consolidation technique in an automotive assembly line were simulated by Ref. [65]. CO2 emissions were calculated based on the total number of trips made by inbound and outbound transport vehicles and the type of fuel used. However, the shipment consolidation policy and the assumptions about how it should be implemented (i.e., increasing load factor and vehicle capacity) were not presented.
The effects of alternative truck weight regulation policies on the sustainability of a highway freight system, considering economic and social costs including pavement maintenance, traffic accidents, and emissions, were evaluated by Ref. [59]. Three levels of weight regulation policies were considered. The best policy varies according to the importance of social costs. The model presents neither the SD diagrams nor the equations, delays, or time lags between policy implementation and results.
In Ref. [73], the author considered that an increase in the truck–freight demand increases emissions, which are estimated based on the total transportation volume of each truck type (light, medium, and heavy) and the carbon density over the traveled distance. The freight volume and carbon emissions target are time dependent, but the discussion about how the change occurs over time was not provided. The results suggested increasing the use of medium and heavy trucks. Further exploration of whether large or heavy trucks can replace light trucks is necessary.
In Ref. [63], the authors explored the sustainability of last-mile logistics with different distribution strategies. The centralized distribution case is profitable due to increased demand, while the operational and environmental costs increase. In the home delivery case, the emissions will be more significant, given a substantial increase in customers, increased transport distances, and a higher truck emission rate. The distributed network system considered crowd logistics operations relying on a sharing economy model, in which pollution will not increase sharply compared to previous options. The time that companies take to change their distribution strategies should be further explored.
In Ref. [48], the authors analyzed freight flows in a distribution chain based on inventory and transport costs. The logistic decisions are taken at the supply chain level, as the choice of loading vehicle rates and order cycle frequency is generally taken lightly by the companies, whereas they influence distribution costs, transport demand, fuel consumption, and emissions. Low truck utilization involves a high number of shipments, which increases road use, reduces average speed, and increases the lead time and transport costs, impacting customer satisfaction, demand, and the order quantity per year.
Figure 5 presents the usual variables and feedback loops that rule the dynamic relationships in the models related to the improvement of asset utilization. The logistics concept of the supply chain dictating the order cycle frequency and amount per order cycle, the distribution costs impacting customer satisfaction and demand, and the pressure to consolidate are some of the key variables forming the feedback loops. Fuel consumption and emissions are influenced by distance traveled, which depends on vehicle utilization.
Regarding the quantitative phase of the SD models, the authors in Refs. [32,63] presented the model equations in detail, and in Refs. [59,73], the authors presented some main equations, while the other studies did not provide them, showing a lack of transparency. Integration techniques or time steps used were not revealed. The only delay reported (but not quantified) was between the pressure to consolidate and the shipment amount. In contrast, uncertainties may exist related, for example, to customer satisfaction and the influence of emissions on transport costs, which requires the internalization of external cost processes. Such dynamic aspects should be further investigated.

3.4. Increasing Energy Efficiency

Increasing vehicle efficiency involves using cleaner and more efficient technologies, fleet renewal, and driving behavior/eco-driving, among other measures. An increase in the variety of technologies reducing CO2 emissions in heavy commercial vehicles is expected; however, this market implies multiple stakeholders, which considerably affects market dynamics. Table 6 summarizes the SD models’ objectives, policy elements, contributions, and limitations for increasing energy efficiency modeling.
Analyzing the SD diagrams of the models related to increasing energy efficiency and their variables, feedback loops, and stock and flow structures, we can identify different assumptions made to model the system under study. In Ref. [55], the authors simulated the diffusion of alternative fuels and drives within the truck market. There is a common link between the cost of trucks and their adoption, influencing the manufacturing costs via economies of scale. Investing in new technology is driven by economic forces considering the investment, maintenance, fuel, toll, taxes, and refueling costs.
In Ref. [69], the authors also analyzed the diffusion of technologies reducing CO2 emissions in heavy commercial vehicles. The study identified that customer preferences change with gaining market shares of innovative technologies. Therefore, the adoption decision impacts the organization by influencing the social network, supplier’s efforts, governmental regulation, and the energy supply system. The causal loop diagram presents delays between some variables, such as governmental regulation, station construction, and market share, although they are not adequately discussed in the study.
In Ref. [70], the authors modeled the penetration of alternative powertrain technologies to the heavy commercial vehicles market. The model presented some market dynamics and highlighted the sensitive factors of the diffusion process. However, there are several limitations due to missing dynamic empirical data.
In Ref. [46], the authors interrelated the regional ship emissions, economic growth, and sustainable ecosystem development. Although the causal loop descriptions do not characterize feedback loops, the model provides assumptions that determine its behavior, divided into five sub-systems: shipping, energy, environment, economic, and policy components. The results show that ship speed should be suitably reduced to achieve more significant economic and environmental benefits. The model’s limitations include a lack of proper validation and uncertainties in the variable equations and parameter values.
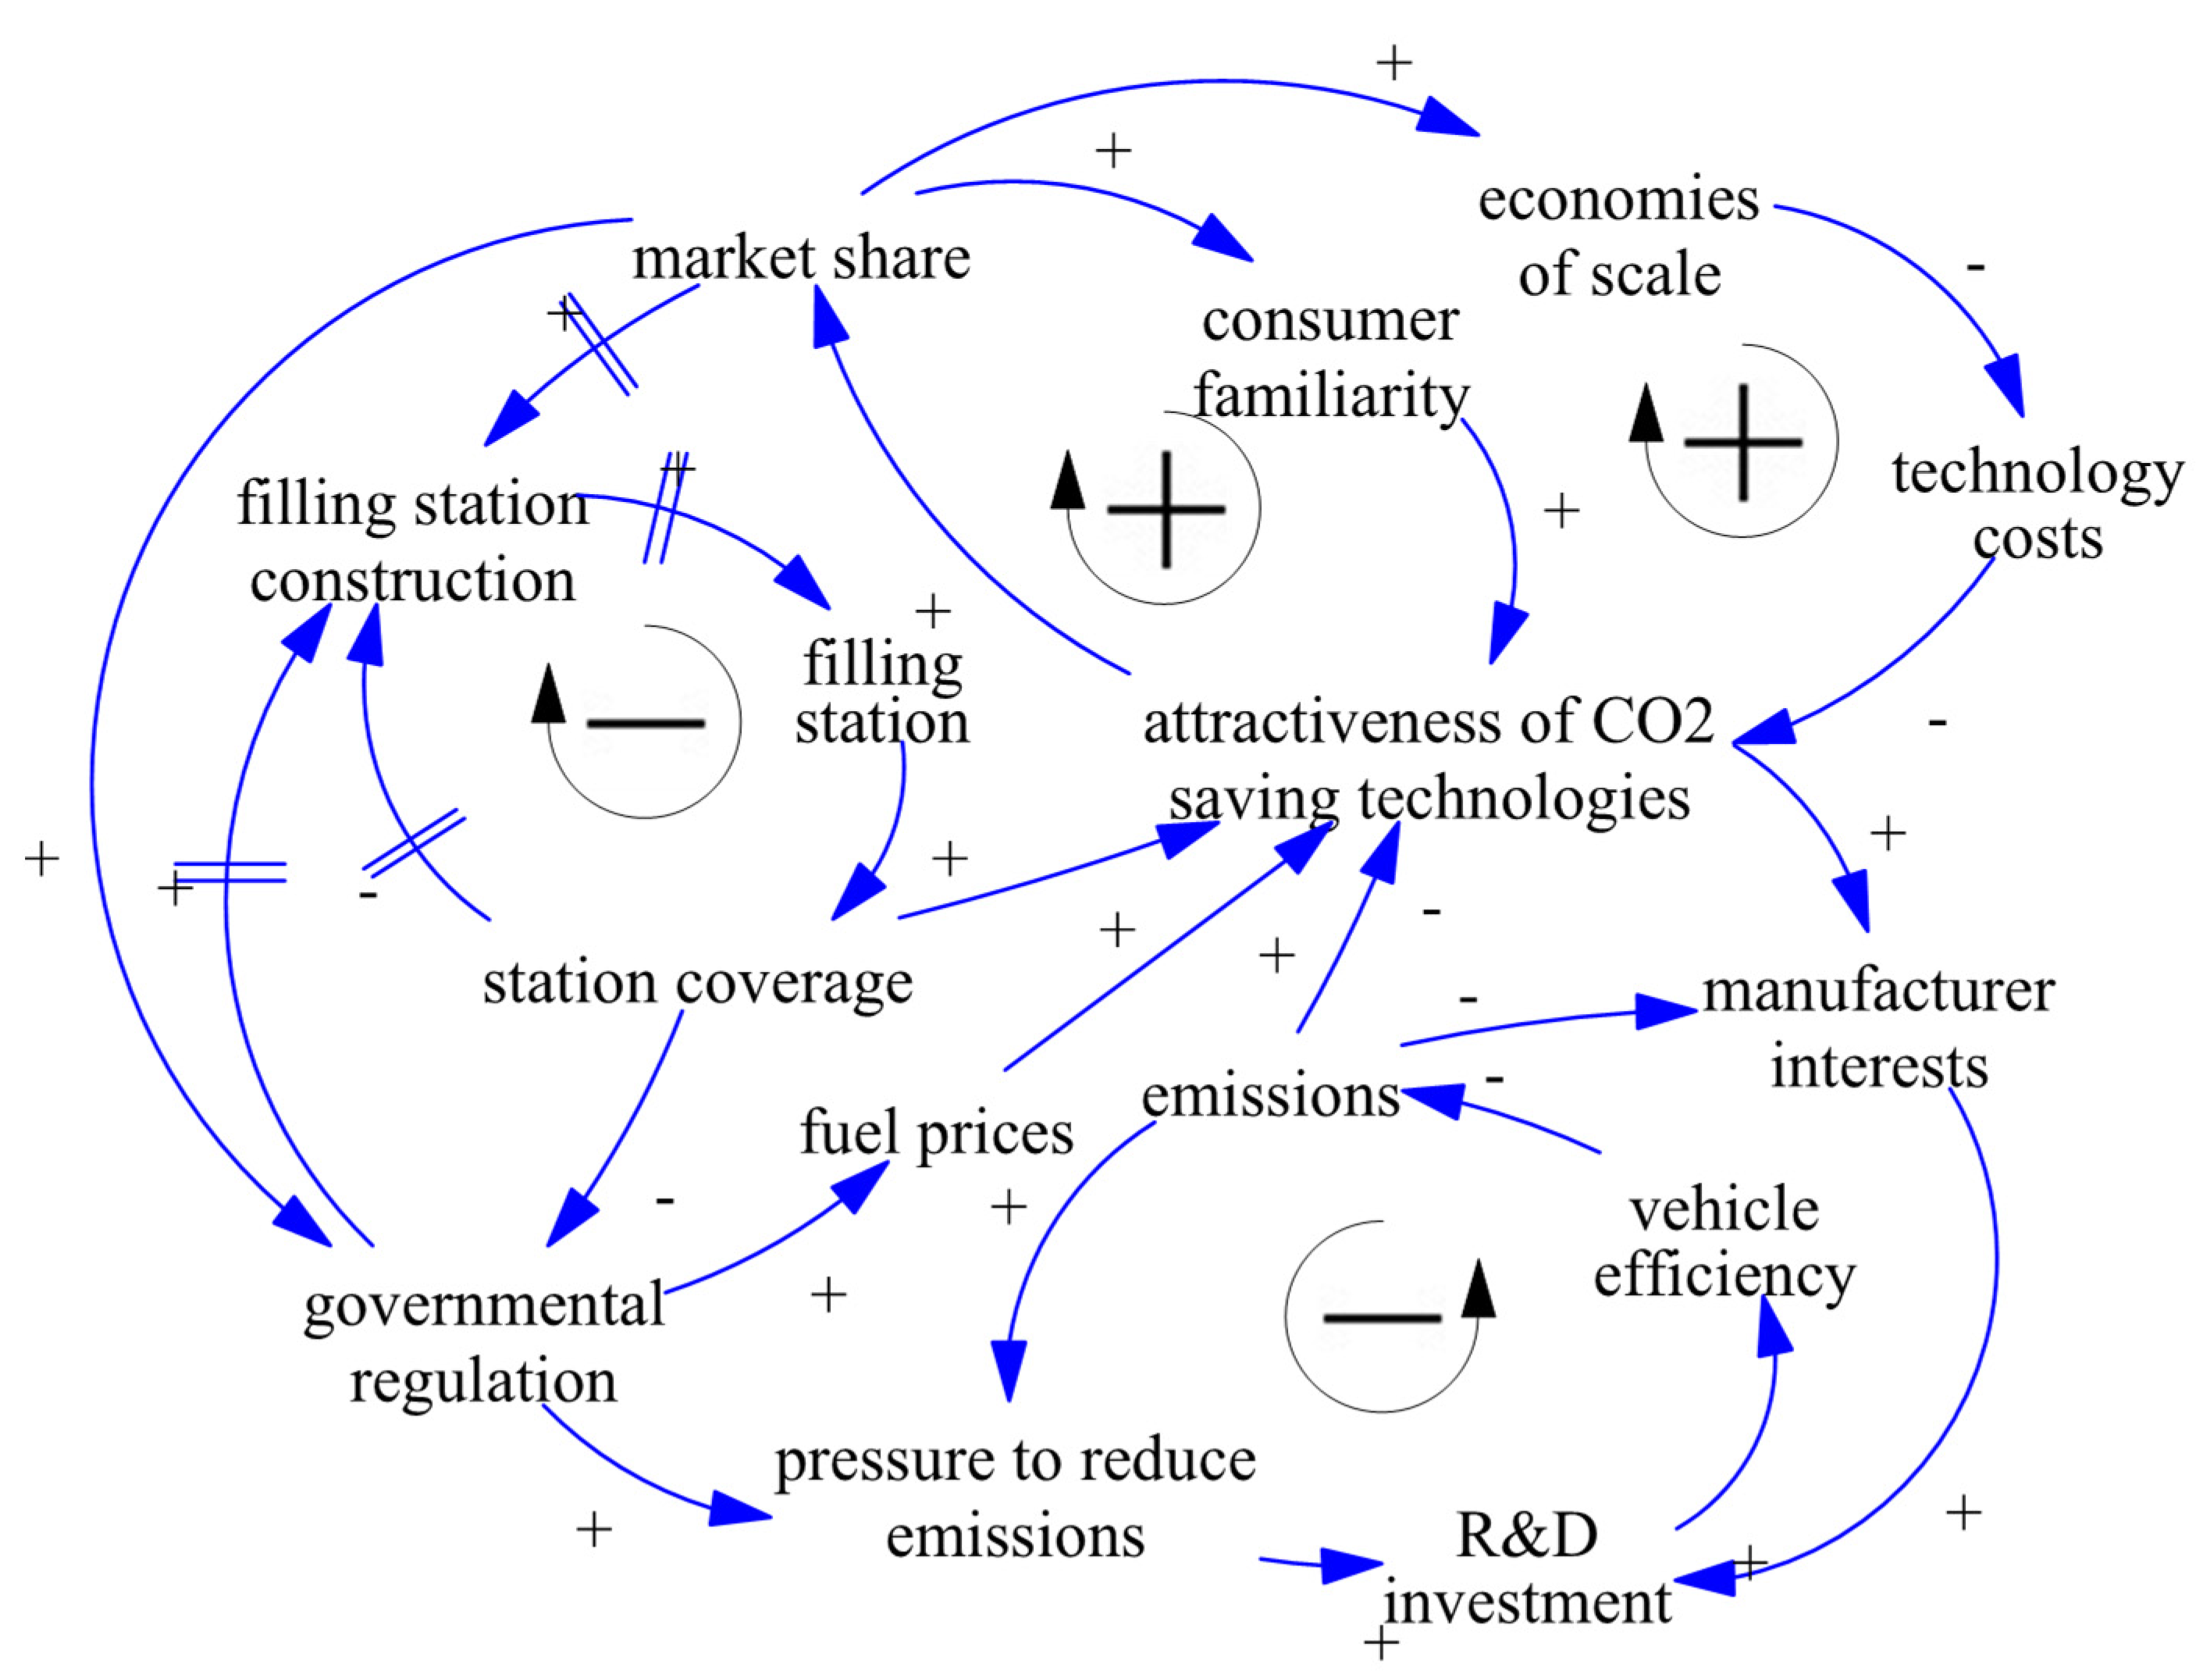
Figure 6 presents the common variables and feedback loops that rule the dynamic relationships in the models related to increasing energy efficiency. R&D investment, influenced by both manufacturer interests and pressure to reduce emissions, increases vehicle efficiency and reduces emissions. The attractiveness of CO2-saving technologies considers different factors, such as technology costs, consumer familiarity, refueling station coverage, and fuel prices.
In the quantitative phase of the SD models, only Ref. [69] did not provide the equations, while the other studies provided some of them. Moreover, there is no information about integration techniques or time steps used. The diagrams represent some delays, although their estimations were not provided. Decisions related to the fleet renewal process and adoption of alternative technologies may take significant time to better investigate in future SD models.

3.5. Switching to Lower-Carbon Energy

Achieving deep carbon reductions will require a significant shift from fossil fuels to renewable energy. In this solution area, the focus is on reducing the carbon content of energy sources. The available options include using cleaner and lower-carbon fuels, such as biofuels, blended fuels, hydrogen, and electrification that ideally uses renewable energy, whose adoption will have significant challenges related to politics, economics, collaboration, awareness of technologies and methods, investment in renewable energy, acceptance of new technologies by societies, and type of governance [81]. Table 7 summarizes the SD models’ objectives, policy elements, contributions, and limitations for promoting alternative energy sources.
Different assumptions were identified by analyzing the SD diagrams, their variables, feedback loops, and stock and flow structures. In Ref. [44], the authors presented the assessment of transport strategies (ASTRA) model to assess energy scarcity, high oil prices, and technological investments in the transport sector, besides simulating transport taxation, infrastructure investments, incentives to accelerate fleet renewal, and increases in fuel prices. The typical results are projections of transport demand, CO2 emissions, and the evolution of vehicle fleet. However, the model structure is not presented; therefore, it is impossible to analyze its structure and feedback loops.
In Ref. [66], the authors presented the global scale system dynamic simulation model for transport emissions (GLADYSTE) to estimate the impacts of policy and technological measures in transport-related sectors. The scenarios include new technologies, fuel quality, fiscal instruments, and traffic management policies. However, the SD diagrams and equations were not provided, making it unfeasible to replicate the model, evaluate the behavior or the assumptions between variables and the feedback loops, the delay equations, or the use of time-related variables.
In Ref. [72], the authors modeled the interdependencies between the energy supply sector and road transport energy demand. The findings show that rising fossil fuel prices, carbon taxes, and investing in alternative fuel supply could reduce emissions. However, more stringent policies will be necessary for a carbon-neutral scenario, such as efficiency improvements, travel demand management, vehicle technology shifts, and fuel switches.
In Refs. [36,37,38], the authors modeled the diffusion of a city logistics system based on electric and hybrid vehicles. The size of the fleet depends on freight demand, vehicle capacity, and load factor. The lower operating costs of alternative technologies generate savings and reinforce their adoption. However, the greater the number of vehicles, the more investment is needed, negatively affecting their purchase.
In Ref. [64], the authors evaluated low-carbon strategies for the transport sector by using the SD model of for future inland transport systems (ForFITS). This model estimates the demand for each transport mode based on GDP, population, economic growth, price inflation, and other analyses. Policies adopted for freight transport include improving fuel efficiency and promoting the use of biofuels. The substitution of less efficient vehicles may occur slowly over time, although such delay was not addressed.
In Ref. [47], the authors also employed ForFITS to estimate fuel use and emission reductions from electrified trucks and electric railways. Increasing the share of plug-in hybrid electric and fully electric trucks would reduce energy use and emissions, but it would not be enough to reverse current demand growth trends. Increasing the share of rail transport would lead to an additional reduction, while combining both mitigation options indicates the highest savings. This solution comes at the cost of providing the necessary electric charging infrastructure and clean energy mix to operate these vehicles effectively, which may not occur as quickly as desired.
In Refs. [34,35], the authors analyzed CO2 emission mitigation in the road transport sector in response to social, economic, technical, and policy changes. Fuel consumption depends on fuel type, vehicle type, and distance traveled, while CO2 emissions depend on fuel consumed and emission factors. No single policy instrument could reduce emissions significantly, and a broad portfolio of policy measures is needed. SD diagrams were not provided, making it difficult to evaluate model structures and the assumptions made for the system’s dynamic behavior over time.
In Ref. [71], the authors analyzed the road transportation sector’s energy consumption and CO2 emission reduction. Policies simulated fuel economy standards through efficiency improvements, mode shift from road to rail, and adoption of electric vehicles. Electric vehicle adoption is a good alternative, although the optimal result should include a mix of policies to reduce emissions. The paper does not provide the feedback loop descriptions and does not mention the assumptions made regarding the time responses from policy implementation to result achievement.
In Ref. [67], the authors evaluated the impact of the railway electrification system. One dynamic factor included in the model is financial stability, which is very difficult to achieve, as railway operations require a lot of resources and an even flow of transport. At the beginning of the railway operations, there may be unavoidable delays, which will slow down the freight flow and lead to potential delays in investment return. The cost and the time of changing the locomotives were also considered. The electrification of railways has considerable potential to reduce emissions from the freight transport sector, helping to achieve climate targets, although the mentioned delays were not assessed.
In Ref. [78], the authors analyzed the city logistics system, the policy-making process, and its connections to operational and economic factors. The level of emissions was analyzed considering policies promoting electric vehicles. As CO2 emissions rise, the financial incentives for green vehicles increase, making them more attractive to absorb transport demand. However, the model does not include technical issues, availability of charging stations, and time responses of policies related to alternative fuel adoption.
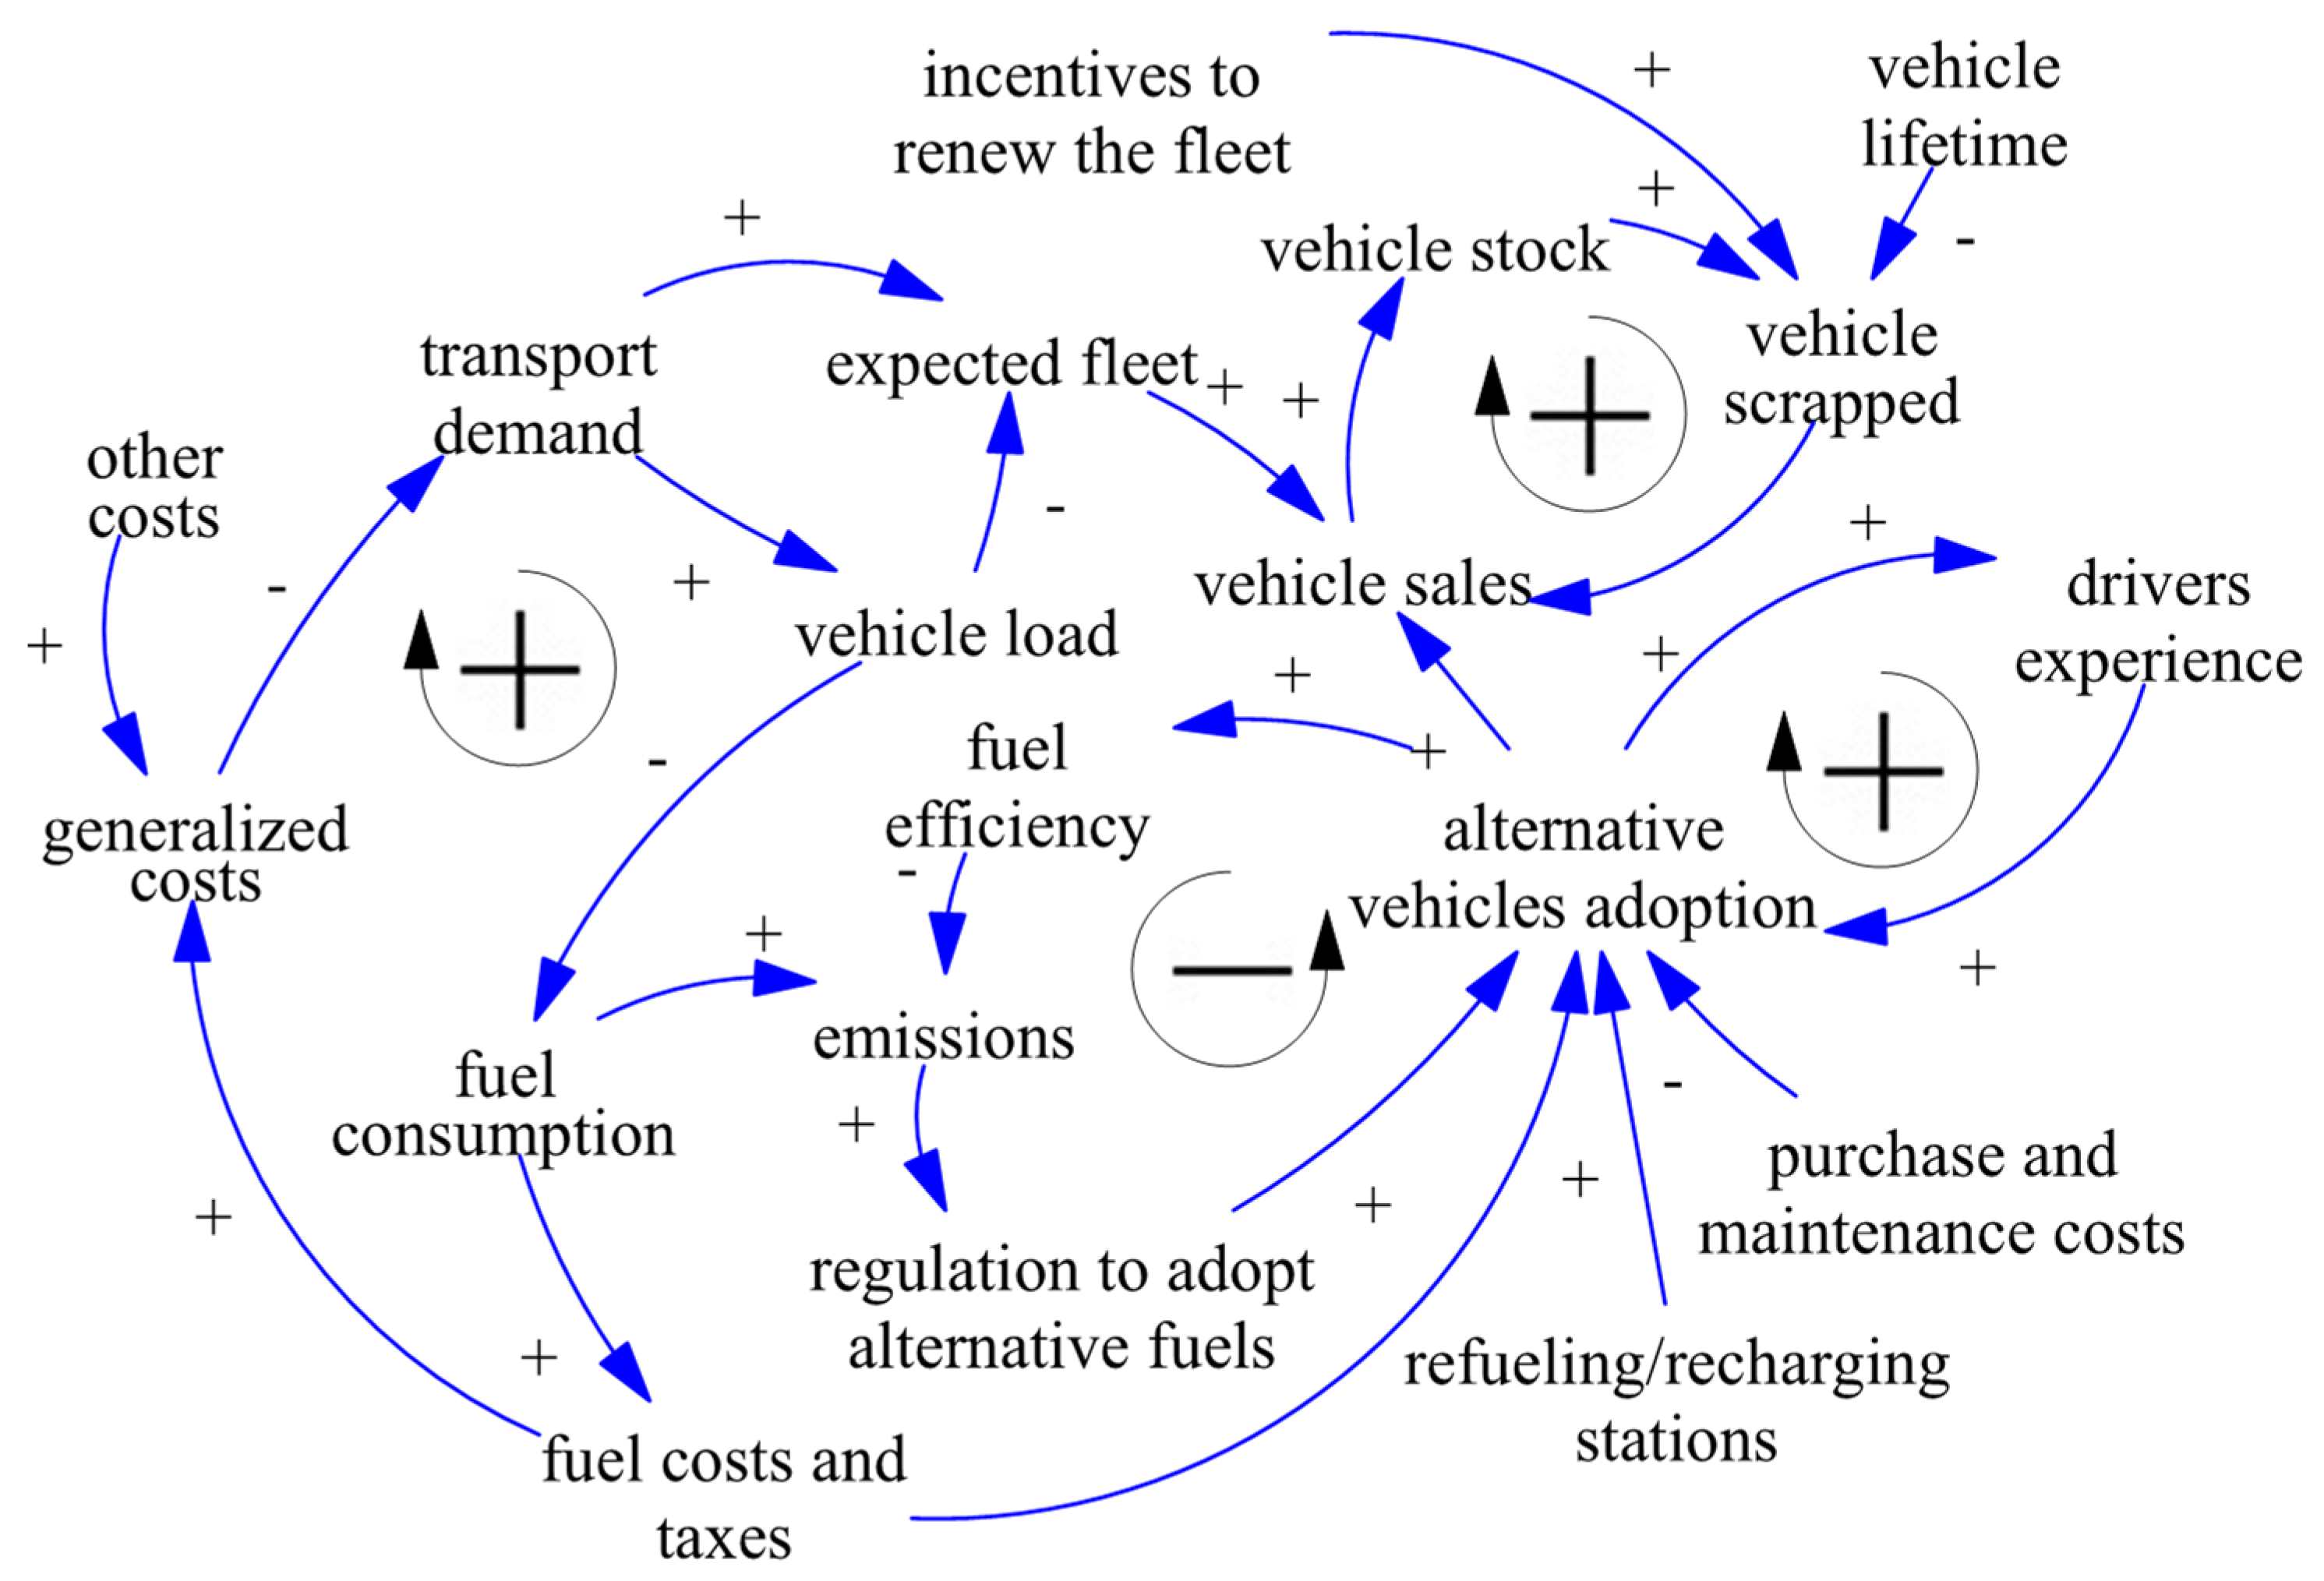
Figure 7 shows the common variables and relationships that form the feedback loops in the SD models related to alternative fuel adoption. Emissions depend on fuel consumption and efficiency, while alternative vehicle adoption takes into account regulations, fuel costs, refueling and recharging station availability, purchase and maintenance costs, as well as drivers’ experiences. On the other hand, transport demand and vehicle load lead to an expected fleet, influencing vehicle sales, while incentives to renew the fleet are another option to scrap polluting old vehicles and adopt alternative green technologies.
Most studies did not present the model equations in the quantitative phase of the SD models, while one study showed them entirely [38], and three studies [35,72,78] presented only the main equations. Integration techniques or time steps used were not disclosed. Any delay was discussed or represented in the models, although implementing regulations to adopt alternative fuels, incentives to renew the fleet, or drivers’ experience consolidation may not occur instantaneously. In general, there is a lack of discussion about the time responses related to policy enforcement and the willingness of companies to adopt innovations regarding alternative fuels and efficient vehicles. Thus, there is a research opportunity to deepen knowledge associated with the intrinsic dynamics of changing technological paradigms of this decarbonization strategy.

4. Conclusions

In this study, the application of system dynamics models to the policy challenge of decarbonization of freight transport was reviewed. Particular focus was placed on the model’s structure, key variables, and dynamic factors, such as delay equations, time-related variables, sequences of stock and flows, and assumptions made to build feedback loops.
The first conclusion of this literature review is related to the limited boundaries of the models to represent the system. Overall, system dynamics models were found for different individual decarbonization strategies, with varying levels of detail. However, any model addressed the five decarbonization strategies for analysis if, how, and when a given level of emissions reduction could be achieved. As described in the Introduction, freight transport has a systemic nature, whereby changes in one element affect other elements of this system over time. A partial or disconnected view hinders a final assessment of the most effective actions. We see this coordination of different policy measures as a fundamental challenge for the decarbonization of the freight transport system in the coming years. Methods need to be developed to study the interaction of different policy measures.
The second conclusion taken from the literature review analysis is the lack of transparency concerning the empirical modeling of the temporal dimension. Although most authors provide time ranges in their simulation results (see Table 1), they are not clear about the background of pathways or the delay assumptions for each decision to achieve the results in those defined terms. Occasional explanations on dynamics related to vehicle utilization and mode shift decisions have been found. Some studies also included delays in governmental policies, market shares, and their impacts on the construction of fueling stations. These are some rare examples of dynamics as a factor in decarbonization pathways. However, we argue that time lags should be considered in an empirically rigorous way for freight transport decarbonization models to predict dynamics well. The dynamic component of the reviewed system dynamics models is often not clear, which is observable through the absence of model equations, system dynamics diagrams, and even model descriptions and assumptions. This is a major problem, not just for the research community, but mostly because time is crucial for assessing whether simulated policy measures effectively achieve decarbonization targets in the short, medium, and long term. For this reason, the SD community should focus on describing the time component of their models, either through actual data or assumptions, to deepen discussions regarding the problem.
Many barriers exist in the testing and validation phases, since it is impossible to obtain all necessary data without significant research efforts. Another possible difficulty could be quantifying the factors or relationships between agents, such as lobby practice, regulatory pressure, or market acceptance of new technologies. Therefore, solid assumptions in dynamic models will be unavoidable for some time, but ignoring a causal link or the associated time delay can be worse than making a good guess. Therefore, further research should consider an integrated model with all possible strategies and agents related to freight transport decarbonization and their time-lag decisions to build a more realistic model. A significant opportunity lies in enriching system dynamics models with studies of specific subsystems or decisions, such as the internalization of emissions costs and adopting new technologies and alternative fuels. Such studies can also be executed with time series models or discrete simulation models, independently of the larger system models discussed in this paper. Based on such empirically validated models, the task of integration into large system dynamics models could be undertaken in future research.
The rebound effect of transport efficiency on logistics costs and product prices and, consequently, on freight demand, should be further analyzed. The time lags could be better investigated for the mode choice process, such as companies’ decisions and adaptation time, and the time taken for public and private investments in logistics infrastructure to support the mode shift. It would be interesting to note how companies of different levels react to policies, such as the internalization of external costs, marketing strategies, and the green image of companies and how it impacts the use of their fleets over time. Moreover, analyzing organizational adoption behavior could expose the dynamics and time responses of market diffusion of alternative technologies, considering the competition between different technologies and how it would impact their adoption over time. Table 8 summarizes suggestions for deepening the study of the dynamics of each decarbonization strategy.
The current search is subject to improvements, as there may be studies not included here, either because they are in other databases or because they do not contain the keywords used in our search. Even so, this paper is relevant for the scientific community due to the increasing use of system dynamics in the analysis of freight transport decarbonization strategies. Besides highlighting the gaps in the literature, this paper contributes to future research, since the results assist researchers with their structured discussion about the main decarbonization strategies.

Author Contributions

Conceptualization, V.G., L.A.T., G.H.d.A.C., G.d.L.D.C., and G.M.R.; methodology, V.G., L.A.T., G.H.d.A.C., G.d.L.D.C., and G.M.R.; writing—original draft preparation, V.G.; writing—review and editing, V.G., L.A.T., G.H.d.A.C., G.d.L.D.C., and G.M.R.; visualization, V.G., L.A.T., G.H.d.A.C., G.d.L.D.C., and G.M.R.; supervision, G.d.L.D.C. and G.M.R.; project administration, G.d.L.D.C. and G.M.R.; funding acquisition, G.M.R. All authors have read and agreed to the published version of the manuscript.

Funding

This research was funded by the Coordination for the Improvement of Higher Education Personnel (CAPES), the National Council for Scientific and Technological Development (CNPq), grant number 001, and by the Carlos Chagas Filho Foundation for Research Support of the State of Rio de Janeiro (FAPERJ), grant number E-26/201.225/2021.

Institutional Review Board Statement

Not applicable.

Informed Consent Statement

Not applicable.

Data Availability Statement

Not applicable.

Conflicts of Interest

The authors declare no conflict of interest. The funders had no role in the design of the study; in the collection, analyses, or interpretation of data; in the writing of the manuscript, or in the decision to publish the results.

References

  1. The World Bank. Global Mobility Report 2017: Tracking Sector Performance. Available online: https://openknowledgeworldbank.org/handle/10986/28542 (accessed on 23 December 2021).
  2. Kaack, L.H.; Vaishnav, P.T.; Morgan, M.G.; Azevedo, I.L.; Rai, S. Decarbonizing intraregional freight systems with a focus on modal shift. Environ. Res. Lett. 2018, 13, 083001. [Google Scholar] [CrossRef]
  3. International Energy Agency—IEA. Tracking Transport. Available online: https://www.iea.org/topics/transport (accessed on 23 December 2021).
  4. McKinnon, A. Decarbonizing Logistics: Distributing Goods in a Low-Carbon World; Kogan Page: London, UK, 2018. [Google Scholar]
  5. Bickford, E.; Holloway, T.; Karambelas, A.; Johnston, M.; Adams, T.; Janssen, M.; Moberg, C. Emissions and Air Quality Impacts of Truck-to-Rail Freight Modal Shifts in the Midwestern United States. Environ. Sci. Technol. 2014, 48, 446–454. [Google Scholar] [CrossRef] [PubMed]
  6. International Energy Agency—IEA. The Future of Trucks: Implications for Energy and the Environment; IEA: Paris, France, 2017. [Google Scholar]
  7. Hao, H.; Wang, H.; Ouyang, M. Fuel consumption and life cycle GHG emissions by China’s on-road trucks: Future trends through 2050 and evaluation of mitigation measures. Energy Policy 2012, 43, 244–251. [Google Scholar] [CrossRef]
  8. Ghisolfi, V.; Ribeiro, G.M.; Chaves, G.D.L.D.; Filho, R.D.O.; Hoffmann, I.C.S.; Perim, L.R. Evaluating Impacts of Overweight in Road Freight Transportation: A Case Study in Brazil with System Dynamics. Sustainability 2019, 11, 3128. [Google Scholar] [CrossRef] [Green Version]
  9. Jong, G.C.; Schroten, A.; van Essen, H.; Otten, M.; Bucci, P. The price sensitivity of road freight transport: A review of elasticities. In Applied Transport Economics, a Management and Policy Perspective; Van de Voorde, E., Vanelslander, T., De Boeck, A., Eds.; De Boeck: Antwerpen, Belgium, 2010. [Google Scholar]
  10. Sajid, Z.; da Silva, M.A.B.; Danial, S.N. Historical Analysis of the Role of Governance Systems in the Sustainable Development of Biofuels in Brazil and the United States of America (USA). Sustainability 2021, 13, 6881. [Google Scholar] [CrossRef]
  11. Petróleo Brasileiro, S.A. PETROBRAS. Preços de Venda de Combustíveis. Available online: https://petrobras.com.br/pt/nossas-atividades/precos-de-venda-de-combustiveis/#:~:text=Composi%C3%A7%C3%A3o%20considerada%3A%2073%25%20gasolina%20A,gasolina%20premium%20%C3%A9%20de%2025%25 (accessed on 7 February 2022).
  12. Tavasszy, L.A. Predicting the effects of logistics innovations on freight systems: Directions for research. Transp. Policy 2020, 86, A1–A6. [Google Scholar] [CrossRef]
  13. Maalla, E.; Kunsch, P. Simulation of micro-CHP diffusion by means of system dynamics. Energy Policy 2008, 36, 2308–2319. [Google Scholar] [CrossRef]
  14. Ylén, J.P.; Hölttä, V. System dynamics—A tool for designing and analyzing complex processes. Simul. News Eur. 2007, 17, 27–31. [Google Scholar]
  15. Meadows, D.; Randers, J.; Meadows, D. Limits to Growth: The 30-Year Update; Earthscan: London, UK, 2004; Original work published 1972. [Google Scholar]
  16. Abbas, K.A.; Bell, M.G.H. System dynamics applicability to transportation modeling. Transp. Res. Part A Policy Pract. 1994, 28, 373–390. [Google Scholar] [CrossRef]
  17. Shepherd, S.P. A review of system dynamics models applied in transportation. Transp. B Transp. Dyn. 2014, 2, 83–105. [Google Scholar] [CrossRef] [Green Version]
  18. Vilchez, J.J.G.; Jochem, P. Simulating vehicle fleet composition: A review of system dynamics models. Renew. Sustain. Energy Rev. 2019, 115, 109367. [Google Scholar] [CrossRef]
  19. Gnann, T.; Plötz, P. A review of combined models for market diffusion of alternative fuel vehicles and their refueling infrastructure. Renew. Sustain. Energy Rev. 2015, 47, 783–793. [Google Scholar] [CrossRef]
  20. McKinnon, A.; Piecyk, M.I. Measurement of CO2 emissions from road freight transport: A review of UK experience. Energy Policy 2009, 37, 3733–3742. [Google Scholar] [CrossRef]
  21. Demir, E.; Bektaş, T.; Laporte, G. A comparative analysis of several vehicle emission models for road freight transportation. Transp. Res. Part D Transp. Environ. 2011, 16, 347–357. [Google Scholar] [CrossRef]
  22. Demir, E.; Bektas, T.; Laporte, G. A review of recent research on green road freight transportation. Eur. J. Oper. Res. 2014, 237, 775–793. [Google Scholar] [CrossRef] [Green Version]
  23. Zhang, L.; Long, R.; Chen, H.; Geng, J. A review of China’s road traffic carbon emissions. J. Clean. Prod. 2019, 207, 569–581. [Google Scholar] [CrossRef]
  24. Fontoura, W.B.; Ribeiro, G.M. System Dynamics for Sustainable Transportation Policies: A Systematic Literature Review. Urbe. Rev. Bras. Gestão Urbana 2021, 13, 1–15. [Google Scholar] [CrossRef]
  25. Rebs, T.; Brandenburg, M.; Seuring, S. System dynamics modeling for sustainable supply chain management: A literature review and systems thinking approach. J. Clean. Prod. 2019, 208, 1265–1280. [Google Scholar] [CrossRef]
  26. Moher, D.; Liberati, A.; Tetzlaff, J.; Altman, D.G.; Altman, D.; Antes, G.; Atkins, D.; Barbour, V.; Barrowman, N.; Berlin, J.A.; et al. Preferred reporting items for systematic reviews and meta-analyses: The PRISMA statement. PLoS Med. 2009, 6, e1000097. [Google Scholar] [CrossRef] [PubMed] [Green Version]
  27. Falagas, M.E.; Pitsouni, E.I.; Malietzis, G.A.; Pappas, G. Comparison of PubMed, Scopus, Web of Science, and Google Scholar: Strengths and weaknesses. FASEB J. 2007, 22, 338–342. [Google Scholar] [CrossRef] [PubMed]
  28. Meyer, T. Decarbonizing road freight transportation—A bibliometric and network analysis. Transp. Res. Part D Transp. Environ. 2020, 89, 102619. [Google Scholar] [CrossRef]
  29. Stelling, P. Policy instruments for reducing CO2-emissions from the Swedish freight transport sector. Res. Transp. Bus. Manag. 2014, 12, 47–54. [Google Scholar] [CrossRef]
  30. Agha, M.R.N.J.; Bazrafshan, M.; Mahmoudabadi, A. Investigating the Effects of Fuel Price on Inter-City Transportation Utilizing System Dynamics Approach and Simulation (Case Study: Inter-City Transport, Iran). J. Urban Des. 2019, 2, 1–13. [Google Scholar]
  31. Aschauer, G.J. The development of sustainable transports through the right logistics strategy—A system dynamics approach. In Proceedings of the 2013 International Conference of the System Dynamics Society, Cambridge, MA, USA, 21–25 July 2013. [Google Scholar]
  32. Aschauer, G.; Gronalt, M.; Mandl, C. Modelling interrelationships between logistics and transportation operations—A system dynamics approach. Manag. Res. Rev. 2015, 38, 505–539. [Google Scholar] [CrossRef]
  33. Azlan, S.; Rahman, M.M.; Faizal, H.M.; Saat, A.; Wahid, M.A. Greenhouse Gas (GHG) Emissions from Land Transports in Malaysia: Modelling and Policy Analysis. In Proceedings of the 2019 International Conference on Industrial Engineering and Operations Management, Bangkok, Thailand, 5–7 March 2019. [Google Scholar]
  34. Barisa, A.; Rosa, M. A system dynamics model for CO2 emission mitigation policy design in road transport sector. Energy Procedia 2018, 147, 419–427. [Google Scholar] [CrossRef]
  35. Barisa, A.; Rosa, M. Scenario analysis of CO2 emission reduction potential in road transport sector in Latvia. Energy Procedia 2018, 147, 86–95. [Google Scholar] [CrossRef]
  36. Cagliano, A.C.; Carlin, A.; Mangano, G.; Zenezini, G. System dynamics modelling for electric and hybrid commercial vehicles adoption. In Proceedings of the 6th International Conference on Theoretical and Applied Mechanics, Salerno, Italy, 27–29 June 2015. [Google Scholar]
  37. Cagliano, A.C.; Mangano, G.; Rafele, C.; Zenezini, G. Assessing the Diffusion of a City Logistics System Based on Low Emission Vehicles. In Proceedings of the Hamburg International Conference of Logistics, Hamburg, Germany, 24–25 September 2015. [Google Scholar]
  38. Cagliano, A.C.; Carlin, A.; Mangano, G.; Rafele, C. Analyzing the diffusion of eco-friendly vans for urban freight distribution. Int. J. Logist. Manag. 2017, 28, 1218–1242. [Google Scholar] [CrossRef]
  39. Choi, B.; Park, S.-I.; Lee, K.-D. A System Dynamics Model of the Modal Shift from Road to Rail: Containerization and Imposition of Taxes. J. Adv. Transp. 2019, 2019, 7232710. [Google Scholar] [CrossRef]
  40. Brito Junior, I.; Hino, C.M.; Gonçalves, P.; Andrade, L.E.W.A.; Moreira, C.; Costa, G.; Nardin, L.G.; Yoshizaki, H.T.Y.; Magalhães, D.J. Reducing CO2 emissions due to a shift from road to cabotage transport of cargo in Brazil. In Proceedings of the 2011 International Conference of the System Dynamics Society, Washington, DC, USA, 24–28 July 2011. [Google Scholar]
  41. Doll, C.; Pastori, E.; Fiorello, D. The Impact of Road Charges on Efficiency, Modal Split and Climate Balance of Longer and Heavier Trucks. In Proceedings of the 12th World Conference on Transport Research, Lisbon, Portugal, 11–15 July 2010. [Google Scholar]
  42. Dong, J.; Xu, Y.; Hwang, B.-G.; Ren, R.; Chen, Z. The Impact of Underground Logistics System on Urban Sustainable Development: A System Dynamics Approach. Sustainability 2019, 11, 1223. [Google Scholar] [CrossRef] [Green Version]
  43. Erdmann, L.; Hilty, L.; Goodman, J.; Arnfalk, P. The Future Impact of ICTS on Environmental Sustainability; Technical Report EUR 21384 EN; Institute for Prospective Technological Studies: Seville, Spain, 2004. [Google Scholar]
  44. Fiorello, D.; Fermi, F.; Bielanska, D. The ASTRA model for strategic assessment of transport policies. Syst. Dyn. Rev. 2010, 26, 283–290. [Google Scholar] [CrossRef]
  45. Freeman, R.; Yearworth, M.; Preist, C. Revisiting Jevons’ Paradox with System Dynamics: Systemic Causes and Potential Cures. J. Ind. Ecol. 2015, 20, 341–353. [Google Scholar] [CrossRef] [Green Version]
  46. Geng, X.; Wen, Y.; Zhou, C.; Xiao, C. Establishment of the Sustainable Ecosystem for the Regional Shipping Industry Based on System Dynamics. Sustainability 2017, 9, 742. [Google Scholar] [CrossRef] [Green Version]
  47. Haddad, M.; Mansour, C.; Diab, J. System dynamics modeling for mitigating energy use and CO2 emissions of freight transport in Lebanon. In Proceedings of the International Conference on Industrial Engineering and Operations Management, Bangkok, Thailand, 5–7 March 2019. [Google Scholar]
  48. Hamoudi, K.; Bellaouar, A.; Petiot, R. A Model of Systems Dynamics for Physical Flow Analysis in a Distribution Supply Chain. Transp. Telecommun. J. 2021, 22, 98–108. [Google Scholar] [CrossRef]
  49. Han, J.; Hayashi, Y. CO2 mitigation scenarios in China’s intercity freight transport. Civ. Eng. Plan. Res. Present. 2008, 37, 1–4. [Google Scholar]
  50. Hidayatno, A.; Destyanto, A.R.; Fadhil, M. Model Conceptualization on E-Commerce Growth Impact to Emissions Generated from Urban Logistics Transportation: A Case Study of Jakarta. Energy Procedia 2019, 156, 144–148. [Google Scholar] [CrossRef]
  51. Hilty, L.; Arnfalk, P.; Erdmann, L.; Goodman, J.; Lehmann, M.; Wäger, P.A. The relevance of information and communication technologies for environmental sustainability—A prospective simulation study. Environ. Model. Softw. 2006, 21, 1618–1629. [Google Scholar] [CrossRef]
  52. Hu, W.; Dong, J.; Hwang, B.-G.; Ren, R.; Chen, Y.; Chen, Z. Using system dynamics to analyze the development of urban freight transportation system based on rail transit: A case study of Beijing. Sustain. Cities Soc. 2019, 53, 101923. [Google Scholar] [CrossRef]
  53. Huang, D.; Han, M.; Jiang, Y. Research on Freight Transportation Carbon Emission Reduction Based on System Dynamics. Appl. Sci. 2021, 11, 2041. [Google Scholar] [CrossRef]
  54. Kar, A.; Datta, P.R. Logistics Cost Dynamics in International Business: A Causal Approach. Foreign Trade Rev. 2020, 55, 478–495. [Google Scholar] [CrossRef]
  55. Krail, M.; Kühn, A. The Potential of Alternative Fuel Technologies and of Efficiency Technologies for Heavy Goods Vehicles. In Proceedings of the International Symposium on Heavy Vehicle Transport & Technology, Stockholm, Sweden, 16–19 September 2012. [Google Scholar]
  56. Kunze, O.; Wulfhorst, G.; Minner, S. Applying Systems Thinking to City Logistics: A Qualitative (and Quantitative) Approach to Model Interdependencies of Decisions by various Stakeholders and their Impact on City Logistics. Transp. Res. Procedia 2016, 12, 692–706. [Google Scholar] [CrossRef] [Green Version]
  57. Lewis, Y.; Cohen, B.; Van der Merwe, A.B.; Mason-Jones, K.; Rambaran, N. Understanding Emission Reductions in the Freight Transport Sector through System Dynamics. In Proceedings of the 33rd Southern African Transport Conference, Pretoria, South Africa, 7–10 July 2014. [Google Scholar]
  58. Lewis, Y.; Van der Merwe, A.B.; Cohen, B.; Naude, L. Understanding the Barriers to a Shift of Processed Food from Road to Rail through System Dynamics. In Proceedings of the 34th Southern African Transport Conference, Pretoria, South Africa, 6–9 July 2015. [Google Scholar]
  59. Liu, P.; Mu, D. Evaluating sustainability of truck weight regulations: A system dynamics view. J. Ind. Eng. Manag. 2015, 8, 1711–1730. [Google Scholar] [CrossRef] [Green Version]
  60. Liu, P.; Mu, D.; Gong, D. Eliminating Overload Trucking via a Modal Shift to Achieve Intercity Freight Sustainability: A System Dynamics Approach. Sustainability 2017, 9, 398. [Google Scholar] [CrossRef] [Green Version]
  61. Liu, P.; Liu, C.; Du, J.; Mu, D. A system dynamics model for emissions projection of hinterland transportation. J. Clean. Prod. 2019, 218, 591–600. [Google Scholar] [CrossRef]
  62. Liu, P.; Wang, C.; Xie, J.; Mu, D.; Lim, M.K. Towards green port-hinterland transportation: Coordinating railway and road infrastructure in Shandong Province, China. Transp. Res. Part D Transp. Environ. 2021, 94, 102806. [Google Scholar] [CrossRef]
  63. Melkonyan, A.; Gruchmann, T.; Lohmar, F.; Kamath, V.; Spinler, S. Sustainability assessment of last-mile logistics and distribution strategies: The case of local food networks. Int. J. Prod. Econ. 2020, 228, 107746. [Google Scholar] [CrossRef]
  64. Menezes, E.; Maia, A.G.; de Carvalho, C.S. Effectiveness of low-carbon development strategies: Evaluation of policy scenarios for the urban transport sector in a Brazilian megacity. Technol. Forecast. Soc. Chang. 2017, 114, 226–241. [Google Scholar] [CrossRef] [Green Version]
  65. Oumer, A.J.; Cheng, J.K.; Tahar, R.M. Evaluating the environmental impact of inbound logistics in automotive assembly line: A system dynamics approach. In Proceedings of the 2015 5th IEEE International Conference on System Engineering and Technology, Shah Alam, Malaysia, 10–11 August 2015; pp. 1–5. [Google Scholar] [CrossRef]
  66. Purwanto, J.; González, I.H.; Fermi, F.; Fiorello, D. Global Scale System Dynamic Simulation Model for Transport Emissions (GLADYSTE). Transporti e Territorio-TRT. 2011. Available online: http://www.trttrasportieterritorio.it/documenti/GLADYSTE.pdf (accessed on 26 December 2021).
  67. Rozentale, L.; Mo, G.B.; Gravelsins, A.; Rochas, C.; Pubule, J.; Blumberga, D. System Dynamics Modelling of Railway Electrification in Latvia. Environ. Clim. Technol. 2020, 24, 247–257. [Google Scholar] [CrossRef]
  68. Schade, B.; Schade, W. Evaluating Economic Feasibility and Technical Progress of Environmentally Sustainable Transport Scenarios by a Backcasting Approach with ESCOT. Transp. Rev. 2005, 25, 647–668. [Google Scholar] [CrossRef]
  69. Seitz, C. Conceptual Causal Framework for the Diffusion of Emerging CO2-saving Technologies in Heavy Commercial Vehicles. Karlsr. Inst. Technol. KIT 2014, 25, 1–24. [Google Scholar] [CrossRef]
  70. Seitz, C.; Terzidis, O. Market Penetration of Alternative Powertrain Concepts in Heavy Commercial Vehicles: A System Dynamics Approach. In Proceedings of the International Conference of the System Dynamics Society, Delft, The Netherlands, 20–24 July 2014. [Google Scholar]
  71. Setiawan, I.C. Indarto; Deendarlianto System Dynamics Modeling of Indonesia Road Transportation Energy Demand and Scenario Analysis to achieve National Energy Policy Target. In IOP Conf. Series: Materials Science and Engineering, 546, Proceedings of The 9th Annual Basic Science International Conference 2019 (BaSIC 2019), Malang, Indonesia, 20–21 March 2019; IOP Publishing: Bristol, UK, 2019. [Google Scholar]
  72. Shafiei, E.; Davidsdottir, B.; Leaver, J.; Stefansson, H.; Asgeirsson, E.I. Potential impact of transition to a low-carbon transport system in Iceland. Energy Policy 2014, 69, 127–142. [Google Scholar] [CrossRef]
  73. Sim, J. The influence of new carbon emission abatement goals on the truck-freight transportation sector in South Korea. J. Clean. Prod. 2017, 164, 153–162. [Google Scholar] [CrossRef]
  74. Thaller, C.; Niemann, F.; Dahmen, B.; Clausen, U.; Leerkamp, B. A System Dynamics Approach for Assessing the Development of the CEP market in Urban Areas. In Proceedings of the 34th International Conference of the System Dynamics Society, Delft, The Netherlands, 17–21 July 2016. [Google Scholar]
  75. Thaller, C.; Niemann, F.; Dahmen, B.; Clausen, U.; Leerkamp, B. Describing and explaining urban freight transport by System Dynamics. Transp. Res. Procedia 2017, 25, 1075–1094. [Google Scholar] [CrossRef]
  76. Wang, L.; Zhao, Z.; Wang, X.; Xue, X. Transportation de-carbonization pathways and effect in China: A systematic analysis using STIRPAT-SD model. J. Clean. Prod. 2020, 288, 125574. [Google Scholar] [CrossRef]
  77. York, T.A.; Brent, A.C.; Musango, J.K.; De Kock, I.H. Infrastructure implications of a green economy transition in the Western Cape Province of South Africa: A system dynamics modelling approach. Dev. S. Afr. 2017, 34, 529–547. [Google Scholar] [CrossRef] [Green Version]
  78. Zenezini, G.; Marco, A. City logistics policy evaluation with system dynamics. Transp. Res. Procedia 2020, 46, 253–260. [Google Scholar] [CrossRef]
  79. Zhang, L.; Liu, L.; Wang, M.; Wang, Y.; Zhou, Y. Forecast and Analysis of Road Transportation Energy Demand under the Background of System Dynamics. In IOP Conf. Series: Earth and Environmental Science, 252, Proceedings of The 4th International Conference on Environmental Science and Material Application, Xi’an, China, 15–16 December 2018; IOP Publishing: Bristol, UK, 2019. [Google Scholar]
  80. Alliance for Logistics Innovation through Collaboration in Europe—ALICE. A Framework and Process for the Development of a Roadmap towards Zero Emissions Logistics 2050. Available online: http://www.etp-logistics.eu/wp-content/uploads/2019/12/Alice-Zero-Emissions-Logistics-2050-Roadmap-WEB.pdf (accessed on 26 December 2021).
  81. Razmjoo, A.; Mirjalili, S.; Aliehyaei, M.; Østergaard, P.A.; Ahmadi, A.; Nezhad, M.M. Development of smart energy systems for communities: Technologies, policies and applications. Energy 2022, 248, 123540. [Google Scholar] [CrossRef]
Figure 1. Flow diagram of the systematic literature review proceeding according to PRISMA [26].
Sustainability 14 03625 g001
Figure 2. Relations between external factors, decarbonization strategies, and policy instruments. Source: based on Ref. [4].
Sustainability 14 03625 g002
Figure 3. Common dynamic relationships in freight transport demand modeling. Source: based on Refs. [30,45,50,54,74,75,79].
Sustainability 14 03625 g003
Figure 4. Common dynamic relationships in shifting freight to lower-carbon transport modes. Source: based on Refs. [39,40,42,49,52,53,57,62,76].
Sustainability 14 03625 g004
Figure 5. Common dynamic relationships in improving asset utilization models. Source: based on Refs. [31,48,63,73].
Sustainability 14 03625 g005
Figure 6. Common dynamic relationships of increasing energy efficiency models. Source: based on Refs. [46,69,70].
Sustainability 14 03625 g006
Figure 7. Common dynamic relationships of switching to lower-carbon energy models. Source: based on Refs. [34,35,36,37,38,66,71,78].
Sustainability 14 03625 g007
Table 1. Studies of SD models for decarbonization of freight transportation.
StudyCase StudyGeographic LevelSimulation Period 1SoftwareModel Presentation
[30]IranNation/Region2009–2034Vensim
[31]QualitativeNation/Region-Stella
[32]GenericNation/Region10 yearsStella
[33]MalaysiaNation/Region1990–2016–2040Powersim
[34]LatviaNation/Region2013–2030PowersimS and F *
[35]LatviaNation/Region2016–2030PowersimCLD
[36]ItalyUrban120 monthsVensimCLD
[37]ItalyUrban120 monthsVensimCLD
[38]ItalyUrban120 monthsVensim
[39]South KoreaNation/Region100 monthsVensim
[40]BrazilNation/Region2010–2025Vensim
[41]EuropeNation/Region2005–2025Not specified-
[42]ChinaUrban2017–2035Vensim
[43]EU15Nation/Region2000–2020Powersim-
[44]EuropeNation/Region1990–2050Vensim-
[45]UKNation/Region1970–2010–2030Vensim
[46]ChinaNation/Region2015–2025Vensim
[47]LebanonNation/Region2010–2040VensimS and F *
[48]GenericNation/Region10 yearsVensim
[49]ChinaNation/Region2000–2020Not specified
[50]QualitativeUrban-VensimCLD
[51]EU15Nation/Region2000–2020Powersim-
[52]ChinaUrban2007–2035Vensim
[53]ChinaNation/Region2001–2019Vensim
[54]QualitativeNation/Region-VensimCLD
[55]GermanyNation/Region2009–2050Not specified-
[56]QualitativeUrban-AnylogicS and F *
[57]QualitativeNation/Region-StellaCLD
[58]QualitativeNation/Region-Not specified-
[59]ChinaNation/Region2015–2024Vensim-
[60]ChinaNation/Region2016–2025Vensim-
[61]ChinaNation/Region2008–2030Not specified-
[62]ChinaNation/Region2020–2035Vensim-
[63]AustriaUrban2018–2030Vensim
[64]BrazilUrban2010–2040Vensim-
[65]GenericNation/Region15 monthsiThink
[66]GlobalNation/Region2000–2050VensimCLD *
[67]LatviaNation/Region1990–2050StellaS and F *
[68]GermanyNation/Region1990–2030Not specified-
[69]QualitativeNation/Region-VensimCLD
[70]GermanyNation/Region2010–2035VensimCLD
[71]IndonesiaNation/Region2020–2050VensimCLD *
[72]IcelandNation/Region2012–2050Not specified-
[73]South KoreaNation/Region2015–2030Vensim
[74]QualitativeUrban-Vensim
[75]QualitativeUrban-VensimCLD
[76]ChinaNation/Region1999–2017Vensim
[77]South AfricaNation/Region2001–2040Vensim-
[78]GenericUrban100 monthsVensim
[79]ChinaUrban2018–2022VensimCLD
1 The first range refers to a simulation run with historical data for validation purposes, and the second refers to future simulations. ✓ All diagrams presented; CLD *—causal loop diagram partially presented; S and F *—stock and flow diagram partially presented.
Table 2. Identification of decarbonization strategies, external forces, and policy instruments.
StudyDecarbonization Strategies 1External Forces 2Policies 3
12345TIMBERECOSOCLEGKNL
[30]x 4 x x
[31] xx x x x
[32] xx x x x
[33]xx x xx xx x
[34] x xxxxxx x x
[35] x xxxxxxxxxxx
[36] xxxxxxx xx
[37] xxxxxxx xx
[38] xxxxxxx xx
[39] x xx x xx x
[40] x x x
[41] xx x xx x
[42] x x x x
[43]x x xx x
[44] x xxx x xx x
[45]x x x x x x
[46] xxx xx x
[47] x xxx x ----
[48]x x x x x
[49] x x xxx
[50]x x x x
[51]x x xx x
[52] x x x xx
[53] x x xxx
[54]x x x x x x
[55] xxx xxx x
[56]x x x xxx x
[57] x x xxxxx x x
[58] x x xx x x
[59] x x x xx
[60] xxx x x xx
[61] xxx x x xx
[62] x x x
[63]x x x xx x x
[64] xxx x xxx xx
[65] x x x x
[66] xx xx xxx xx
[67] x xxx x x x
[68]xxxxxxxxxxxxx x
[69] xxxxx xxxx x
[70] xxxxx x x x
[71] x xxxx x ----
[72] xxxxx x x x
[73] xx xxx x -- -
[74]x x ----
[75]x xx ----
[76] x xxxxxxxx x x
[77] x x x
[78] x xx xx xx
[79]x x ----
1 Where 1—demand reduction; 2—mode choice; 3—assets utilization; 4—energy efficiency; 5—alternative fuels. 2 T—technology; I—infrastructure; M—market; B—behavior; E—energy; R—regulation. 3 ECO—economic; SOC—social; LEG—legal; KNL—knowledge-based instruments. 4 Shading highlights the main decarbonization strategy in the respective model.
Table 3. Contributions of the SD models for reducing freight transport demand modeling.
AuthorsObjectivesPolicy ElementsContributionsLimitations
[43,51]To assess the influence that information and communication technologies (ICTs) have on environmental sustainabilityInvestment in new technologiesICT-related efficiency improvements are not sufficient to stabilize freight demand, and other demand-side management policies are requiredThe SD diagrams were not presented. There is no discussion about time responses or other dynamics of policy implementation and their effects
[45]To examine the dynamic relationship between the consumption of goods and services, technological efficiency, and associated resource useInvestment in technological efficiencyThe fleet efficiency induces travel consumption and more CO2 emissions. Higher fleet efficiency requires costlier travel and a reduction in travel consumptionIt highlighted the need to implement a system of interventions; however, no details were described regarding the dynamics for such implementations
[56]To generate a holistic understanding of the potential to reduce freight transport demandApplication of higher transport taxesIdentifying the reinforcement loop, since economies of scale lead to more freight demand, and the balancing loop, as higher taxes discourage the freight demand increaseThe model requires further discussion, as well as validation and application
[74,75]To discuss the behavioral patterns and interdependencies of relevant stakeholders in the freight transport market at an urban levelNot consideredThe focus was on the decision processes and behavior of the freight demand and the freight transport demand, which affects freight traffic and the environment at an urban levelThe model presents the effects of consumption patterns over freight transport demand but does not provide any policy instruments to manage or mitigate it
[30]To model the effects of fuel price on intercity road traffic volumeIncrease in fuel pricesThe fuel price increase is not sufficient to reduce the transport demand due to population increase, positive economic growth, and investment in road infrastructureThe dynamics of the market response, that is, the time lag that it would take between price increase and demand reduction, was not evidenced
[50]Relates to the total CO2 emissions generated through urban freight volume powered by e-commerce growthCarbon tax internalizationDevelopment of feedback loops with general assumptions about freight transport demand variationsThe model was not simulated or validated. Time-lag decisions and response delays were not considered
[79]Determines the causal relationship between road transport and social economy, population, passenger transport, freight turnover, and energy demandNot consideredPredictions of the freight transport demand and CO2 emissions simulating high and low levels of oil and gas resource and technology, oil price, and economic growthThe model does not apply any decarbonization strategy, despite simulating the impact of transport demand increase over emissions
[54]Understanding of the relationship between product prices, fuel, number of vessels, freight, and weight value ratioProduct prices and logistic costs variationThis study shows that the cost of logistics has a significant impact on the demand for products with price elasticity greater than oneThe model does not consider the dynamics of relevant policies, such as logistics collaborations, partnerships, and vertical integration
Table 4. Contributions of SD models for shifting freight to low-carbon mode modeling.
AuthorsObjectivesPolicy ElementsContributionsLimitations
[68]To model the economic, transport, environmental, and policy aspects that describe a path toward a sustainable transport system and its economic impactsHigher transport prices (taxes); investment in alternative modes; investment in energy efficiency and alternative fuelsThe growth of freight transport tends to be absorbed by rail and ship transport, since these modes are attractive enoughThe high aggregation level and the absence of the model feedback loops and related dynamics make it challenging to analyze the considered assumptions
[49]To assess the CO2 emissions from an intercity freight transport considering the modal share, the freight volume, fuel price, and fuel intensityExtension of the railway and waterway network and imposition of fuel taxesPolicies simulated are very significant for CO2 emissions mitigationDynamics of changes in the system were not provided, compromising the interactions between policies, mode choice, and emissions mitigation discussion
[40]To analyze the causal relationships influencing the modal shift from road to coastal shippingInvestment in infrastructure capacities and governmental pressure to reduce CO2 emissionsResults show that the inertia for the modal shift is longIt was not evidenced how the pressure to reduce CO2 emissions and to shift modes were quantified. Other factors were not considered by the model, such as pricing policies, tax incentives, and subsidies to shift modes
[57,58]To explore the strategies for greenhouse gas (GHG) emission reductions, with a specific focus on the mode switch from road to railIncreasing the fuel price, electricity price, carbon tax; investment in rail infrastructure; fleet efficiencyExistence of different decision-making behaviors to adopt innovations, depending on the type and size of companiesThe congestion and capacity constraints were not considered, as well as the assumptions related to time responses
[77]To investigate the infrastructure implications of a green economy transition for modal shift from road to railIncreasing investments in the rail networkThe benefits obtained include the reduction in trucks using the road network, better pavement conditions, and road safety. Such a transition would require significant investment in the rail trackIt was not discussed how the modal shift would be implemented by companies over time
[33]To propose an SD model for emission analysis of intercity highways, including both passenger and freight transportIncreasing fuel price, promoting alternative modes, such as railway, and educating drivers to plan their routes and schedulesThe results showed a reduction in total CO2 emissions with the policy’s implementationThe model does not show the feedback loops. There is no mention of time lags regarding mode choice changes, or the adoption of intelligent systems for route planning, compromising policy evaluations
[39]Develop an SD model to examine the impact of policies of modal shift from road to railIncreasing road cost or taxation and containerizationResults confirmed that the modal shift by containerization occurred more rapidly than by all kinds of road taxationWarehousing and information costs of transshipment were excluded. Dynamics were not analyzed
[42]To analyze the quantitative relationship between the mode shift from road to rail and the sustainability of urban logisticsInvestment in railway infrastructure constructionThe high-density development of the rail network will achieve the best indicators of performance (average speed, congestion loss, delivery travel time, and emissions)Lack of detailed analysis of the network construction time, the secondary benefits, such as land appreciation and road safety, as well as the cost–benefit analysis for the construction of the rail network
[60,61,62]Evaluate alternative modal shift policies to eliminate overloaded trucking and increase sustainabilityLegal weight regulation and investment in railway infrastructureThe weight regulation causes a higher total cost. Constructing a railway to shift freight away from highways is an effective option to achieve increasing sustainabilitySome delays are assumed for model simplification without suitable discussion. Policies and their effects are fixed throughout the simulation period, which is unrealistic
[52]To simulate logistics activities integrated into urban passenger rail transit networksDifferent levels of infrastructure investment policy, network scale, and market competitiveness through price adjustmentsThe urban freight railway significantly decelerates the growth trend of external costs. However, due to the limited capacity of the system and the ever-growing urban demand, it is not sufficient to mitigate all externalitiesLack of analysis of multimodal transport system, reduction in truck damage to roads, and the benefits of land conservation, as well as the dynamics related to the policies simulated
[76]To explore transport decarbonization considering economic, social, environmental, and transportation elementsIncrease the use of alternative modes and optimize energy consumption through technological innovationsThe results indicate that the mode shift is the most significant measure to reduce emissionsDynamics for mode shift, such as company change requirements and time-lag responses, were not taken into account
[53]Simulate the mode shift from road to rail by levying carbon emission taxesIncreasing carbon taxes and investments in the railway networkThe policies investigated have a good effect on reducing carbon emissions in the transportation industryThe model does not consider important factors to the mode choice process and the time lag for the mode shift, although it does not occur instantaneously
Table 5. Contributions of SD models for improving vehicle utilization modeling.
AuthorsObjectivesPolicy ElementsContributionsLimitations
[41]To evaluate the impacts of longer and heavier vehicles on emissions and show the effect of road pricing in the market share of these vehicles compared to railInternalization of transport external costs; allowance of heavier trucksIncreased truck sizes and high road user charges can only limit truck traffic growth for a specific time. The negative impacts in the medium term are much stronger than the initial positive effectsIt was not analyzed how different types of companies react to the internalization of external costs and how they decide to use railway or heavier trucks
[31,32]To model the interdependencies between logistics strategies and transportation with the goal of higher utilization of trucks and modal shift to railGrowth of transport costs through internalization, leading to more pressure to consolidate freightThe model concentrates on operative parameters, such as order cycle frequency, amount per order cycle, and shipment amountsInventory costs were disregarded, although this could lead to different results
[65]To simulate CO2 emissions for inbound and outbound logistics in an automotive assembly lineShipment consolidationUnlike the majority of SD models, this study addressed operational activities at a company levelHow the policy will be implemented and time response of its effects were not presented
[59]To evaluate the effects of alternative truck weight regulation policies on the sustainability of a highway freight systemAlternative weight regulation policiesSocial costs, such as pavement maintenance, traffic accidents, and emissions, are simulated, evidencing the sustainability of different weight regulationsThe model considers only a single freight and truck type while neglecting the storage process. Delays were simplified, as the pavement maintenance was assumed to occur within the model time step
[73]To analyze the carbon emission abatement required for the truck freight sector while investigating the uncertainty in demand and technology developmentsNot consideredIt simulates the total emission reduction target, and the result is the percentage of reduction needed in the transport sector. Policies are recommended but not simulatedDespite freight volume and carbon emissions target changing dynamically, the discussion about how this change occurs over time was not provided
[63]To explore the sustainability potential of last-mile logistics and distribution strategies, employing different delivery alternativesInvestments in digital applications for track and trace and to outsource the pickup to consumersThe crowd logistics concept (in which the logistics service provider decides where to pick up the parcel or whether to outsource the pickup to individuals) is the better solutionSignificant factors were not applied, such as carbon taxation, inventory management, and economic parameters
[48]To analyze the freight flows in a distribution chain based on inventory and transport costs and the evolution of the customer orderInternalization of CO2 emissions tax; different levels of truck capacity utilizationLogistic decisions are taken at the supply chain level, as the loading vehicles’ rate, their loading capacity, their order cycle frequency decisions are generally taken lightly in the companies, whereas they influence the distribution costs, transport demand, fuel consumption, and emissionsThe model disregarded relevant market parameters, such as financial aspects, marketing strategies to make the business greener, and others
Table 6. Contributions of SD models for increasing energy efficiency modeling.
AuthorsObjectivesPolicy ElementsContributionsLimitations
[55]To simulate the diffusion of alternative fuels and show the potential of fuel efficiency technologies for conventional vehiclesTaxes on different technologies and emissions levelsHydrogen is considered a promising technology for long-distance and regional traffic, while the light distribution traffic is predestined for electric drivesOther factors (technical attributes, range, recharging time, and refueling/recharging stations density) that influence market adoption of new technologies were not considered
[69]To analyze the diffusion of technologies reducing CO2 emissions in heavy commercial vehiclesInvestments in refueling infrastructure and R&D technologiesThe factors for the successful diffusion of CO2-saving technologies were discussed from a stakeholder perspectiveThe framework was not quantified, applied, and validated
[70]To forecast the market penetration of alternative powertrain technologies to the heavy commercial vehicles marketInvestment in refueling stations and R&D for alternative powertrains. Costs of adoption and ownership are taken into accountThe model is helpful to study some market dynamics and highlight the sensitive factors of the market diffusion processThe missing empirical data compromise the analysis of market diffusion
[46]To interrelate regional ship emissions, economic growth, and the development of a sustainable ecosystemSpeed reduction, use of shore electricity, engine improvement, and exhaust after-treatment technologiesThe model provides assumptions that determine the model behavior. Ship speed should be optimized to achieve greater benefitsThere is a lack of reasonable validation and uncertainties in the variable equations and parameter values
Table 7. Contributions of SD models for promoting alternative energy sources modeling.
AuthorsObjectivesPolicy ElementsContributionsLimitations
[44]To assess policies concerning energy scarcity, high oil prices, and technological investments in the transport sectorTransport taxation, road charging, infrastructure investments, incentives for fleet renewal, and increases in fuel resource pricesAnalysis of transport demand, CO2 emissions, and evolution of vehicle fleet. Simulation of transport at the strategic levelThe model was not presented; therefore, it was not possible to analyze its structure and feedback loops in detail, compromising its replicability
[66]To estimate transport demand emissions and impacts of policy and technological measures covering all transport modes from the different regions in the world up to 2050New emission standards, penetration of alternative technologies, an increase in fuel efficiency, and fleet renewal; fuel quality; incentives for low-emission cars, internalization of external costs; and traffic managementUseful for transport, environmental, and economic analysis of different policies and measures to reduce emissions from transportOnly the structural components of the model in a macro-overview are provided, while the SD diagrams are dismissed, compromising the replication of the model or the evaluation of the feedback loops and the model dynamics
[72]To model interactions between the energy supply sector and road transport energy demandOil price variations, alternative fuel availability, and carbon taxesRising fossil fuel prices, carbon tax, and initial investment in alternative fuel supply could reduce emissions; however, more stringent policies will be necessary for a carbon-neutral scenarioThe model does not consider the performance deterioration of battery and fuel cells. It also lacks the analysis of costs of refueling and recharging infrastructure
[36,37,38]To assess the diffusion of a city logistics system based on electric and hybrid vehiclesSubsidies for alternative technologies and investment in refueling/recharging infrastructureAdvertising campaigns, involvement of public authorities, and adoption of suitable technologies are the main aspects that can stimulate the diffusion of alternative vehiclesThe dynamic process of adoption of technologies by companies is not presented, as well as the assumptions made about time responses to policy implementation
[64]To evaluate low-carbon urban development strategies for the transport sectorImproving fuel efficiency and promoting the use of biofuelsThe policies simulated are not enough to achieve the required emissions reduction. Efficiency gains should be combined with measures to reduce the rebound effect on travel demandThe model does not consider other decarbonization strategies that may be impactful in the long run, as well as a cost-benefit analysis of the policy mix
[47]To estimate the potential reductions in fuel use and CO2 emissions from electrified truck technologies, combined with using electric rail for heavy freight transportNot consideredThe strategies simulated lead to a reduction in energy use and corresponding emissions but are not enough to reverse current growth trendsThe model does not evidence how strategies should be implemented (policies) and what the related dynamics involved are
[34,35]To forecast emissions from transport sub-sectors in response to changes in social, economic, technical, and policy aspectsFossil fuel taxes, subsidies for alternative fuel vehicles, investment in refueling/recharging infrastructure, mandatory use of biofuels, increase in environmental awareness, and efficiency improvementThe results confirm that there is no single policy instrument that could reduce GHG significantly, and a broad portfolio of policy measures is neededThe model was only partially presented; thus, it was not possible to evaluate the model structures and the assumptions made for the system dynamic behavior over time
[71]To analyze energy consumption and CO2 emission reductions from the road transportation sectorEfficiency improvements, mode shift from truck to rail, and adoption of electric vehiclesIf adopting one single policy, electric vehicle adoption produces better results; however, the optimal result should include a mix of policies to achieve further emission reductionsThe paper does not provide the feedback loop descriptions and does not mention the assumptions made regarding the time responses from the policy’s implementation to result achievement
[67]To evaluate the electrification of the railway considering the electrical supply system and its development, power demand, economic, and environmental effectsInvestment in railways and new energy sourcesThe electrification of railways has considerable potential to reduce emissions from the freight transport sector, helping to achieve climate targetsThe policy is assumed to be implemented by 2030; however, the actions needed and the time they will take have not been discussed
[78]To grasp the complexities inherent to the city logistics system, the policy-making process, and its connections to operational and economic variablesRoad infrastructure capacity; load consolidation; economic incentives for electric vehiclesAs green vehicles are assumed to be more attractive, they absorb the increase in demand, starting a transition from traditional to green vehiclesThe model does not consider green technologies other than electric vehicles, as well as other factors that impact their adoption, such as technical issues and market acceptance dynamics
Table 8. Suggestions for future research in each decarbonization strategy.
Decarbonization StrategiesSuggestions
Reducing freight transport demandThe dynamic of the market response to product prices or logistic costs should be further analyzed, as well as other policies, such as logistics collaborations, partnerships, and vertical integration, and their effects on freight transport demand.
Shifting freight to low-carbon intensity modesWarehousing and transshipment costs should be considered, as well as time lags regarding the mode choice process, the network construction time, and companies’ adaptation. A cost-benefit analysis could assess secondary benefits, such as road conservation and safety. Further studies could address the gaming processes of multiple stakeholders’ competition.
Improving vehicle utilizationThe reaction of different companies’ levels to the internalization of external costs and other policies and how it impacts the use of their fleets and other asset capacities should be further investigated. Inventory costs and management should be taken into account, as they affect the dynamics of logistics operations. Marketing strategies and the green image of companies could be further analyzed.
Increasing energy efficiencyAnalyzing organizational adoption behavior in more detail could expose the dynamics and time responses of market diffusion of alternative technologies.
Promoting alternative energy sourcesThe lifespan of batteries, fuel cells, and costs of refueling and recharging infrastructure could be added to the analysis of dynamics adoption of alternative vehicles.
Models should also consider the dynamics of competition between different technologies and their adoption over time.
Publisher’s Note: MDPI stays neutral with regard to jurisdictional claims in published maps and institutional affiliations.

