Article

Effect of Nitrogen Fertilizer and Biochar on Organic Matter Mineralization and Carbon Accretion in Soil

by
Momtahina Hasnat
1,
Mohammad Ashraful Alam
1,
Mariam Khanam
1,
Bushra Islam Binte
1,
Mohammad Humayun Kabir
1,
Mohammad Saiful Alam
1,
Mohammed Zia Uddin Kamal
1,
Golum Kibria Muhammad Mustafizur Rahman
1,
Mohammad Manjurul Haque
2 and
Mohammad Mizanur Rahman
1,*
1
Department of Soil Science, Bangabandhu Sheikh Mujibur Rahman Agricultural University, Gazipur 1706, Bangladesh
2
Department of Environmental Science, Bangabandhu Sheikh Mujibur Rahman Agricultural University, Gazipur 1706, Bangladesh
*
Author to whom correspondence should be addressed.
Sustainability 2022, 14(6), 3684; https://doi.org/10.3390/su14063684
Submission received: 23 January 2022 / Revised: 4 March 2022 / Accepted: 16 March 2022 / Published: 21 March 2022

Abstract

:
Soil carbon (C) mineralization was studied in an incubation experiment comprised of two factors having six organic materials and three nitrogen (N) rates. Cow dung (CD), rice straw (RS), wood ash (WA), cow dung biochar (CB), rice straw biochar (RB) and wood biochar (WB) considering 2.5 g C kg−1 soil along with three levels of N, i.e., 0, 0.05 and 0.10 g N kg−1 soil were mixed with 400 g of soil used in each pot. The pots were placed for 0, 30, 60, 90, 120, 150 and 180 days of incubation, and soils were collected after each incubation and analyzed for C and N. Irrespective of treatment factors, C decreased in an irregular fashion until 180 days of incubation. From the initial level of 1.91%, C contents decreased to 1.08, 1.10, 1.06, 1.23, 1.17 and 1.12% in soil mixed with CD, RS, WA, CB, RB and WB, respectively, and to 1.28, 1.11 and 0.99% in 0, 0.05 and 0.10 g N kg−1 soil, respectively, at 180 days of incubation. The mineralization followed the order of WA > CD > RS > WB > RB > CB. Biochars could supply stable C in soil, while N enhances mineralization; optimization of N is therefore essential to ensure soil C accretion.

1. Introduction

Organic carbon (OC) improves soil health and mitigates the negative consequences of global warming leading to climate change [1,2,3]. The average carbon (C) content in soil organic matter (OM) is 58% [4]. Soil OM ensures availability of plant nutrients, improvement of soil properties and C sequestration in soil [5,6]. OM along with N enhances microbial growth, which is responsible for mineralization. Soil N is also a driving variable in the decomposition of manures and residues, and it plays a vital role in nutrient cycling and the C sequestration process. In most ecosystems, the availability of N largely depends on the quantity of net N mineralization, where soil organic N is converted to inorganic N (NH4+ and NO3) through a microbial process [7]. Mineralization of different crop residues and composts in soil further depends on their C:N ratios and moisture contents, soil environment (soil moisture and temperature), microbial population, etc. Mineralization may affect OM content and nutrient release and thus play a major role in global C and N cycling [8].
The rate of OM mineralization in the soils of tropical and subtropical countries is usually very high due to the hyperthermic temperature regime, which affects C and N dynamics in agricultural soils [9,10]. Globally, agricultural land is decreasing because of new settlement and development activities such as road construction, industrialization, etc. Therefore, agricultural intensification is essential to produce more food, feed and fiber from the limited land resources. Intensive agriculture using only inorganic fertilizers and almost no reusing of organic fertilizers has reduced not only soil OC but also other plant nutrients, especially N, which leads to severe land degradation [11,12]. Nitrogen is the main yield-determining factor and its deficiency is one of the global concerns in intensive agriculture [13]. Globally, N is the greatest limiting plant nutrient in most cultivated soil [14,15]. Hence, a large amount of inorganic N fertilizer is required for higher crop production for the growing population. Optimal management of N is important, since otherwise it is easily lost from the soil system, leading to eutrophication, nitrate poisoning and global warming [16]. However, a balanced and optimum application of N along with other nutrients needs to be ensured. It was reported that excess N enhanced the mineralization of OM, leading to a decrease in C content in soil [17]. Inconsistent results were also reported in which N reduced OM mineralization [18]. On the other hand, integrated plant nutrition systems (IPNS) ensure the application of different organic fertilizers along with balanced doses of inorganic fertilizers which conserve soil C and ensure a clean environment [1]. Furthermore, the IPNS system provides a production environment that is optimal for crop nutrition and soil health and results in minimal nutrient loss [19]. It was shown that direct application of organic materials in soils hastened their microbial degradation and released the nutrients quickly, which enhanced leaching loss and CO2 emission into the atmosphere. Conversely, conversion of organic materials into biochar solved such problems, and sequestered more C in soils [20]. Biochar is a carbon-rich material, developed by heating organic biomass through a pyrolysis process at a high temperature (°C) under limited or no oxygen [21]. It can be applied as an organic amendment to agricultural soils, and its mineralization is very slow and C stays in soils for more than hundreds of years based on its source, quality and manufacturing methods as well as the temperature of pyrolysis [22,23,24]. Thus, the effect of biochar on soils lasts longer than that of non-biochar organic materials. However, how biochar responds to the addition of N has yet to be explored. It was hypothesized that N fertilizer may mineralize biochars at a slower rate compared to non-biochar materials. Thus, the objectives of the research were to quantify the release of C and available N from cow dung, rice straw, wood ash and their biochars as influenced by different rates of N. The strategic message of the research is to identify suitable organic amendments that might increase C content in soil so as to ultimately improve soil health and the environment.

2. Materials and Methods

2.1. Description of Study Site and Soils

The incubation experiment was conducted under a constant temperature of 25 °C at the Soil Science Laboratory of Bangabandhu Sheikh Mujibur Rahman Agricultural University (BSMRAU), Gazipur, Bangladesh. The soil used in the study was collected from the experimental farm of the BSMRAU located at 24.09° north latitude and 90.26° east longitude with an elevation of 8.4 m from the mean sea level. The soil is nationally classified as Salna series and shallow red brown terrace soil under the agro-ecological zones of Madhupur Tract, and internationally as Inceptisols according to the USDA classification system [25]. The soil is slightly acidic (pH 6.4), having a silty clay loam texture. Total N, organic C and the C:N ratio of the soil are presented in Table 1.

2.2. Experimental Design and Treatments

The experiment was comprised of two factors, viz., organic materials and N fertilizer were laid out in a factorial randomized complete block design with three replications. Six organic materials, i.e., cow dung (CD), rice straw (RS), wood ash (WA), cow dung biochar (CB), rice straw biochar (RB) and wood biochar (WB) considering 2.5 g C kg−1 soil along with three levels of nitrogen (N), i.e., 0, 0.05 and 0.10 g kg−1 soil were used in a pot experiment. The individual pot size was 10 cm × 20 cm, and 400 g of air-dried soil was used in each pot. RS and CD were collected from the BSMRAU research farm and were sun dried and used to produce biochar through pyrolysis at 400 °C to 550 °C in the absence of or with very limited amounts of oxygen using a biochar production stove. RS and CD were placed in the outer chamber of the stove and placed on the base of the burner. Heat was gradually increased using a gas flame burner in the bottom and middle of the chamber up to 400 to 500 °C and maintained for 4–5 h. The produced biochar was allowed to cool at room temperature and was then powdered and used in the experiment. WA and WB were supplied by the Christian Commission for the Development of Bangladesh (CCDB). Moisture, total N and C contents in the field soil and different organic materials are shown in Table 1. Field soil, organic materials and N as per treatments were mixed well and placed in pots for seven incubation periods of 0, 30, 60, 90, 120, 150 and 180 days. Thus, altogether, the number of pots was 378 (6 organic materials × 3 N rates × 3 replications × 7 incubation periods). The pots were incubated in an air-conditioned room where the temperature was maintained at 25 °C. The soil in the pots was kept moist throughout the study period by applying tap water. The timing of water application to the pots was set only through visual observation and a finger feel method to determine whether the soil was dry enough.

2.3. Collection of Soil Sample for Analysis

Soil samples were collected just after the mixing of organic materials and N fertilizer with soil, i.e., the initial soil samples, and after that in 30-day intervals (30, 60, 90, 120, 150 and 180 days). After each incubation, 54 pots (6 organic materials × 3 N rates × 3 replications) were separated, the soil was removed from the pots, mixed well, air dried in a room until a constant weight was achieved, and kept in plastic pots for organic C analysis. Available N (NH4+-N and NO3-N) in moist soil samples was analyzed as soon as possible after sample collection. The chemical properties of the soil and different organic materials were analyzed using standard methods such as OC by the wet oxidation method [26]. For the determination of organic C, one gram of soil was taken in an Erlenmeyer flask and then 10 mL of 1 N K2Cr2O7 solution was added to oxidize the organic carbon in the presence of 20 mL of concentrated H2SO4. The excess of 1 N K2Cr2O7 solution was titrated against the standardized FeSO4 solution in the presence of 2 mL of diphenylamine indicator to determine the exact amount of the dichromate solution used up. Organic C content in the soil was determined using Equation (1).
Organic   C   ( % ) = V 1 ( V 2 N ) W × 0.003 × 1.3 × 100
where V1 and V2 denote the volume of the K2Cr2O7 and FeSO4 solution used, N represents the normality of the FeSO4 solution, W indicates the weight of the soil taken, 1.3 is the conventional recovery factor and 1 mL of 1 N K2Cr2O7 is equivalent to 0.003 g of carbon.
Available N (NH4+-N and NO3-N) in the soil was determined calorimetrically using 2 M KCl extracting solution [27]. In brief, an amount of 5.0 g moist soil was taken into a 125 mL Erlenmeyer flask, to which 50 mL of 2.0 M KCl solution was added. Through extraction and filtration, an aliquot of 0.25 mL of extract was used for NO3-N and 1 mL for NH4+-N measurement. After that, the required reagents for nitrate and ammonium were added and readings were taken in a spectrophotometer at 410 nm for NO3-N and 650 nm for NH4+-N.
The carbon degradation rate constant (k) was calculated using the following equation [28]:
k = ( 1 t ) × ( ln ( Co ) ln ( Co C ) )
where C is the final and Co is the initial soil C; t indicates time in days. The higher k value indicates the slower degradation rate of the organic material.

2.4. Statistical Analysis

The data were analyzed by two-way ANOVA using the Statistix 10 statistical software and treatment means were separated by least significant difference (LSD). The significance level was determined at p ≤ 0.05. Different graphs were prepared using Microsoft Excel from Office 2007.

3. Results

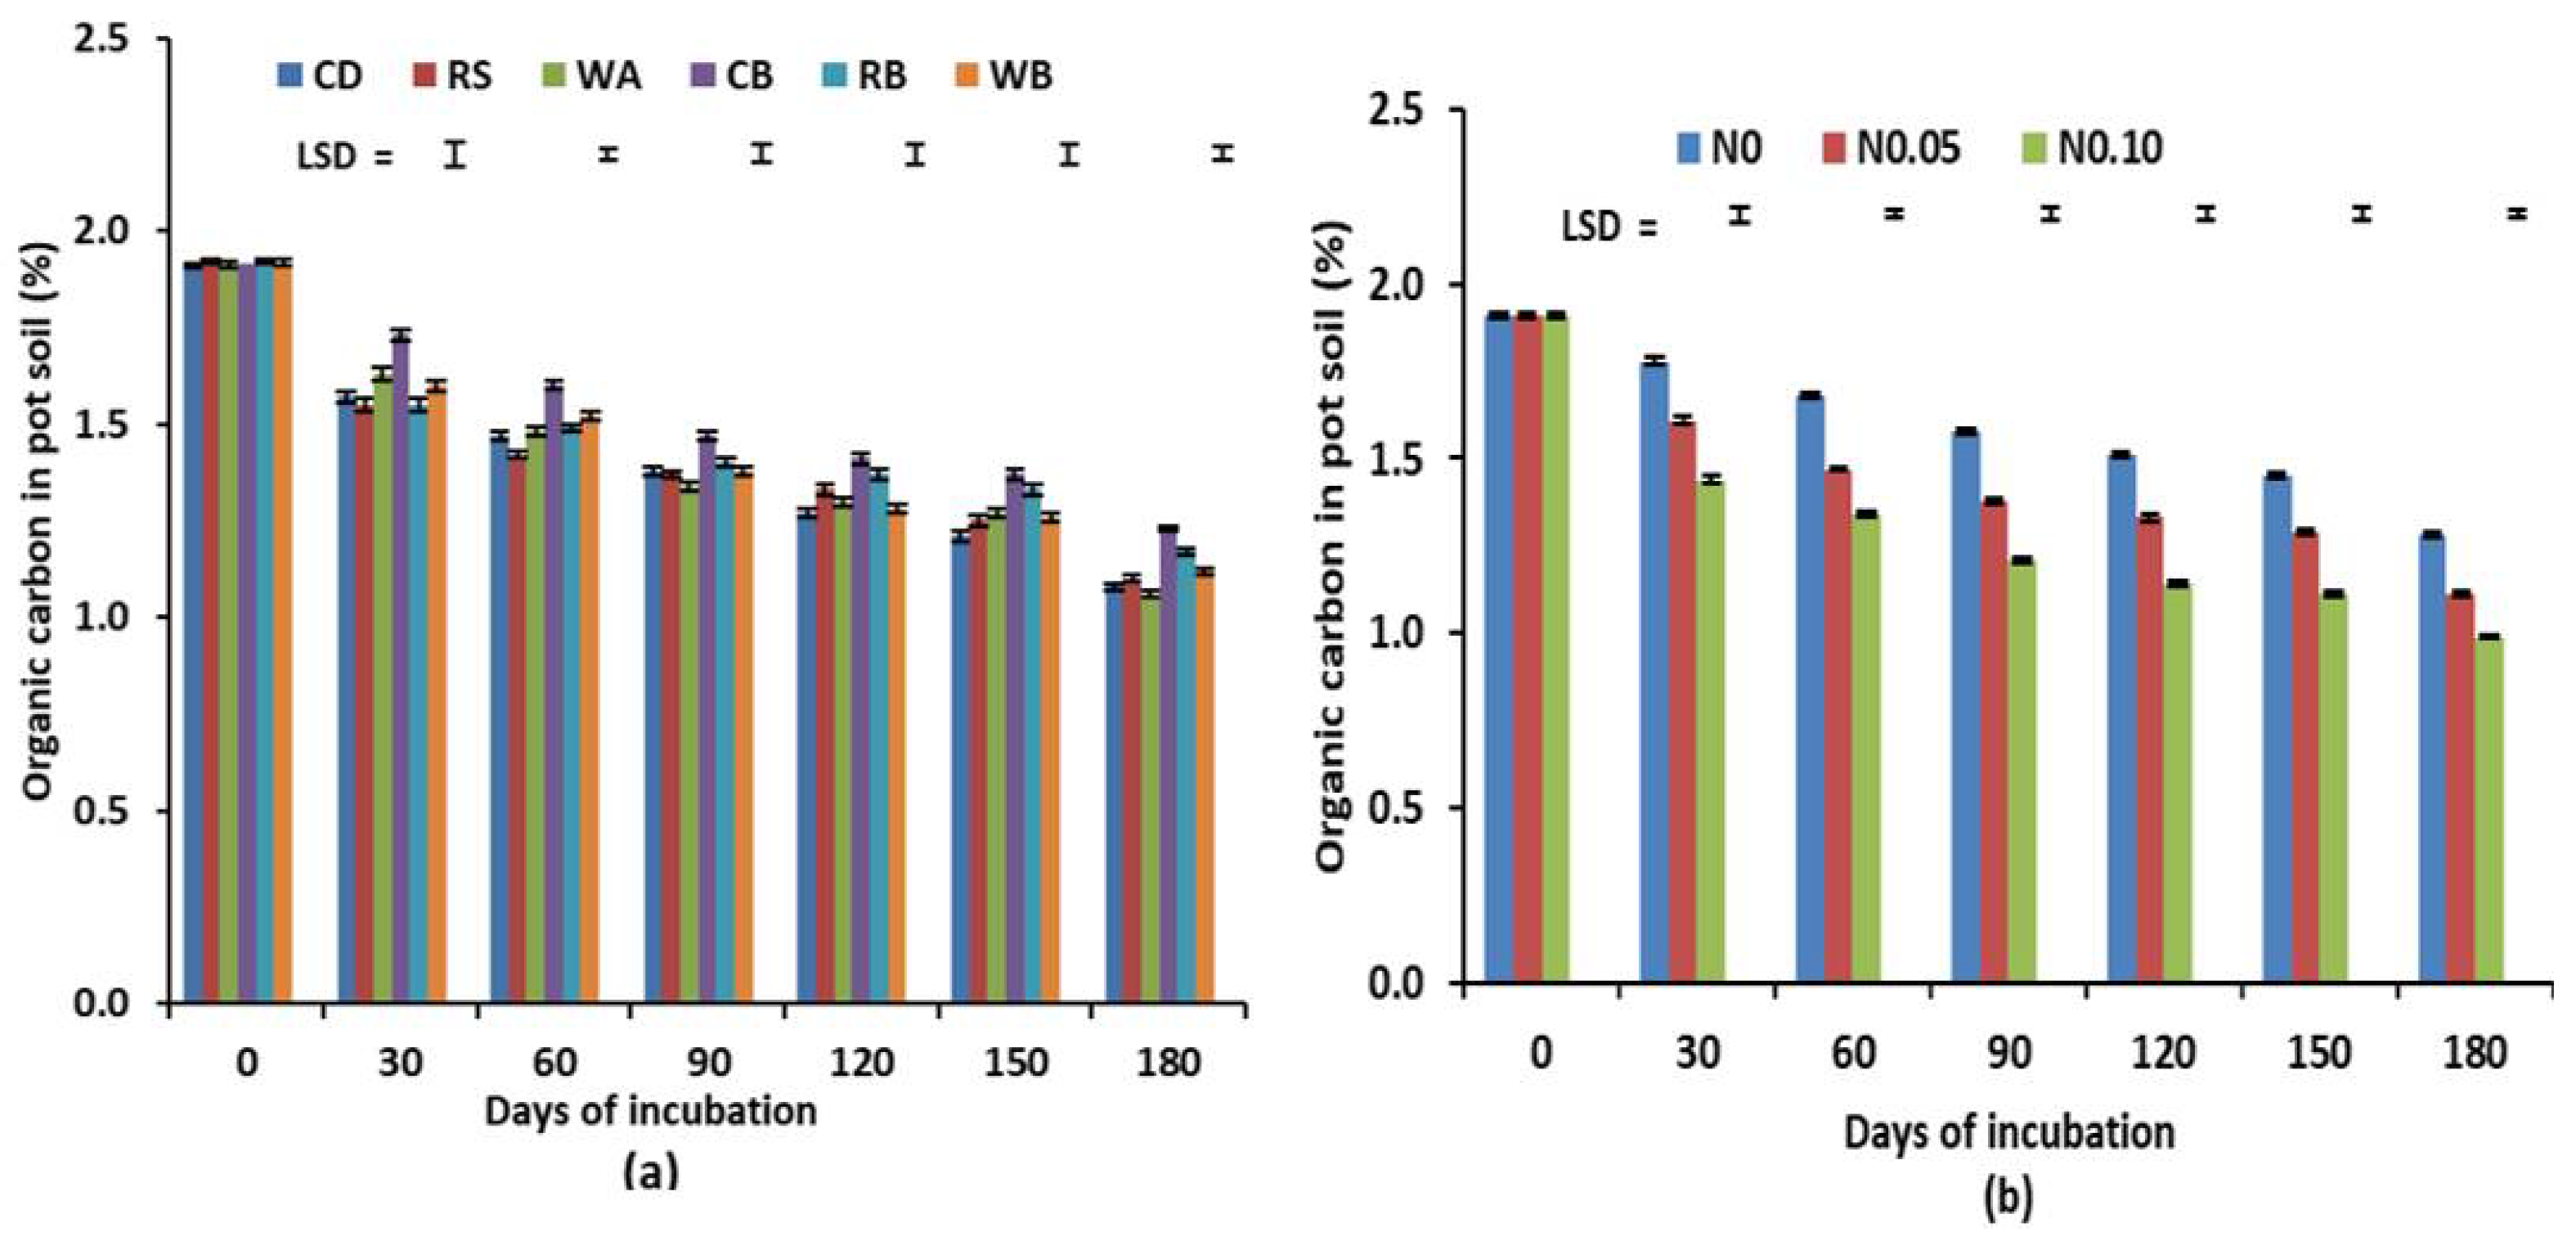
3.1. Carbon Reduction Trend and Degradation Rate Constant

Different organic materials and N rates showed significant variations in OC contents in pot soil at different days of incubation (p < 0.05). We observed that C content gradually decreased with the advancement of incubation periods in soils treated with different organic materials (Figure 1a). However, the OC content varied significantly among the organic materials corresponding with each date of sampling. After day 0 of incubation (just after the mixing of soil, organic materials and N fertilizer), OC content began to decline with a slight fluctuation in all soils treated with organic materials. The OC content reached its lowest level at 180 days of incubation. The OC content in soils under all organic treatments at day 0 was 1.91%, with an insignificant variation observed due to differences of moisture and C contents. From the initial level of 1.91%, the C contents remarkably decreased to 1.08, 1.10, 1.06, 1.23, 1.17 and 1.12% in soil amended with CD, RS, WA, CB, RB and WB, respectively, at 180 days of incubation. Interestingly, a major reduction in C content occurred during the first 30 days. At 30 days of incubation, C content diminished by 34, 37, 28, 19, 37 and 32% in CD, RS, WA, CB, RB and WB, respectively, while during the remaining days, i.e., from 30 to 180 days, C declined by 49, 45, 57, 50, 38 and 48%, respectively, following almost a steady rate. The OC contents in pot soils began to decline with the progress of the incubation periods, and finally reached their lowest level at 180 days in response to the application of different doses of N. The soil treated with 0, 0.05 and 0.10 g N kg−1 soil contained 1.28, 1.11 and 0.99% C, respectively, at day 180 of the incubation period (Figure 1b). An almost similar C reduction under N rates was observed after organic treatments.
The interaction effects of different organic materials and N rates on the C content of the treated soils were found to be significant at 60, 90, 120, 150 and 180 days of incubation (Table 2). At 60 days of incubation, WB with 0 g N kg−1 soil resulted in the highest C of 1.73%, while 1.71% was in CB, which did not considerably vary with other organic amendments. In all other cases, i.e., at 90, 120, 150 and 180 days of incubation, CB displayed superiority in holding more C compared to all other organic materials and all N rates. Under the 0 N rate, C content in soils mixed with CB were noted to be 1.66, 1.58, 1.53 and 1.34% at 90, 120, 150 and 180 days of incubation, respectively, while in 0.1 g N kg−1 soil, C contents were 1.51, 1.25, 1.24, 1.22 and 1.12%, respectively. It was observed that C contents in all organic amended soils were reduced with the increased rates of N in all incubation periods. As an exception, it is worth mentioning that all biochars contributed to higher C retention in soils compared to non-biochar materials under all N rates. CB exhibited the maximum C retention among the six organic materials in all cases of N rates.
The rates of C degradation (k) fluctuated significantly in response to organic materials and N rates (p < 0.05), while the interaction effect of organic materials and N did not vary significantly (Table 3). The k values of different organic materials varied from 0.00448 to 0.00571 (Table 3). The lowest k value was found in the WA-amended soil, while the highest was achieved in the CB-treated soil. In the case of N rates, the maximum k value was detected in the 0 g N kg−1 soil (0.00616), while the minimum was in the 0.1 g N kg−1 soil (0.00405). The higher k value is linked with a slower rate of degradation of that material [28]. In this study, the rate of degradation was slower in CB compared to other organic materials.

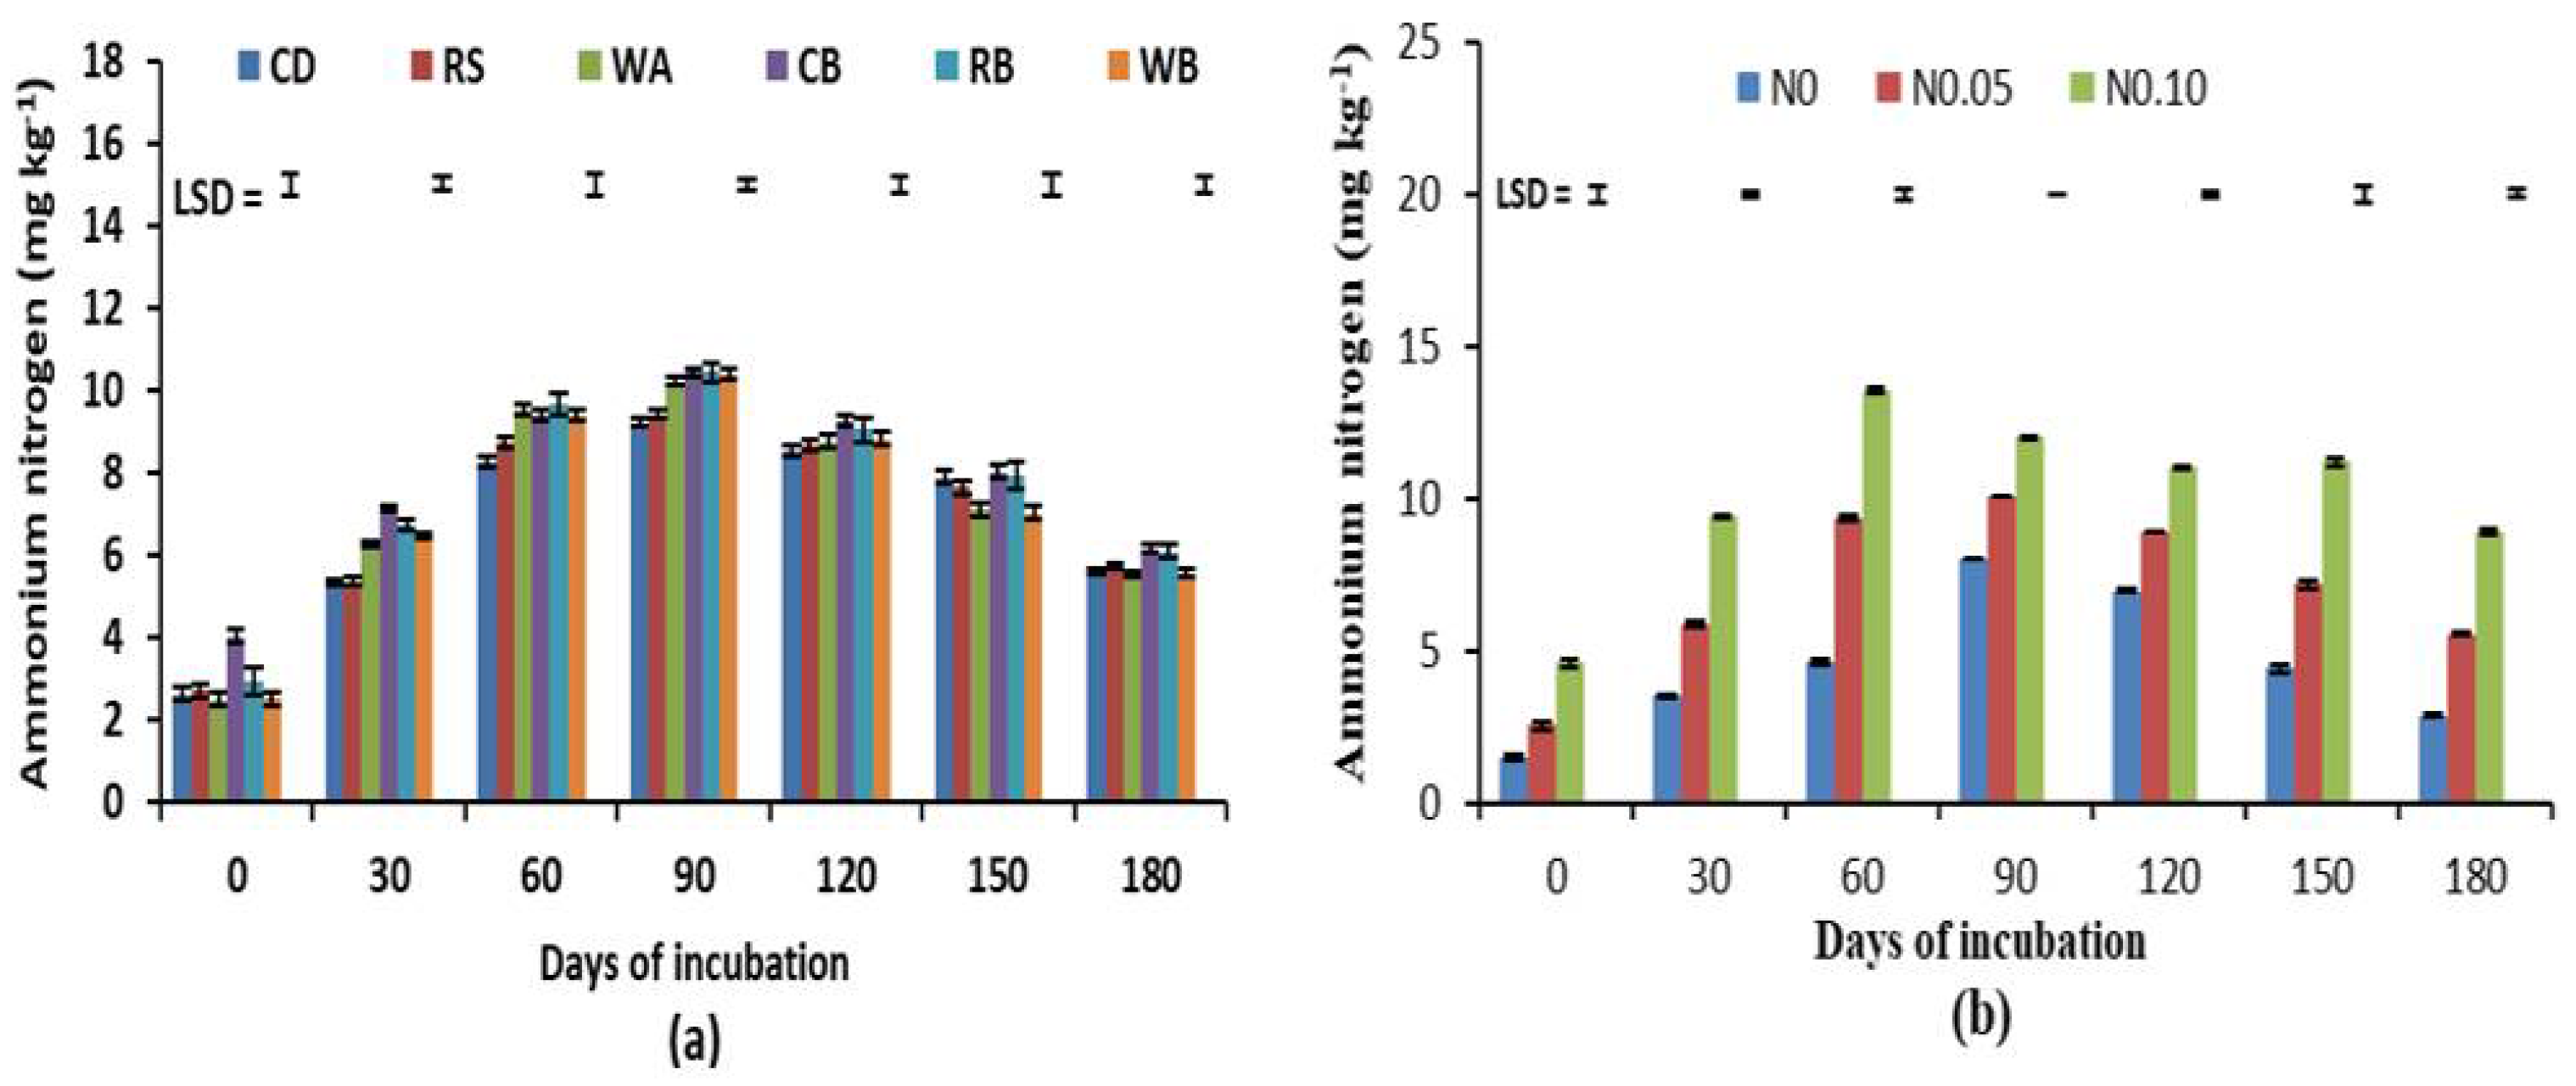
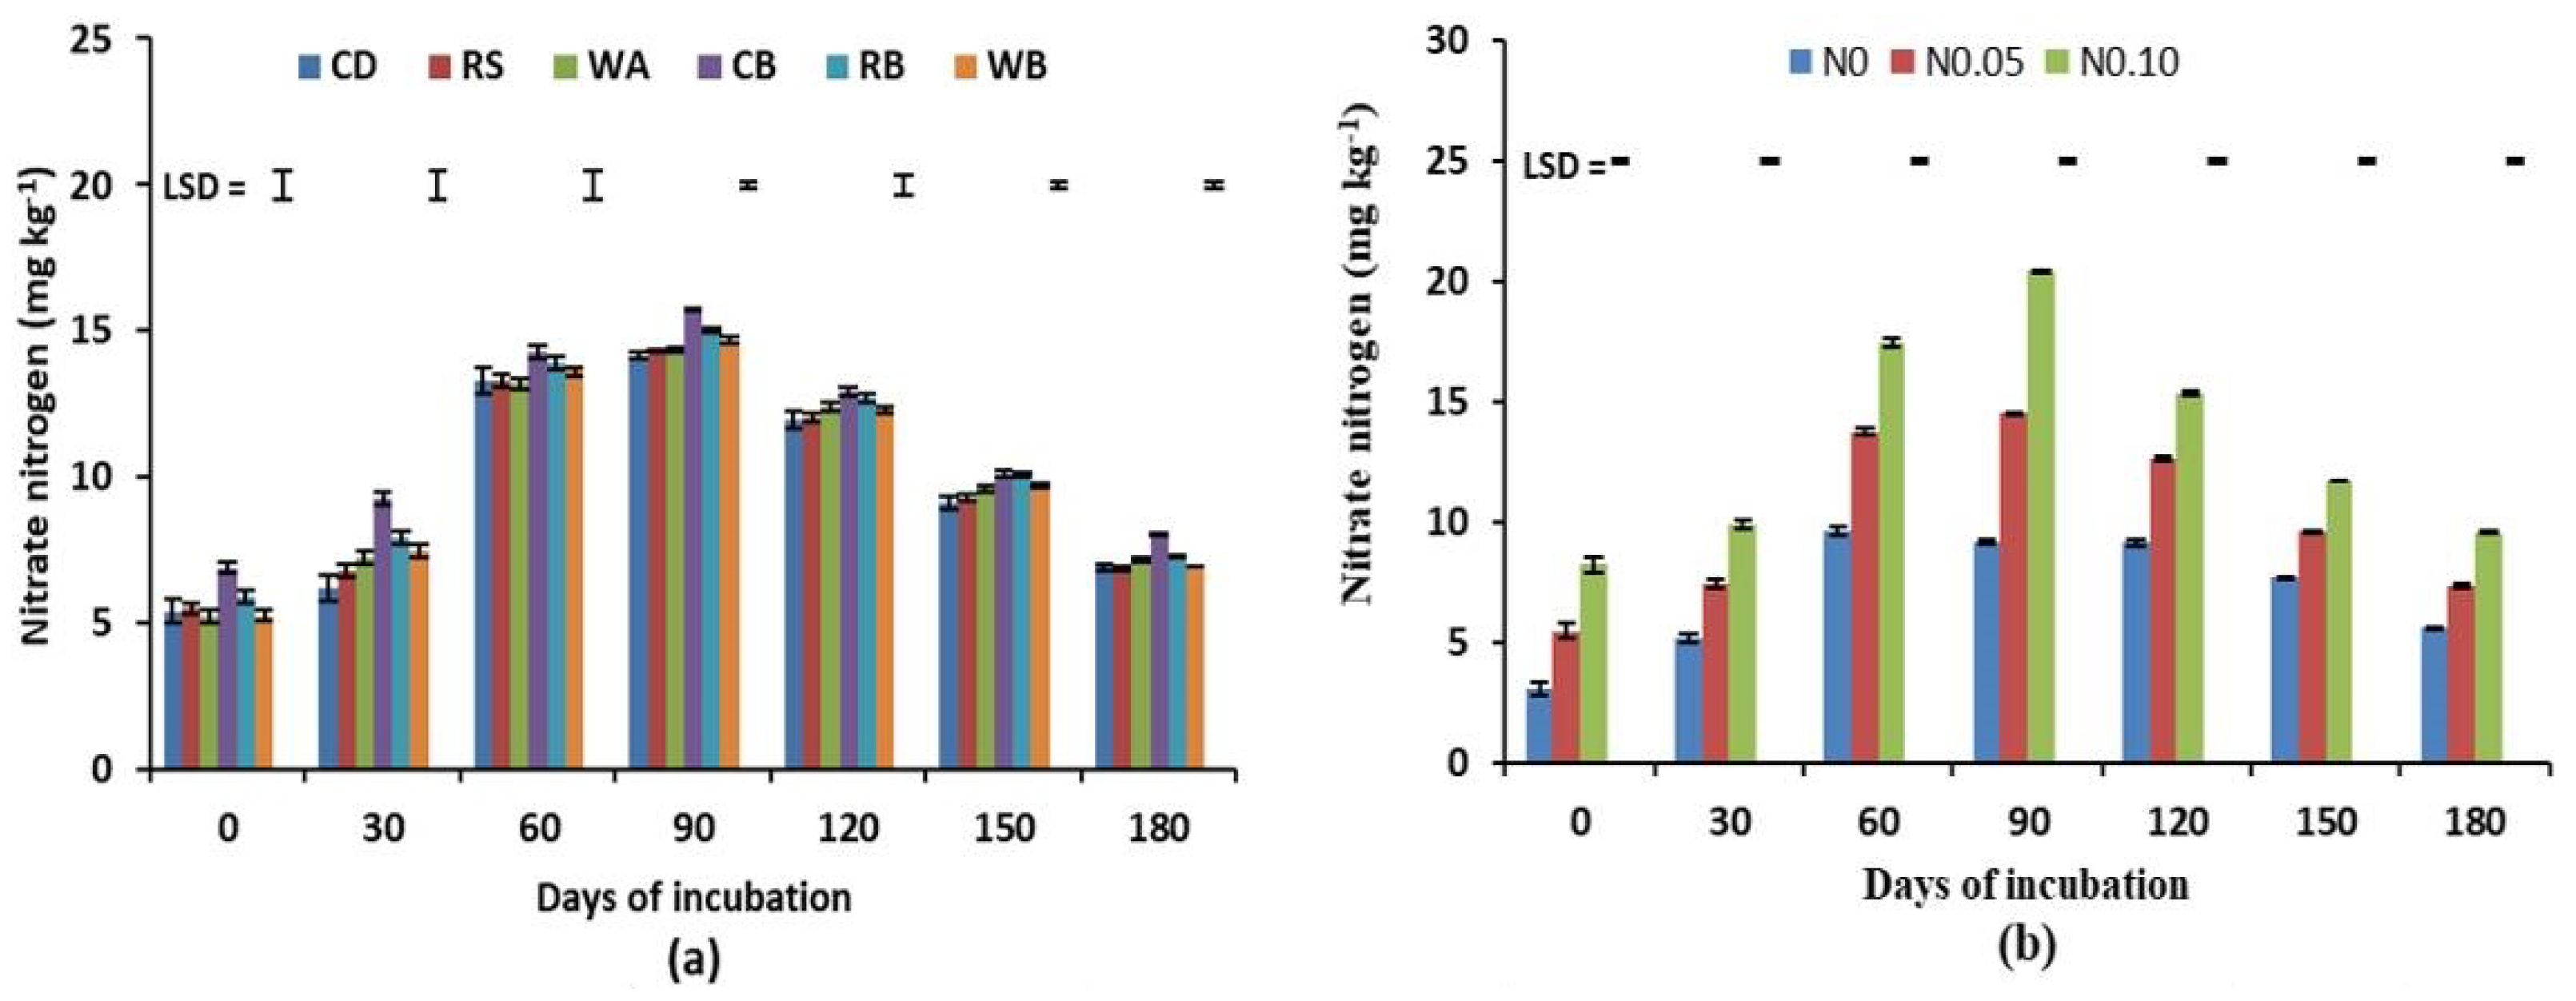
3.2. Available Soil N

Organic materials, N rates and their interaction contributed significantly towards the availability of ammonium and nitrate N in pot soils at different days of incubation (p < 0.05). Ammonium nitrogen (NH4+-N) increased gradually in pot soils from 0 to 90 days of incubation and decreased following an almost similar trend until 180 days of incubation (Figure 2a).
At day 0, the NH4+-N contents in pot soils were 2.63, 2.74, 2.49, 4.01, 2.93 and 2.52, in soils treated with CD, RS, WA, CB, RB and WB, respectively, while at 180 days, these values were 5.61, 5.73, 5.54, 6.16, 6.09 and 5.56 mg kg−1, respectively. The maximum NH4+-N (10.45 mg kg−1) was found at 90 days of incubation in CB and RB followed by WB (10.39 mg kg−1), WA (10.23 mg kg−1), RS (9.43 mg kg−1) and CD (9.22 mg kg−1).
In the case of N rates, NH4+-N contents gradually increased up to 60 days of incubation and then decreased following the same trend, and finally reached their lowest level at 180 days of incubation (Figure 2b). It was noted that in all incubation periods, the significantly higher amount of NH4+-N in pot soils was attributed to an N rate of 0.1 g N kg −1 soil. The soil that received 0, 0.05 and 0.10 g N kg−1 as treatment contained 4.63, 9.36 and 13.53 mg NH4+-N kg−1, respectively, at 60 days of incubation. At day 0 of incubation, NH4+-N contents under 0, 0.05 and 0.10 g N kg−1 were 1.51, 2.55 and 4.60 mg kg−1, respectively, while at 180 days, these values were 2.87, 5.55 and 8.90 mg kg−1, respectively.
NO3-N as well as NH4+-N was amplified gradually in soils amended with different organic materials from 0 to 90 days of incubation, and afterward declined almost in a similar way until 180 days of incubation (Figure 3a). At 90 days of incubation, the maximum NO3-N in soil was recorded in CB (15.73 mg kg−1), followed by RB (15.00 mg kg−1), WB (14.66 mg kg−1), WA (14.36 mg kg−1), RS (14.30 mg kg−1) and CD (14.15 mg kg−1). Conversely, at 180 days of incubation, NO3-N was detected to be 6.92, 6.88, 7.16, 8.02, 7.29 and 7.02 mg kg−1 in soils amended with CD, RS, WA, CB, RB and WB, respectively. Similar trends of NO3-N were observed for N rates. Significantly, the higher amount of NO3-N in soils was attributed to a higher N rate of 0.1 g N kg−1 soil in all the incubation periods. However, at 90 days of incubation, NO3-N contents in pot soils under 0, 0.05 and 0.1 g N kg−1 were estimated to be 9.16, 14.51 and 20.44 mg kg−1, respectively (Figure 3b).
The interaction effects of organic materials and N rates on the availability of NH4+-N and NO3-N in pot soils during 90, 120 and 150 days of incubation showed significant variations (Table 4). Different organic materials exhibited their superiority in releasing available N to soils at different days of incubation. However, irrespective of organic materials, a higher N rate of 0.1 g N kg−1 always provided a maximum effect in the release of both NH4+-N and NO3-N to soils. However, CB with 0.1 g N kg−1 soil delivered the highest concentration of NH4+-N (12.44 mg kg−1) and NO3-N (21.50 mg kg−1) at 90 days of incubation. At 120 days of incubation, RB with 0.1 g N kg−1 soil provided the maximum NH4+-N (9.37 mg kg−1), while CB released the maximum amount of NO3-N (11.43 mg kg−1) on this day. At 150 days of incubation, the interaction of RS along with 0.1 g N kg−1 released the maximum amount of NH4+-N (12.61 mg kg−1), while CB with 0.1 g N kg−1 showed the maximum NO3-N (12.33 mg kg−1) in soil (Table 4).

4. Discussion

A major reduction in C content (19–37%) in soils treated with different organic amendments occurred during the first 30 days of incubation (Figure 1a). N rates as well as organic treatments contributed to C reduction with the progress of incubation time, and greater reductions occurred at higher N rates (Figure 1b). Overall, the reduction percentage was found to be lower in biochar materials than in non-biochar materials. Furthermore, CB showed better efficiency in holding C in soil compared to RB and WB. Carbon reduction in soils occurs due to the mineralization of organic materials through heterotopic microbes. It was reported that not only N supply but also soil moisture, temperature organic materials played a pivotal role in C reduction by different microorganisms [29]. The C:N ratio is crucial for the mineralization of organic materials. The optimum C:N ratio for composting is 25–30:1, while less than the optimum assists with speedy mineralization [30,31,32]. In the present study, the mineralization of WA and CD was found to be higher, perhaps because they have lower C:N ratios than other organic materials (Table 1), which might favor rapid microbial decomposition. Rahman [33] observed that after the incorporation of crop residues and different OM into soils, about 30 days are required for maximal microbial activity depending on the C:N ratios provided by the organic materials. However, more time is required to decompose the materials if C content is high. The C:N ratios of biochar materials were comparatively higher than those of non-biochar materials (Table 1). Hence, their mineralization was slow. Therefore, C content was found to be higher at the end of 180 days of incubation. Organic C converts to CO2 and releases it from the soil to the atmosphere [33]. Manure with higher moisture and N contents significantly increases CO2 emission from soil [3,34]. Chemical oxidation of organic residues also contributes to CO2 emission from soils, which is normally pronounced at higher temperatures [35]. However, the proper management of organic manures and wastes and the conversion of organic materials to biochar played a vital role in reducing CO2 emissions and increasing C sequestration in soils [20,36].
Reductions in the C of added organic amendments and inherent OM in soils with the addition of higher N rates revealed that excess N contributed to faster mineralization (Table 2). The addition of N contributed to lower C:N ratios of pot soil mixed with soil and organic materials. Such a reduction in C:N ratios means the availability of higher amounts of nitrogen, which enhances microbial activities and augments the mineralization of OM in pot soils. Thus, the resultant effect was reduction in C contents in pot soil. Such findings have been reported by many other researchers across the world. In an experiment conducted on rice-based cropping systems using different N rates and organic materials [17], it was found that mineralization greatly increased and C content in soil decreased at higher N rates of 150 kg ha−1 compared to 100 kg ha−1. Microbial breakdown of organic materials added to the inherent needs supply of inorganic N to accelerate the mineralization process [37].
Significantly higher k values were found in biochar materials compared to non-biochar materials, while CB among other biochars exhibited the highest k value (Table 3). The lower N rates also contributed to higher k values. The higher k values revealed that the mineralization process in soil is comparatively slower. Higher rates of N favor the microbial decomposition of OM added to soil. Hence, the k values under higher N rates were found to be lower. The results of the present study are supported by the findings of Hossain et al. [28]. One explanation of this is that the C:N ratio of biochar is generally high and needs several cycles for its degradation by microorganisms—and extra time is obviously needed to decompose it. The carbon degradation of different materials varies depending on the nature and types of organic residues and prevailing environmental conditions [28]. Different researchers have found a wide range of C degradation rate constants for different materials, but it is very unusual for similar data to be reproduced, as the experimental setup and environmental conditions vary widely from one experiment to another. Biochar may contain more stable C as it is a pyrolyzed by-product and it thereby reduces CO2 emissions from amended soil [20,38]. Biochars produced from different organic materials can be used as soil amendments and can remain for a long time in soil, from hundreds to thousands of years [39]. Because of the aromatic ring structure of biochar, it is considered a stable source of C in soil, which could reduce GHG emissions into the atmosphere [40,41]. The present study did not measure CO2 emissions, but as biochar is found to be efficient in increasing C stock and conserving it for a longer time in soil, it might contribute to releasing less CO2. From the oxidation of C to CO2 it can be estimated that any management practice capable of increasing 1 kg of C in soil might reduce 3.67 kg of CO2 emissions from soil to the atmosphere.
It was found that NH4+-N and NO3-N in soils mixed with different organic materials increased gradually from 0 to 90 days of incubation and after that decreased in almost the same manner until 180 days of incubation (Figure 2a and Figure 3a). On the other hand, N rates contributed to the maximum NH4+-N at 60 days of incubation (Figure 2b), while NO3-N reached its peak at 90 days of incubation (Figure 3b). During this period the intense degradation of organic amendments helped to release NH4+ and NO3 in soils, which then gradually decreased until 180 days of incubation. These results indicate that with the advancement of the incubation period some amount of NH4+ might escape from the soil as NH3 gas through volatilization [42].
Organic materials and N added to soils are subject to several transformations that ensure the availability of NH4+ and NO3 to plants [17]. These transformations and the dynamics of N in soils depend on the aeration and submergence of soils. Through microbial breakdown, organic materials and N compounds release NH4+-N to soils, which is predominant in the anaerobic condition [11]. This NH4+ is subject to further changes in the soil system through nitrification, producing NO3. NO3-N contents in soils were found to be continuously higher compared to NH4+-N in soils with all types of organic materials and N rates (Table 4). The experiment was conducted under laboratory conditions while a minimum amount of water was applied to maintain soil moisture in order to enhance the microbial decomposition process and maintain the aerobic condition of the soil. Therefore, NO3-N was found to be dominant in the soil.

5. Conclusions

Biochar could be a promising tool to increase C stock and sustain soil health, particularly in the tropical and subtropical regions where C contents in soils are low. The present study unveiled the potential of biochar in holding more C in soil, while N enhances mineralization, so that optimization of N is essential to ensure soil C accretion. In the present study CO2 emissions were not determined. However, from the conversion of C to CO2 it can be calculated that any practice capable of increasing 1 kg of C in soil might reduce 3.67 kg of CO2 emissions from soil to the atmosphere. This statement, and the findings of the present study on C stock increases through biochar, would facilitate the advocacy of biochar application in soil. The increment and stability of C in soil through biochar application depends on a large number of factors, viz., the type and composition of feedstock, pyrolysis temperature, retention time during pyrolysis, biochar application rates, soil types, soil moisture, pH, microbial abundance in soil, etc. However, it is ensured that biochars are more efficient in increasing and holding C in soil compared to non-biochar organic materials. Among the organic materials used in the study, RS and CD are widely available in many countries. Therefore, conversion of these two materials into biochar and its application to crop fields may be the best option to increase C sequestration and mitigate global warming leading to climate change.

Author Contributions

Conceptualization, M.M.R. and G.K.M.M.R.; methodology, M.H., M.M.H. and M.M.R.; software, M.M.R. and M.A.A.; validation, M.H., M.S.A. and M.Z.U.K.; formal analysis, M.M.R., M.K. and M.M.H.; investigation, M.H. and B.I.B.; resources, M.M.R., M.S.A. and G.K.M.M.R.; data curation, M.H., M.A.A., M.Z.U.K. and B.I.B.; writing—original draft preparation, M.H.; writing—review and editing, M.H.K., M.Z.U.K., M.S.A., G.K.M.M.R. and M.M.R.; visualization, M.H.K., M.A.A. and M.H.; supervision, M.M.R.; project administration, M.M.R.; funding acquisition, M.M.R. All authors have read and agreed to the published version of the manuscript.

Funding

This research received no external funding.

Institutional Review Board Statement

Not applicable.

Informed Consent Statement

Not applicable.

Data Availability Statement

The data that support the findings of this study are available from the corresponding author upon reasonable request.

Acknowledgments

This study is a contribution of the GCRF South Asian Nitrogen Hub (SANH), funded through the Global Challenge Research Fund (Grant Ref. Number NE/S009019/1), and the Modelling Climate Change Impact on Bangladesh Agriculture (MCCA) Project, CRP II of the Krishi Gobeshona Foundation (KGF), Bangladesh. The authors sincerely acknowledge the Christian Commission for Development in Bangladesh for providing wood ash and wood biochar for the study. The authors also acknowledge the support of the Department of Soil Science, Bangabandhu Sheikh Mujibur Rahman Agricultural University, Gazipur, Bangladesh, for chemical analyses of soil samples for different parameters.

Conflicts of Interest

The authors declare no conflict of interests.

References

  1. Fageria, N.K. Role of Soil Organic Matter in Maintaining Sustainability of Cropping Systems. Commun. Soil Sci. Plant Anal. 2012, 43, 2063–2113. [Google Scholar] [CrossRef]
  2. Rahman, M.M. Nutrient-Use and Carbon-Sequestration Efficiencies in Soils from Different Organic Wastes in Rice and Tomato Cultivation. Commun. Soil Sci. Plant Anal. 2013, 44, 1457–1471. [Google Scholar] [CrossRef]
  3. Rahman, F.; Rahman, M.; Rahman, G.M.; Saleque, M.; Hossain, A.S.; Miah, G. Effect of organic and inorganic fertilizers and rice straw on carbon sequestration and soil fertility under a rice–rice cropping pattern. Carbon Manag. 2016, 7, 41–53. [Google Scholar] [CrossRef]
  4. Johnston, A.E.; Poulton, P.R.; Coleman, K. Soil organic matter: Its importance in sustainable agriculture and carbon dioxide fluxes. Adv. Agron. 2009, 101, 1–57. [Google Scholar]
  5. Lal, R. Enhancing crop yields in the developing countries through restoration of the soil organic carbon pool in agricultural lands. Land Degrad. Dev. 2006, 17, 197–209. [Google Scholar] [CrossRef]
  6. Gnanavelrajah, N.; Shrestha, R.P.; Schmidt-Vogt, D.; Samarakoon, L. Carbon stock assessment and soil carbon management in agricultural land-uses in Thailand. Land Degrad. Dev. 2008, 19, 242–256. [Google Scholar] [CrossRef]
  7. Chapin, I.F.S.; Chapin, M.C.; Matson, P.A.; Vitousek, P. Principles of Terrestrial Ecosystem Ecology; Springer: Berlin, Germany, 2011. [Google Scholar]
  8. Manzoni, S.; Jackson, R.B.; Trofymow, J.A.; Porporato, A. The Global Stoichiometry of Litter Nitrogen Mineralization. Science 2008, 321, 684–686. [Google Scholar] [CrossRef] [PubMed]
  9. Mandal, B.; Majumder, B.; Bandyopadhyay, P.K.; Hazra, G.C.; Gangopadhyay, A.; Samantaray, R.N.; Mishra, A.K.; Chaudhury, J.; Saha, M.N.; Kundu, S. The potential of cropping systems and soil amendments for carbon sequestration in soils under long-term experiments in subtropical India. Glob. Change Biol. 2007, 13, 357–369. [Google Scholar] [CrossRef]
  10. Rahman, M.M. Carbon and nitrogen dynamics and carbon sequestration in soils under different residue management. Agriculture 2014, 12, 48–55. [Google Scholar] [CrossRef] [Green Version]
  11. Rahman, M.M. Carbon sequestration options in soils under different crops and their management practices. Agriculture 2010, 8, 90–101. [Google Scholar]
  12. Diacono, M.; Montemurro, F. Long-Term Effects of Organic Amendments on Soil Fertility. Sustain. Agric. 2011, 2, 761–786. [Google Scholar] [CrossRef]
  13. Spiertz, J.H.J. Nitrogen, Sustainable Agriculture and Food Security: A Review in Sustainable Agriculture; Springer Science and Business Media LLC.: Berlin, Germany, 2009; pp. 635–651. [Google Scholar]
  14. Fageria, N.K.; Baligar, V.C. Enhancing Nitrogen Use Efficiency in Crop Plants. Adv. Agron. 2005, 88, 97–185. [Google Scholar] [CrossRef]
  15. Fertilizer Recommendation Guide (FRG); Bangladesh Agricultural Research Council (BARC) Farmgate: Dhaka, Bangladesh, 2018; p. 274.
  16. Withers, P.J.A.; Neal, C.; Jarvie, H.P.; Doody, D.G. Agriculture and Eutrophication: Where Do We Go from Here? Sustainability 2014, 6, 5853–5875. [Google Scholar] [CrossRef] [Green Version]
  17. Alam, A.; Rahman, M.; Biswas, J.C.; Akhter, S.; Maniruzzaman, M.; Choudhury, A.K.; Jahan, M.A.H.S.; Miah, M.U.; Sen, R.; Kamal, M.Z.U.; et al. Nitrogen transformation and carbon sequestration in wetland paddy field of Bangladesh. Paddy Water Environ. 2019, 17, 677–688. [Google Scholar] [CrossRef]
  18. Fisk, M.; Santangelo, S.; Minick, K. Carbon mineralization is promoted by phosphorus and reduced by nitrogen ad-dition in the organic horizon of northern hardwood forests. Soil Biol. Biochem. 2015, 81, 212–218. [Google Scholar] [CrossRef]
  19. Das, D.; Dwivedi, B.S.; Meena, M.C.; Singh, V.K.; Tiwari, K.N. Integrated nutrient management for improving soil health and crop productivity. Indian J. Fertil. 2015, 11, 64–83. [Google Scholar]
  20. Carbon and Nitrogen Cycling in Soil in Carbon and Nitrogen Cycling in Soil; Springer Science and Business Media LLC.: Berlin, Germany, 2020; pp. 45–85.
  21. Wu, P.; Wang, Z.; Wang, H.; Bolan, N.S.; Wang, Y.; Chen, W. Visualizing the emerging trends of biochar research and applications in 2019: A scientometric analysis and review. Biochar 2020, 2, 135–150. [Google Scholar] [CrossRef]
  22. Zimmerman, A.R. Abiotic and Microbial Oxidation of Laboratory-Produced Black Carbon (Biochar). Environ. Sci. Technol. 2010, 44, 1295–1301. [Google Scholar] [CrossRef]
  23. Lehmann, J.; Rillig, M.C.; Thies, J.; Masiello, C.A.; Hockaday, W.C.; Crowley, W. Biochar effects on soil biota—A review. Soil Biol. Biochem. 2011, 43, 1812–1836. [Google Scholar] [CrossRef]
  24. Michael, P.S. Cogon grass biochar amendment and Panicum coloratum planting improve selected properties of sandy soil under humid lowland tropical climatic conditions. Biochar 2020, 2, 489–502. [Google Scholar] [CrossRef]
  25. Brammer, H.; Antoine, J.; Kassam, A.H.; van Velthuizen, H.T. Land Resources Appraisal of Bangladesh for Agricultural Development in Report 3, Land Resources Data Base, Volume II; Soil, Landform and Hydrological Data Base; UNDP/FAO: Rome, Italy, 1988. [Google Scholar]
  26. Walkley, A.C.; Black, T.A. Estimation of soil organic carbon by chromic acid titration method. Soil Sci. 1935, 47, 29–38. [Google Scholar]
  27. Maynard, D.G.; Kalra, Y.P.; CruWAaugh, J.A. Nitrate and Exchangeable Ammonium Nitrogen in Soil Sampling and Methods of Analysis; CRC Press, Taylor and Francis Group: Boca Raton, FL, USA, 1993. [Google Scholar]
  28. Hossain, M.B.; Rahman, M.M.; Biswas, J.C.; Miah, M.M.U.; Akhter, S.; Maniruzzaman, M.; Choudhury, A.K.; Ahmed, F.; Shiragi, M.H.K.; Kalra, N. Carbon mineralization and carbon dioxide emission from organic matter added soil under different temperature regimes. Int. J. Recycl. Org. Waste Agric. 2017, 6, 311–319. [Google Scholar] [CrossRef] [Green Version]
  29. Davidson, E.A.; Janssens, I.A. Temperature sensitivity of soil carbon decomposition and feedbacks to climate change. Nature 2006, 440, 165–173. [Google Scholar] [CrossRef] [PubMed]
  30. Cabrera, M.L.; Kissel, D.E.; Vigil, M.F. Nitrogen mineralization from organic residues: Research opportunities. J. Environ. Qual. 2005, 34, 75–79. [Google Scholar] [CrossRef] [Green Version]
  31. Wang, X.; Yang, G.; Feng, Y.; Ren, G.; Han, X. Optimizing feeding composition and carbon–nitrogen ratios for improved methane yield during anaerobic co-digestion of dairy, chicken manure and wheat straw. Bioresour. Technol. 2012, 120, 78–83. [Google Scholar] [CrossRef] [PubMed]
  32. Nurliyana, M.; H’Ng, P.; Rasmina, H.; Kalsom, M.U.; Chin, K.L.; Lee, S.H.; Lum, W.; Khoo, G. Effect of C/N ratio in methane productivity and biodegradability during facultative co-digestion of palm oil mill effluent and empty fruit bunch. Ind. Crop. Prod. 2015, 76, 409–415. [Google Scholar] [CrossRef]
  33. Rahman, M. Carbon Dioxide Emission from Soil. Agric. Res. 2013, 2, 132–139. [Google Scholar] [CrossRef] [Green Version]
  34. NI, J.-Q.; Heber, A.; Hanni, S.; Lim, T.; Diehl, C. Characteristics of ammonia and carbon dioxide releases from layer hen manure. Br. Poult. Sci. 2010, 51, 326–334. [Google Scholar] [CrossRef]
  35. Rastogi, M.; Singh, S.; Pathak, H. Emission of carbon dioxide from soil. Curr. Sci. 2002, 82, 510–517. [Google Scholar]
  36. Russell, A.E.; Larid, D.A.; Parkin, T.B.; Mallarino, A.P. Impact of nitrogen fertilization and cropping system on carbon sequestration in Midwestern Mollisols. Soil Sci. Soc. Am. J. 2005, 69, 413–422. [Google Scholar] [CrossRef] [Green Version]
  37. Kuzyakov, Y.; Friedel, J.; Stahr, K. Review of mechanisms and quantification of priming effects. Soil Biol. Biochem. 2000, 32, 1485–1498. [Google Scholar] [CrossRef]
  38. Nielsen, S.; Minchin, T.; Kimber, S.; Van Zwieten, L.; Gilbert, J.; Munroe, P.; Joseph, S.; Thomas, T. Comparative analysis of the microbial communities in agricultural soil amended with enhanced biochars or traditional fertilisers. Agric. Ecosyst. Environ. 2014, 191, 73–82. [Google Scholar] [CrossRef]
  39. Yuan, J.-H.; Xu, R.-K. Effects of biochars generated from crop residues on chemical properties of acid soils from tropical and subtropical China. Soil Res. 2012, 50, 570–578. [Google Scholar] [CrossRef]
  40. Lehmann, J. Bio-energy in the black. Front. Ecol. Environ. 2007, 5, 381–387. [Google Scholar] [CrossRef] [Green Version]
  41. Bolan, N.; Kunhikrishnan, A.; Choppala, G.; Thangarajan, R.; Chung, J. Stabilization of carbon in composts and biochars in relation to carbon sequestration and soil fertility. Sci. Total Environ. 2012, 424, 264–270. [Google Scholar] [CrossRef] [PubMed]
  42. Brady, N.C.; Weil, R.R.; Weil, R.R. The Nature and Properties of Soils; Prentice Hall: Upper Saddle River, NJ, USA, 2008. [Google Scholar]
Figure 1. (a) Changes of organic carbon content (%) in pot soils as affected by different organic materials during six months of incubation (CD = cow dung, RS = rice straw, WA = wood ash, CB = cow dung biochar, RB = rice straw biochar, WB = wood biochar); (b) Changes of organic carbon content (%) in pot soils as affected by different nitrogen fertilizers during six months of incubation (N0 = no nitrogen, N0.05 = 0.05 g N kg−1 soil, N0.10 = 0.10 g N kg−1 soil).
Sustainability 14 03684 g001
Figure 2. (a) Effect of organic materials on release of ammonium nitrogen in pot soils at different days of incubation (CD = cow dung, RS = rice straw, WA = wood ash, CB = cow dung biochar, RB = rice straw biochar, WB = wood biochar); (b) Effect of nitrogen fertilizer on release of ammonium nitrogen in pot soils at different days of incubation (N0 = no nitrogen, N0.05 = 0.05 g N kg−1 soil, N0.10 = 0.10 g N kg−1 soil).
Sustainability 14 03684 g002
Figure 3. (a) Effect of organic materials on release of nitrate nitrogen in pot soils at different days of incubation (CD = cow dung, RS = rice straw, WA = wood ash, CB = cow dung biochar, RB = rice straw biochar, WB = wood biochar); (b) Effect of nitrogen fertilizer on release of nitrate nitrogen in pot soils at different days of incubation (N0 = no nitrogen, N0.05 = 0.05 g N kg−1 soil, N0.10 = 0.10 g N kg−1 soil).
Sustainability 14 03684 g003
Table 1. Moisture, total nitrogen, carbon contents and C:N ratios of field soil, and organic materials used in the experiment (mean ± S.D.).
Organic MaterialsMoisture Content (%)Total N (%)Organic C (%)C:N Ratio
Field soil27.59 ± 2.120.120 ± 0.011.68 ± 0.0413.92 ± 0.37
Cow dung 29.58 ± 0.101.10 ± 0.1025.82 ± 0.2823.47 ± 0.63
Rice straw16.38 ± 0.050.85 ± 0.0840.00 ± 0.4147.06 ± 0.03
Wood ash16.91 ± 0.190.70 ± 0.1120.40 ± 0.8429.14 ± 0.06
Cow dung biochar15.22 ± 0.400.95 ± 0.1330.50 ± 0.6732.11 ± 0.03
Rice straw biochar14.35 ± 0.090.80 ± 0.0845.50 ± 0.8956.88 ± 0.81
Wood biochar15.84 ± 0.040.75 ± 0.0228.50 ± 0.8538.00 ± 0.39
Table 2. Interaction of organic materials and N on C content in pot soils at different incubation periods.
Organic MaterialsNitrogen Fertilizer (g kg−1 Soil)
00.050.10
60 days
CD1.63 aa1.43 bc1.36 cb
RS1.66 aa1.45 bc1.15 cc
WA1.65 aa1.43 bc1.36 cb
CB1.71 aa1.61 ba1.51 ca
RB1.68 aa1.41 bc1.38 cb
WB1.73 aa1.51 bb1.32 cb
90 days
CD1.52 ab1.41 bb1.22 ca
RS1.57 ab1.41 bb1.16 ca
WA1.51 ab1.32 bb1.21 ca
CB1.66 aa1.43 ba1.25 ca
RB1.58 ab1.36 bb1.25 ca
WB1.58 ab1.38 bb1.18 ca
120 days
CD1.41 ab1.25 ba1.16 cb
RS1.51 aa1.34 ba1.16 cb
WA1.53 aa1.36 ba1.01 cc
CB1.58 aa1.42 ba1.24 ca
RB1.51 aa1.36 ba1.25 ca
WB1.55 aa1.27 ba1.04 cc
150 days
CD1.31 ab1.21 ba1.12 ca
RS1.41 aa1.29 ba1.06 ca
WA1.46 aa1.36 ba1.01 ca
CB1.53 aa1.36 ba1.22 ca
RB1.48 aa1.31 ba1.19 ca
WB1.52 aa1.23 ba1.04 ca
180 days
CD1.25 ab1.08 bc0.91 cc
RS1.27 ab1.05 bc0.99 cb
WA1.25 ab1.06 bc0.89 cc
CB1.34 aa1.23 ba1.12 ca
RB1.34 aa1.16 bb1.00 cb
WB1.27 ab1.10 bc1.01 cb
CD = cow dung, RS = rice straw, WA = wood ash, CB = cow dung biochar, RB = rice straw biochar, WB = wood biochar. Different superscript letters under each row indicate significant differences among values. Different subscript letters indicate significant differences among the values under each column.
Table 3. Carbon degradation rate constants (k) for added organic materials and N rates.
Organic Materials and N RatesCarbon Degradation Rate Constants (k)
Organic materials:
Cow dung0.00463 c
Rice straw0.00473 c
Wood ash 0.00448 d
Cow dung biochar0.00571 a
Rice straw biochar0.00522 b
Wood biochar0.00487 bc
S. E. (±)0.000238
N rates (g/kg soil):
00.00616 a
0.050.00484 b
0.10.00405 c
S.E. (±)0.000168
Organic × nitrogenns
CV%7.26
Different letters in a column indicate significant differences among treatments.
Table 4. Interaction effects of organic materials and N rates on the release of NH4+-N and NO3-N in pot soils at different incubation periods.
Organic MaterialsNH4+-N (mg kg−1)NO3-N (mg kg−1)
N0N0.05N0.1N0N0.05N0.1
90 days
CD7.12 cb9.32 bb11.21 aa8.44 ac13.91 bc20.11 cb
RS7.43 cb10.27 ba11.47 aa8.39 ac14.21 bb20.31 cb
WA8.38 ca10.27 ba12.03 aa8.41 ac14.22 bb20.46 cb
CB8.47 ca10.44 ba12.44 aa10.31 aa15.38 ba21.50 ca
RB8.46 ca10.42 ba12.37 aa10.19 aa14.92 ba19.91 cb
WB8.34 ca10.46 ba12.37 aa9.23 ab14.43 bb20.34 cb
120 days
CD3.05 ca5.39 ba8.42 aa5.32 cb6.61 bc8.83 ac
RS3.33 ca5.45 ba8.42 aa5.23 cb6.56 bc8.88 ac
WA2.93 ca4.99 ba8.69 aa5.12 cb7.14 bb9.23 ab
CB3.73 ca5.83 ba8.92 aa7.81 ca9.88 ba11.43 aa
RB2.57 ca6.31 ba9.37 aa5.27 cb7.21 bb9.45 ab
WB2.73 ca4.78 ba9.16 aa5.04 cb6.58 bc9.43 ab
150 days
CD4.94 ca8.06 ba10.66 aa7.04 cc9.69 ba11.21 ac
RS3.15 ca7.21 ba12.61 aa7.43 cb9.21 bb11.24 ac
WA3.48 ca6.43 ba11.43 aa7.61 cb9.69 ba11.57 ab
CB5.27 ca7.99 ba10.84 aa8.29 ca9.67 ba12.33 aa
RB5.22 ca7.07 ba11.55 aa7.92 cb9.21 bb12.23 aa
WB4.42 ca6.46 ba10.21 aa7.72 cb9.68 ba11.72 ab
CD = cow dung, RS = rice straw, WA = wood ash, CB = cow dung biochar, RB = rice straw biochar, WB = wood biochar. Different superscript letters under each row indicate significant differences among values. Different subscript letters indicate significant differences among the values under each column.
Publisher’s Note: MDPI stays neutral with regard to jurisdictional claims in published maps and institutional affiliations.

