Abstract
The in-process inspection procedure is one of the critical operations in the active pharmaceutical ingredients manufacturing process. This study aims to improve the performance of the IPI service system in terms of three main criteria, namely service level, cycle time, and maximum tardy time. In solving this multiple-criteria decision-making problem, the proposed study seeks to redesign three process control factors, namely the service configuration, the dispatching rule, and the scheduling rule. The problem is solved using the Taguchi robust design methodology. Since the Taguchi method handles parameter design problems with only one criterion, Technique for Order Preference by Similarity to an Ideal Solution, a multiple-criteria decision-making method, is used to provide a surrogate response to the Taguchi method. The numerical results show that the redesigned IPI system improves the service level by 28.75%, the cycle time by 18.32%, and the maximum tardy time by 22.22%.
1. Introduction
The global pharmaceuticals market amounted to 0.8 trillion dollars in 2017 and is expected to increase to 1.2 trillion dollars by 2024 [1]. Medically, the healing process involves the transport of active pharmaceutical ingredients (APIs) (Please also refer to nomenclature) to the target system(s) of the body by means of specific inactive ingredients [2]. Thus, developing new APIs and bringing them to the market is critical to pharmaceuticals in earning profits. As a result, pharmaceuticals invest huge amounts of money in the research and development (R&D) of API every year [3].
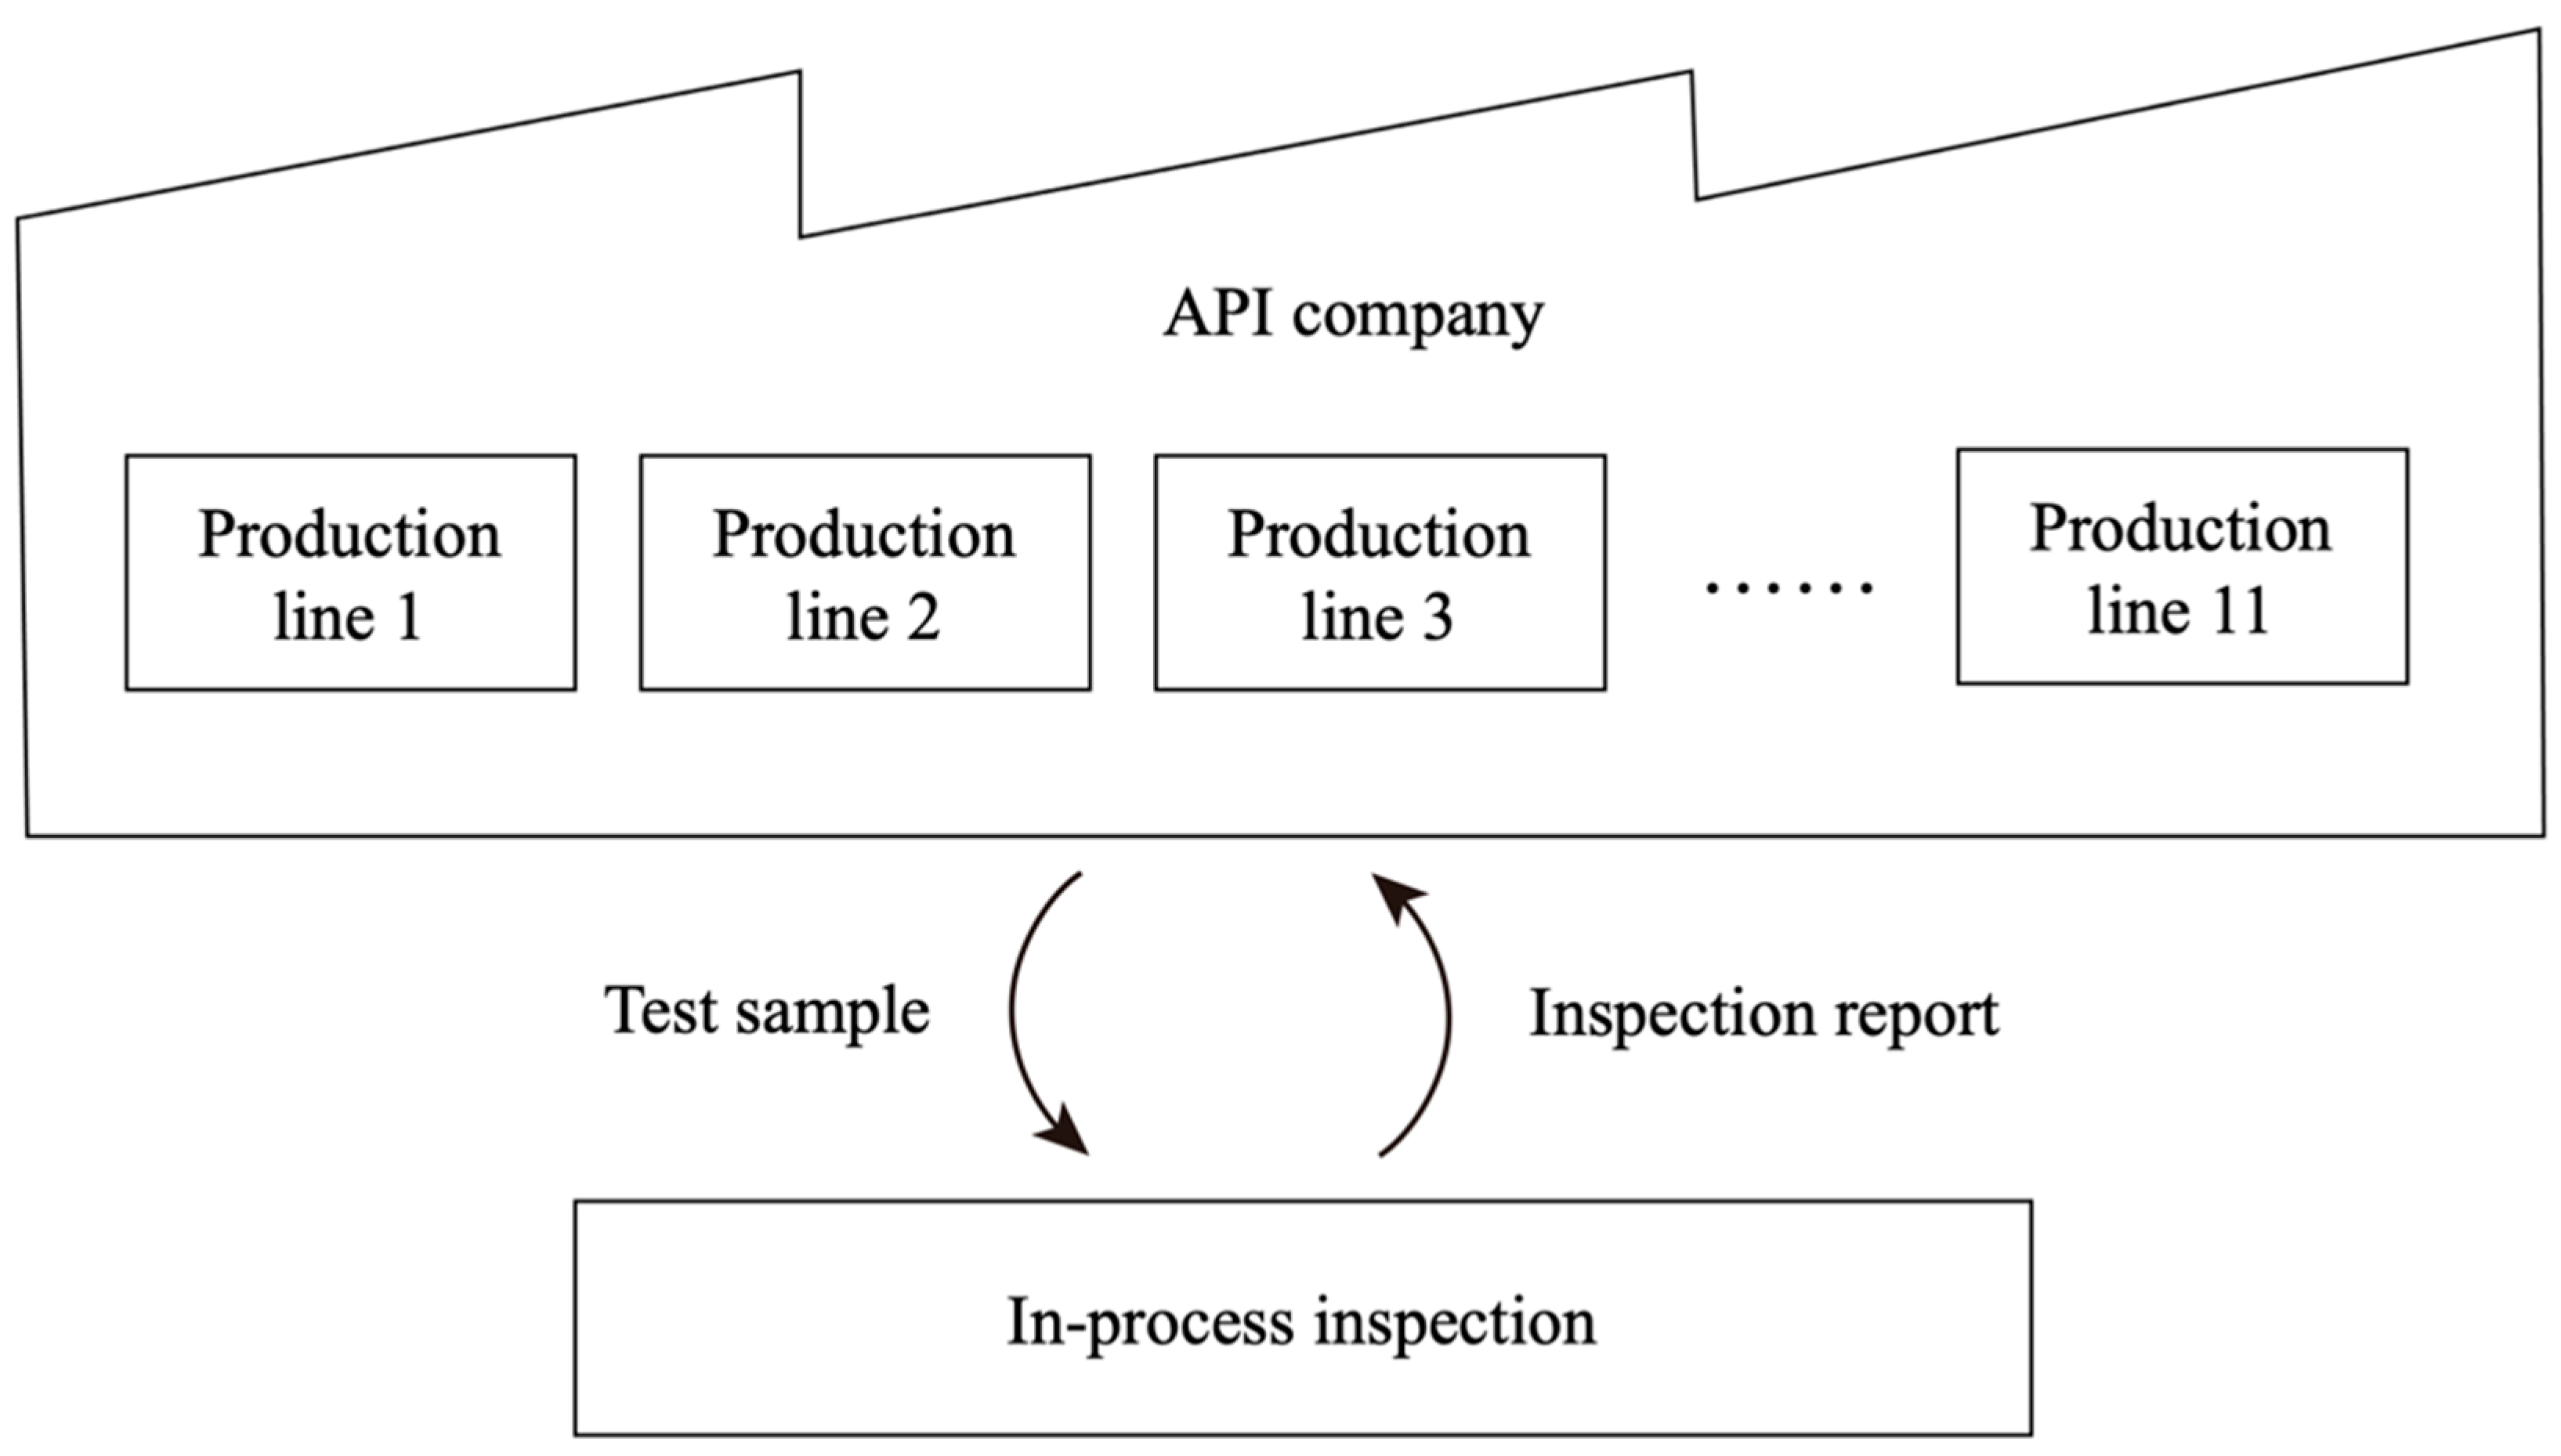
However, pharmaceutical companies face many challenges nowadays, including global competition, the need for green engineering, and ever more stringent government regulations. Thus, in addition to developing new products, pharmaceutical companies must also improve their API manufacturing processes in order to meet these challenges and lower their production costs. The API manufacturing process comprises a carefully-designed series of chemical reactions, where in-process inspection (IPI) is required after some of these reaction stages in order to guarantee both the physical and chemical properties of the product batch. A typical inspection flow between the API manufacturing process and IPI division is illustrated in Figure 1. Note that there are eleven process lines for the case company.
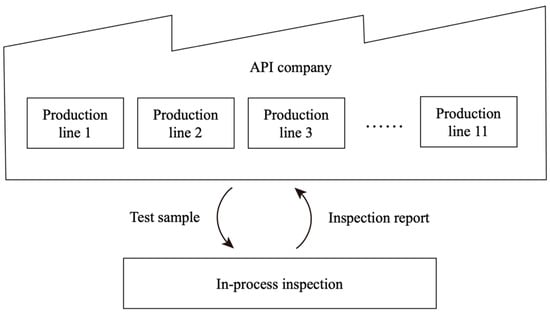
Figure 1.
The inspection flow between API manufacturing process and IPI division.
Importantly, the manufacturing process is allowed to move forward to the next stage only if the inspection result satisfies the agreed requirements. However, since the chemical reaction still proceeds as the IPI process is carried out, any delay in delivering the inspection result not only holds up the manufacturing process but may also result in an undesirable over-reaction of the product. In extreme cases, it may be necessary to reproduce, or even discard, the in-process batch. Consequently, the performance of the IPI service significantly impacts the effectiveness and efficiency of the API manufacturing process and ultimately determines its cost.
An IPI division usually serves several manufacturing lines, each making different products and having different production schedules. Although the IPI division receives notice several hours before the physical arrival of a sample batch, it is not easy to prepare the corresponding inspector and machines to run the IPI exactly on time since the number of inspectors and machines is much less than that of the manufacturing lines. Furthermore, the actual arrival time of the batch depends on the manufacturing progress, progress, and the state of the chemical reactions, which depend in turn on the on-site conditions, and often cause the arrival time to vary from the scheduled time.
Therefore, an IPI division needs to deploy a systematical arrangement of its inspectors and machines in order to accommodate the various conditions that it may encounter. Only by doing so can the IPI division maximize the use of its limited manpower and machine capacity in such a way as to efficiently handle the in-coming samples. However, to the best of the authors’ knowledge, the literature lacks a detailed investigation into the IPI service system in the API manufacturing process and effective means for improving the performance of this system through a systematic redesign process.
Pharmaceutical companies have long sought a competitive advantage by optimizing the chemical reaction efficiency and yield or by adopting outsourcing or relocation strategies such as those described above [4,5]. However, in more recent years, the performance benefits to be gained by redesigning the manufacturing planning and scheduling processes have also attracted growing attention. For example, Blocher et al. [6] modified the in-process inspection (IPI) dispatching rule in a pharmaceutical company based on a detailed observation of the empirical data and showed that the modified rule reduced the throughput time by up to 58% compared to that achieved using a random dispatching method. Various other authors [7,8,9] formulated mathematical models to simulate the complicated operation of pharmaceuticals and to search for an optimal scheduling manufacturing strategy to approach the management targets of interest. Lamothe et al. [10] claimed that the IPI service in the pharmaceutical industry is always seriously delayed and then proposed a new scheduling rule deriving from a simulated annealing procedure to minimize the total tardiness time.
IPI is performed at various stages of the API manufacturing process [10]. Each IPI inspection represents a potential bottleneck in the whole process. Thus, only when the IPI service is both efficient and timely can the whole process be smooth and productive. However, to the best of the authors’ knowledge, the literature lacks any systematic investigation into the efficiency of the IPI service in the API manufacturing process.
Lean management is a well-known methodology for fulfilling the requirements of customers with less waste in the service processes [11,12]. The operation mode with lean thinking should be a good structure that can be used to construct an efficient IPI service system. Stabilizing flows of customer orders and well using the resource of processing lines are two important concepts to construct a lean environment [13,14]. Therefore, three critical factors to the service flow and limited resource in the IPI system are selected into the IPI design process, namely the service configuration (i.e., the grouping of the API manufacturing lines for constructing stable service flows), the dispatching rule (i.e., the rule used to select waiting product batches for inspection), and the scheduling rule (i.e., the rule used to assign inspectors to the inspection task).
Taguchi method [15] provides a simple and effective means of redesigning many processes and evaluating their outcomes. The Taguchi method has proven to be an efficient approach for a variety of applications. However, the Taguchi method is intended specifically for the redesign of systems based on a single optimization criterion.
Many techniques have been proposed for the solution of Multiple-criteria decision-making (MCDM) problems, including Simple Multi-attribute Rating Technique (SMART) [16], Analytic Hierarchy Process (AHP) [17], Grey Systems Theory [18], Technique for Order Preference by Similarity to an Ideal Solution (TOPSIS) [19], ELECTRE [20], etc. More details can be found in [21]. These methods to rank the alternatives of an MCDM problem can be mainly divided into two types, the method of calculating the score of each alternative and the method of comparing each two alternatives.
Providing proper weighting to each criterion is one of the main tasks for the method of calculating the score of each alternative. SMARTER extended to ranking (SMARTER-ROC) [22] is the improved technique from SMART by replacing a new weighting method. SMARTER-ROC has been used to identify the factors which could increase the risks or complexity in an engineering project [23] and to organize different technology-based products and the relative technologies in order to establish a competitive platform [24]. AHP provides a weighting process to sensitively reflect the preference of each criterion of decision-maker. Recently, AHP has been applied to evaluate the renewable energy resources in Pakistan [25] and select the locations for solar power plants [26]. As AHP has to repeatedly track the preference of the decision-maker and evaluate the consistency of weights, it is time-consuming and complex to implement.
The other main task for the method of calculating the score of each alternative is to provide a function for well evaluating the alternatives. TOPSIS uses a method of compensatory aggregation to define a distance between each alternative and the ideal/worst alternative and then calculate a score for each alternative. As the process of TOPSIS is simple and easily formulated, it has been applied to select the proper supplier [27,28], build a model to evaluate the environmental condition for eutrophication levels of lakes [29], and rank the risks in working places in order to effectively improve job safety [30].
ELECTRE is the most popular pairwise comparison method for MCDM and provides ranking results for alternatives. ELECTRE has been applied to identify a possible sustainable hydrogen production pathway [31] and figure out important items for designing a tourist website [32]. However, the process of ELECTRE is more complex than TOPSIS and usually only provides the rankings of alternatives instead of scores. Therefore, TOPSIS is often integrated with different weighting methods or design of experiment (DOE) methods due to it is effective and easy to compute when solving an MCDM problem.
Some studies embed AHP into TOPSIS for weighting the criteria, such as the application of selecting the internet of medical things systems [33] and accessing the risk of gas and oil pipeline systems [34]. Meanwhile, when the precise values for the performance rating are available, TOPSIS can be adopted for the MCDM problem. When the values of the performance rating are vague and imprecise, a combined fuzzy theory and TOPSIS (Fuzzy TOPSIS) can be adopted for the MCDM problem. Yang and Hung [35] adopted both TOPSIS and fuzzy TOPSIS in solving a layout design problem from the integrated circuit (IC) packaging process.
TOPSIS usually is applied to calculate the score of each treatment in the Taguchi for replacing its signal-to-noise ratio. Yang and Chou [36] developed a hybrid Taguchi/TOPSIS method to solve multi-response simulation optimization problems involving control factors with discrete values and three control levels. The feasibility of the proposed method was demonstrated by redesigning the IC manufacturing process in a real-world IC packaging company. The same method was later applied to determine the most appropriate dispatching rule for every workstation in the flow shop of a multi-layer ceramic capacitor manufacturing system [37]. Recently, Tansel et al. [38] used the method to analyze the parameters with two criteria, manufacturing lead time and quality, for improving the manufacturing flexibility, and the influences of different weight scenarios of these two criteria are also discussed.
As described above, the IPI redesign problem considered in this study involves four design objectives and three control factors through lean thinking. Furthermore, each control factor has four possible level settings. As a result, the design problem is ideally suited to a solution using the hybrid Taguchi/TOPSIS method described above. In particular, the Taguchi method provides an approach for determining the control factor level settings which optimize each design criterion individually, while TOPSIS provides the means to identify the optimal solution which satisfies all three design criteria simultaneously. After the optimal setting of the three factors for effectively removing wastes in the IPI system is obtained, a simple IoT technology can be set up soon to control the operation mode for successful implementation, e.g., e-Kanban [39].
The remainder of this study is organized as follows. Section 2 describes the case problem considered in the present study. Section 3 introduces the methodology proposed in this study for optimizing the IPI service system in API manufacturing companies based on the three criteria described above. Section 4 presents and discusses the empirical results. Finally, Section 5 draws some brief conclusions and indicates the intended direction of future research.
2. Case Problem
The present study takes a leading drug company in Taiwan as the case company. The company has 11 process lines (which operate independently of one another) but only one IPI division, which works 24 h a day with two shifts (12 h per shift) (see Figure 1).
The IPI division is a company-wide shared resource with incoming samples from the 11 process lines and is subject to capacity constraints from both the available number of inspectors and the number of machines (or testers). In addition, there is usually a window time (e.g., maximal allowance time to avoid a potential in-process quality problem) between the sample generation time and the result return time; thus, the efficiency of IPI is critical to assure the in-process quality performance.
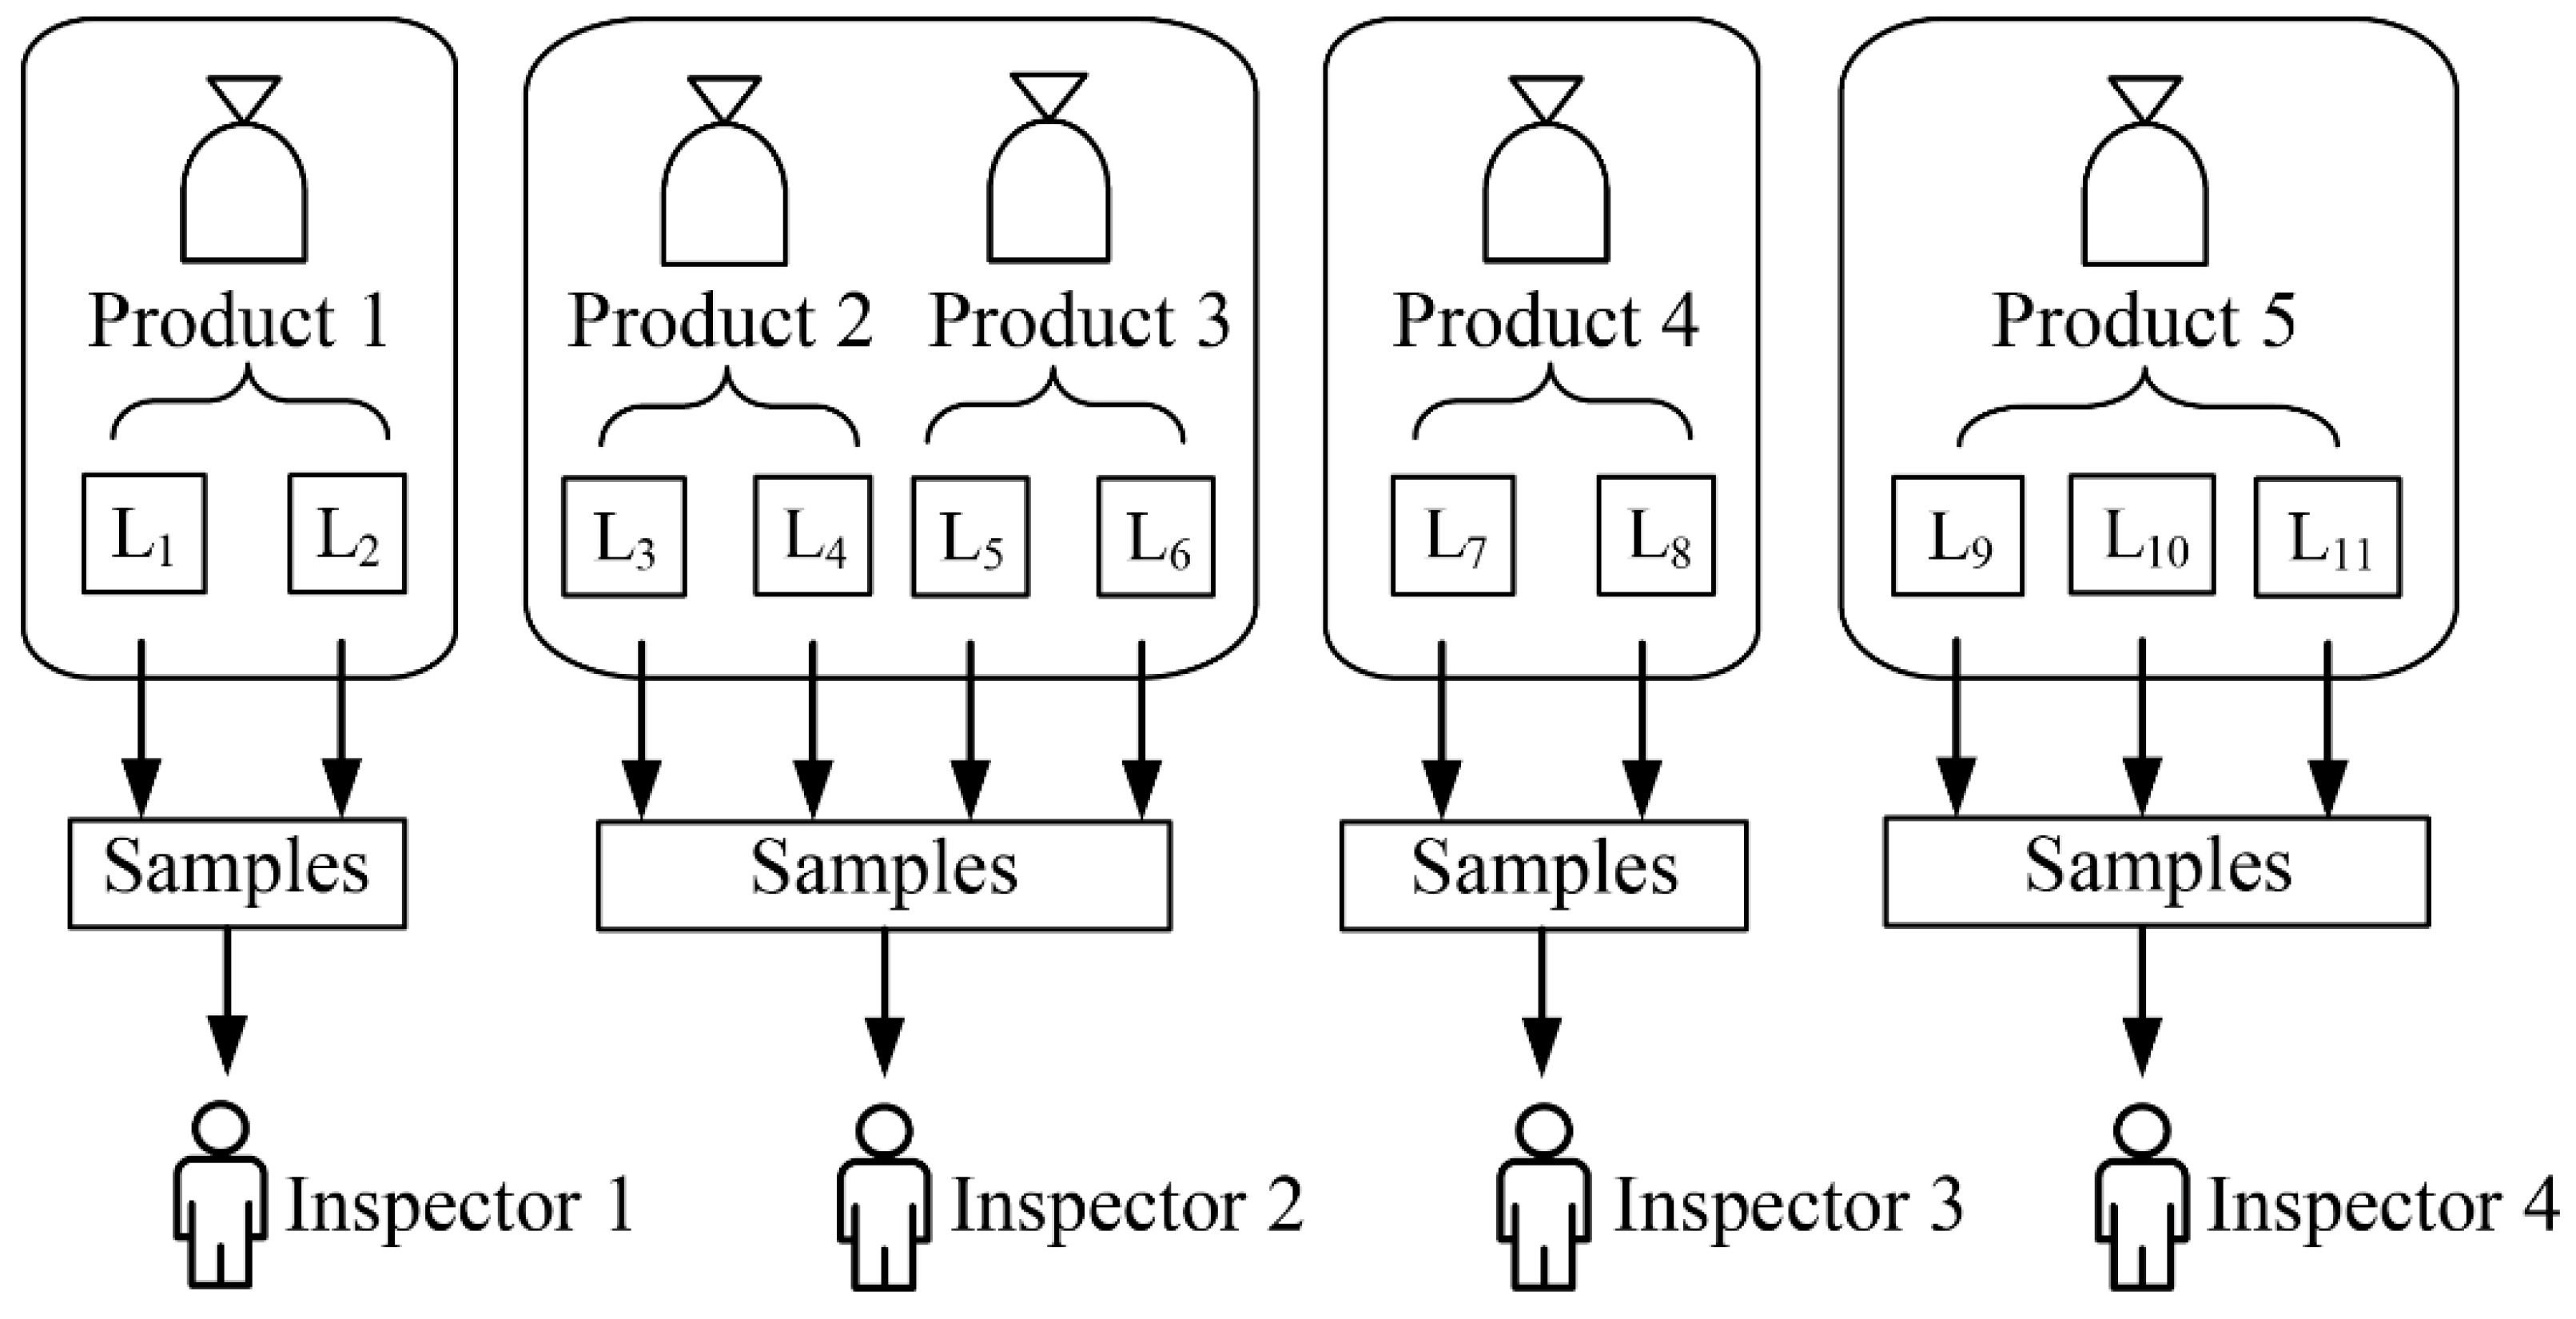
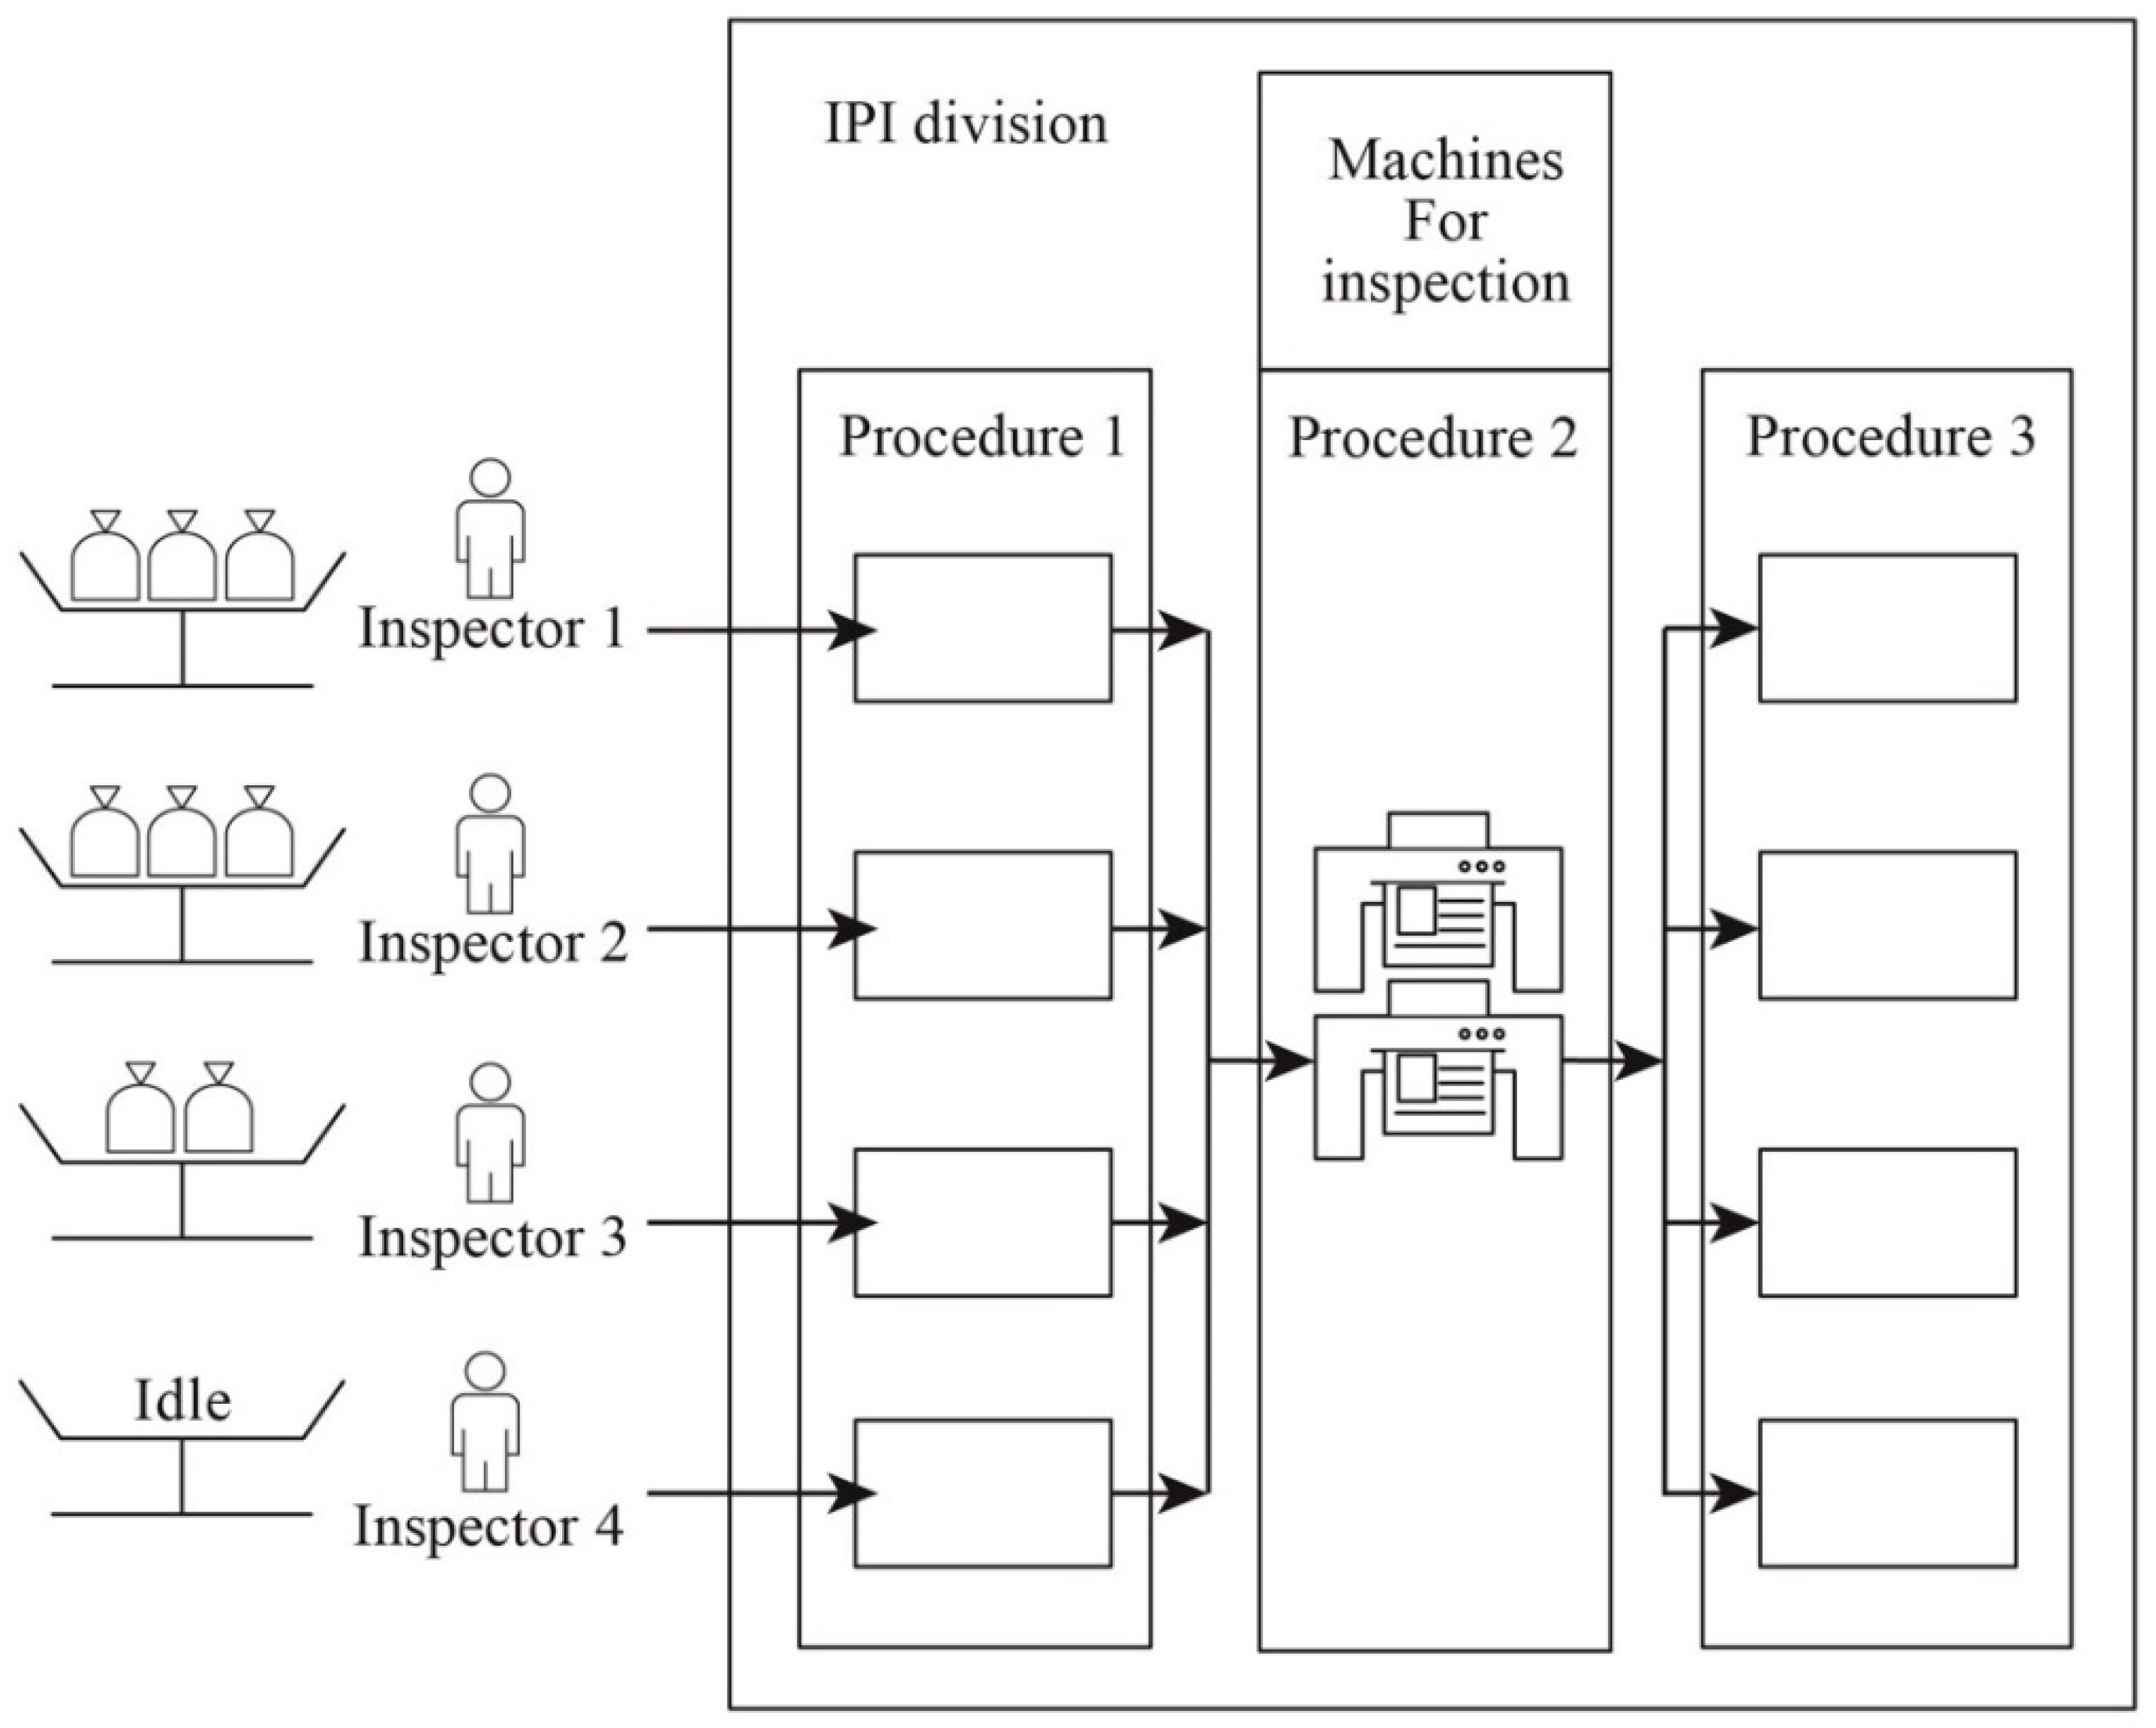
At the beginning of each shift, the leader of the API division uses an experience-based approach to assign an inspector to each process line. For each shift, just four inspectors are available. Consequently, each inspector is assigned to multiple lines. Figure 2 shows the current service configuration of each shift in the IPI division.
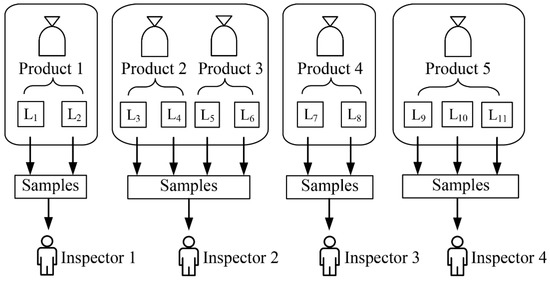
Figure 2.
Current IPI service configuration.
In principle, there is a clear work division between the inspectors. Since the sample arrivals are stochastic due to both the stochastic and dynamic nature of a manufacturing line, the workloads among the inspectors are also dynamic and are unbalanced most of the time. The unbalanced workload problem has caused a significant IPI capacity loss and has deteriorated the IPI performance.
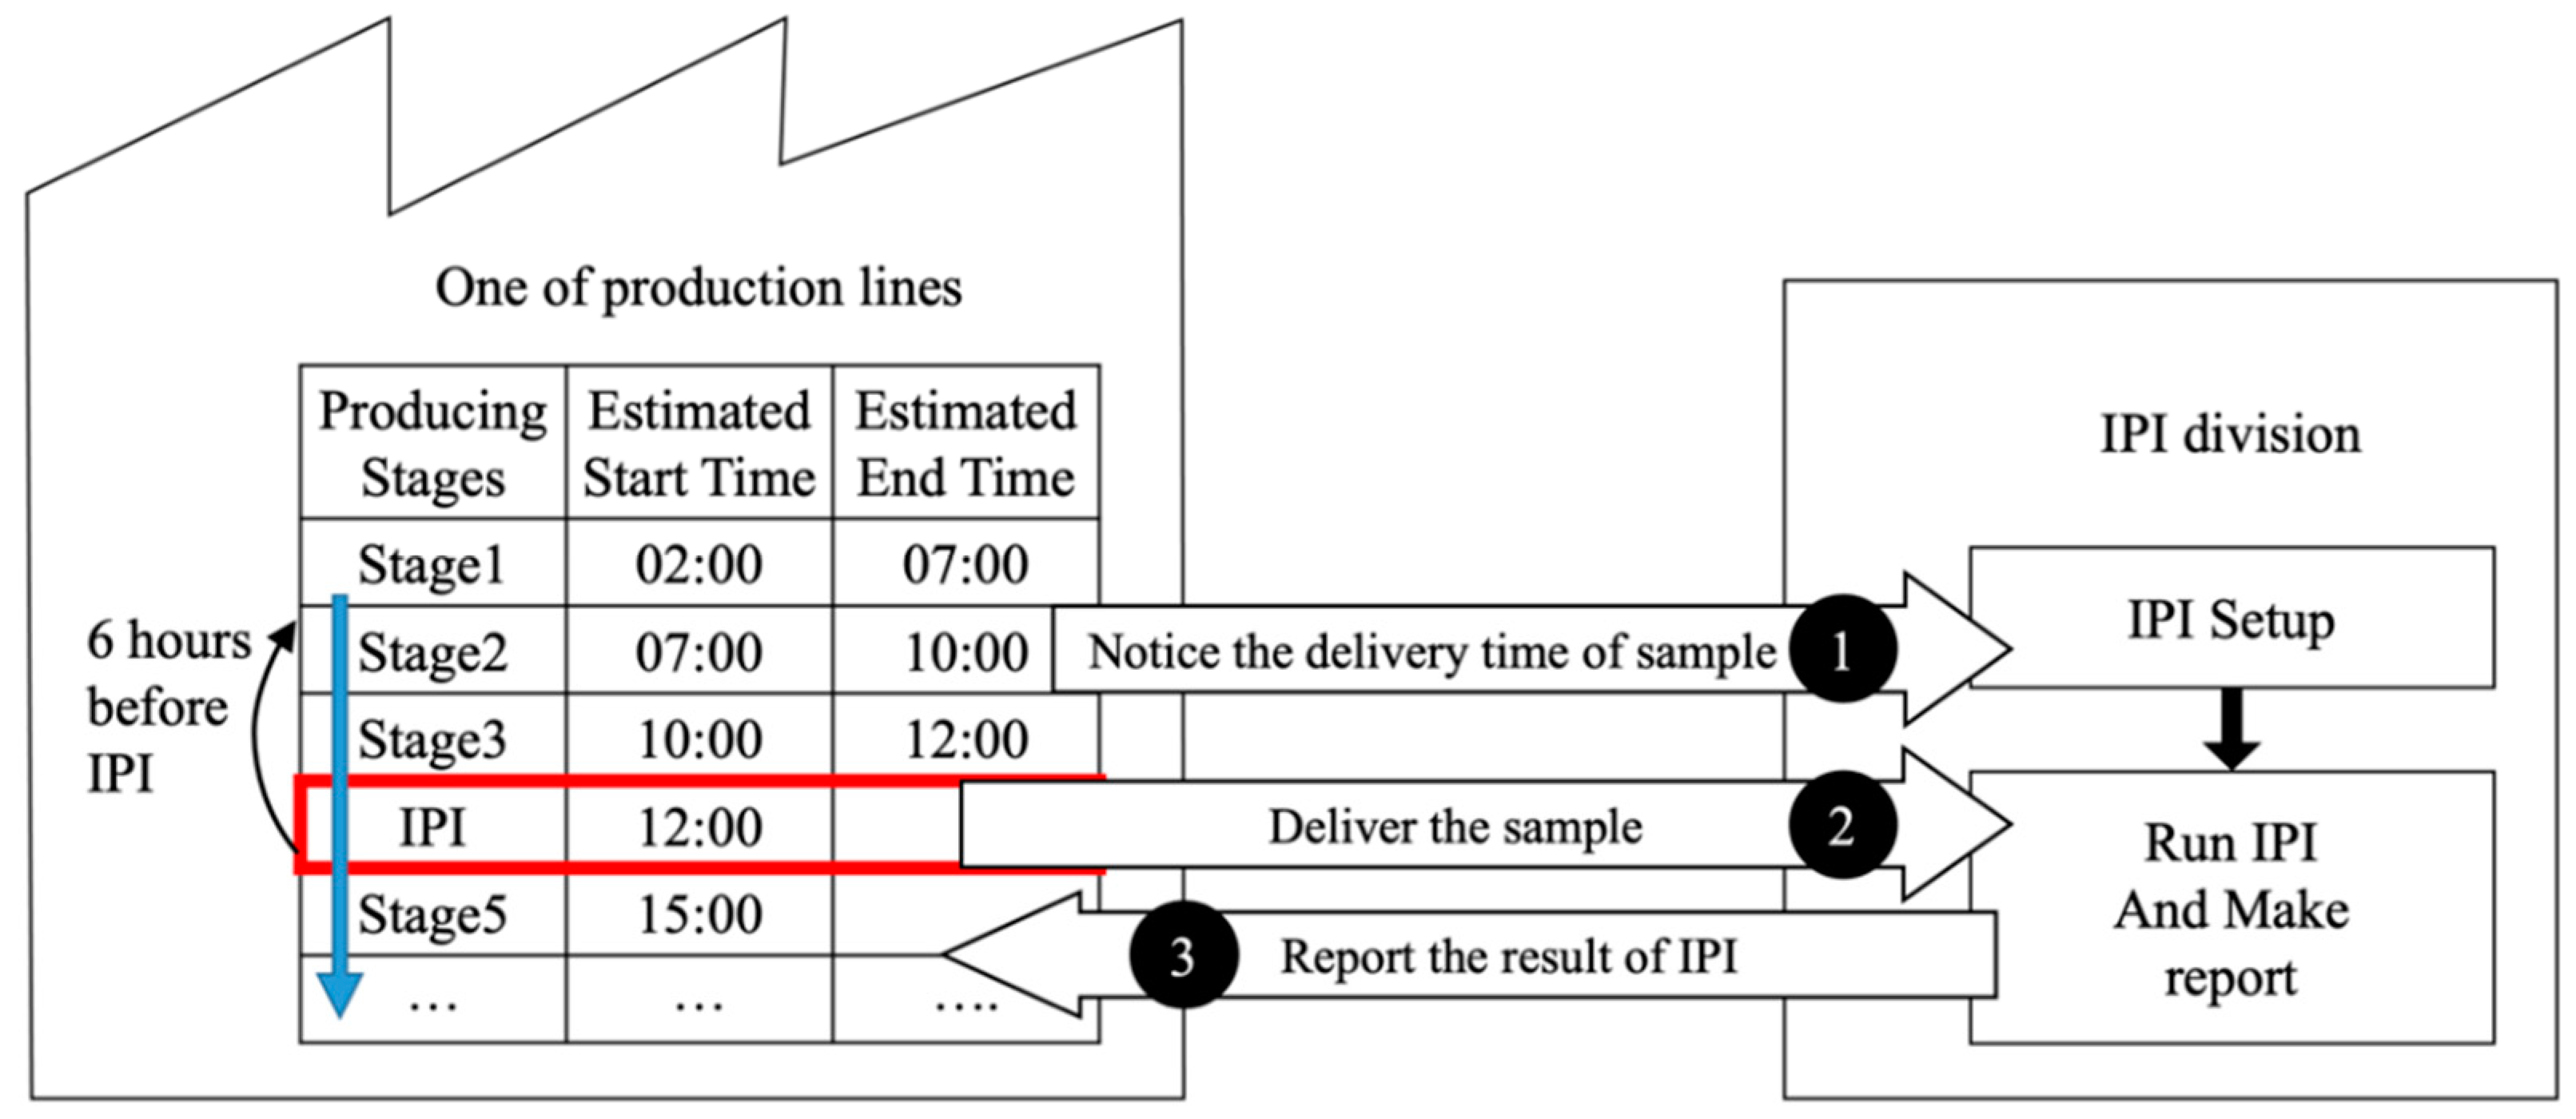
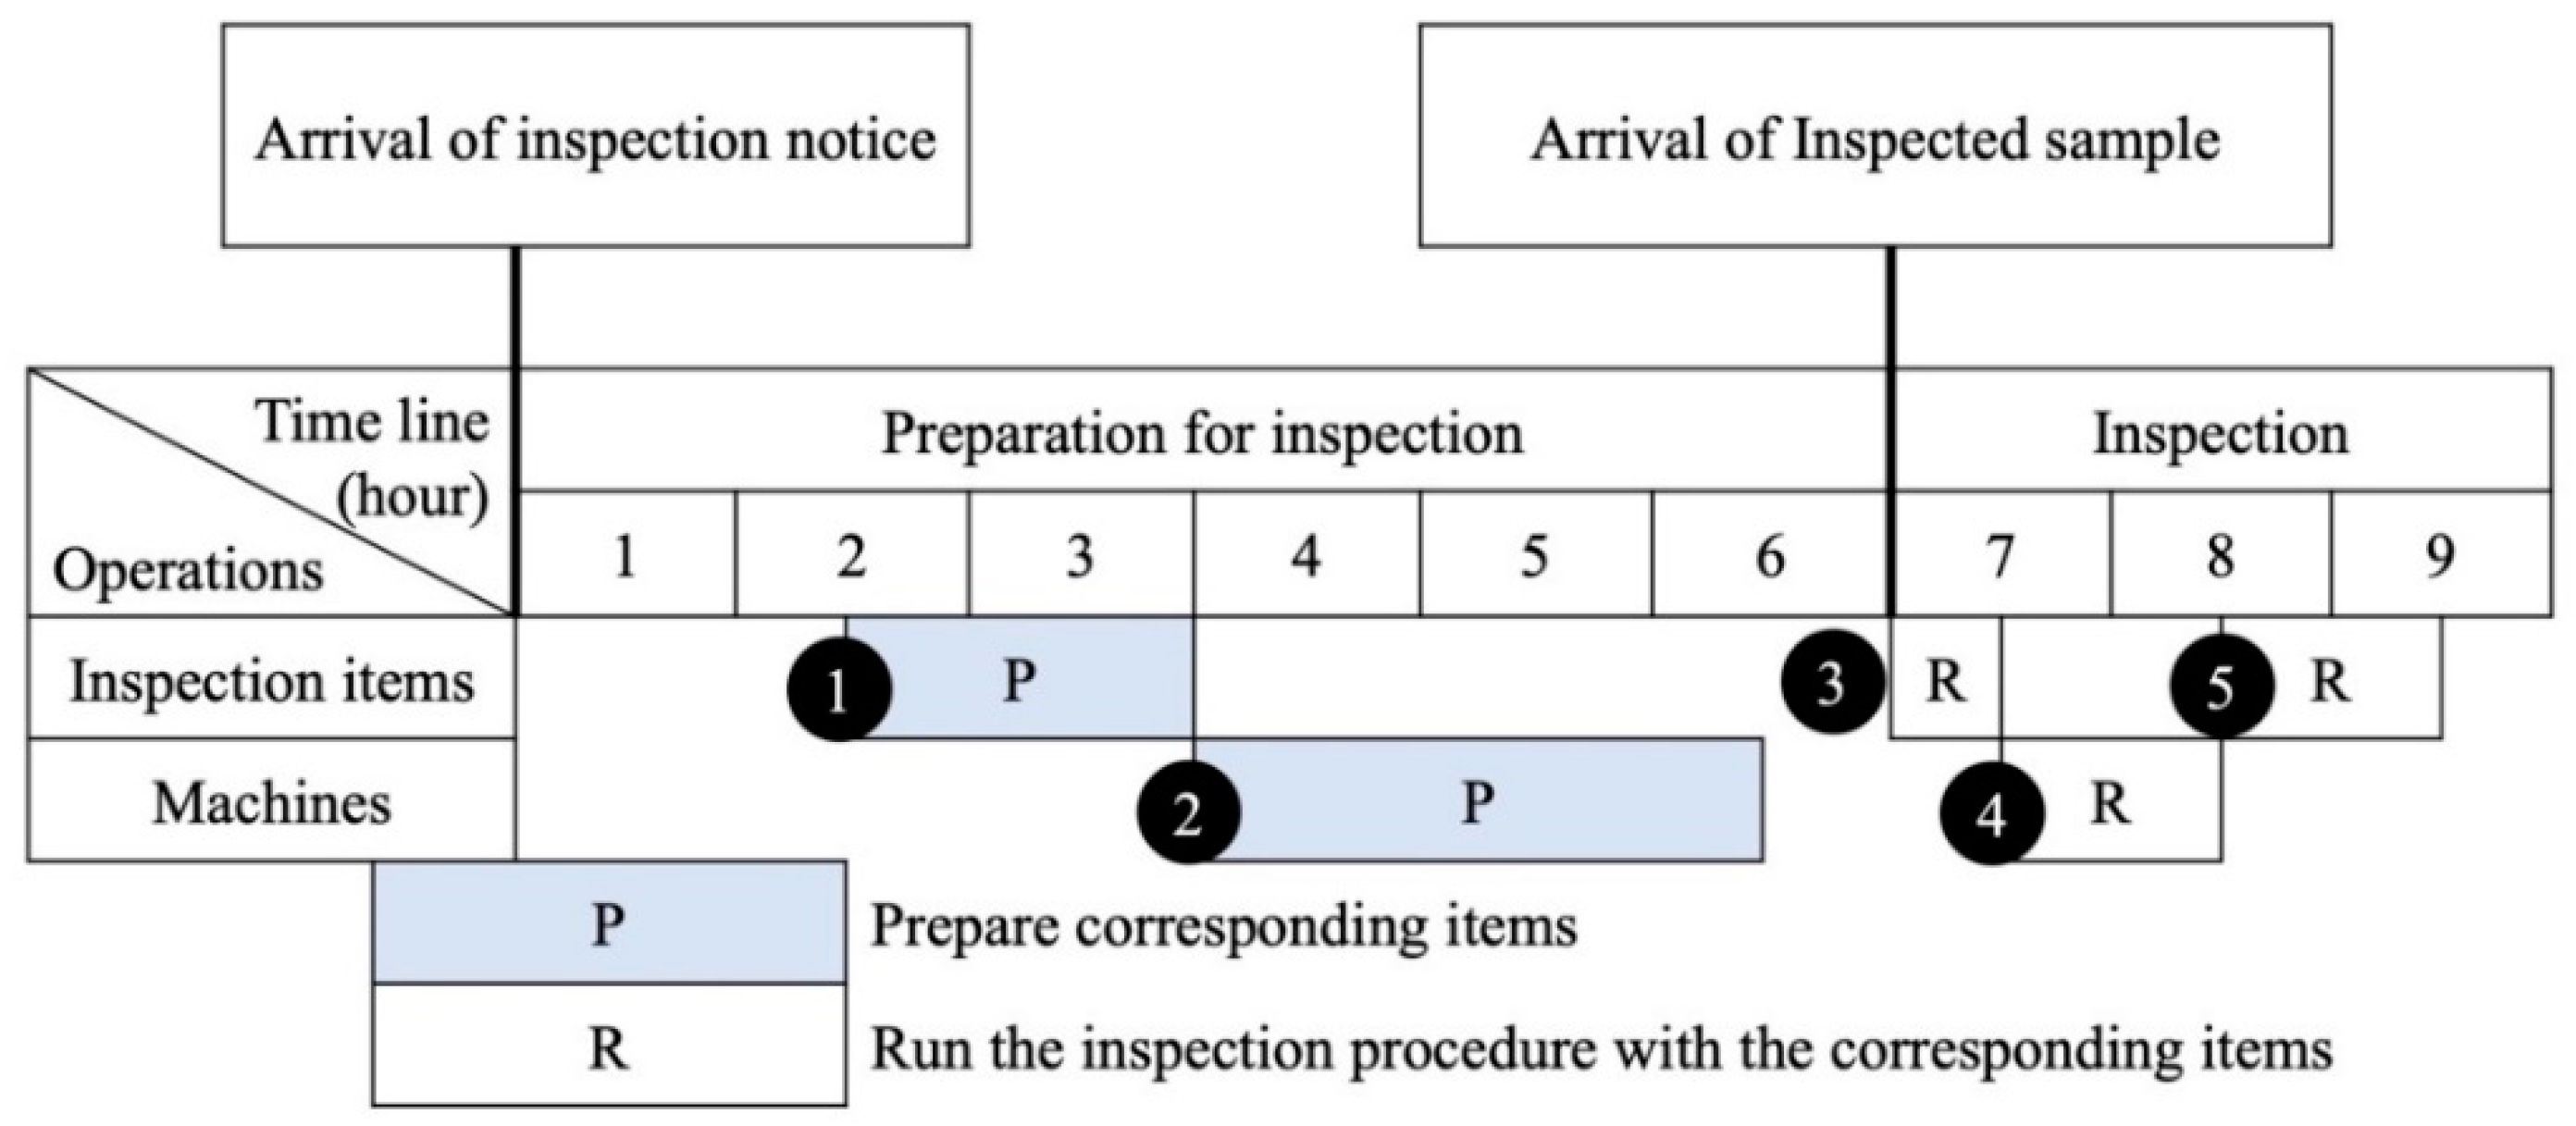
In accordance with current working practice, each production line in the case company is required to notify the IPI division 6 h before the estimated time at which the sample will arrive. On receiving this notice, the corresponding inspector is required to set up the relative inspection items and machines for the incoming sample. Meanwhile, the production line continues to process the product batch through the specified production stages until the IPI time arrives, at which point the batch is delivered to the IPI division (see Figure 3).

Figure 3.
The interactions between IPI division and production flow (1, 2 and 3 represent the order of interactions for a batch).
Figure 4 shows the details of the current IPI service procedure, including both the preparation activities and the actual inspection activity. As shown, the setup process for the inspection items and machines lasts for around 4 h, while the inspection procedure (terminating with the output of an inspection report) lasts for approximately 3 h.
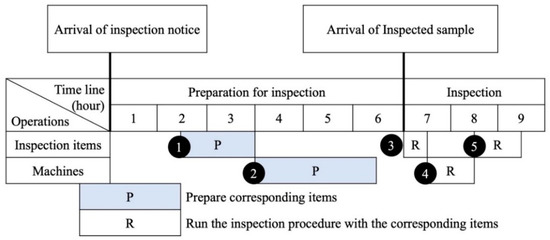
Figure 4.
IPI operation procedures (1, 2, 3, 4 and 5 represent the order of IPI operation procedures for a sample).
The machine and labor costs of the inspection process are both high. Consequently, it is necessary to reduce both the number of machines and the number of inspectors to a number much lower than that of the manufacturing lines in order to reduce costs and ensure the competitiveness of the case company located in Tainan, Taiwan. Therefore, as stated above, each inspector in the API division is currently assigned responsibility for multiple manufacturing lines in each shift. However, this strategy risks the inspector as being unable to set up and handle each in-coming sample batch from the busy manufacturing lines on time, thereby delaying the inspection report and potentially damaging the quality of the in-process batch. Conversely, some inspectors on the same shift may sit idle if the production schedules of the corresponding manufacturing lines are loose (see Figure 5). Due to capacity constraints, a shortage of inspection machines may also occur during the IPI process, which further prolongs the CT of the IPI procedure.

Figure 5.
Unbalanced situations for job assignments in a shift.
The current IPI configuration design has its limitations; thus, it is the objective of the present study to investigate an optimal design to improve the IPI performance, as shown in the following sections.
3. Proposed Methodology
This section describes the methodology proposed in this study for redesigning critical operation factors in the IPI system of the case company in such a way as to improve the IPI performance. Especially, a service system deals with more uncertainty from customers than a manufacturing system [40]. Thus, the design of a flexible IPI service system should be a challenge and also is needed for quickly completing the requests from these manufacturing lines. Recently, the rapid development of synergy of collecting information, analyzing information, and sharing information in a service or manufacturing system arouses the fourth industry revolution (industry 4.0) [41], which provides a conceptual framework to enhance flexibility. However, the requirement of industry 4.0, including the knowledge, the equipment or the investment of big data, artificial intelligence (AI), and internet of things (IoT), is too high for a system only in industry 3.0 or less to be realized in an acceptable time period.
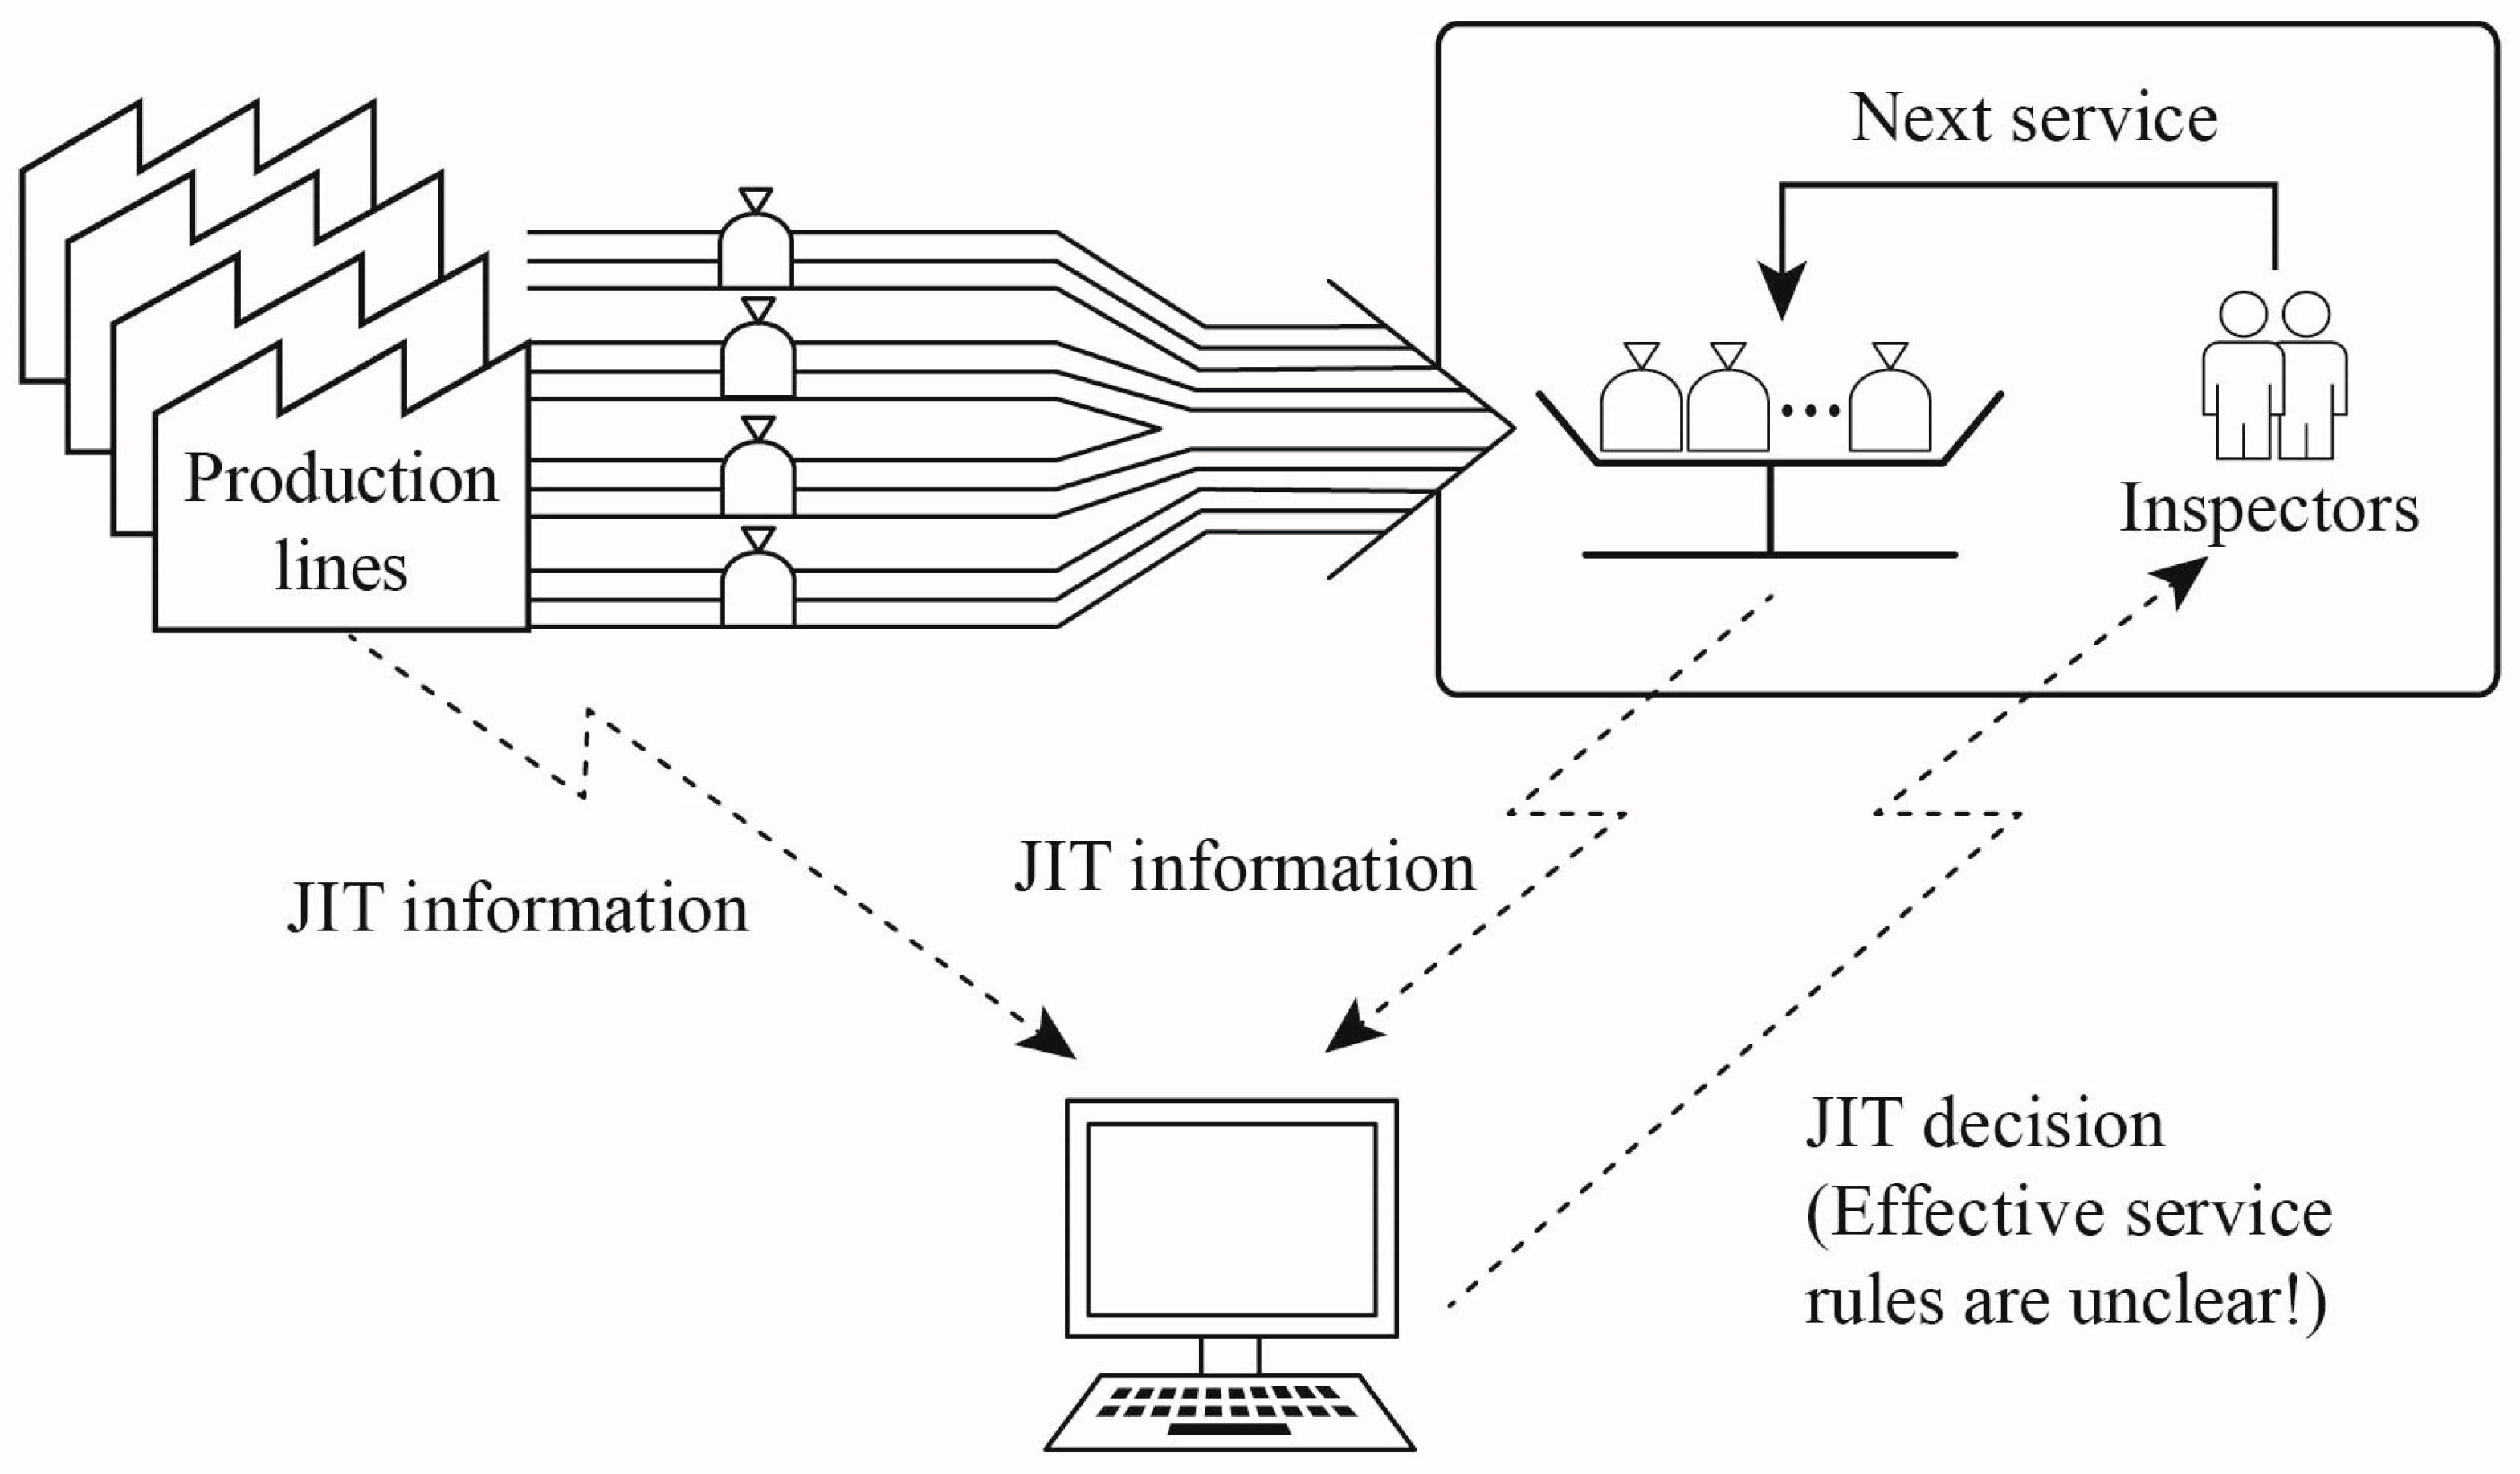
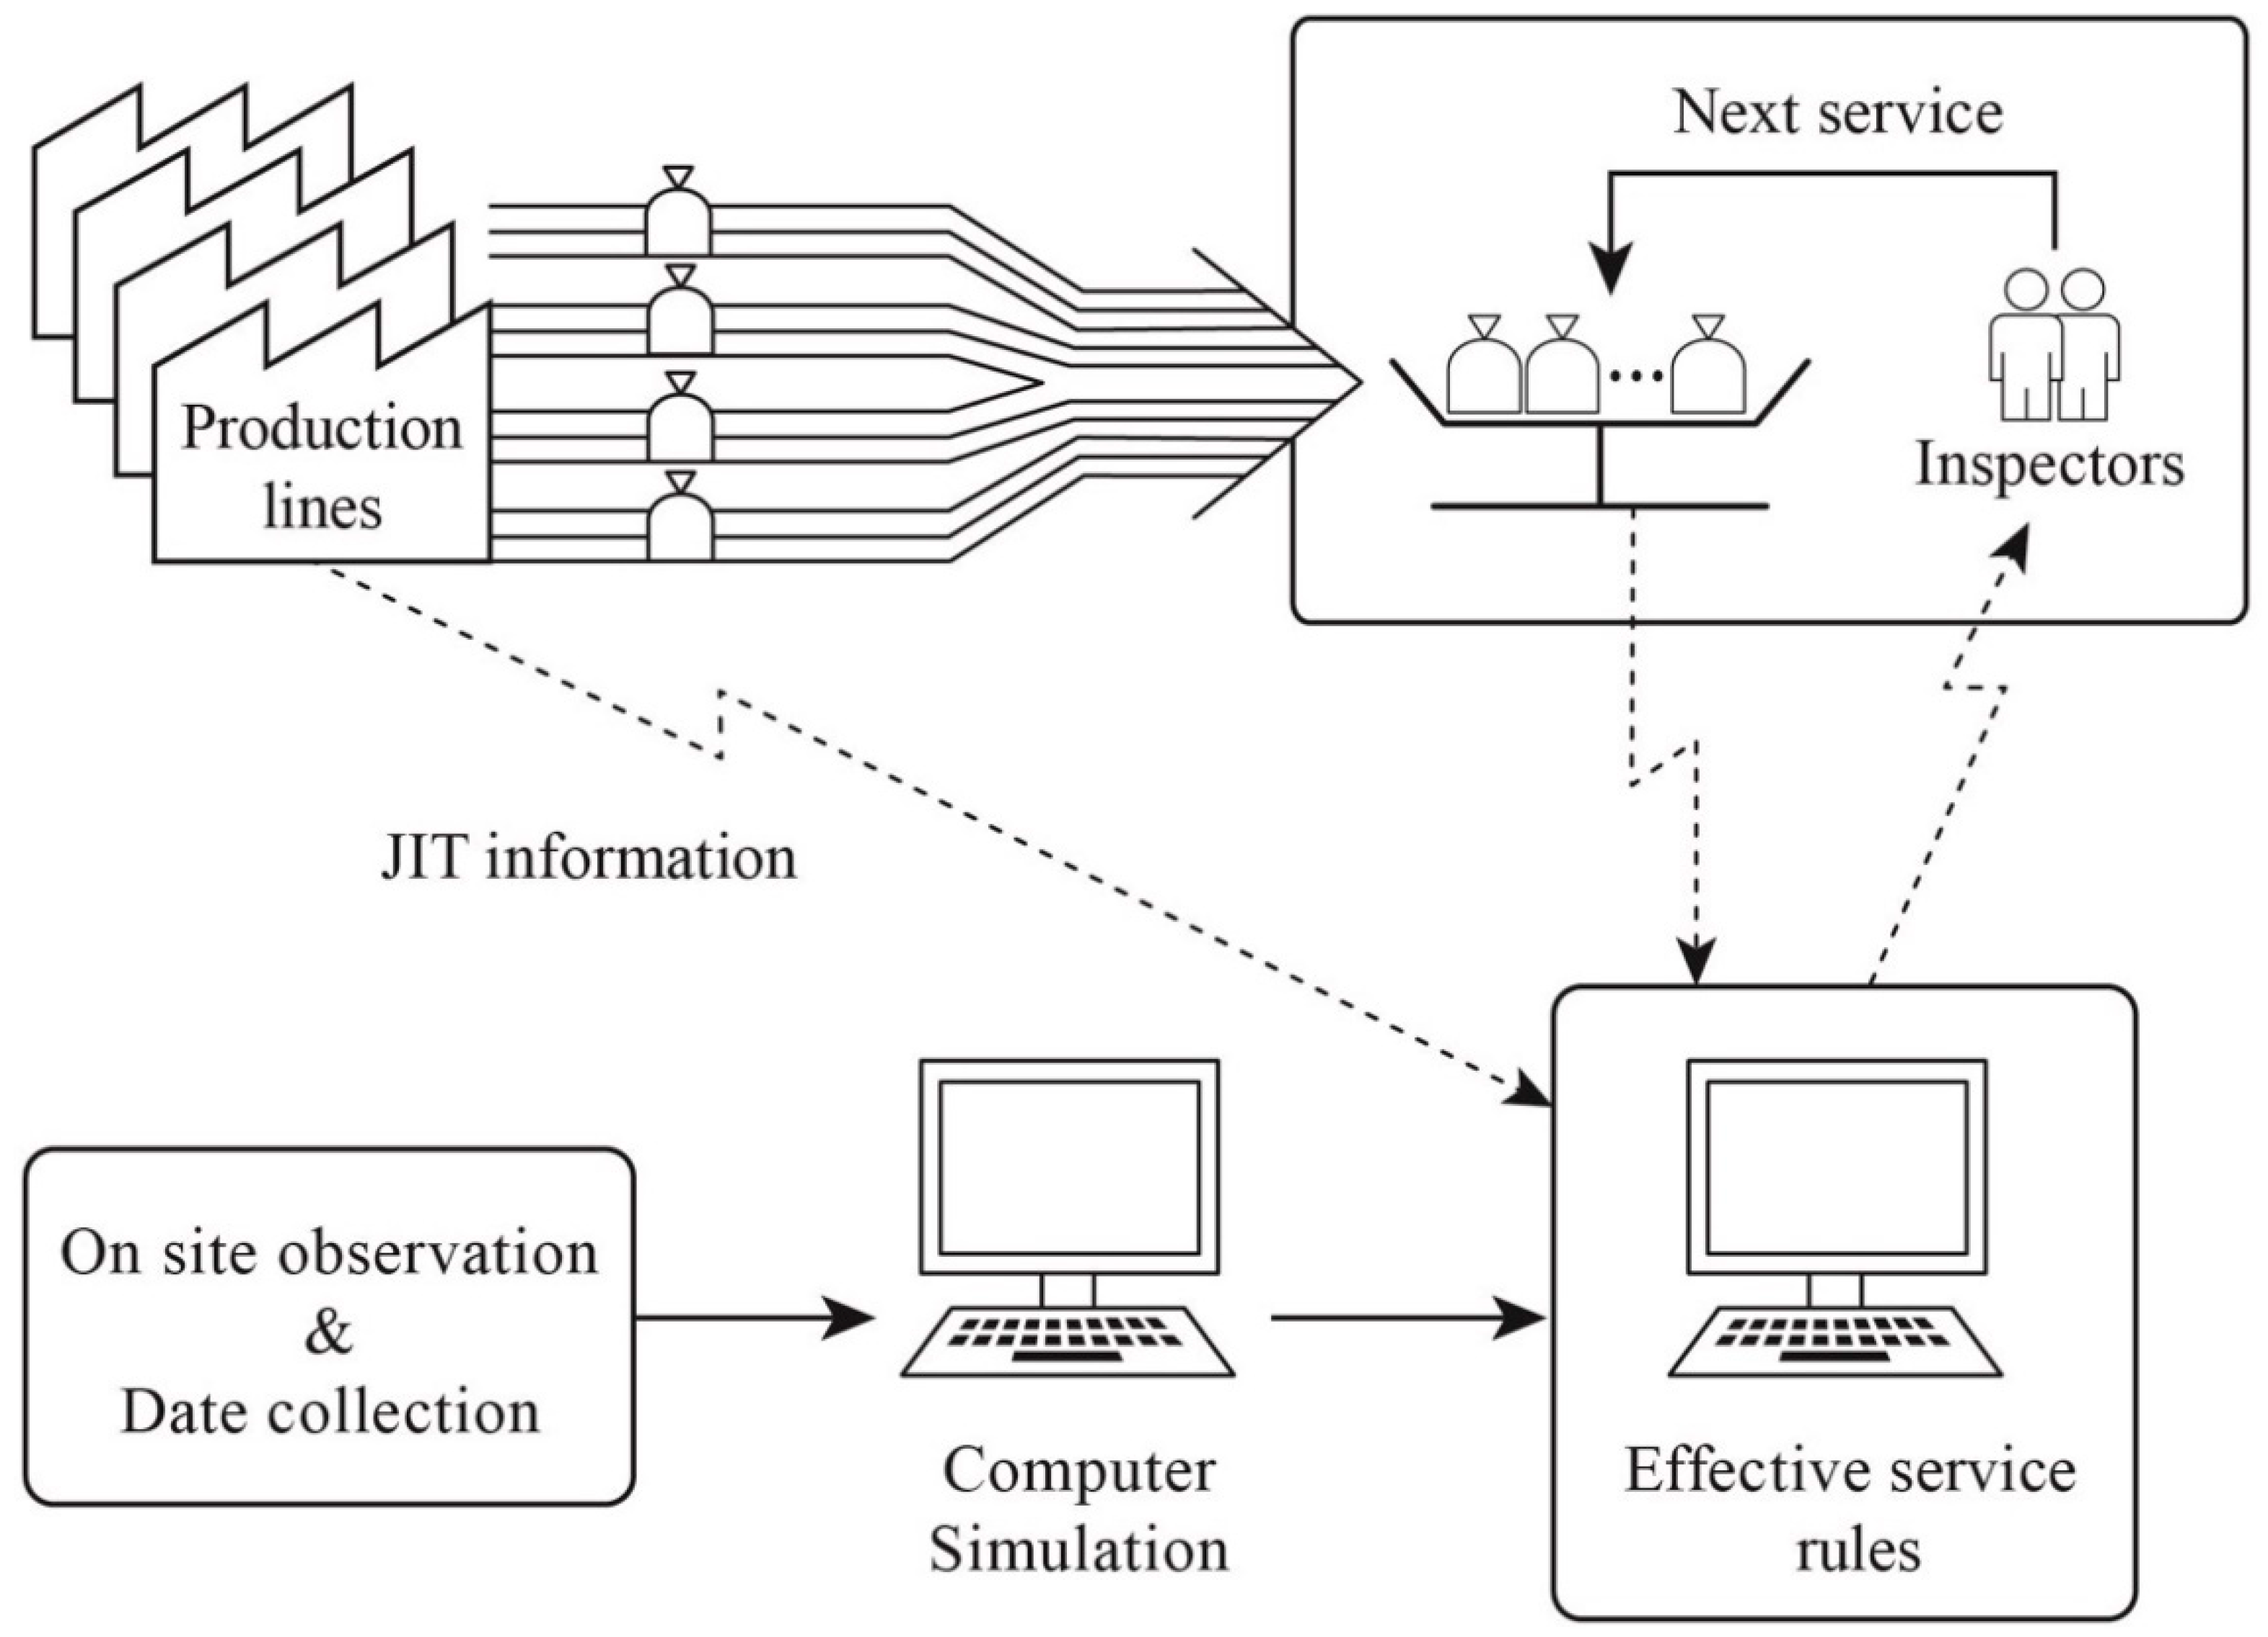
An operation mode of lean management always focuses on stabilizing production flow and well using limited resources (raw materials, manpower, machines and etc.) in order to achieve the just-in-time (JIT) service at the lowest possible cost. Therefore, the view of lean management is applied to design the efficient operation mode for the IPI service in this study. After such an IPI operation mode is constructed, the simple and cheap tool for only sharing instant information from IoT is embedded into the operation process to monitor and then control the service flow. The conceptual framework of the new IPI service system is shown in Figure 6.
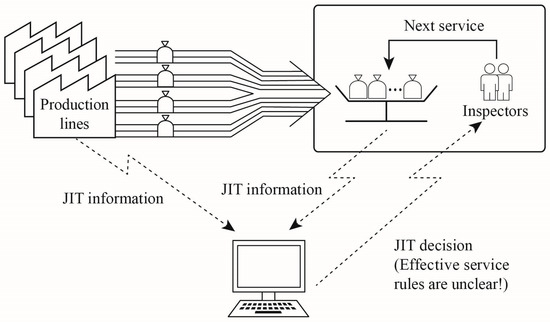
Figure 6.
Conceptual framework of new IPI service system.
Accordingly, the work for stabilizing sample flows commences by examining the possible IPI service configurations for an API manufacturing company with multiple process lines in order to identify the configuration, i.e., the assignment of inspection resource to one or more production lines under which the workload can be more evenly distributed to each inspector and the manpower utilization efficiency correspondingly improved. Various dispatching rules for the sample inspection waiting list and scheduling rules for the inspectors to the inspection task are then reviewed for the purpose of optimizing the arrangement of manpower and machines. An investigation is then performed to identify the IPI service configuration, dispatching rule, and scheduling rule, which collectively improves the performance of the IPI operation in terms of three main criteria, namely the service level (SL), the cycle time (CT), and the maximum tardiness time (Tardy).
The process of designing the IPI operation mode is both an MCDM problem (i.e., three main criteria) and a parameter optimization problem (i.e., the IPI service configuration, dispatching rule, and scheduling rule are each assumed to have several levels for robust Taguchi experimental design method). Taguchi’s robust design method enables even complex optimization-type problems to be solved using a minimum number of experimental trials. However, it is intended to solve design problems with a single optimization criterion. Thus, the Taguchi results for the present MCDM problem are further processed using the TOPSIS method in order to identify the optimal redesign solution as evaluated over all three design criteria simultaneously. The feasibility of the proposed redesign methodology is demonstrated through a practical application.
We are not aware of any literature that specifically optimizes the IPI procedure design for the API process. Since API manufacturing is an important industrial sector, the present study addresses an important application problem. Its effectiveness is demonstrated using a practical case. Especially, we propose an achievable strategy combining lean management and simple IoT tools to upgrade a system from industry 3.0 or less to as good as industry 4.0. Thus, the empirical results will contribute to both practice and literature.
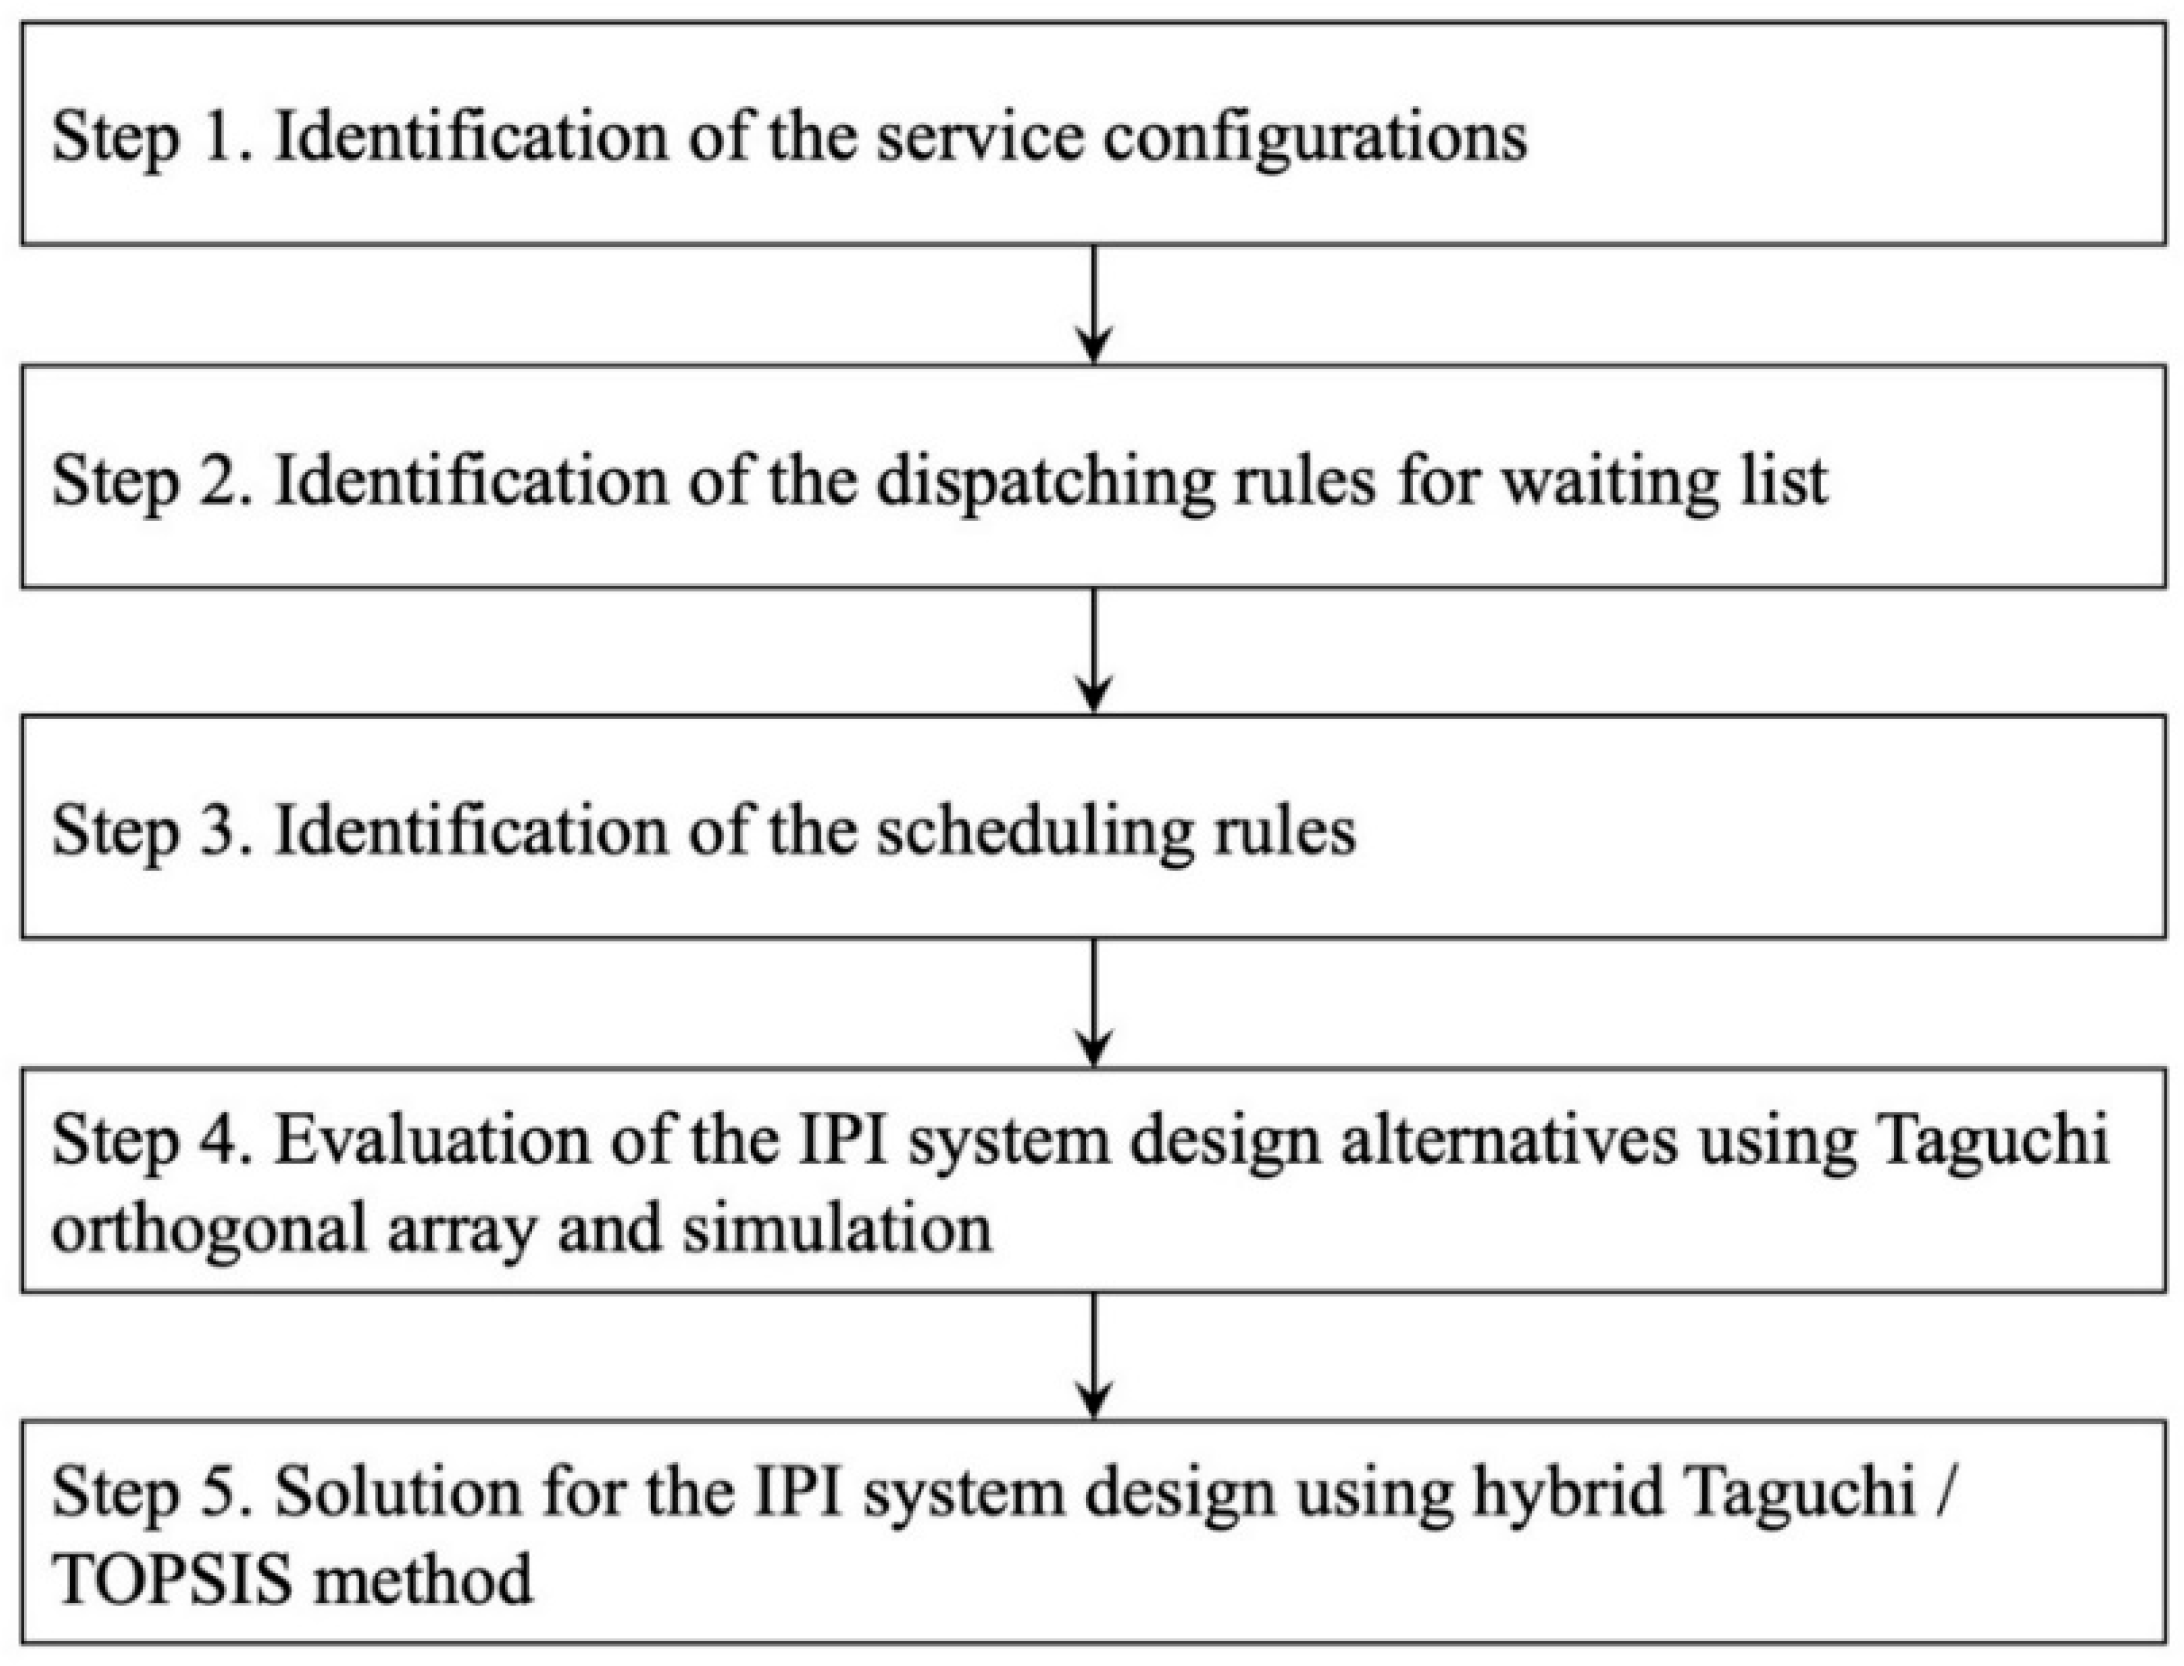
Having made a careful study of the possible factors affecting the efficiency of the IPI service in the current system through the three factors are chosen as the basis for the redesign process, namely the IPI service configuration, the dispatching rule used to select samples for inspection from the inspection waiting line, and the scheduling rule used to assign inspectors to the inspection tasks. On the basis of a further survey, four possible level settings are identified for each redesign factor. Figure 7 presents a schematic illustration of the proposed redesigned method with five steps.

Figure 7.
Research process flowchart.
In the proposed redesign methodology, the Taguchi method is used first to determine the optimal level setting for each factor, taking each of the three design criteria separately as the objective function. The TOPSIS method is then applied to analyze the Taguchi results and then generate a single comprehensive value for evaluating the performance of newly designed system based on a joint consideration of all three criteria simultaneously.
The first three steps of the proposed methodology focus on the design of new IPI service configurations and rules, while Steps 4 to 5 apply the hybrid Taguchi/TOPSIS method to integrate the new configurations and rules to generate new service systems and then select the optimal design. The details of 5 steps are described in Section 3.1, Section 3.2, Section 3.3, Section 3.4 and Section 3.5 respectively.
3.1. Identification of the Service Configurations
The 11 manufacturing lines in the case company are separated into 4 groups in accordance with the type of product they produce. The four inspectors in each shift are then allocated to these groups, resulting in four service lines (see Figure 2).
In queuing theory, the number of service lines has a critical effect on the waiting time. However, by merging several service lines into one, it is possible to shorten the waiting time of the original one-line-to-one-server system [42]. Thus, in the present context, by properly merging some of the service lines, the workloads of the inspectors in the IPI division can be more evenly distributed, and the efficiency of the IPI service correspondingly improved.
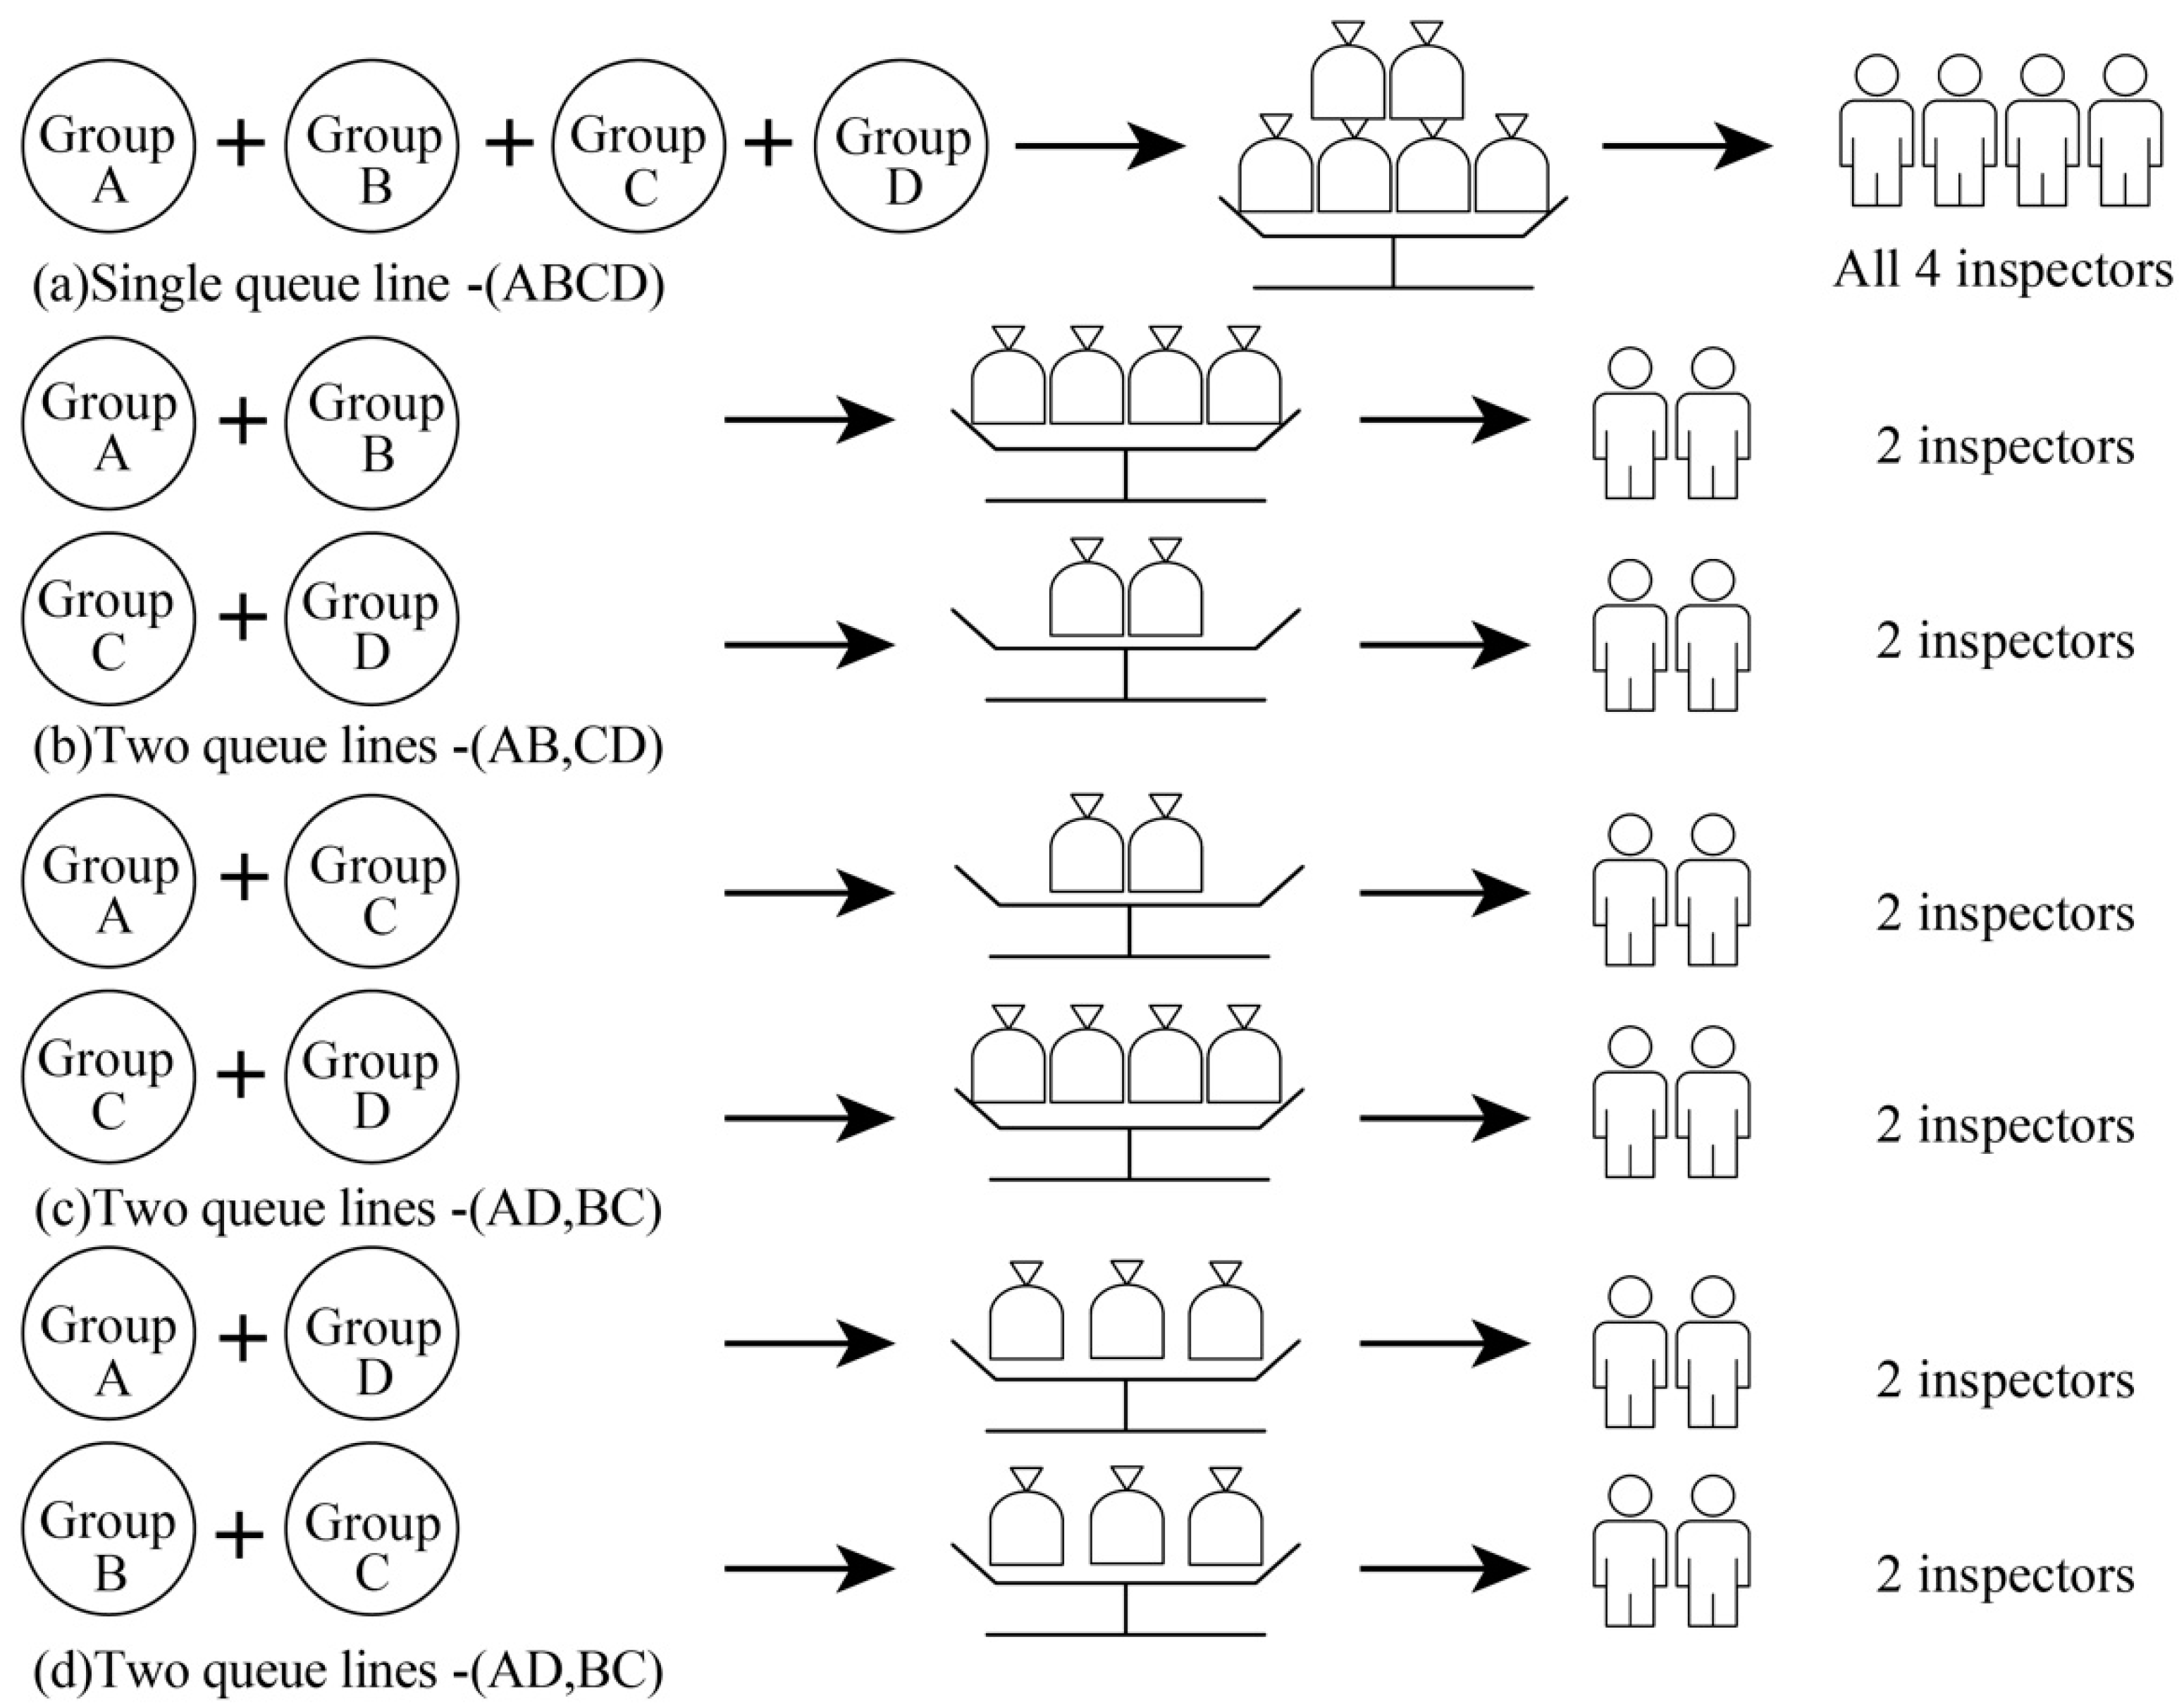
Let the four groups in Figure 8 be denoted as A, B, C and D, respectively. In merging these groups, three different strategies can theoretically be applied, namely: (i) merge all 4 groups into a single group; (ii) merge any 3 groups and keep the remaining group as before; and (iii) merge any 2 groups of the original 4 groups to reduce the system to just 2 groups. In practice, however, strategy (ii) can be discounted since the unmerged line may still risk an imbalanced situation.

Figure 8.
Four possible service configurations.
In strategy (i), all of the samples from groups A, B, C, and D are assigned to the same service line, and this line is then served by all four inspectors. For convenience, this merging scenario is denoted as (ABCD) hereafter. Three different merging outcomes are possible for strategy (iii). For example, the products of groups A and B can be merged into one service line, while those of C and D are merged into a second line. Two inspectors are then assigned to each line. For convenience, this scenario is denoted as (AB, CD) hereafter. Similarly, the four groups can also be merged as (AC, BD) and (AD, BC), respectively. In other words, as shown in Figure 8, there are four service configurations alternatives—(ABCD), (AB, CD), (AC, BD), and (AD, BC), which are determined by an exhaustive search approach.
3.2. Identification of the Dispatching Rules for Waiting List
When more than one sample is waiting for inspection, dispatching rules are required to determine the sample which should be selected for inspection next. In practice, a proper design of the dispatching rule is essential in improving the efficiency and throughput of the service system and hence in improving its performance. The present study, therefore, considers four common dispatching rules for deployment in the API division, namely First-In-First-Out (FIFO), Shortest-Processing-Time (SPT), Earliest-Due-Date (EDD), and Critical-Ratio (CR). FIFO selects the sample which arrives earliest, while SPT chooses the sample with the shortest processing time. Similarly, EDD selects the sample with the earliest due date, while CR chooses the sample with the lowest CR rate, which is defined as Equation (1).
Although there are many dispatching rules in existing literature, many of them are not practical. The four chosen dispatching rules are relatively simple and are potentially feasible for the case problem and, thus, are chosen for the present study.
3.3. Identification of the Scheduling Rules
In addition to an efficient dispatching rule, the IPI service system also requires a proper scheduling rule to select an inspector to inspect the chosen sample. The present study considers four common scheduling rules, namely Random (RAND), Cyclical (CYC), Preferred Order (POR), and Smallest Number Busy (SNB). RAND selects an inspector from the available inspectors randomly; CYC selects the first available inspector beginning with the successor of the previously selected inspector in an ordered list of the inspectors; POR selects the first available inspector in the ordered list of inspectors; SNB selects the inspector with the least number of to-be-inspected samples. The reasons to choose the scheduling rules for the present study are the same as the ones for choosing the dispatching rules mentioned above.
3.4. Evaluation of the IPI System Design Alternatives Using Taguchi Orthogonal Array and Simulation
In the Taguchi method [15], the experimental trials are configured in an orthogonal array denoted as , where represents the number of treatments in the experiment, is the number of control factors, and is the number of levels for each control factor. For the IPI redesign process considered in this study, = 3 and = 4, as discussed later in Section 4.
For each run in the orthogonal array (OA), simulations are performed to determine the corresponding values of the SL, CT, and Tardy performance criteria.
3.5. Solution for the IPI System Design Using Hybrid Taguchi/TOPSIS Method
As described above, the Taguchi method provides an effective approach for solving single-objective optimization problems. However, the present study involves an MCDM problem with three performance criteria (i.e., SL, CT, and Tardy). Thus, for each treatment in the OA, the TOPSIS method is employed to produce a single overall value for the redesign performance based on all three criteria. This comprehensive value is then used in place of the original S/N ratio in the Taguchi method to evaluate the optimal solution. The details of the proposed approach are described in the following.
First, an appropriate loss function is chosen to evaluate the loss cost of the result of each treatment in the OA for the bias to the given target value for each criterion. Based on the property of the target value of the concerned criterion, three different types of loss function may be applicable, namely nominal-the-better, smaller-the-better, and larger-the-better. Let denote observation in treatment for criterion . Furthermore, let be the total number of observations and be the target value of criterion . The loss cost for the smaller-the-better criterion with respect to the observations of treatment can be determined using the following loss function:
where is the loss function coefficient, i.e., the estimated rate for the loss of bias to the target value. For the smaller-the-better criterion, can be taken as zero. Therefore, the loss function reduces to
For the larger-the-better criterion, a large causes less loss. Consequently, the loss function can be expressed as
Let be the number of criteria, the number of treatments, the maximum loss cost for criterion and the minimum loss cost for criterion . The transition formula proposed by Tong and Su [43] can be used to convert these loss costs under different criteria into the same scale such that they can be fairly compared. More specifically, for each criterion , the loss cost under treatment can be standardized as
In Equation (5), () is the normalized loss function for criterion at treatment , and a value of closer to 1 indicates a lower loss.
When having normalized the loss costs, a proper weighting function is required to weight the importance of each criterion relative to the other criteria. Let be the weight of criterion . According to the vector normalization approach [23], the normalized and weighted value for treatment and criterion can be computed as
where has to satisfy the following constraint:
Various simple and effective weighting methods are available, including the rank order centroid method is adopted in the present study. Suppose that criteria exist and are to be assigned different weights in accordance with the rank order centroid method [30]. The th smallest weight value is calculated as,
Let the positive ideal solution and negative ideal solution be defined respectively as
and,
The distance to the positive ideal solution and distance to the negative ideal solution with respect to the result of treatment can be calculated respectively as
and
Based on the distances to the positive and negative solutions, the similarity of the solution for treatment to the ideal solution can be formulated as
where lies between 0 and 1, and a value closer to 1 indicates that the solution is closer to the ideal solution. Note that in the present study, is used in place of the S/N ratio in the Taguchi method. In particular, the similarity value for each level of a factor is obtained as the summation of all the associated with this level. The level with the highest similarity value is then taken to represent the optimal parameter setting for the corresponding factor.
4. Empirical Illustration
As discussed in the previous section, the present study considers three control factors for the IPI redesign process, namely the service system configuration (C), the dispatching rule (D), and the scheduling rule (S). Furthermore, each control factor is assigned four possible level settings (see Table 1).

Table 1.
Control factors and level settings.
Since the redesign problem involves three control factors and four levels, the experimental runs are configured in an OA, as shown in Table 2. Since the present study has only three factors, the furthest two right columns are not used.
Table 2.
Treatments in present redesign experiments.
In implementing Step Five of the proposed redesign methodology, a computer simulation model of the IPI service system was constructed using Arena® software (Version 14) by Rockwell Automation located in Milwaukee, Wisconsin, United States of America. The simulations were run on a PC with an Intel® CoreTM i7-3770 CPU@3.4GHz and 4 GB ram. The data input into the computer simulation model is shown in Table 3. The input data comes from the practical operational values of the case company.
Table 3.
The input data of the computer simulation model.
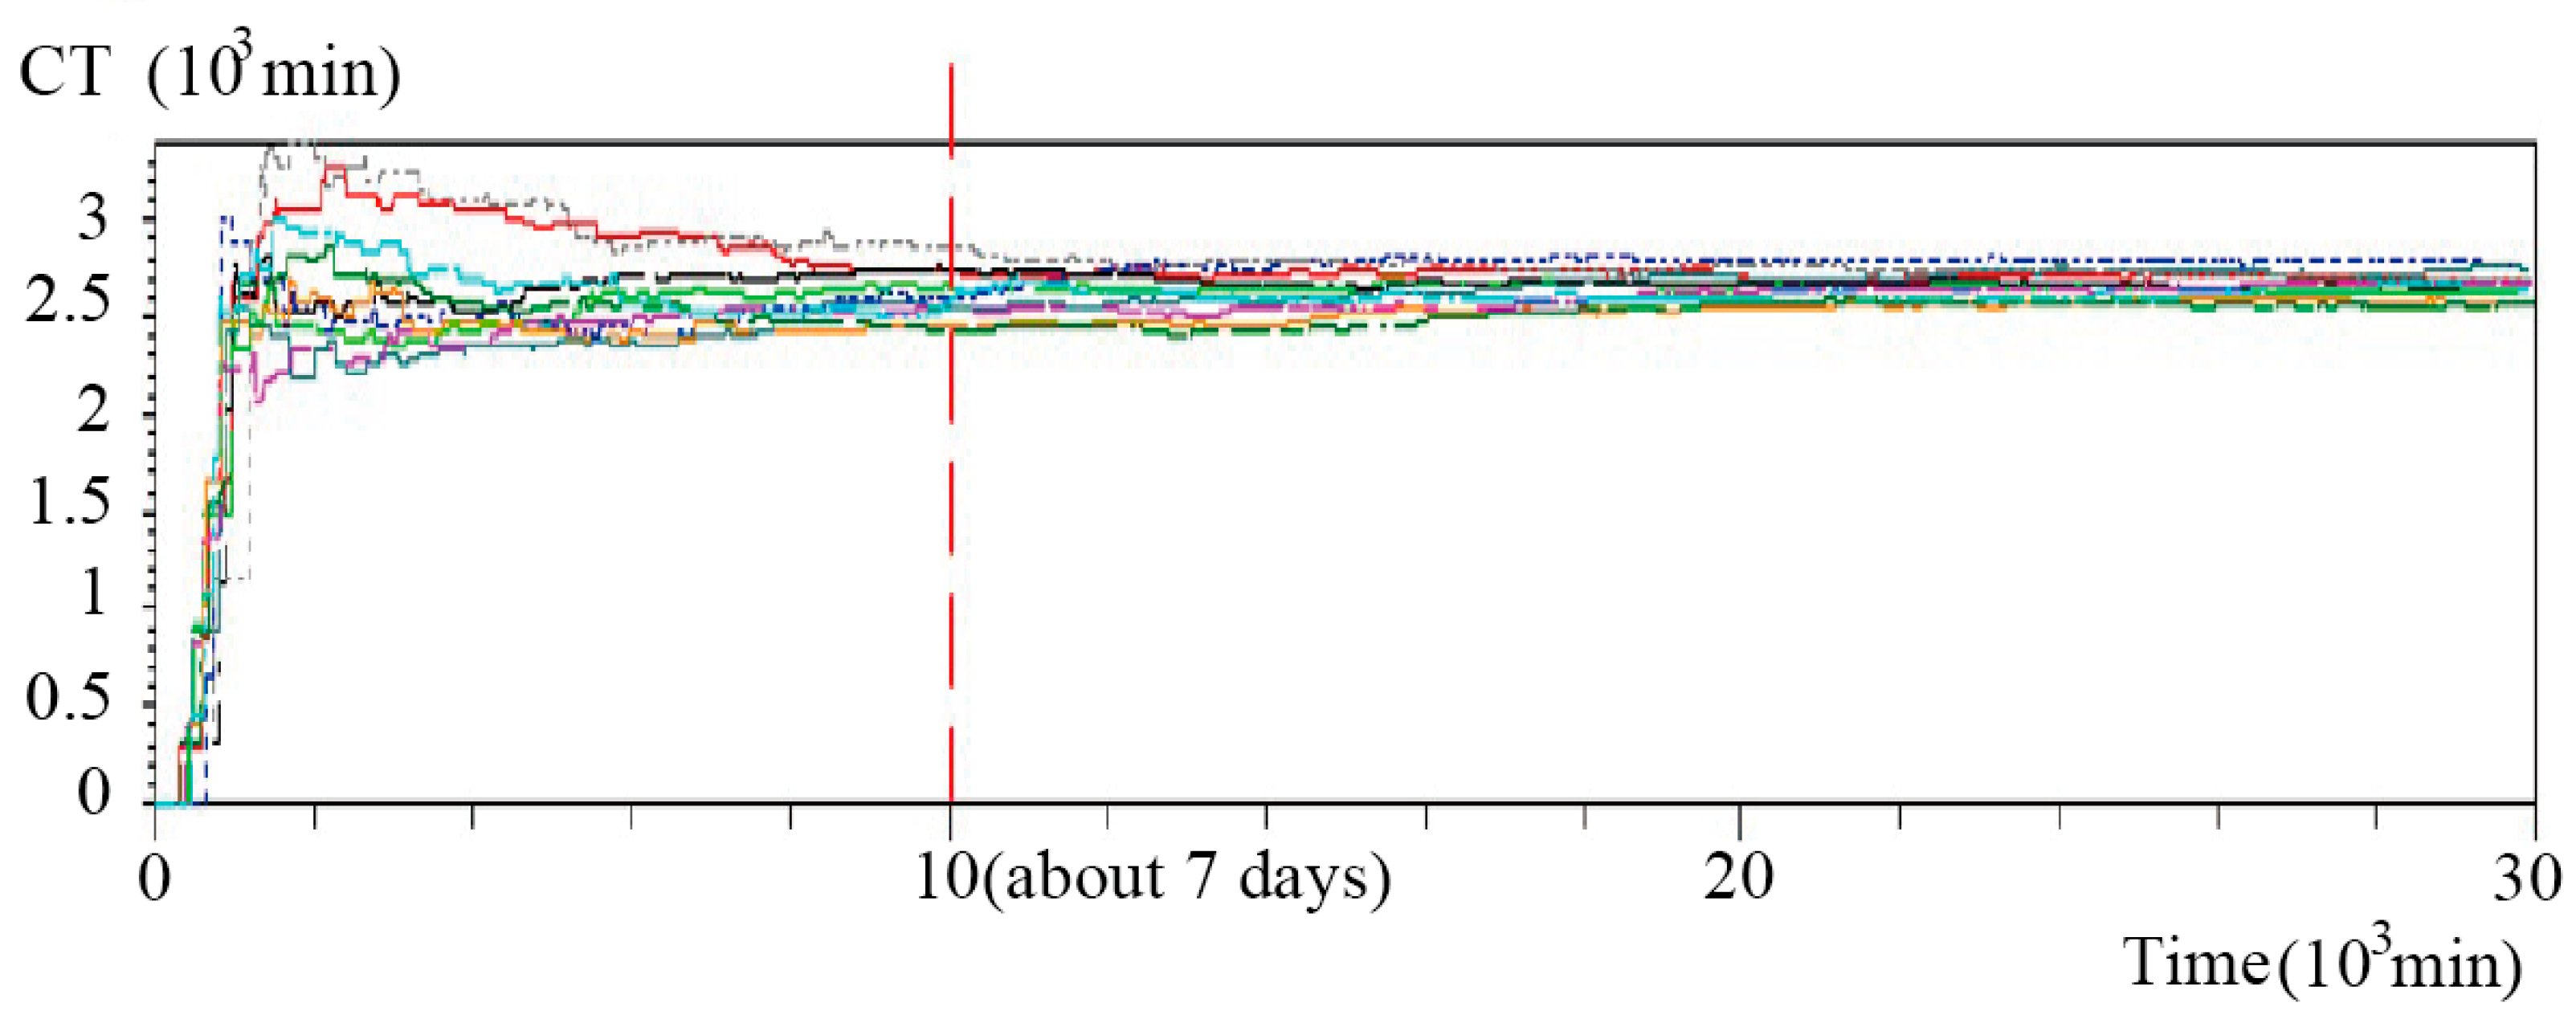
The simulation run length was set as 30 days. There are 48 replications for each simulation run. Based on an inspection of the simulated CT results, the warm-up period for the simulation model was determined to be 10,000 min (about 7 days), as shown in Figure 9. The 48 replications result in a total of 48 simulation trajectories of CT is shown in Figure 9. The truncated replications were then collected for further study.

Figure 9.
Simulation warm-up period.
Each color with a different line style represents a simulation trajectory of CT, and there are 48 trajectories. The figure shows that these trajectories converge after 10,000 min (about 7 days).
Before running the computer simulation model for the experimental treatments prescribed in the Taguchi orthogonal array, the model validity was confirmed using the comparison method shown as Equation (14) [44]. In particular, the mean values of two of the most important IPI performance criteria (namely the SL and the CT) obtained over 10 replications of the model were compared with the empirical data collected from the current IPI system. Currently, we can only collect SL and CT data from the case company, and the other two measurement data of Tardy are not available. Thus, only SL and CT are used for simulation model validation. Since Tardy data can be collected from the simulation model and can provide additional managerial insights to the present study, they are adopted for the empirical analysis.
For each performance measure, the absolute deviation was evaluated as
As shown in Table 4, the absolute deviations for the SL and CT performance measures are just 3.27% and 1.87%, respectively. In other words, the accuracy of the simulation model in representing the current IPI service system is confirmed.
Table 4.
Error rates for SL and CT performance measures.
The half-width of the mean value of SL obtained over 10 replications is 1.5%. In order to have more accurately estimated mean values of important IPI performance criteria for the following analysis, 48 replications of the simulation model were performed for each treatment in the orthogonal array. Consequently, the half-width of the mean value of SL from 48 replications can shrink to 0.67%, according to the simulation result.
As described in the previous section, the TOPSIS method was used to analyze the outcome of the Taguchi experiments in order to determine the optimal solution for the IPI service redesign problem. In evaluating the Taguchi results, the larger-the-better criterion was applied to the SL measure, while the smaller-the-better criterion was applied to the CT and Tardy measures. In accordance with feedback received from experts in the case company, the three criteria were ranked in descending order of importance as follows: SL, CT and Tardy. The weights obtained using rank order centroid method for the three criteria are evaluated using Equation (8) are listed in Table 5.
Table 5.
Weights of three evaluation criteria using rank order centroid method.
Table 6 shows the observations of each treatment in Table 2 for SL, CT, and Tardy and the numerical result of TOPSIS for , and is defined by Equations (11)–(13), respectively.
Table 6.
Numerical result of TOPSIS.
Table 7 shows the response table results () obtained for the outcomes of the 16 experimental trials in the Taguchi orthogonal array.
Table 7.
Response table for similarity values of factors in different levels.
According to the results, the optimal design parameters for the IPI service system are as follows: C4D4S3. In other words, in the redesigned IPI service system, the IPI service is configured as (AD, BC), the samples waiting for inspection are selected in accordance with the CR dispatching rule, and the inspectors are assigned to the inspection task using the POR scheduling rule.
The validity of the proposed IPI redesign was confirmed by comparing the SL, CT, and Tardy results with those obtained from the original system. As shown in Table 8, the proposed redesign improves the three performance measures by 28.75%, 18.32%, and 22.22%, respectively. Consequently, the validity of the redesigned IPI process is confirmed.
Table 8.
Performance comparison between redesigned and original systems.
Then, a sensitivity analysis was performed to compare the performance of the proposed redesigned system with that of alternative systems obtained using different orders of importance of the three criteria (Table 9) or based on only one of the three criteria (Table 10).
Table 9.
Outputs of proposed hybrid method given different weights of three performance criteria.
Table 10.
Outputs of proposed hybrid method obtained using single performance criterion.
The results presented in Table 9 show that the performance of the redesigned IPI service system (upper row) is similar to that of all the other systems obtained using different orders of importance of the three main performance criteria. In addition, the optimal service configuration is found to be (AD, BC) irrespective of the relative importance assigned to the three criteria. However, the optimal dispatching rule (CR in the proposed redesign) is replaced by SPT when CT is deemed to be the most important performance criterion. Finally, when Tardy is taken as the most important criterion, CR is found to be the optimal dispatching rule once again, while CYC (POR) is the optimal scheduling rule when the SL (CT) criterion is deemed to be the second most important performance measure.
The results presented in Table 10 show that the performance of the proposed redesigned system (top row) is close to that of the three systems obtained using only one of the three performance measures as the design criterion. Overall, the results presented in Table 9; Table 10 indicate that the suggested IPI service system redesign represents a feasible and reliable solution for the case company.
Finally, our results are compared with those obtained using SMARTER-ROC and ELECTRE. The detailed explanations for SMARTER-ROC and ELECTRE are described in Section 1. The weight sum score of SMARTER-ROC [22] or the net advantage value of ELECTRE [45] with weights by the rank order centroid method, shown as Equation (8), is used in place of SN ratios for the further process of searching optimally designed parameters in the Taguchi. The resulting comparison is summarized in Table 11. Both TOPSIS and ELECTRE concluded the same optimal design configuration. SMARTER-ROC concluded a slightly different design configuration. However, the final system performances from the three methods are almost the same, as shown in Table 11. In conclusion, TOPSIS is quite robust to solve the proposed MCDM problem.
Table 11.
Comparison of results obtained using SMARTER-ROC, ELECTRE and TOPSIS.
The above study designs a new robust and efficient lean IPI service rule. Then the simple IoT tools mentioned in the three tasks in Step Six should be constructed for obtaining and sharing needed information immediately to each inspector in order to smooth the operation of the lean IPI service. In fact, the combination of the lean operation mode and the simple IoT tools is an achievable strategy to improve the performance to a to-be industry 4.0 status with low investment and time cost. Figure 10 shows the framework of new designed IPI service system.
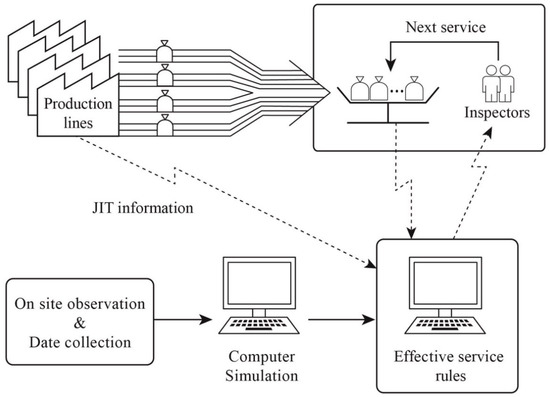
Figure 10.
Framework of new designed IPI service system.
The proposed methodology successfully solved the case problem with significant improvements. The use of TOPSIS can convert an MCDM problem using a surrogate function for the proposed three system performance criteria. The surrogate function is then used for solving the parameter design problem using the proposed Taguchi method, as shown in Table 7. The resulting optimal solution based on the surrogate function is proven to be an effective solution by the examination of the improved individual performance criterion, which ranges from 18.32% to 28.75%, as shown in Table 8.
The proposed methodology adopted the order centroid method to determine the weights of the three evaluation criteria since different weighting methods may influence the solution results. Thus, we also performed sensitivity analysis by examining different weighting scenarios for the case problem. We examined six weighting scenarios, as shown in Table 9, which showed a quite consistent improvement rate for the three performance criteria across the different weighting scenarios. Thus, the proposed methodology is proven to be a robust approach in solving the proposed problem. In addition, from Table 11, the performance of the three criteria based on the output IPI system obtained by our proposed method is almost the same as the one obtained by the popular MCDM solver, SMARTER-ROC, or ELECTRE.
The efficiency of the proposed IPI service redesign has been demonstrated through numerical simulations. As a future development, the performance of the IPI operation mode in the actual physical context of the considered case company can be further confirmed with the construction of mentioned simple IoT tools in order to realize of benefits of a digital manufacturing environment.
5. Conclusions
The efficiency of the IPI service plays a critical role in ensuring the competitiveness of the API manufacturing company. In practice, the efficiency of the chemical reaction process is determined by the on-site conditions and is hence subject to variability. Very few studies have investigated the effects of the IPI performance on the overall efficiency and profitability of the API production process. The present study has proposed a hybrid methodology based on the Taguchi robust design method and TOPSIS to redesign the IPI process in a typical large-scale API manufacturing company. In the proposed approach, the Taguchi method is implemented using three control factors and four different level settings. For each run in the Taguchi OA, simulations are performed to determine the corresponding values of three main criteria. Finally, the TOPSIS method is used to determine the redesign solution which yields the best overall performance, as evaluated jointly across all three performance criteria. The resulting optimal solution is proven to be an effective solution by the examination of the improved individual performance criterion. It has been shown that the proposed redesigned IPI process improves the SL by 28.75% compared to that in the current case company. Furthermore, the CT is reduced by 18.32% since different weighting methods may influence the solution results. Thus, we also performed sensitivity analysis by examining different weighting scenarios for the case problem. The sensitivity analysis results have further confirmed that the proposed IPI service redesign provides a robust and effective solution for the considered case company. In addition, by comparing our method with the other two popular MCDM methods, SMARTER-ROC and ELECTRE, the results from these two methods are almost the same as ours, which shows that our proposed method is robust.
The process described in this study has assumed normal day-to-day running conditions of the case company. Therefore, future studies should test the robustness of the proposed redesigned IPI service system in the face of possible emergency conditions, such as the lack of standard materials, solvents, and test equipment, and then analyze the consequent results in order to establish optimal response strategies beforehand. Consequently, future studies may also consider the implementation of such an approach in the considered case company and employ the proposed Taguchi/TOPSIS methodology to redesign the IPI operation mode accordingly.
Author Contributions
Conceptualization, T.Y., S.-Y.L. and C.-C.H.; methodology, T.Y., S.-Y.L. and C.-C.H.; software, T.Y., S.-Y.L., Y.-H.H. and C.-C.H.; validation, T.Y. and C.-C.H.; formal analysis, T.Y. and C.-C.H.; investigation, T.Y., S.-Y.L. and C.-C.H.; resources, T.Y. and C.-C.H.; data curation, T.Y., S.-Y.L.; writing—original draft preparation, T.Y. and C.-C.H.; writing—review and editing, T.Y., Y.-H.H. and C.-C.H.; visualization, T.Y. and C.-C.H.; supervision, T.Y. and C.-C.H.; project administration, T.Y. and C.-C.H.; funding acquisition, T.Y. All authors have read and agreed to the published version of the manuscript.
Funding
This research was partially funded by Ministry of Science and Technology, Taiwan, Republic of China: 109-2221-E-006-152-MY3.
Institutional Review Board Statement
Not applicable.
Informed Consent Statement
Not applicable.
Data Availability Statement
Not applicable.
Conflicts of Interest
The authors declare no conflict of interest.
Nomenclature
| AI | Artificial Intelligence |
| API | Active Pharmaceutical Ingredients |
| CT | Cycle Time |
| CR | Critical-Ratio |
| CYC | Cyclical |
| EDD | Earliest-Due-Date |
| FIFO | First-In-First-Out |
| IC | Integrated Circuit |
| IPI | In-Process Inspection |
| IoT | Internet of Things |
| JIT | Just-In-Time |
| MCDM | Multiple-Criteria Decision-Making |
| OA | Orthogonal Array |
| POR | Preferred Order |
| RAND | Random |
| R&D | Research and Development |
| SL | Service Level |
| SNB | Smallest Number Busy |
| SPT | Shortest-Processing-Time |
| Tardy | Maximum Tardiness Time |
| TOPSIS | Technique for Order Preference by Similarity to an Ideal Solution |
References
- EvaluatePharma. Annual World Preview 2018, Outlook to 2024. Available online: http://info.evaluategroup.com/rs/607-YGS-364/images/EvaluatePharma-World-Preview-2018-Executive-Summary.pdf (accessed on 10 November 2021).
- Bharate, S.S.; Bharate, S.B.; Bajaj, A.N. Interactions and incompatibilities of pharmaceutical excipients with active pharmaceutical ingredients: A comprehensive review. J. Excip. Food Chem. 2016, 1, 1131. [Google Scholar]
- The Pharmaceutical Industry in Figures. European Federation of Pharmaceutical Industries and Association. Available online: https://www.efpia.eu/media/219735/efpia-pharmafigures2017_statisticbroch_v04-final.pdf (accessed on 10 November 2021).
- Gutmann, B.; Cantillo, D.; Kappe, C.O. Continuous-flow technology—A tool for the safe manufacturing of active pharmaceutical ingredients. Angew. Chem. Int. Ed. 2015, 54, 6688–6728. [Google Scholar] [CrossRef] [PubMed]
- Schaefer, C.; Clicq, D.; Lecomte, C.; Merschaert, A.; Norrant, E.; Fotiadu, F. A Process Analytical Technology (PAT) approach to control a new API manufacturing process: Development, validation and implementation. Talanta 2014, 120, 114–125. [Google Scholar] [CrossRef] [PubMed]
- Blocher, J.D.; Garrett, R.W.; Schmenner, R.W. Throughput time reduction: Taking one’s medicine. Prod. Oper. Manag. 1999, 8, 357–373. [Google Scholar] [CrossRef]
- Costa, A. Hybrid genetic optimization for solving the batch-scheduling problem in a pharmaceutical industry. Comput. Ind. Eng. 2015, 79, 130–147. [Google Scholar] [CrossRef]
- Marques, C.M.; Moniz, S.; de Sousa, J.P.; Barbosa-Póvoa, A.P. A simulation-optimization approach to integrate process design and planning decisions under technical and market uncertainties: A case from the chemical-pharmaceutical industry. Comput. Chem. Eng. 2017, 106, 796–813. [Google Scholar] [CrossRef] [Green Version]
- Stefansson, H.; Sigmarsdottir, S.; Jensson, P.; Shah, N. Discrete and continuous time representations and mathematical models for large production scheduling problems: A case study from the pharmaceutical industry. Eur. J. Oper. Res. 2011, 215, 383–392. [Google Scholar] [CrossRef]
- Lamothe, J.; Marmier, F.; Dupuy, M.; Gaborit, P.; Dupont, L. Scheduling rules to minimize total tardiness in a parallel machine problem with setup and calendar constraints. Comput. Oper. Res. 2012, 39, 1236–1244. [Google Scholar] [CrossRef] [Green Version]
- Manzouri, M.; Ab-Rahman, M.N.; Zain, C.R.C.M.; Jamsari, E.A. Increasing production and eliminating waste through lean tools and techniques for halal food companies. Sustainability 2014, 6, 9179–9204. [Google Scholar] [CrossRef] [Green Version]
- Fercoq, A.; Lamouri, S.; Carbone, V. Lean/Green integration focused on waste reduction techniques. J. Clean. Prod. 2016, 137, 567–578. [Google Scholar] [CrossRef]
- Sacks, R.; Treckmann, M.; Rozenfeld, O. Visualization of work flow to support lean construction. J. Constr. Eng. Manag. 2009, 135, 1307–1315. [Google Scholar] [CrossRef]
- Schoeman, Y.; Oberholster, P.; Somerset, V. Value stream mapping as a supporting management tool to identify the flow of industrial waste: A case study. Sustainability 2021, 13, 91. [Google Scholar] [CrossRef]
- Taguchi, G. Introduction to Quality Engineering; Asian Productivity Organization: Tokyo, Japan, 1986. [Google Scholar]
- Edwards, W.; Barron, F.H. SMARTS and SMARTER: Improved simple methods for multiattribute utility measurement. Organ. Behav. Hum. Decis. Processes 1994, 60, 306–325. [Google Scholar] [CrossRef]
- Saaty, T.L. What is the analytic hierarchy process? In Mathematical Models for Decision Support; Springer: Heidelberg, Germany, 1988; pp. 109–121. [Google Scholar]
- Julong, D. Introduction to grey system theory. J. Grey Syst. 1989, 1, 1–24. [Google Scholar]
- Yu, P.-L. Multiple-Criteria Decision Making: Concepts, Techniques, and Extensions; Springer: New York, NY, USA, 2013; Volume 30. [Google Scholar]
- Clímaco, J.; Craveirinha, J. Multicriteria analysis in telecommunication network planning and design—Problems and issues. In Multiple Criteria Decision Analysis–State of the Art Surveys; Springer: New York, NY, USA, 2005; pp. 899–941. [Google Scholar]
- Mardani, A.; Jusoh, A.; Nor, K.; Khalifah, Z.; Zakwan, N.; Valipour, A. Multiple criteria decision-making techniques and their applications-a review of the literature from 2000 to 2014. Econ. Res-Ekon. Istraživanja 2015, 28, 516–571. [Google Scholar] [CrossRef]
- Barron, F.H.; Barrett, B.E. Linear Inequalities and the Analysis of Multi-Attribute Value Matrices. In Decision Science and Technology; Springer: Boston, MA, USA, 1999; pp. 211–225. [Google Scholar]
- Manoliadis, O.; Vasilakis, E. Complexity measurement in engineering projects using factor analysis and the single multi-attribute rating technique exploiting ranks (SMARTER). Am. J. Manag. Sci. Eng. 2016, 1, 36–43. [Google Scholar]
- Chiou, J.Y.; Chiu, M.C. A robust technical platform planning method to assure competitive advantage under uncertainties. Int. J. Ind. Eng. 2014, 21, 327–336. [Google Scholar]
- Wang, Y.; Xu, L.; Solangi, Y.A. Strategic renewable energy resources selection for Pakistan: Based on SWOT-Fuzzy AHP approach. Sustain. Cities Soc. 2020, 52, 101861. [Google Scholar] [CrossRef]
- Colak, H.E.; Memisoglu, T.; Gercek, Y. Optimal site selection for solar photovoltaic (PV) power plants using GIS and AHP: A case study of Malatya Province, Turkey. Renew. Energy 2020, 149, 565–576. [Google Scholar] [CrossRef]
- Sureeyatanapas, P.; Sriwattananusart, K.; Niyamosoth, T.; Sessomboon, W.; Arunyanart, S. Supplier selection towards uncertain and unavailable information: An extension of TOPSIS method. Oper. Res. Perspect. 2018, 5, 69–79. [Google Scholar] [CrossRef]
- dos Santos, B.M.; Godoy, L.P.; Campos, L.M. Performance evaluation of green suppliers using entropy-TOPSIS-F. J. Clean. Prod. 2019, 207, 498–509. [Google Scholar] [CrossRef]
- Lin, S.S.; Shen, S.L.; Zhou, A.; Xu, Y.S. Approach based on TOPSIS and Monte Carlo simulation methods to evaluate lake eutrophication levels. Water Res. 2020, 187, 116437. [Google Scholar] [CrossRef] [PubMed]
- Koulinas, G.K.; Demesouka, O.E.; Marhavilas, P.K.; Vavatsikos, A.P.; Koulouriotis, D.E. Risk assessment using fuzzy TOPSIS and PRAT for sustainable engineering projects. Sustainability 2019, 11, 615. [Google Scholar] [CrossRef] [Green Version]
- Lin, R.; Lu, S.; Yang, A.; Shen, W.; Ren, J. Multi-criteria sustainability assessment and decision-making framework for hydrogen pathways prioritization: An extended ELECTRE method under hybrid information. Int. J. Hydrog. Energy 2021, 46, 13430–13445. [Google Scholar] [CrossRef]
- Del Vasto-Terrientes, L.; Fernández-Cavia, J.; Huertas, A.; Moreno, A.; Valls, A. Official tourist destination websites: Hierarchical analysis and assessment with ELECTRE-III-H. Tour. Manag. Perspect. 2015, 15, 16–28. [Google Scholar] [CrossRef] [Green Version]
- Wang, L.; Ali, Y.; Nazir, S.; Niazi, M. ISA evaluation framework for security of internet of health things system using AHP-TOPSIS methods. IEEE Access 2020, 8, 152316–152332. [Google Scholar] [CrossRef]
- Wang, X.; Duan, Q. Improved AHP–TOPSIS model for the comprehensive risk evaluation of oil and gas pipelines. Pet. Sci. 2019, 16, 1479–1492. [Google Scholar] [CrossRef] [Green Version]
- Yang, T.; Hung, C.-C. Multiple-attribute decision making methods for plant layout design problem. Robot. Comput-Integr. Manuf. 2007, 23, 126–137. [Google Scholar] [CrossRef]
- Yang, T.; Chou, P. Solving a multiresponse simulation-optimization problem with discrete variables using a multiple-attribute decision-making method. Math. Comput. Simul. 2005, 68, 9–21. [Google Scholar] [CrossRef]
- Kuo, Y.; Yang, T.; Cho, C.; Tseng, Y.-C. Using simulation and multi-criteria methods to provide robust solutions to dispatching problems in a flow shop with multiple processors. Math. Comput. Simul. 2008, 78, 40–56. [Google Scholar] [CrossRef]
- İç, Y.T.; Şaşmaz, T.; Yurdakul, M.; Dengiz, B. Analysis of the manufacturing flexibility parameters with effective performance metrics: A new interactive approach based on modified TOPSIS-Taguchi method. Int. J. Interact. Des. Manuf. 2022, 16, 197–225. [Google Scholar] [CrossRef]
- MacKerron, G.; Kumar, M.; Kumar, V.; Esain, A. Supplier replenishment policy using e-Kanban: A framework for successful implementation. Prod. Plan. Control. 2014, 25, 161–175. [Google Scholar] [CrossRef]
- Buzacott, J.A.; Mandelbaum, M. Flexibility in manufacturing and services: Achievements, insights and challenges. Flex Serv. Manuf. J. 2008, 20, 13. [Google Scholar] [CrossRef]
- Salkin, C.; Oner, M.; Ustundag, A.; Cevikcan, E. A conceptual framework for Industry 4.0. In Industry 4.0: Managing the Digital Transformation; Springer: Cham, Switzerland, 2018; pp. 3–23. [Google Scholar]
- Reid, R.D.; Sanders, N.R. Operations Management; John Wiley & Sons: Hoboken, NJ, USA, 2007. [Google Scholar]
- Tong, L.I.; Su, C.-T. Optimizing multi-response problems in the Taguchi method by fuzzy multiple attribute decision making. Qual. Reliab. Eng. Int. 1997, 13, 25–34. [Google Scholar] [CrossRef]
- Sargent, R.G. Verification and validation of simulation models. J. Simul. 2013, 7, 12–24. [Google Scholar] [CrossRef] [Green Version]
- Liu, P.; Zhang, X. Research on the supplier selection of a supply chain based on entropy weight and improved ELECTRE-III method. Int. J. Prod. Res. 2011, 49, 637–646. [Google Scholar] [CrossRef]
Publisher’s Note: MDPI stays neutral with regard to jurisdictional claims in published maps and institutional affiliations. |
© 2022 by the authors. Licensee MDPI, Basel, Switzerland. This article is an open access article distributed under the terms and conditions of the Creative Commons Attribution (CC BY) license (https://creativecommons.org/licenses/by/4.0/).