Article

The Perceived Restorative Quality of Viewing Various Types of Urban and Rural Scenes: Based on Psychological and Physiological Responses

1
School of Architecture and Urban Planning, Suzhou University of Science and Technology, Suzhou 215000, China
2
School of Education, Suzhou University of Science and Technology, Suzhou 215000, China
*
Author to whom correspondence should be addressed.
Sustainability 2022, 14(7), 3799; https://doi.org/10.3390/su14073799
Submission received: 19 February 2022 / Revised: 19 March 2022 / Accepted: 21 March 2022 / Published: 23 March 2022

Abstract

:
Attention restoration theory argues that the type of visual scene is important; however, related research is mostly based on a dichotomous comparison between natural and urban environments. Few studies have evaluated complex scenes comprising both natural and artificial elements. Therefore, we compared the differences between four types of environments: urban artificial scenes, urban natural scenes, rural artificial scenes, and rural natural scenes—using a survey based on the Perceived Restorativeness Scale (PRS), perception complexity scoring, and eye tracking. Participants (N = 119) viewed photographs in a random order. The results showed significant differences between the visual landscape scores and eye-tracking data for each type of visual image: PRS, perception complexity, average fixation duration, and mean pupil size. Rural natural scenes had a higher restoration effect than the other scenes. Waterscapes and well-maintained vegetation had positive correlations between the typical landscape element indices and restorative benefits in different scene types. Contrastingly, weeds and hardscapes showed negative correlations, which can be attributed to the maintenance of these typical elements. The harmony of elements with circumstances in a scene was a key factor. The results provide a reference for urban and rural landscape planning and design to improve perceived restorative quality.

1. Introduction

The typical urban environment in modern society, which includes excessive stimulation caused by advertising information, tense and crowded traffic scenes, and computer-oriented workplaces, is likely to divert the voluntary attention of urban residents. Consequently, this increases the demand for mental resources to control attention, which leads to mental fatigue in urban residents and results in distraction, impulsivity, irritability, incivility, and so forth [1]. Attention restoration theory (ART) posits that, when directed attention becomes fatigued, the natural scene can provide certain characteristics that help restore attention resources and eliminate mental fatigue [2,3,4,5,6]. Studies have confirmed that, compared to top-down voluntary attention consumption in urban scenes, natural scenes can help avoid the fatigue caused by voluntary attention through bottom-up involuntary attention [1,5].
To evaluate the visual environment that can provide attention recovery, Hartig et al. (1996) originally developed the Perceived Restorativeness Scale (PRS) based on ART, which includes four subscales: being away, fascination, coherence, and compatibility [6]. The PRS has been continuously expanded and revised over the last 30 years [7,8,9] and has been widely used in the restoration assessment of visual landscape environments. In previous studies, visual landscape-based environmental stimuli were presented in various ways, such as on photographic slides [9,10,11,12,13,14], two-dimensional movies [15], and real scenes [16,17,18]. Additionally, visual scene preference has been the focus of research related to attention recovery. These studies demonstrated the importance of structural features in the physical environment in attention recovery assessment, such as specific attributes, the scale of the scene, the proportion of plants, and the openness of the scene [19,20,21]. Previous research has also demonstrated that the degree to which a scene is regarded as “natural” is the most important predictor of landscape preference [22]; thus, the most important factor is the difference between the preferences for natural or man-made environments [2,13,23]. The consensus among respondents is that, compared with artificial landscapes, natural landscapes are more conducive to attention recovery [2,15,24,25,26]. On the other hand, Mikel et al. (2021) found that urban squares with greenness also decreased some negative affective indicators and contributed to attention restoration [27].
In addition to subjective evaluation, the content of the visual scene that affects attention recovery, as well as the acquisition and processing of this information, has been confirmed to be important in many studies. Kaplan and Kaplan proposed four main prediction fields for visual landscape exploration: physical attributes (e.g., relief, edge contrast, spatial diversity, and naturalism), land cover types (e.g., lawn, hardscape), informational variables (e.g., understanding, coherence, order, and legibility), and perception-based variables (e.g., openness, smoothness, and locomotion) [2]. Berman et al. (2014) and Kardan et al. (2015) explored the visual characteristics of perception of naturalness of natural and artificial scenes and revealed the visual characteristics that are related to individuals’ perceptions of naturalness in images, such as color (e.g., hue and saturation), brightness and structure (e.g., entropy and edge density), and visual landscape features [28,29].
Complexity is an important factor that reveals the characteristics of scene information and is defined as the richness or diversity of a setting [2]. Previous research suggests that high-complexity environmental stimuli increase participants’ information processing ability, thereby slowing or hindering stress recovery; thus, natural scenes are more restorative than urban scenes [30]. Current research has noted the important role of landscape complexity in explaining environmental restoration effects and landscape preferences. Pazhouhanfar and Kamal employed complexity as an important predictor for interpreting perceived restorative potential, demonstrating the positive impact of complexity on evaluating the restorative effect of landscape scenes [31]. Moreover, Huang analyzed the relationship between complexity and visual landscape preference and concluded that the fractal dimension was negatively correlated with landscape preference [32]. Franěk et al. also studied the relationship between the fractal dimension in natural images and eye movement activities and revealed that the natural scene had high fractal complexity and reduced cognitive demand [33]. Liu et al. (2022) found that eye movement difference among different complexity levels differed in varying settings, and complexity level of the landscape was significantly correlated with eye movement metrics [34].
Eye movements reflect the patterns of visual exploration when viewing a scene [35]. To this end, ART posits that different landscape scenes (restorative or nonrestorative) can attract different types of attention [2,3]. Therefore, restoration of a landscape scene can be evaluated by measuring eye movements. In previous landscape scene studies that combined environmental psychology and landscape design, free viewing was used as a normal operation for the participants without a goal-oriented mechanism [19]. Comparing eye movements between natural and urban scenes has been a commonly used experimental design in previous studies [1,32,36,37,38,39]. In such experiments, landscape scenes were presented to participants not only by viewing real scenes [40,41,42], but also through photo slides [1,11,32,36,39,43,44], silent virtual images, or videos [45,46].
The eye-tracking data of some studies have shown that different attention and cognitive processes in image perception occur when different landscape scenes are viewed. The indicators commonly used to assess the environmental restorative and landscape preferences of landscape scenes include fixation duration, areas of interest (AOIs), and scan paths. Eye-tracking studies of participants viewing static landscape photographs have shown that landscape photos with low fascination have more fixation numbers and require greater exploration. Compared with low fascination photographs (e.g., urban scenes), high fascination photographs (e.g., natural scenes) have fewer fixation numbers, indicating less cognitive effort during viewing [11]. Nordh et al. (2013) evaluated the restorative components of small urban parks using eye tracking and found positive correlations between the restoration scores for landscape scenes and the stay time of the natural component AOIs; however, no significant difference in the number of fixations or whether the park environment was restorative was found [19]. Amati et al. (2018) explored the relationship between the dwell time and AOIs of park landscape elements by analyzing the eye-tracking data of dynamic stimuli (e.g., park videos) and found participants significantly directed their attention to artificial objects [46]. In the context of restorative environmental studies, pupil dilatation measurements are often used to assess landscape scenes. Recent studies showed that, when viewing photos of scenes with high recovery potential, participants’ mean pupil size was larger compared to the scenes with low recovery potential [38]. Liu et al. (2022) evaluated the restorative benefits of urban green space using eye tracking combined with PRS, and found partially open green spaces with higher naturalness had more restorative benefit. In contrast, buildings and paving had a negative effect on environmental restoration benefits [47].
Several studies have confirmed the close connection between visual landscape scenes and the attention recovery effect from the perspective of psychological measurement (e.g., the PRS) or recovery experience (e.g., preference) evaluation. However, most research focused on the dichotomy between nature and urban environments [1] rather than evaluating combined environments, such as green spaces in urban scenes or residences in rural areas. Moreover, ART holds that the natural environment positively affects the recovery of attention resources and eliminates mental fatigue. In this context, an increasing number of researchers are exploring the visual content and preferences that affect attention recovery. To illustrate, eye tracking, psychological measurements, and visual scene information analysis are often used to compare the differences in voluntary attention recovery between urban and natural environments. These studies provide limited guidance when designing a natural–artificial mixed scene. Therefore, the relationship between the components of the visual landscape environment components and the characteristics of the restoration experience through eye movement research should be better understood.
In this study, we extended previous research on the restoration of the environment, mainly focusing on the component effects of the visual landscape environment and evaluating the perceived restorative quality of various visual scenes through perceptual feature measurements and eye movement tracking. The purpose of our research was to (1) evaluate the attention recovery effect of four types of scenes (e.g., urban artificial, urban natural, rural artificial, and rural natural scenes) through participants’ free bottom-up viewing, and (2) assess the relevance of the PRS and typical landscape element indices for the four scene types while viewing photographs of various types of scenes.

2. Materials and Methods

2.1. Study Sample and Photographic Stimuli

The research sample photographs were taken in Suzhou, Jiangsu Province, and they represent the most common urban and rural landscape scenes in southeastern China. Suzhou has an agricultural production history of more than 5000 years, with rural landscapes that include paddy fields and farms representative of regional characteristics, while urban landscapes are dominated by low-rise residential and commercial buildings. Over the past four decades, the urban landscape of Suzhou has undergone tremendous changes and it is now teeming with parks, skyscrapers, and automobiles. To include as many of the four scene types as possible, we took 3689 photos of the cities and villages of Suzhou from 23 sample areas.
The weather and seasonal conditions of the photographs affect the viewing effect in eye-tracking experiments. For example, excessive contrast between the colors and bright-ness in the photographs will lead to incorrect visual attraction, although these elements are considered trivial for increasing attention [48]. To reduce the influence of weather, season, and equipment, all photographs were taken in the same season (from September to October 2019), on cloudy days without direct sunlight, and using the same camera (Canon EOS-M3). The viewpoint height on the horizontal line of sight was 1.60 m by eye level, and the same focal length was used when taking the photographs.
At the end of the photo shoot, a series of colored photographs was selected by five experts as the experimental stimuli. These experts had at least 10 years of experience in related fields: three of them engaged in landscape design, one in rural planning, and one in environmental psychology research. Initially, according to the classification of urban and rural scenes, all experts selected photographs that represented the characteristics of the cities and villages on a computer; those that failed to be selected by more than three of the experts were excluded. Next, photographs with non-measured elements, such as unique buildings, unusual plants, and animals (e.g., fine pruned pine, public art structure), that may interfere with the eye movement experiments were excluded. Finally, 48 experimental stimulation photographs were confirmed by five experts, each of which had a resolution of 1024 × 683 pixels. According to the landscape features, these photographs were classified into four types (Figure 1a–d): urban artificial scenes (the total proportion of urban artificial landscape elements, such as skyscrapers, houses, and concrete roads, was 59%), urban natural scenes (the total proportion of urban natural landscape elements, such as park waterscapes, lawns, and greenways, was 63%), rural artificial scenes (the total proportion of rural artificial landscape elements, such as manor houses and rural roads, was 35%), and rural natural scenes (the total proportion of rural natural landscape elements, such as shelterbelts, soil, and weeds, was 71%).

2.2. Participants

We recruited 119 healthy college students to participate in this study through cam-pus announcements and social platforms (Tencent Mobile QQ and WeChat; 93 women and 26 men; aged 17–28 years [49,50,51] (M = 19.79, SD = 1.90) (Table 1), compensated with approximately USD 4.5 (CNY 30), and we strictly guaranteed the anonymity and confidentiality of the participation. Previous studies have shown that gender does not play an important role in eye movement characteristics and psychological results [42]. Thus, the difference in the number of male and female participants should not influence the validity of the present results. Participants provided brief demographic information, such as age, health status, and ethnicity. All were of Han nationality and lived in southeastern China, and none had any visual impairments (uncorrected visual acuity ≥ 0.8) or problems that might affect eye tracking. All participants were informed that they could withdraw from the experiment at any time. The research procedures were approved by the university ethics committee (no. 190703). Using the statistical program G*Power 3.1, we estimated that a minimum sample size of 96 (non-centrality parameter (λ) = 11.76, critical F = 2.70) was necessary to predict a medium–large-sized effect (f = 0.35), given α = 0.05, power (1-β err prob) = 0.8, and four groups. Our sample of 119 was sufficiently powered, with actual power always greater than 0.8.

2.3. Apparatus

The EyeLink reflective eye tracker (EyeLink 1000 Plus) was used to record eye movements. It was equipped with a test mainframe computer (Dell Precision T3400) with a screen size of 15.6 inches (a screen resolution of 1088 × 612 pixels) and a Windows XP operating system, a stimulus image display computer (Dell Optiplex 760) with a screen size of 22 inches (a screen resolution of 1280 × 1024 pixels), and two sets of infrared light sources and cameras (1000 Hz) installed as described below.

2.4. Measurement

2.4.1. Measuring Eye Movements

The eye-tracking variables were set per the average fixation duration and mean pupil size. These variables provided information about the main observation patterns, such as the degree of attention given to stimulation, recovery potential, and concentration. Moreover, these indicators have been used in many visual image research works [11,19,39]; thus, they had sufficient validity for evaluating the perception of various types of visual scenes.

2.4.2. Environmental Assessment Questionnaire

The eye-tracking experiment can measure the changes in eye trajectories when viewing pictures, but it cannot distinguish between subjective recovery perceptions. However, the PRS has been widely used to evaluate environmental restoration quality [7,8,9,52]. To improve the efficiency of the questionnaire, we replaced the PRS of 26 items with the PRS short version of five subscales (i.e., being away, fascination, coherence, scope, and compatibility) and a 5-point Likert scale (1 = not at all, 5 = very much), which was tested in a previous experiment [36]. Complexity is also an important indicator for evaluating the quality of environmental restoration quality [31,32,34]. To this end, participants scored the complexity of each photograph stimulated by the experiment using a 5-point Likert scale (0 = not at all, 5 = very complex).

2.5. Image Analysis Index

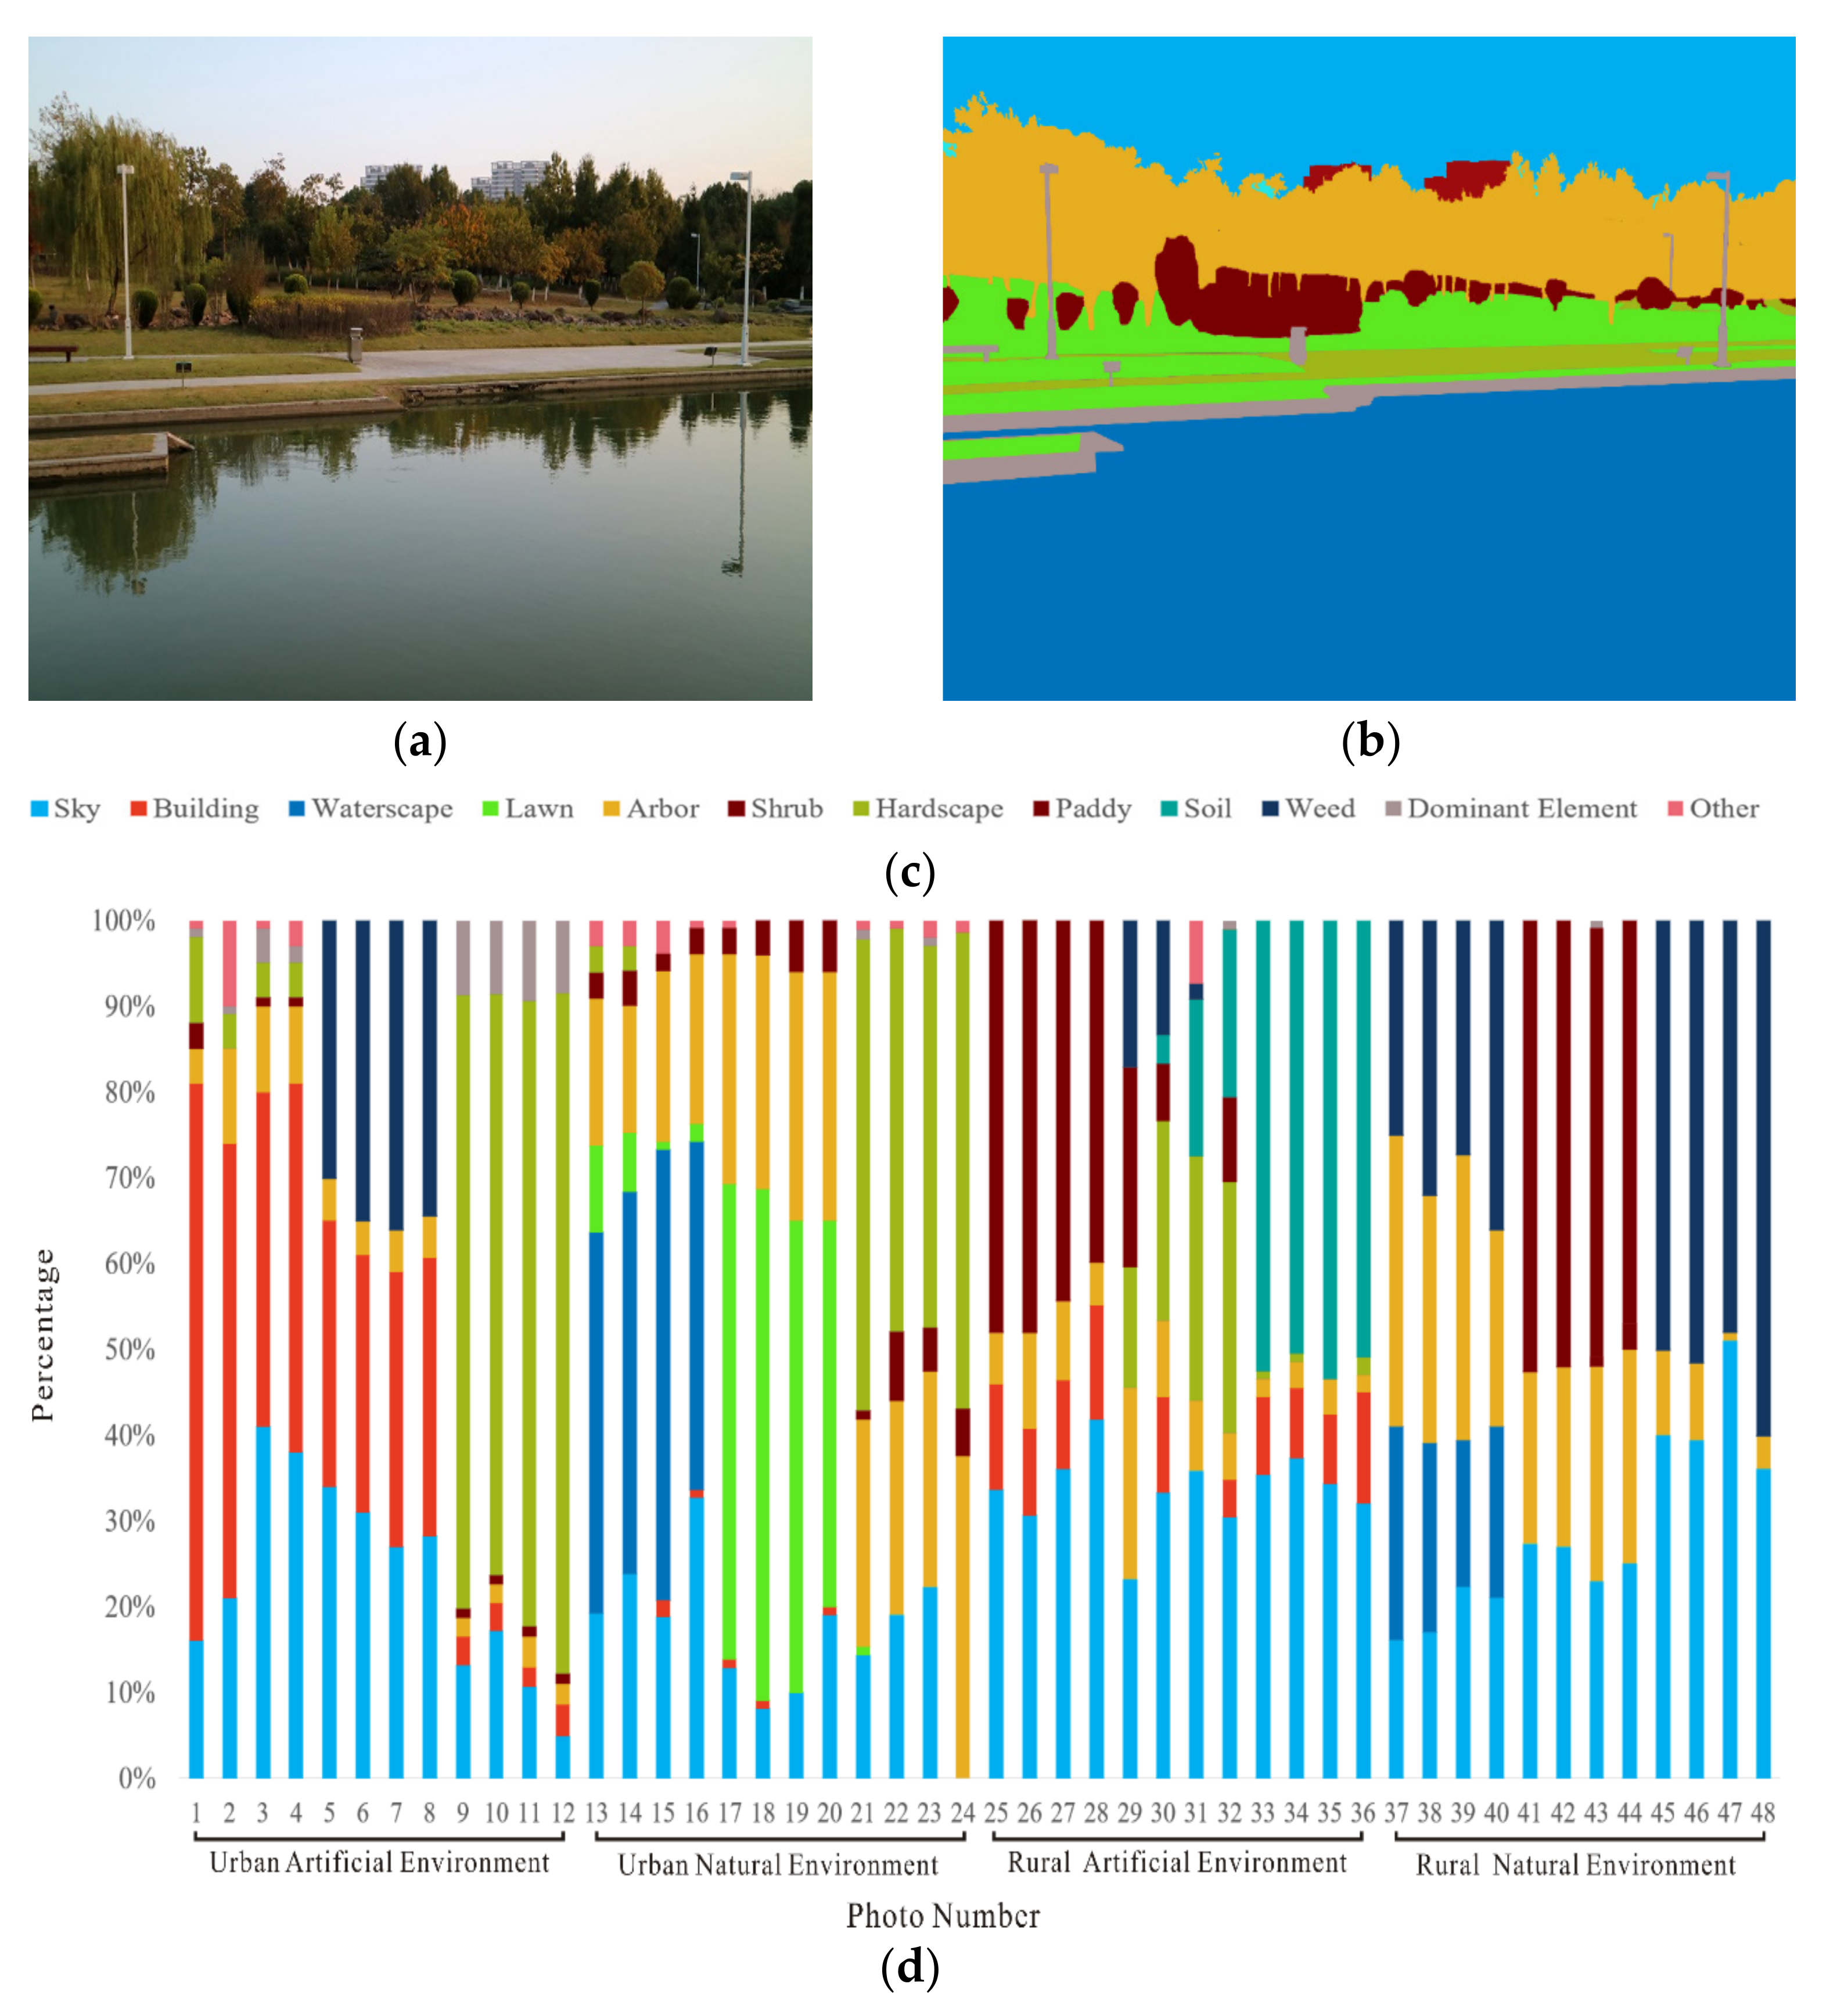
Many studies have quantified the landscape elements of experimental photographic stimuli to distinguish the differences between landscape elements in these four scene types [19,53]. Adobe PhotoShop CS6 was used to label landscape elements by coloring each photograph (Figure 2a–c); hereafter, the quantitative landscape element indices were calculated (i.e., the percentage of each landscape element area in the photograph). The formula was as follows:
Landscape element index = (Number of landscape element pixels)/(Total pixels) × 100%
In this formula, the number of landscape element pixels represents the area occupied by typical landscape elements in the four scene types, including the sky, buildings, waterscapes, and shrubs. Typical visually dominant environmental elements that can attract attention were also included, such as billboards, streetlamps, and cars [54], and the total number of pixels represents the entire area of each photograph. Areas c and d in Figure 2 show the percentage of typical landscape elements for each photograph of the four scene types.

2.6. Procedure

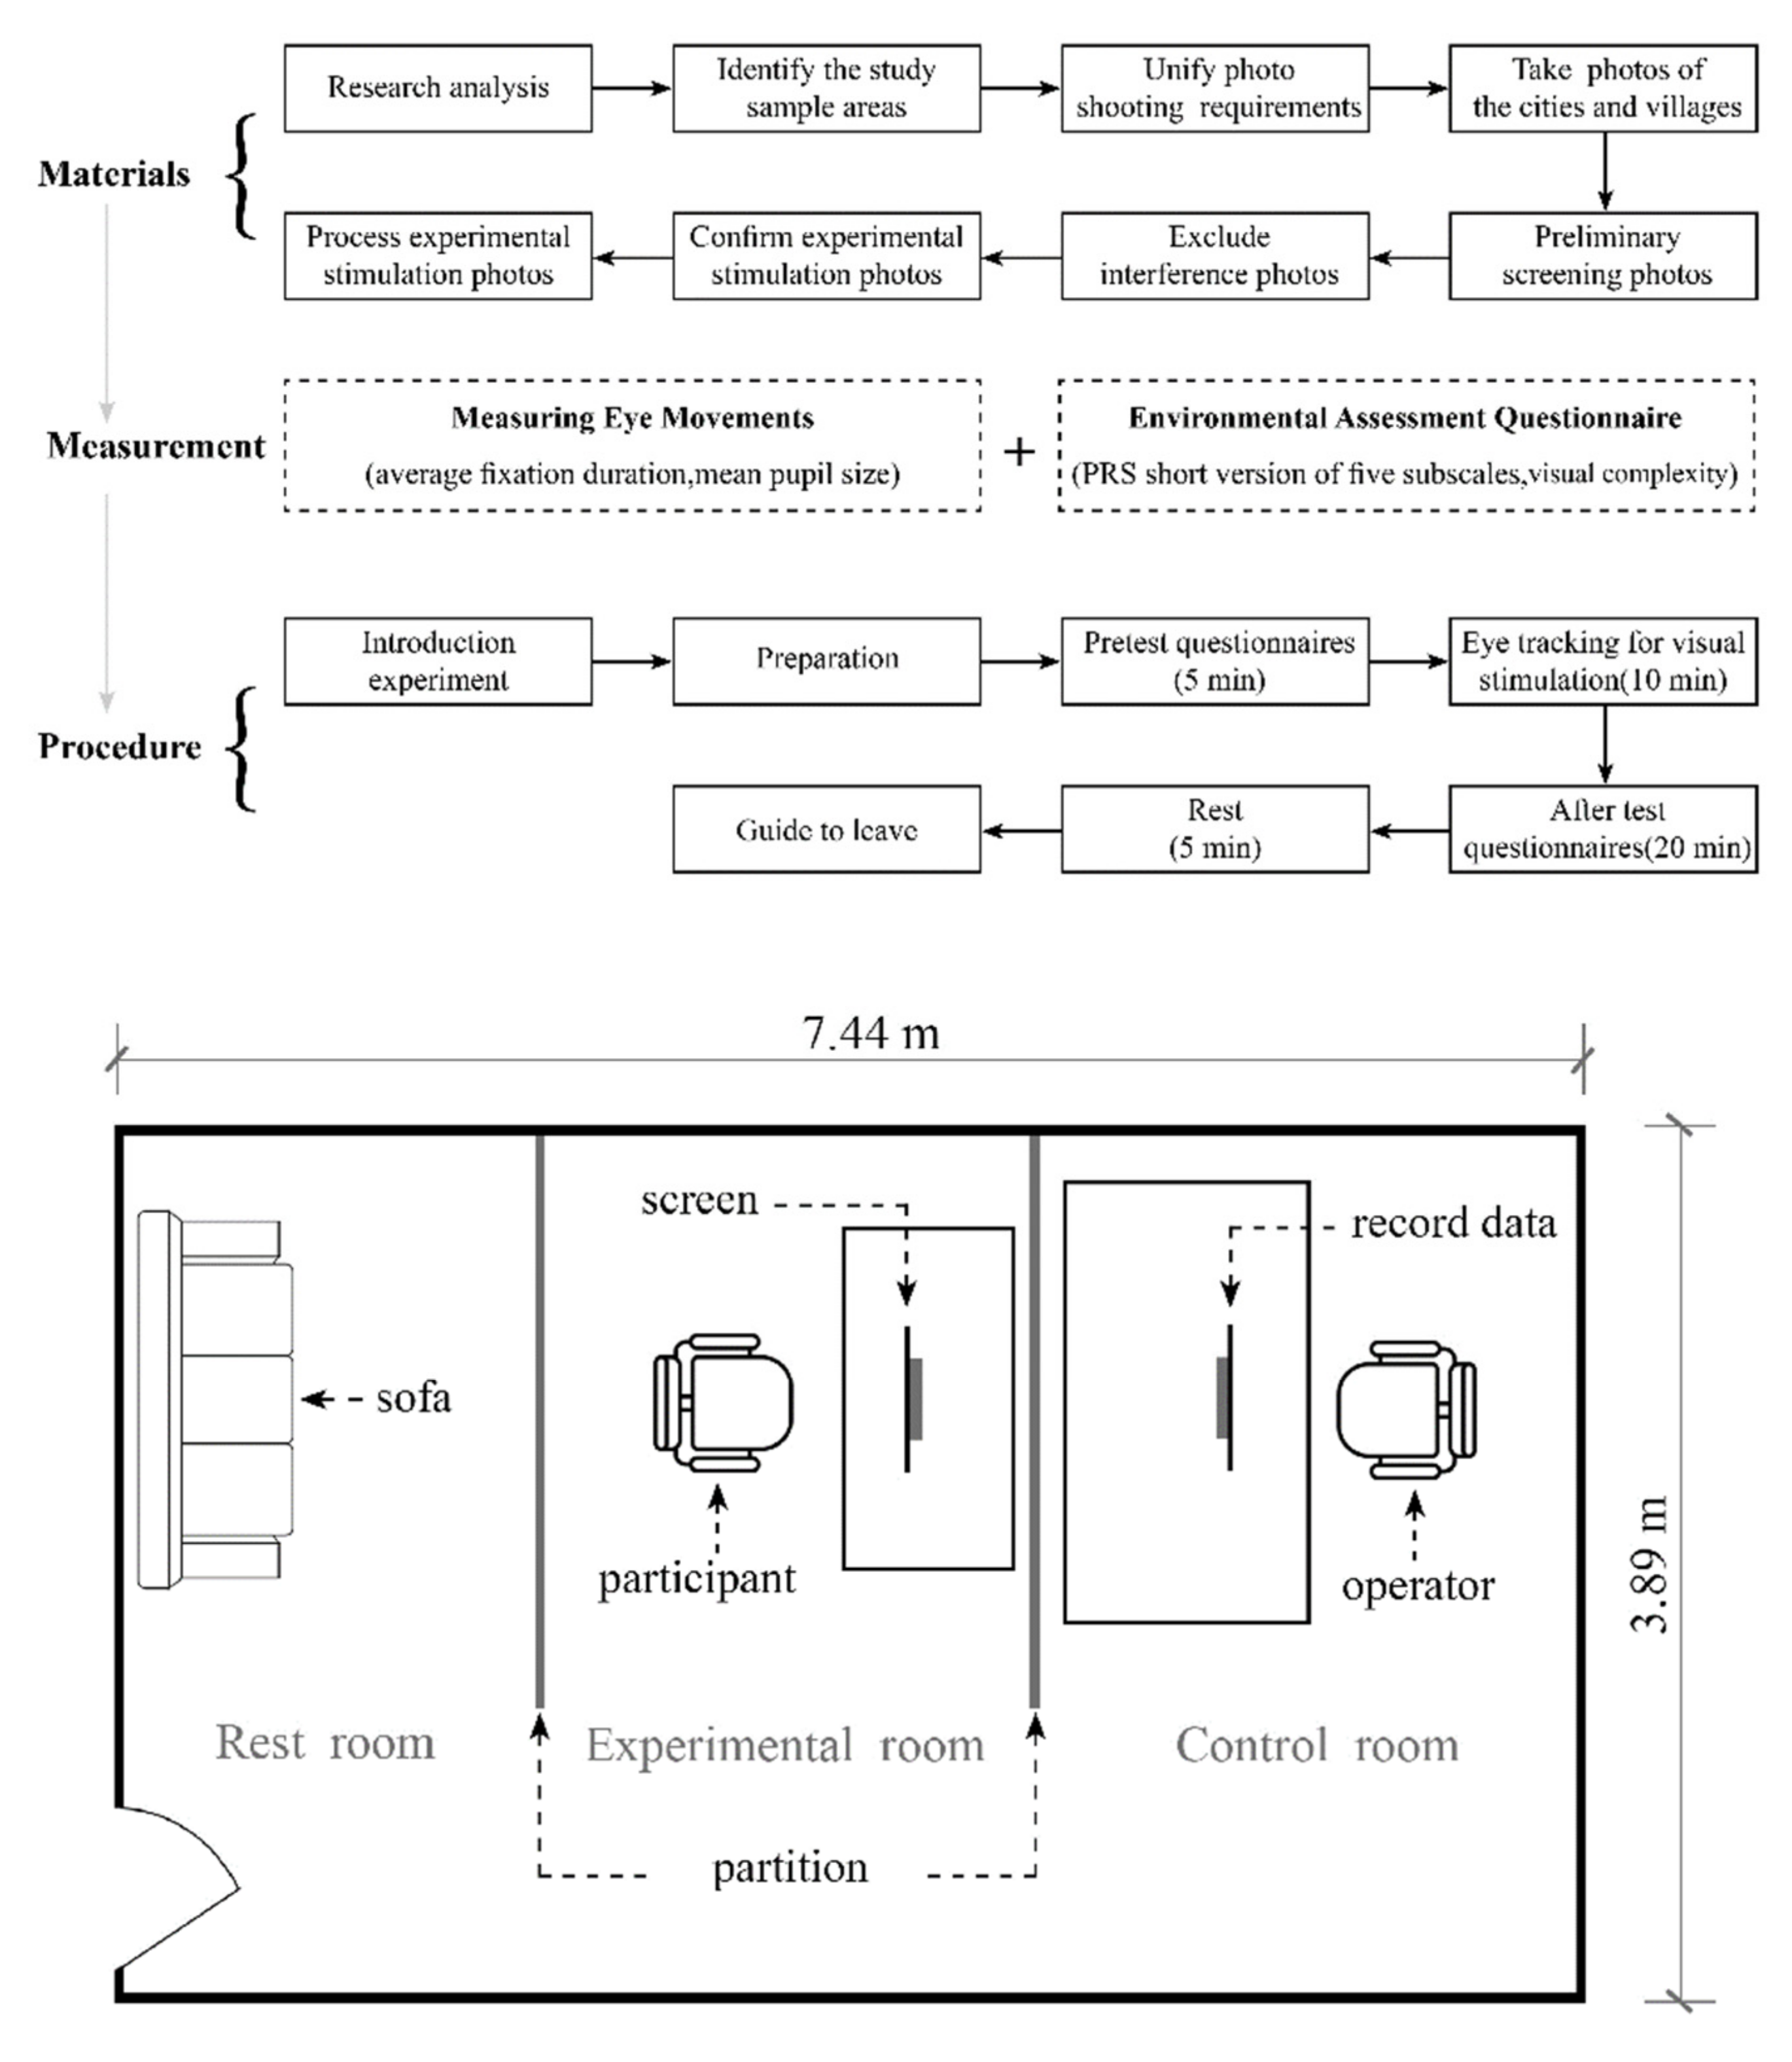
As shown in Figure 3, participants arrived in the waiting room beside the laboratory and were asked to read a brief introduction. To avoid any experimental effects, the re-searchers introduced the eye movement experiment procedure but did not provide details concerning the purpose of the experiment. Participants were taken to the eye-tracking laboratory after signing the experimental consent form and providing brief demographic information. The laboratory was a quiet room where the temperature (25 °C) and light conditions remained unchanged. Before each eye-tracking experiment, the participants placed their chin on the chin holder at 500 mm from the monitor and kept it in place. Eye movements were calibrated by repeated measurements of the participants’ eyes by infrared light reflection. Tracking of the collected data and provision of information regarding the experimental procedures and precautions were conducted through the display screen. The 48 experimental photographs were displayed in a slideshow, which was presented randomly using the Labview 5.1 (National Instruments Corporation; Austin, TX, USA) programing language. To avoid straining the participants’ eyes with eye-tracking experiments, the length of time that each photo was displayed on the computer screen was 10 s. After the eye-tracking experiment was completed, the participants were asked to evaluate each photograph (visual complexity + one of the five PRS subscales) on another computer. To prevent sequential effects, each photograph was randomly presented on the slide. Finally, the participants were asked to rest for 5 min to eliminate the influence of the experiment and were then paid CNY 30 (approximately USD 4.5). The entire experimental process lasted approximately 40 min.

2.7. Data Analysis

Repeated measures analysis of variance, followed by Bonferroni post hoc tests (the between-participants factor was the four environmental categories, and the within-participants factors were the mean scores for the images in each category), was used to analyze the PRS, perceptual complexity, and eye movement data (i.e., average fixation duration, total fixation duration, number of fixations, and mean pupil size) for the four types of scenes. Simple linear regression analyses were performed to determine the relationships between the visual perception scores and landscape element indices for all scenes. Finally, simple linear regression analyses were run between the PRS, perception complexity, eye movement data, and typical landscape element indices for the four types of scenes to determine which element was pivotal. Significance was established at * p < 0.05 and ** p < 0.01. The effect size is low if the value of η2 varies around 0.01, medium if η2 varies around 0.06, and large if η2 varies more than 0.14. All data are shown as mean ± SD. Statistical analyses were performed using SPSS Statistics 26.0 (SPSS; IBM, Armonk, NY, USA).

3. Results

3.1. PRS

Analysis of the PRS scores revealed a significant main effect of scene type (i.e., urban artificial scene (UAS), urban natural scene (UNS), rural artificial scene (RAS), and rural natural scene (RNS); N = 119). As shown in Table 2, for the being away subscale, a significant main effect was revealed. Pairwise comparisons for the main effect showed lower scores for the UAS (95% CI (2.61; 3.21)) compared to the RNS (95% CI (3.89; 4.57)), UNS (95% CI (3.67; 4.20)), and RAS (95% CI (3.96; 4.62)). That is, the UAS obtained the lowest score on this subscale. For the fascination subscale, a significant main effect was revealed. Pairwise comparisons for the main effect showed lower UAS scores (95% CI (3.12; 3.80)) compared to the RNS (95% CI (3.82; 4.67)) and RAS (95% CI (3.43; 4.13)). For the coherence subscale, a significant main effect was revealed. Pairwise comparisons for the main effect showed higher scores for the RAS (95% CI (4.58; 5.25)) compared to the RNS (95% CI (3.73; 4.54)) and UNS (95% CI (3.73; 4.33)). Moreover, the score for the UNS was lower than that for the UAS (95% CI (4.31; 5.09)). For the compatibility subscale, a significant main effect was revealed. Pairwise comparisons for the main effect showed lower scores for the RAS (95% CI (3.26; 4.25)) compared to the UNS (95% CI (3.99; 4.98)). Additionally, the scope score showed no differences among the four types.

3.2. Perception Complexity

As shown in Table 2, the perception complexity results revealed a significant main effect among the four scene types (F(3,354) = 29.27, p < 0.01, ηp2 = 0.20, 1 − β = 1.00; N = 119). Pairwise comparisons for the main effect showed higher perception complexity for the RNS (3.96 ± 0.08, 95% CI (3.80; 4.11)) compared to the UNS (3.32 ± 0.07, p < 0.01, 95% CI (3.18; 3.45)) and RAS (3.74 ± 0.06, p < 0.01, 95% CI (3.62; 3.85)). The perception complexity for the UAS (3.94 ± 0.08, p < 0.01, 95% CI (3.80; 4.08)) was higher than that of the UNS (3.32 ± 0.07, p < 0.01, 95% CI (3.18; 3.45)) and RAS (3.74 ± 0.06, p < 0.01, 95% CI (3.62; 3.85)). Moreover, the perception complexity for the RAS (3.74 ± 0.06, 95% CI (3.62; 3.85)) was higher than that of the UNS (3.32 ± 0.07, p < 0.05, 95% CI (3.18; 3.45)).

3.3. Characteristics of Visual Perception

The average fixation duration revealed a significant main effect among the four scene types (F(3,354) = 16.62, p < 0.01, ηp2 = 0.12, 1 − β = 1.00; N = 119). Pairwise comparisons for the main effect showed longer average fixation duration for the RNS (384.55 ms ± 9.78 ms, 95% CI (365.90; 404.00)) compared to the RAS (359.89 ms ± 8.26 ms, p < 0.01, 95% CI (342.29; 373.79)), UNS (358.04 ms ± 7.92 ms, p < 0.01, 95% CI (343.46; 376.33)), and UAS (347.31 ms ± 7.53 ms, p < 0.01, 95% CI (332.34; 362.28); Figure 4).
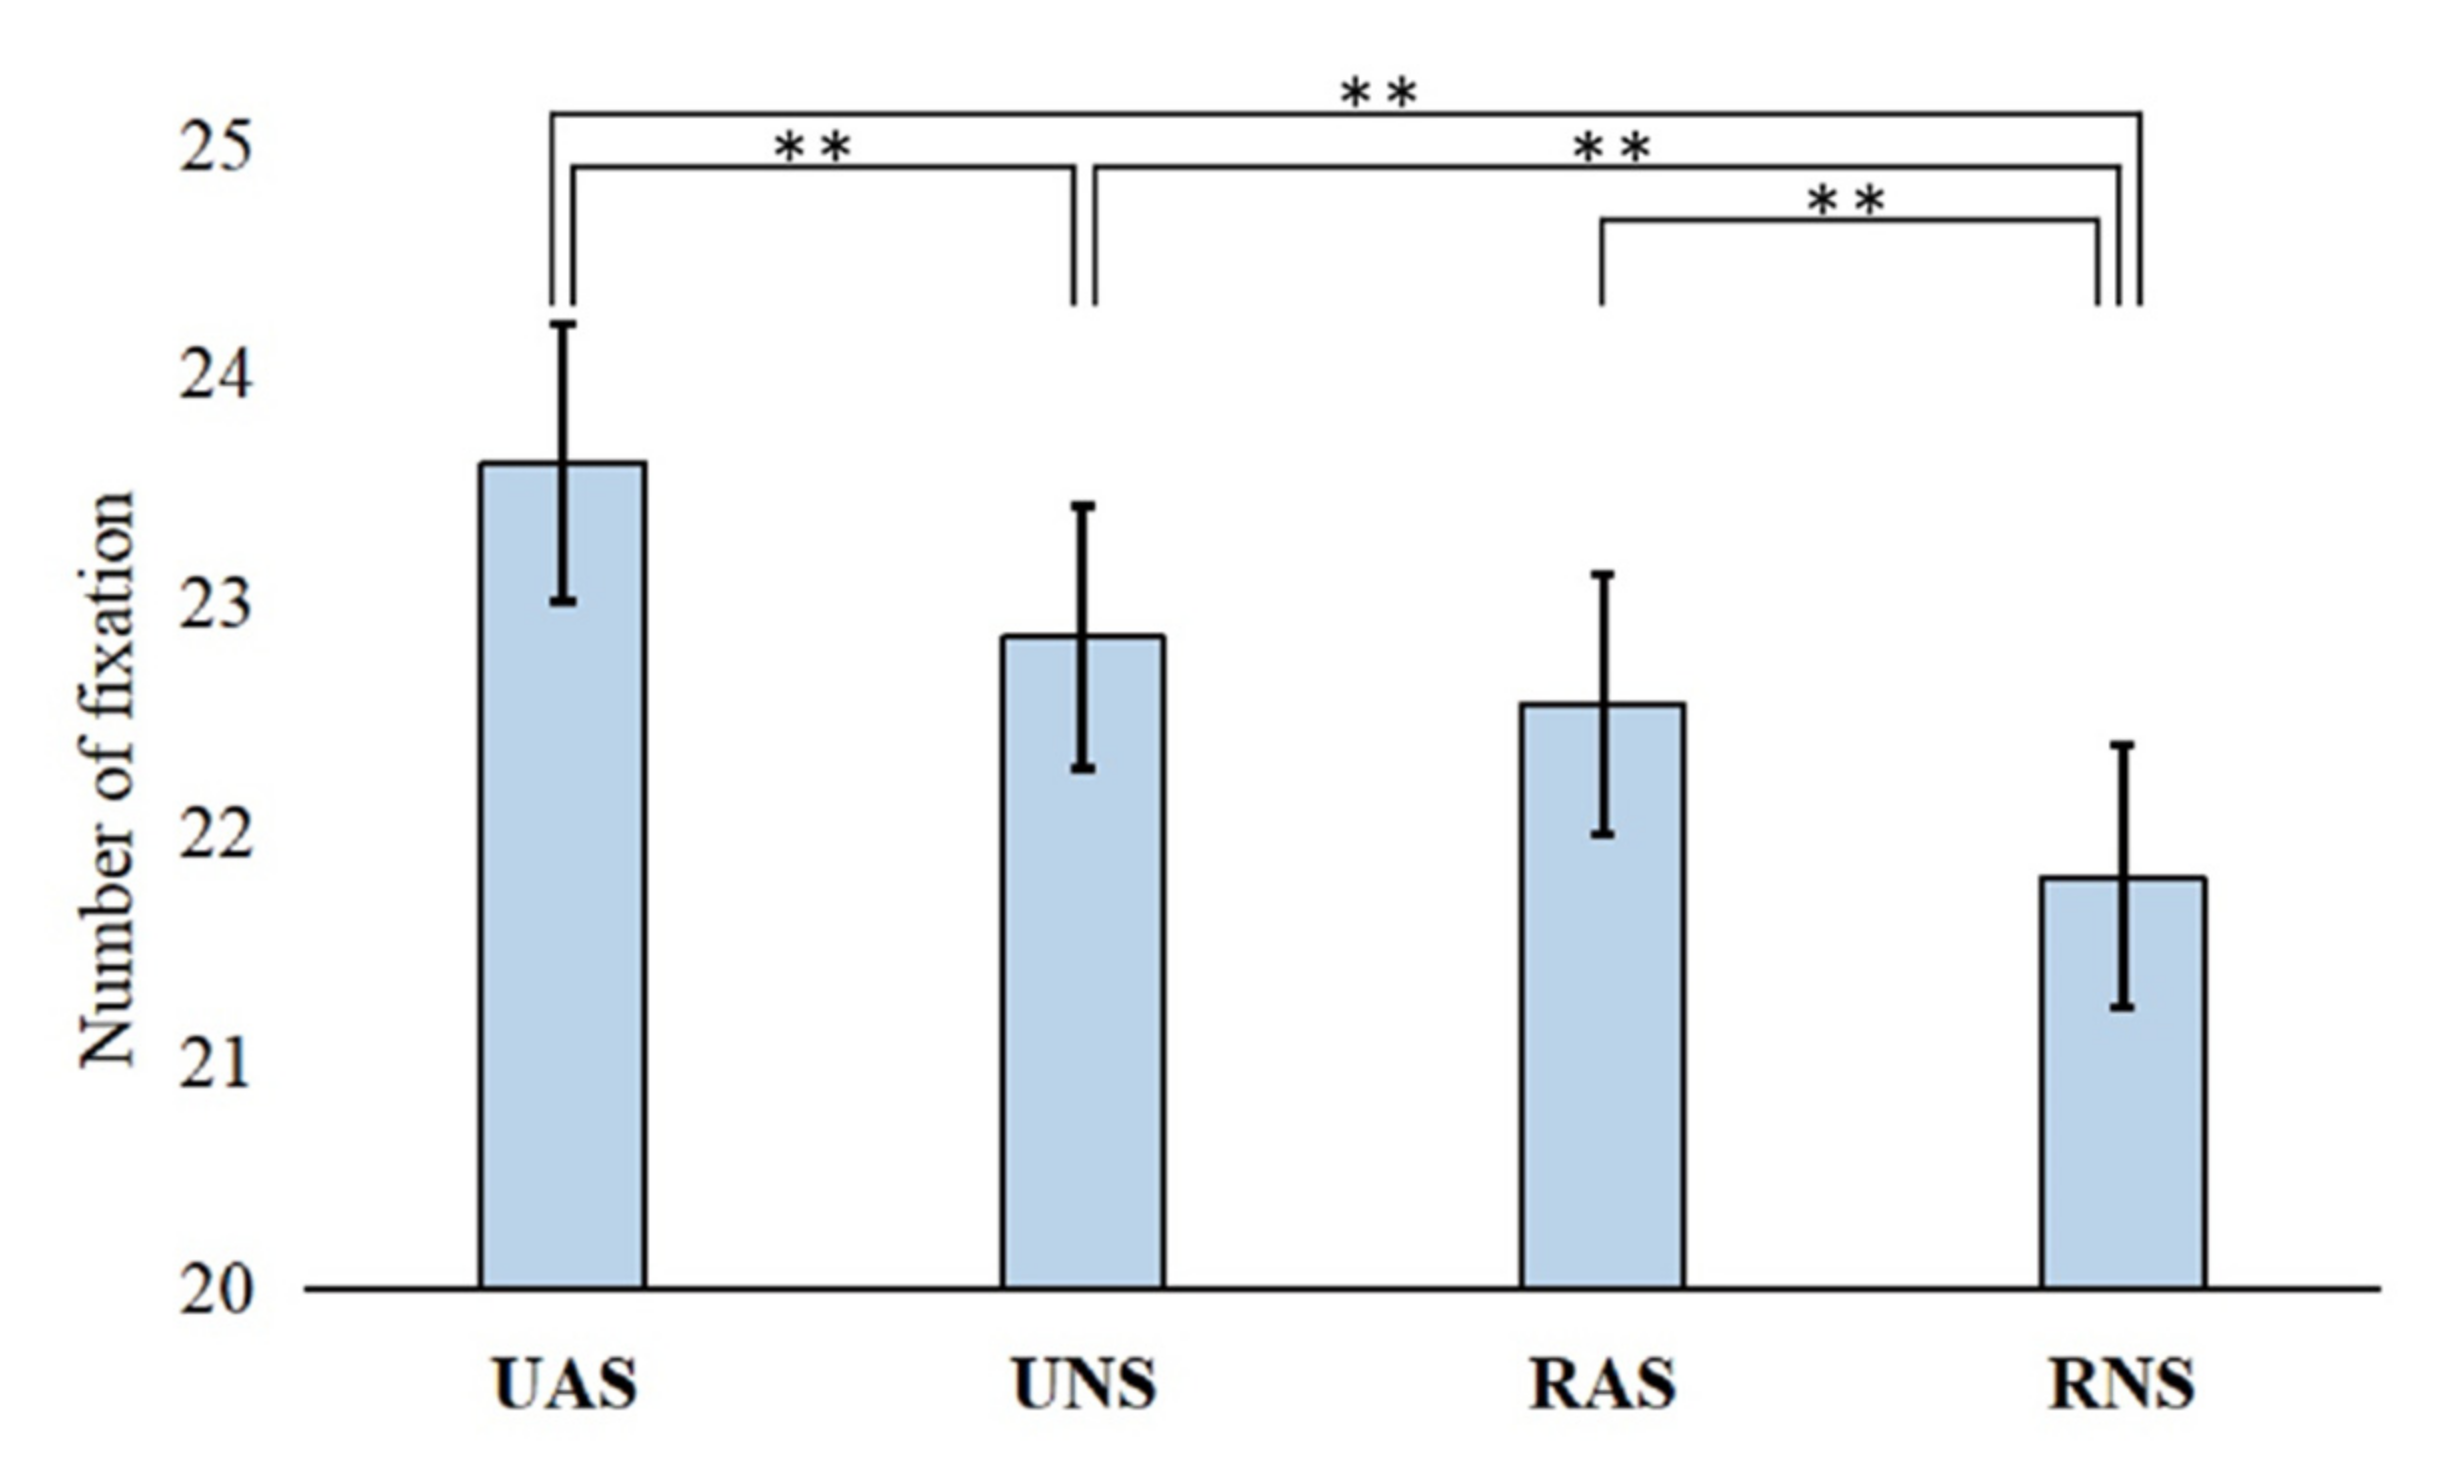
The number of fixations revealed a significant main effect among the four scene types (F(3,354) = 29.40, p < 0.01, ηp2 = 0.20, 1 − β = 1.00). Pairwise comparisons for the main effect showed a smaller number of fixations for the RNS (22.80 ± 0.58, 95% CI (20.66; 22.94)) compared to the RAS (22.55 ± 0.59, p < 0.01, 95% CI (21.71; 23.68)), UNS (22.85 ± 0.58, p < 0.01, 95% CI (21.43; 23.68)), and UAS (23.61 ± 0.60, p < 0.01, 95% CI (22.42; 24.80)). Moreover, the number of fixations for the UAS (23.61 ± 0.60, 95% CI (22.42; 24.80)) was larger than the RAS (22.55 ± 0.59, p < 0.01, 95% CI (21.71; 23.68)) and UNS (22.85 ± 0.58, p < 0.01, 95% CI (21.43; 23.68)) (Figure 5). Comparatively, total fixation duration showed no significant main effect among the four scene types.
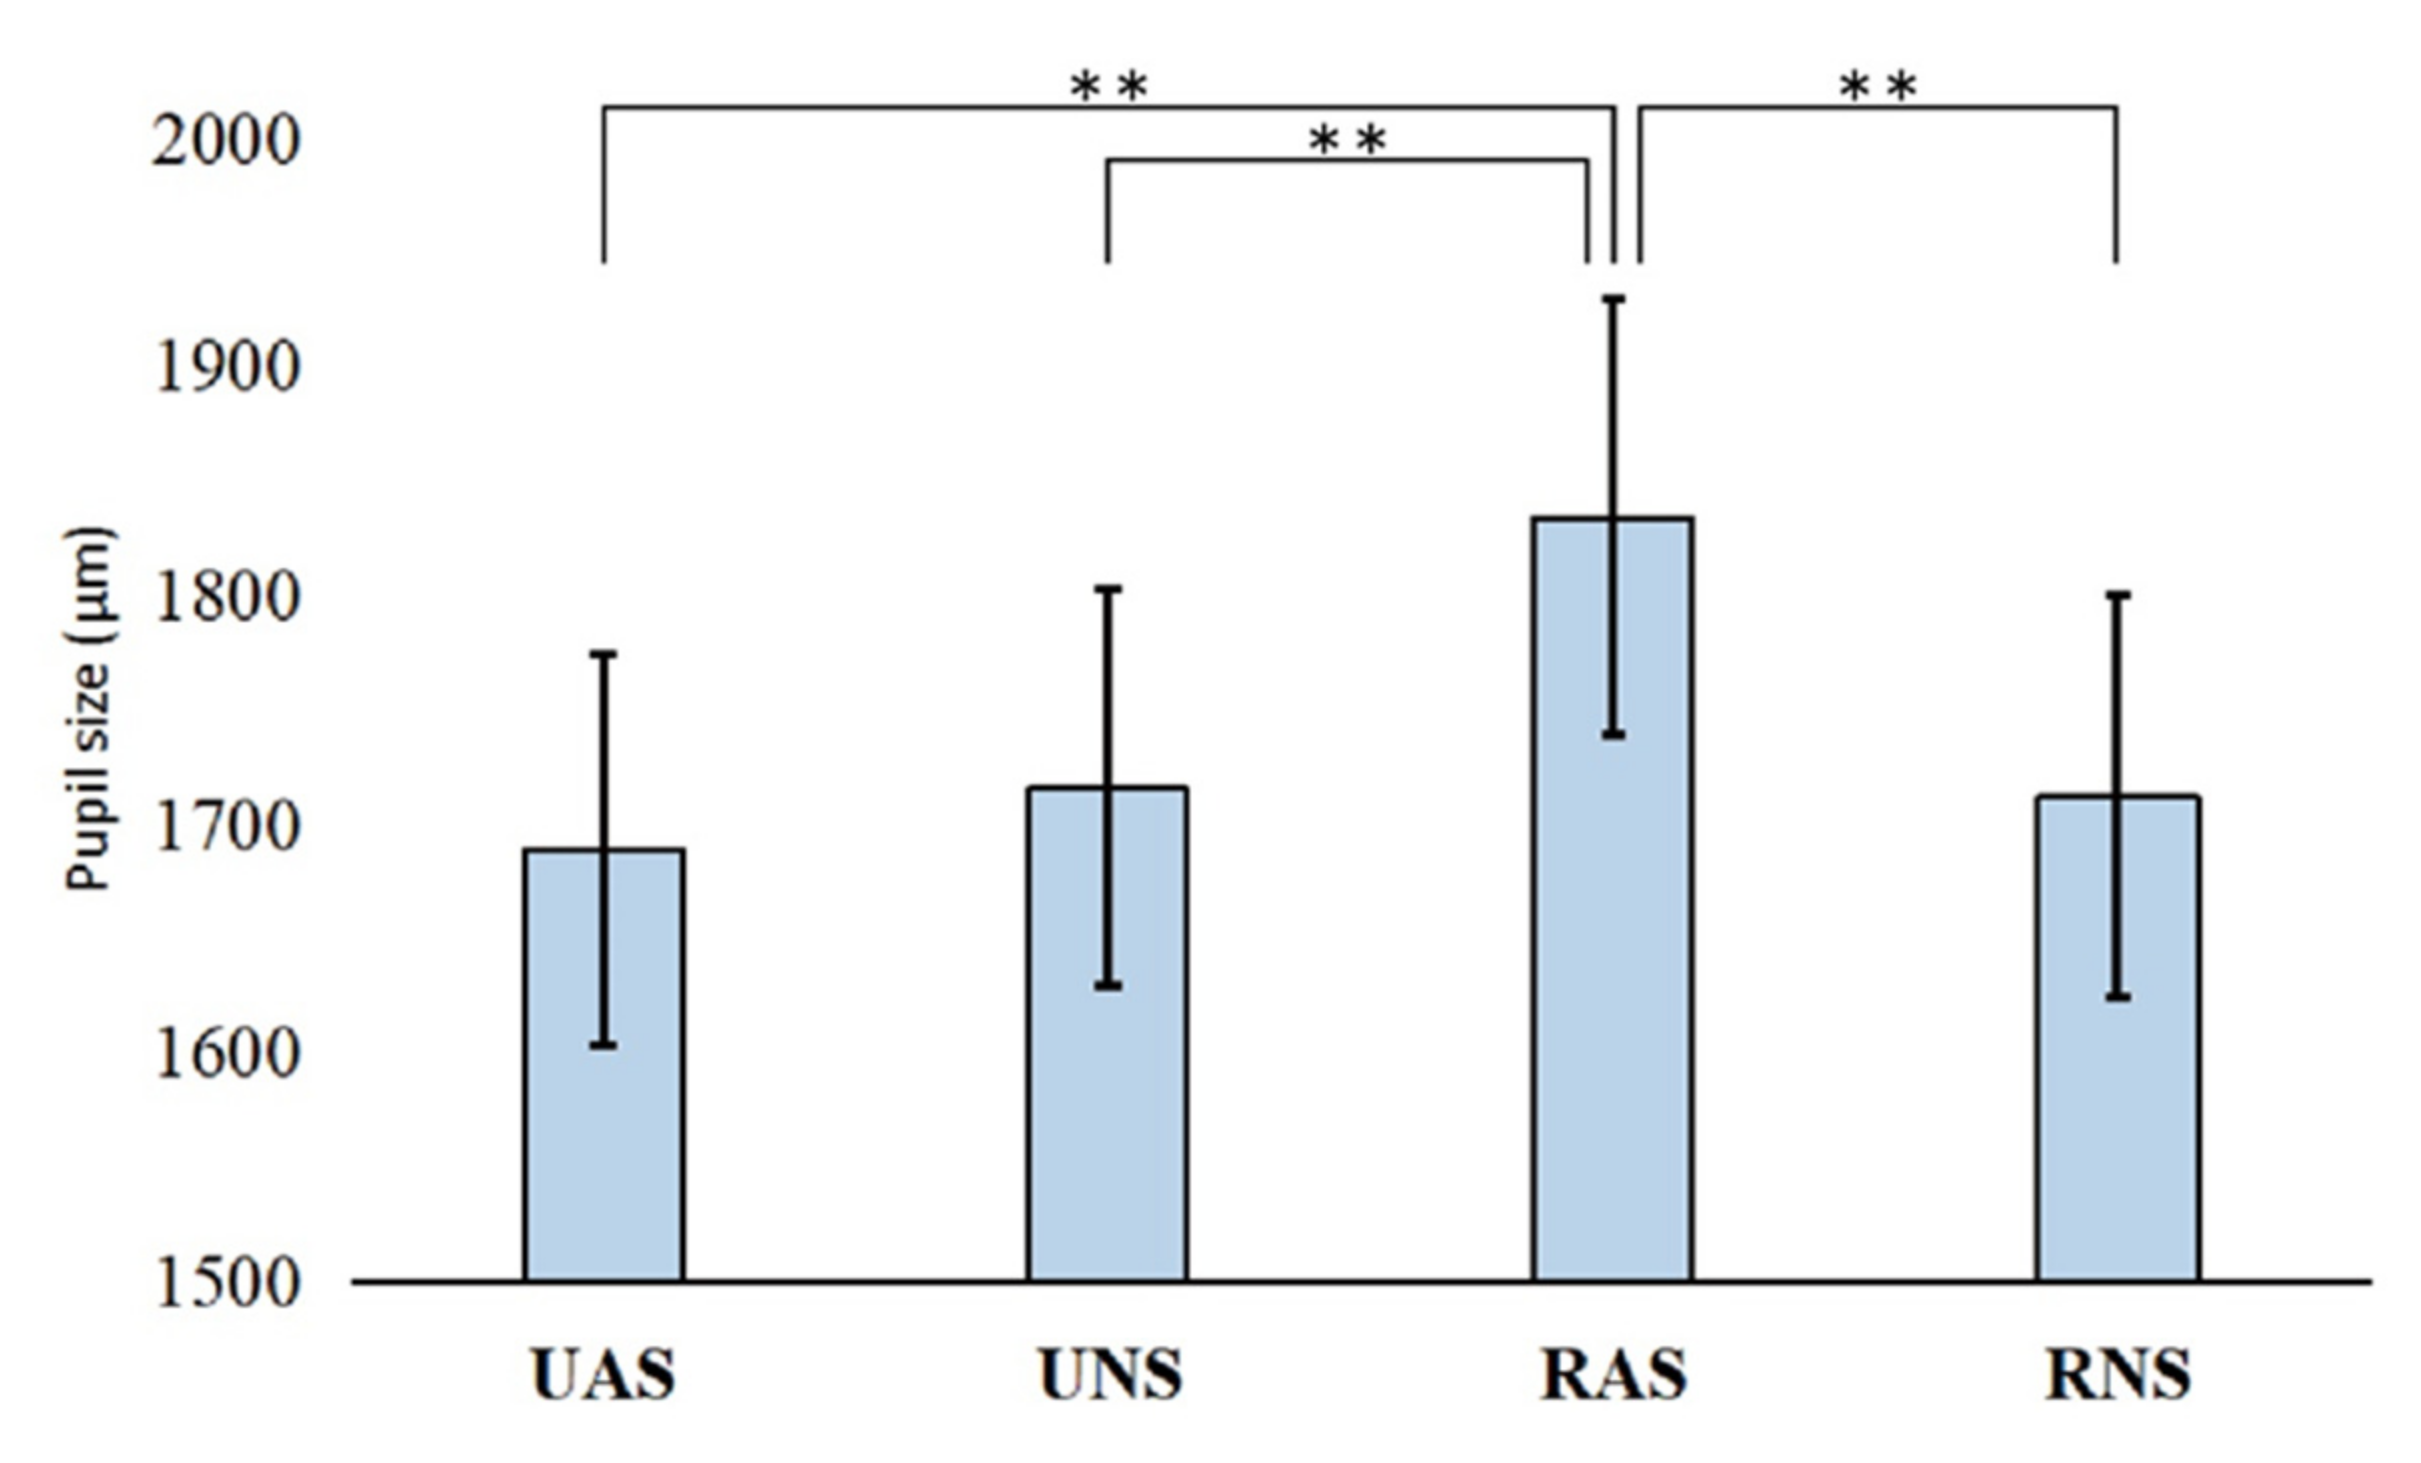
Pupil size revealed a significant main effect among the four scene types (F(3,354) = 28.34, p < 0.01, ηp2 = 1.94, 1 − β = 1.00). Pairwise comparisons for the main effect showed a bigger pupil size for the UNS (1833.55 μm ± 95.82 μm, 95% CI (1643.81; 2023.29)) compared to the RNS (1711.75 μm ± 88.45 μm, p < 0.01, 95% CI (1536.61; 1886.90)), RAS (1715.75 μm ± 87.10 μm, p < 0.01, 95% CI (1542.86; 1887.81)), and UAS (1688.46 μm ± 85.98 μm, p < 0.01, 95% CI (1518.19; 1858.73); Figure 6).

3.4. Relationship between Landscape Composition and PRS Score

As shown in Table 3, the regression analyses results for all scenes revealed associations between the PRS scores and the landscape element index when the landscape element index was measured as a percentage (N = 48). The score on the being away subscale was 0.004 + 0.40 (waterscape), meaning that the participants felt being away when the ratio of waterscapes increased. For the fascination subscale, the score was 3.58 + 2.66 (waterscape) + 1.45 (paddy), indicating that participants felt more fascination when the ratio of waterscapes and paddy increased. The coherence score was 4.70—1.95 (weed)—1.47 (soil), indicating that participants felt less coherence when the ratio of weeds and soil in-creased. For the compatibility subscale, the score was 4.42—2.67 (soil)—1.73 (weed)—1.16 (hardscape)—4.6 3 (shrub), indicating that participants felt less compatibility when the ratio of soil, weeds, hardscapes, and shrubs increased.
Furthermore, regression analyses for each type of scene showed the following: for the RNS (n = 12), the score of being away decreased when the ratio of weeds and sky of the whole scene increased, the fascination score increased when the ratio of arbor increased, the coherence score decreased when the ratio of weeds increased, and the compatibility score decreased when the ratio of weeds increased.
For RAS (n = 12), the score of being away decreased when the ratio of soil increased, the fascination score increased when the ratio of paddy and weeds increased, and the compatibility score decreased when the ratio of soil increased.
For the UNS (n = 12), the score of being away increased when the ratio of waterscapes and lawns increased, and the fascination score increased when the ratio of waterscapes increased. Contrastingly, the fascination score decreased when the ratio of weeds in-creased, and the coherence score increased when the ratio of hardscapes increased.
For the UAS (n = 12), the score of being away increased when the ratio of buildings increased, but decreased when the ratio of shrubs increased. Moreover, the fascination score decreased when the ratio of weeds and hardscapes increased, the scope score in-creased when the ratio of shrubs increased, and the compatibility score increased when the ratio of buildings increased.

3.5. Relationship between Landscape Composition and Visual Perception

As shown in Table 4, the regression analyses results included all scenes that revealed associations between visual perception and the landscape element index when the land-scape element index was measured as a percentage (n = 48). Number of fixations could be predicted based on the percentage of hardscapes, buildings, waterscapes, and number of fixations being 21.86 + 3.71 (waterscape) + 3.17 (building) + 1.91 (waterscape). Average fixation duration was 375.26 − 60.51 (hardscape) − 60.49 (building) + 121.59 (shrub) ms and pupil size was 1660.57 + 478.29 (arbor) − 133.58 (paddy).
Furthermore, regression analyses for each type of scene showed that, for the RNS, (n = 12) pupil size increased when the ratio of arbor in the whole scene increased. Moreover, pupil size decreased when the ratio of paddy in the whole scene increased.
For the RAS (n = 12), the number of fixations increased when the ratio of hardscapes increased, the fascination score increased when the ratio of paddy and weeds increased, the average fixation duration decreased when the ratio of hardscapes and buildings in-creased, and the fixation duration decreased when the ratio of paddy increased. Moreover, pupil size decreased when the ratio of buildings increased, but became larger when the ratio of paddy in the whole scene increased.
For the UNS (n = 12), the number of fixations decreased when the lawn ratio in-creased, and the average fixation duration increased when the ratio of arbor and sky in-creased. In contrast, the average fixation duration decreased when the ratio of weeds in-creased. Furthermore, the fixation duration increased when the ratio of shrubs increased, and pupil size decreased when the sky ratio increased.
For the UAS (n = 12), the number of fixations decreased when the ratio of weeds in-creased. Moreover, the average fixation duration increased when the proportion of weeds increased, and pupil size increased when the sky ratio increased.

4. Discussion

4.1. The Effect of Different Environmental Pictures on Visual Evaluation and Visual Perception

The current results showed that different types of environmental pictures had different effects on visual evaluation and eye movements. The UAS showed a significantly low-er score of being away compared to other types of scenes, and significantly lower scores for fascination compared to the RNS and RAS. According to previous studies, rural nature scenes have stronger restorative power than urban scenes [55]. This result further confirmed this hypothesis. Comparatively, though the UNS showed a higher compatibility score compared to the RAS, participants felt the RAS was more coherent. Although paddy was one of the main elements, buildings and hardscapes were strongly perceived from pictures of the RAS used in the present study. Previous studies indicated that a lack of human activity signs may cause feelings of insecurity among participants [56,57,58]. Hence, high coherence may have been caused by the conformity of the scenes, which may explain why people still prefer outskirts compared to urban greenness, regardless of quantity and quality.

4.2. The Effect of Different Environments and Visual Perceptions

Results of visual perceptions showed that the UAS gained more fixations than the other types of scenes. According to Witkin and Goodenough, rapid eye movements are observed when a viewer tries to find the attractive element in a scene [59]. That is, a greater number of fixations are thought to reflect the scene being viewed with more effort [39]. More fixations meant that participants expended more effort in trying to find a point of interest. That they may have failed to do so is reflected in that they tended to negatively evaluate the scene. Moreover, the RNS gained the least number of fixations, which may reflect that participants found it easy to find interesting elements. Furthermore, the average fixation duration for the RNS was significantly longer compared to other types of scenes. This strong relationship between fixation duration and interest has been demonstrated in many studies [60,61]. Another study indicated that pupil size is larger when viewing highly restorative rather than minimally restorative pictures; the former results in smaller arousal responses [38]. According to the above results, both visual evaluation scores and visual perception data suggest that nature scenes are more arrestive than urban scenes and have considerably greater restorative power.

4.3. The Relationship between Typical Landscape Element Indices and Visual Evaluations

The present study’s results showed that, regardless of the type of scene, the scores of the subscales of the PRS were frequently related to waterscapes, weeds, and soil. Waterscapes can increase the PRS score, which suggests that waterscapes have greater restorative power than other typical landscape element indices. A previous study demonstrated that increasing the ratio of waterscapes could promote restorative benefits [36,62]. Comparatively, when the ratio of soil and weeds increased, the PRS score decreased. Although natural elements are considered to have positive restorative power [52], the results of this study showed opposite observations. That is, previous studies have posited that the char-acter and maintenance of the vegetation are very important, as the lack of management of vegetation is always related to fears of “wild” forests and nature [56,57,58]. Therefore, in this study, elements such as weeds and soil may imply a lack of maintenance and may hinder the restoration process. To illustrate, only when participants viewed a UAS picture did weeds lead to a higher coherence score aside from shrubs. Considering that the UAS pictures had extremely minimal vegetation, even weeds can increase perceived restorative quality. Additionally, the fascination score increased when the ratio of paddy fields in-creased, and the compatibility score increased when the ratio of shrubs increased. These results indicate that paddy and shrubs also have considerable restorative power.
Weed areas were significantly negatively correlated with the restoration of rural natural scenes. This could be attributed to the lack of weed maintenance, leading to perception barriers, and thus affecting participants’ sense of security [63,64,65].
For rural artificial scenes, paddy fields were related to positive restoration benefits, and the significant negative correlation between bare soil, weeds, and restoration could be attributed to the different maintenance levels of these landscape elements.
Waterscapes were the typical landscape element with the highest perceived restorative quality in the urban natural scenes. Additionally, an increase in lawns was positively correlated with the PRS score. Comparatively, an increase in weeds led to a negative feeling. For urban artificial scenes, the present study showed that an increase in hardscapes (such as roads) and weeds promotes the cognitive load of viewing [66], thereby reducing the PRS score.
Some of the previous studies hihglighted that perceived complexity and the PRS score are highly correlated; high-complexity environmental stimuli presented by landscape photographs increase the information-processing ability of participants and hinder attention recovery [30,54]. However, in this study, no relationship between complexity and PRS scores was observed.

4.4. The Relationship between Typical Landscape Element Indices and Visual Perceptions

The overall relationship between typical landscape element indices and visual perceptions showed that a higher ratio of hardscapes and buildings can lead to greater fixation numbers and shorter average fixation duration. As mentioned above, these results suggest that hardscapes and buildings may have a negative effect. Moreover, an increased shrub ratio led to a longer average fixation duration. Similarly, the positive correlations of average fixation duration and PRS score have been reported by Franěk [1,33]; thus, shrubs could improve perceived restorative quality. For pupil size, an increased ratio of arbor and paddy led to a larger pupil size. According to Martínez’s study, the pupil size is larger when viewing highly restorative pictures than when viewing minimally restorative pictures [38]. This coincides with the visual evaluation results mentioned above, which also suggest that paddy has a high perceived restorative quality.
It is interesting to note that no relationship was found between typical landscape element indices and visual perceptions for each type of scene, meaning that no element of the RNS or UAS can be used to predict any of the visual perception indices. As the picture of the RNS contained minimal artificial elements and the UAS contained maximal artificial elements, the coherence of the atmosphere and elements of the scene could have resulted in homogeneous visual perception characteristics. Contrastingly, when the ratio of hardscapes increased in the RAS, the average fixation duration became shorter, and the same was true for buildings. Moreover, increasing the ratio of buildings led to a smaller pupil size. In addition, for the UNS, the ratio of lawns and shrubs can significantly lead to positive visual perception characteristics from a perspective of perceived restorative quality. These results suggest that, when the circumstances are rural, artificial elements may damage the restorative power of the scene. Moreover, when the environment is urban, natural elements, especially vegetation, may improve the restorative power of the scene. From the perceived restorative quality perspective, landscape designers may need to re-consider adding too many artificial elements in a rural area and induce more well-maintained vegetation in an urban area.

4.5. Limitations and Future Research

This study compared the visual evaluation and eye movement behaviors between urban artificial scenes, urban natural scenes, rural artificial scenes, and rural natural scenes from the perspective of restorative benefits. However, this study has limitations that should be further explored in future studies. First, the photographs were mainly taken in autumn in Southeast China; thus, seasonality and regional characteristics may have affected the typical landscape elements. Future studies should, thus, explore similar scene types in different regions or conduct restorative environmental evaluations of similar scene types in different seasons. Second, the dose effects of the representative landscape element indices in different types of scenes need to be explored in future studies. Additionally, the positive and negative effects of visual information characteristics (e.g., color, shape, and structure) in different types of scenes through regression analyses should be investigated.
As for the participants of the present study, the influence of their age, cultural background, and birthplace (most of them were born in an urban area and all of them are currently living in an urban area) had not been discussed. Besides, they were recruited through campus announcements and social platforms, and each of them was compensated with approximately USD 4.5 (CNY 30). Previous study had indicated that volunteers would be more open to experience and had a greater interest than non-volunteers in self-understanding, as well as less aversion to experimental stimuli [66]. Therefore, the bias from volunteer effects should be considered and decreased in future studies.
This study found that increases in building areas can improve environmental restoration in urban artificial scenes, which is somewhat different from previous findings that generally hold that urban artificial buildings had fewer restorative benefits [2,15,24,25,26]. Therefore, the influence of building materials and shapes (such as the use of glass curtain walls that were like water surfaces, as well as the use of geometric shapes) on experimental results is also worth exploring in future research.

5. Conclusions

This study expanded the research on restorative environments by dividing the environment into urban and natural scenes, instead of comparing the restorative environmental benefits of a mixture of urban artificial, urban natural, rural artificial, and rural natural scenes. Overall, rural natural scenes had a higher restoration effect than other scenes. The positive and negative correlations between the typical landscape element indices and restorative benefits in different scene types can be attributed to the maintenance of these typical elements. In addition, the harmony of elements with circumstances in the scene was an important factor. Despite the limitations pertaining to the region and season in the selected photographs, this study provides direct empirical support for ART. Furthermore, this study was based on the restorative benefits and typical landscape element indices from real environments and provides a general restorative design understanding. Considering the high and low perceived restorative quality that was caused by the differences in the distinctive elements in different landscape scenes, the results provide a reference for urban and rural landscape planning and design to improve the restorative effects.

Author Contributions

C.L. managed the project, designed the task, conducted the human experiments, wrote parts of the main manuscript text, and gave advice about the manuscript. Y.Y. designed the task and conducted the human experiments. C.S. conducted the human experiments and provided advice about manuscript text. M.S. managed the project, statistically analyzed the data, wrote the main manuscript text, and prepared the figures and tables. All authors have read and agreed to the published version of the manuscript.

Funding

This research was funded by the National Natural Science Foundation of China (grant number 51778388), as well as the Landscape Architecture Discipline Construction Project of Suzhou University of Science and Technology.

Institutional Review Board Statement

The study was conducted in accordance with the Declaration of Helsinki and approved by the Ethics Committee of Suzhou University of Science and technology (no. 190703).

Informed Consent Statement

Informed consent was obtained from all subjects involved in the study.

Conflicts of Interest

The authors declare no conflict of interest.

References

  1. Franěk, M.; Šefara, D.; Petružálek, J.; Cabal, J.; Myška, K. Differences in eye movements while viewing images with various levels of restorativeness. J. Environ. Psychol. 2018, 57, 10–16. [Google Scholar] [CrossRef]
  2. Kaplan, R.; Kaplan, S. The Experience of Nature: A Psychological Perspective; Cambridge University Press: New York, NY, USA, 1989. [Google Scholar]
  3. Kaplan, S. The restorative benefits of nature: Toward an integrative framework. J. Environ. Psychol. 1995, 15, 169–182. [Google Scholar] [CrossRef]
  4. Laumann, K.; Gärling, T.; Stormark, K.M. Selective attention and heart rate responses to natural and urban environments. J. Environ. Psychol. 2003, 23, 125–134. [Google Scholar] [CrossRef]
  5. Conniff, A.; Craig, T. A methodological approach to understanding the wellbeing and restorative benefits associated with greenspace. Urban For. Urban Green. 2016, 19, 103–109. [Google Scholar] [CrossRef]
  6. Hartig, T.; Korpela, K.; Evans, G.W.; Gärling, T. Validation of a measure of perceived environmental restorativeness. Göteborg Psychol. Rep. 1996, 26, 1–64. [Google Scholar]
  7. Laumann, K.; Gärling, T.; Stormark, K.M. Rating scale measures of restorative components of environments. J. Environ. Psychol. 2001, 21, 31–44. [Google Scholar] [CrossRef] [Green Version]
  8. Hauru, K.; Lehvävirta, S.; Korpela, K.; Kotze, D.J. Closure of view to the urban matrix has positive effects on perceived re-storativeness in urban forests in Helsinki, Finland. Landsc. Urban Plan. 2012, 107, 361–369. [Google Scholar] [CrossRef]
  9. Pasini, M.; Berto, R.; Brondino, M.; Hall, R.; Ortner, C. How to Measure the Restorative Quality of Environments: The PRS-11. Proc. Soc. Behav. Sci. 2014, 159, 293–297. [Google Scholar] [CrossRef] [Green Version]
  10. Berto, R. Assessing the restorative value of the environment: A study on the elderly in comparison with young adults and adolescents. Int. J. Psychol. 2007, 42, 331–341. [Google Scholar] [CrossRef]
  11. Berto, R.; Massaccesi, S.; Pasini, M. Do eye movements measured across high and low fascination photographs differ? Ad-dressing Kaplan’s fascination hypothesis. J. Environ. Psychol. 2008, 28, 185–191. [Google Scholar] [CrossRef]
  12. Chang, C.-Y.; Hammitt, W.E.; Chen, P.-K.; Machnik, L.; Su, W.-C. Psychophysiological responses and restorative values of natural environments in Taiwan. Landsc. Urban Plan. 2008, 85, 79–84. [Google Scholar] [CrossRef]
  13. Ivarsson, C.T.; Hagerhall, C.M. The perceived restorativeness of gardens—Assessing the restorativeness of a mixed built and natural scene type. Urban For. Urban Green. 2008, 7, 107–118. [Google Scholar] [CrossRef] [Green Version]
  14. Abdulkarim, D.; Nasar, J.L. Are livable elements also restorative? J. Environ. Psychol. 2014, 38, 29–38. [Google Scholar] [CrossRef]
  15. Wang, X.; Rodiek, S.; Wu, C.; Chen, Y.; Li, Y. Stress recovery and restorative effects of viewing different urban park scenes in Shanghai, China. Urban For. Urban Green. 2016, 15, 112–122. [Google Scholar] [CrossRef]
  16. Garg, R.; Couture, R.T.; Ogryzlo, T.; Schinke, R. Perceived psychosocial benefited associated with perceived restorative po-tential of wilderness river-rafting trips. Psychol. Rep. 2010, 107, 213–226. [Google Scholar] [CrossRef] [PubMed]
  17. Takayama, N.; Fujiwara, A.; Saito, H.; Horiuchi, M. Management Effectiveness of a Secondary Coniferous Forest for Landscape Appreciation and Psychological Restoration. Int. J. Environ. Res. Public Health 2017, 14, 800. [Google Scholar] [CrossRef] [Green Version]
  18. Peschardt, K.K.; Stigsdotter, U.K. Associations between park characteristics and perceived restorativeness of small public urban green spaces. Landsc. Urban Plan. 2013, 112, 26–39. [Google Scholar] [CrossRef]
  19. Nordh, H.; Hagerhall, C.M.; Holmqvist, K. Tracking Restorative Components: Patterns in Eye Movements as a Consequence of a Restorative Rating Task. Landsc. Res. 2013, 38, 101–116. [Google Scholar] [CrossRef]
  20. Tomao, A.; Secondi, L.; Carrus, G.; Corona, P.; Portoghesi, L.; Agrimi, M. Restorative urban forests: Exploring the relationships between forest stand structure, perceived restorativeness and benefits gained by visitors to coastal Pinus pinea forests. Ecol. Indic. 2018, 90, 594–605. [Google Scholar] [CrossRef]
  21. Tabrizian, P.; Baran, P.K.; Smith, W.R.; Meentemeyer, R. Exploring perceived restoration potential of urban green enclosure through immersive virtual environments. J. Environ. Psychol. 2018, 55, 99–109. [Google Scholar] [CrossRef]
  22. Ren, X. Consensus in factors affecting landscape preference: A case study based on a cross-cultural comparison. J. Environ. Manag. 2019, 252, 109622. [Google Scholar] [CrossRef] [PubMed]
  23. Kaplan, S.; Kaplan, R. Humanscape: Environments for People; Duxbury Press: North Scituate, CA, USA, 1982. [Google Scholar]
  24. Kaplan, R. The Role of Nature in the Urban Context. In Behaviour and the Natural Environment; Altman, I., Wohlwill, J.F., Eds.; Plenum Press: New York, NY, USA, 1983. [Google Scholar]
  25. Coeterier, J. Dominant attributes in the perception and evaluation of the Dutch landscape. Landsc. Urban Plan. 1996, 34, 27–44. [Google Scholar] [CrossRef]
  26. van den Berg, A.E.; Koole, S.L.; van der Wulp, N.Y. Environmental preference and restoration: (How) Are they related? J. Environ. Psychol. 2003, 23, 135–146. [Google Scholar] [CrossRef]
  27. Mikel, S.; Kalevi, K.; Tytti, P. Still not that bad for the grey city: A field study on the restorative effects of built open urban places. Cities 2021, 111, 103081. [Google Scholar]
  28. Berman, M.G.; Hout, M.C.; Kardan, O.; Hunter, M.; Yourganov, G.; Henderson, J.M.; Hanayik, T.; Karimi, H.; Jonides, J. The Perception of Naturalness Correlates with Low-Level Visual Features of Environmental Scenes. PLoS ONE 2014, 9, e114572. [Google Scholar] [CrossRef] [Green Version]
  29. Kardan, O.; Demiralp, E.; Hout, M.; Hunter, M.; Karimi, H.; Hanayik, T.; Yourganov, G.; Jonides, J.; Berman, M. Is the pref-erence of natural versus man-made scenes driven by bottom-up processing of the visual features of nature? Front. Psychol. 2015, 6, 471. [Google Scholar] [CrossRef] [Green Version]
  30. Ulrich, R.S.; Simons, R.F.; Losito, B.D.; Fiorito, E.; Miles, M.A.; Zelson, M. Stress recovery during exposure to natural and urban environments. J. Environ. Psychol. 1991, 11, 201–230. [Google Scholar] [CrossRef]
  31. Pazhouhanfar, M.; Kamal, M.S.M. Effect of predictors of visual preference as characteristics of urban natural landscapes in increasing perceived restorative potential. Urban For. Urban Green. 2014, 13, 145–151. [Google Scholar] [CrossRef]
  32. Huang, A.S.-H.; Lin, Y.-J. The effect of landscape colour, complexity and preference on viewing behaviour. Landsc. Res. 2019, 45, 214–227. [Google Scholar] [CrossRef]
  33. Franěk, M.; Petružálek, J.; Šefara, D. Eye movements in viewing urban images and natural images in diverse vegetation periods. Urban For. Urban Green. 2019, 46, 126477. [Google Scholar] [CrossRef]
  34. Liu, Q.; Zhu, Z.; Zeng, X.; Zhuo, Z.; Ye, B.; Fang, L.; Huang, Q.; Lai, P. The impact of landscape complexity on preference ratings and eye fixation of various urban green space settings. Urban For. Urban Green. 2021, 66, 127411. [Google Scholar] [CrossRef]
  35. De Lucio, J.; Mohamadian, M.; Ruiz, J.; Banayas, J.; Bernaldez, F. Visual landscape exploration as revealed by eye movement tracking. Landsc. Urban Plan. 1996, 34, 135–142. [Google Scholar] [CrossRef]
  36. Berto, R. Exposure to restorative environments helps restore attentional capacity. J. Environ. Psychol. 2005, 25, 249–259. [Google Scholar] [CrossRef]
  37. Dupont, L.; Ooms, K.; Duchowski, A.T.; Antrop, M.; Van Eetvelde, V. Investigating the visual exploration of the rural-urban gradient using eye-tracking. Spat. Cogn. Comput. 2017, 17, 65–88. [Google Scholar] [CrossRef]
  38. Martínez-Soto, J.; de la Fuente Suárez, L.A.; Gonzáles-Santos, L.; Barrios, F.A. Observation of environments with different restorative potential results in differences in eye patron movements and pupillary size. IBRO Rep. 2019, 7, 52–58. [Google Scholar] [CrossRef]
  39. Valtchanov, D.; Ellard, C.G. Cognitive and affective responses to natural scenes: Effects of low level visual properties on preference, cognitive load and eye-movements. J. Environ. Psychol. 2015, 43, 184–195. [Google Scholar] [CrossRef]
  40. Sun, M.; Herrup, K.; Shi, B.; Hamano, Y.; Liu, C.; Goto, S. Changes in visual interaction: Viewing a Japanese garden directly, through glass or as a projected image. J. Environ. Psychol. 2018, 60, 116–121. [Google Scholar] [CrossRef]
  41. Cottet, M.; Vaudor, L.; Tronchère, H.; Roux-Michollet, D.; Augendre, M.; Brault, V. Using gaze behavior to gain insights into the impacts of naturalness on city dwellers’ perceptions and valuation of a landscape. J. Environ. Psychol. 2018, 60, 9–20. [Google Scholar] [CrossRef]
  42. Elsadek, M.; Sun, M.; Sugiyama, R.; Fujii, E. Cross-cultural comparison of physiological and psychological responses to different garden styles. Urban For. Urban Green. 2018, 38, 74–83. [Google Scholar] [CrossRef]
  43. Nordh, H.; Hagerhall, C.; Holmqvist, K. Exploring view pattern and analysing pupil size as a measure of restorative qualities in park photos. Acta Hortic. 2010, 881, 767–772. [Google Scholar] [CrossRef]
  44. Ode Sang, Å.; Tveit, M.S.; Pihel, J.; Hägerhäll, C.M. Identifying cues for monitoring stewardship in Swedish pasture landscapes. Land Use Policy 2016, 53, 20–26. [Google Scholar] [CrossRef]
  45. Spiers, H.J.; Maguire, E.A. The dynamic nature of cognition during wayfinding. J. Environ. Psychol. 2008, 28, 232–249. [Google Scholar] [CrossRef] [Green Version]
  46. Amati, M.; Parmehr, E.G.; McCarthy, C.; Sita, J. How eye-catching are natural features when walking through a park? Eye-tracking responses to videos of walks. Urban For. Urban Green. 2018, 31, 67–78. [Google Scholar] [CrossRef]
  47. Liu, L.; Qu, H.; Ma, Y.; Wang, K.; Qu, H. Restorative benefits of urban green space: Physiological, psychological restoration and eye movement analysis. J. Environ. Manag. 2021, 301, 113930. [Google Scholar] [CrossRef] [PubMed]
  48. Dupont, L.; Ooms, K.; Antrop, M.; Van Eetvelde, V. Comparing saliency maps and eye-tracking focus maps: The potential use in visual impact assessment based on landscape photographs. Landsc. Urban Plan. 2016, 148, 17–26. [Google Scholar] [CrossRef]
  49. Shen, J.; Saijo, T. Reexamining the relations between socio-demographic characteristics and individual environmental concern: Evidence from Shanghai data. J. Environ. Psychol. 2008, 28, 42–50. [Google Scholar] [CrossRef]
  50. Nielsen, A.B.; Heyman, E.; Richnau, G. Liked, disliked and unseen forest attributes: Relation to modes of viewing and cognitive constructs. J. Environ. Manag. 2012, 113, 456–466. [Google Scholar] [CrossRef]
  51. Qiu, L.; Lindberg, S.; Nielsen, A.B. Is biodiversity attractive?—On-site perception of recreational and biodiversity values in urban green space. Landsc. Urban Plan. 2013, 119, 136–146. [Google Scholar] [CrossRef]
  52. Hartig, T.; Kaiser, F.G.; Bowler, P.A. Further Development of a Measure of Perceived Environmental Restorativeness; Working Paper, No. 5; Uppsala University: Gävle, Sweden, 1997; pp. 78–85. [Google Scholar]
  53. Nordh, H.; Hartig, T.; Hagerhall, C.M.; Fry, G. Components of small urban parks that predict the possibility for restoration. Urban For. Urban Green. 2009, 8, 225–235. [Google Scholar] [CrossRef]
  54. Henderson, J.; Ferreira, F. The interface of language, vision, and action: Eye movements and the visual world. In Scene Perception for Psycholinguists; Henderson, J., Ferreira, F., Eds.; Psychology Press: New York, NY, USA, 2004. [Google Scholar]
  55. Kang, Y.; Kim, E.J. Differences of Restorative Effects While Viewing Urban Landscapes and Green Landscapes. Sustainability 2019, 11, 2129. [Google Scholar] [CrossRef] [Green Version]
  56. Jorgensen, A. The social and cultural context of ecological plantings. In The Dynamic Landscape: Design, Ecology and Management of Naturalistic Urban Planting; Dunnett, N., Hitchmough, J., Eds.; Taylor and Francis: London, UK, 2004; Volume 1, pp. 416–459. [Google Scholar]
  57. Jorgensen, A.; Anthopoulou, A. Enjoyment and fear in urban woodlands—Does age make a difference? Urban For. Urban Green. 2007, 6, 267–278. [Google Scholar] [CrossRef]
  58. Jansson, M.; Fors, H.; Lindgren, T.; Wiström, B. Perceived personal safety in relation to urban woodland vegetation—A review. Urban For. Urban Green. 2013, 12, 127–133. [Google Scholar] [CrossRef] [Green Version]
  59. Witkin, H.; Goodenough, J. Cognitive Styles: Essence and Origins; International Universities Press: New York, NY, USA, 1981. [Google Scholar]
  60. Baker, M.A.; Loeb, M. Implications of measurement of eye fixations for a psychophysics of form perception. Percept. Psychophys. 1973, 13, 185–192. [Google Scholar] [CrossRef] [Green Version]
  61. Underwood, G.; Foulsham, T. Visual saliency and semantic incongruency influence eye movements when inspecting pictures. Q. J. Exp. Psychol. 2006, 59, 1931–1949. [Google Scholar] [CrossRef] [PubMed] [Green Version]
  62. White, M.; Smith, A.; Humphryes, K.; Pahl, S.; Snelling, D.; Depledge, M. Blue space: The importance of water for preference, affect, and restorativeness ratings of natural and built scenes. J. Environ. Psychol. 2010, 30, 482–493. [Google Scholar] [CrossRef]
  63. Schroeder, H.W.; Anderson, L.M. Perception of Personal Safety in Urban Recreation Sites. J. Leis. Res. 1984, 16, 178–194. [Google Scholar] [CrossRef]
  64. Jorgensen, A.; Hitchmough, J.; Calvert, T. Woodland spaces and edges: Their impact on perception of safety and preference. Landsc. Urban Plan. 2002, 60, 135–150. [Google Scholar] [CrossRef]
  65. Herzog, T.R.; Bryce, A.G. Mystery and Preference in Within-Forest Settings. Environ. Behav. 2007, 39, 779–796. [Google Scholar] [CrossRef] [Green Version]
  66. Stephen, J.D.; Frederick, T.L.L. Volunteer Bias and the Five-Factor Model. J. Psychol. Interdiscip. Appl. 1993, 127, 29–36. [Google Scholar]
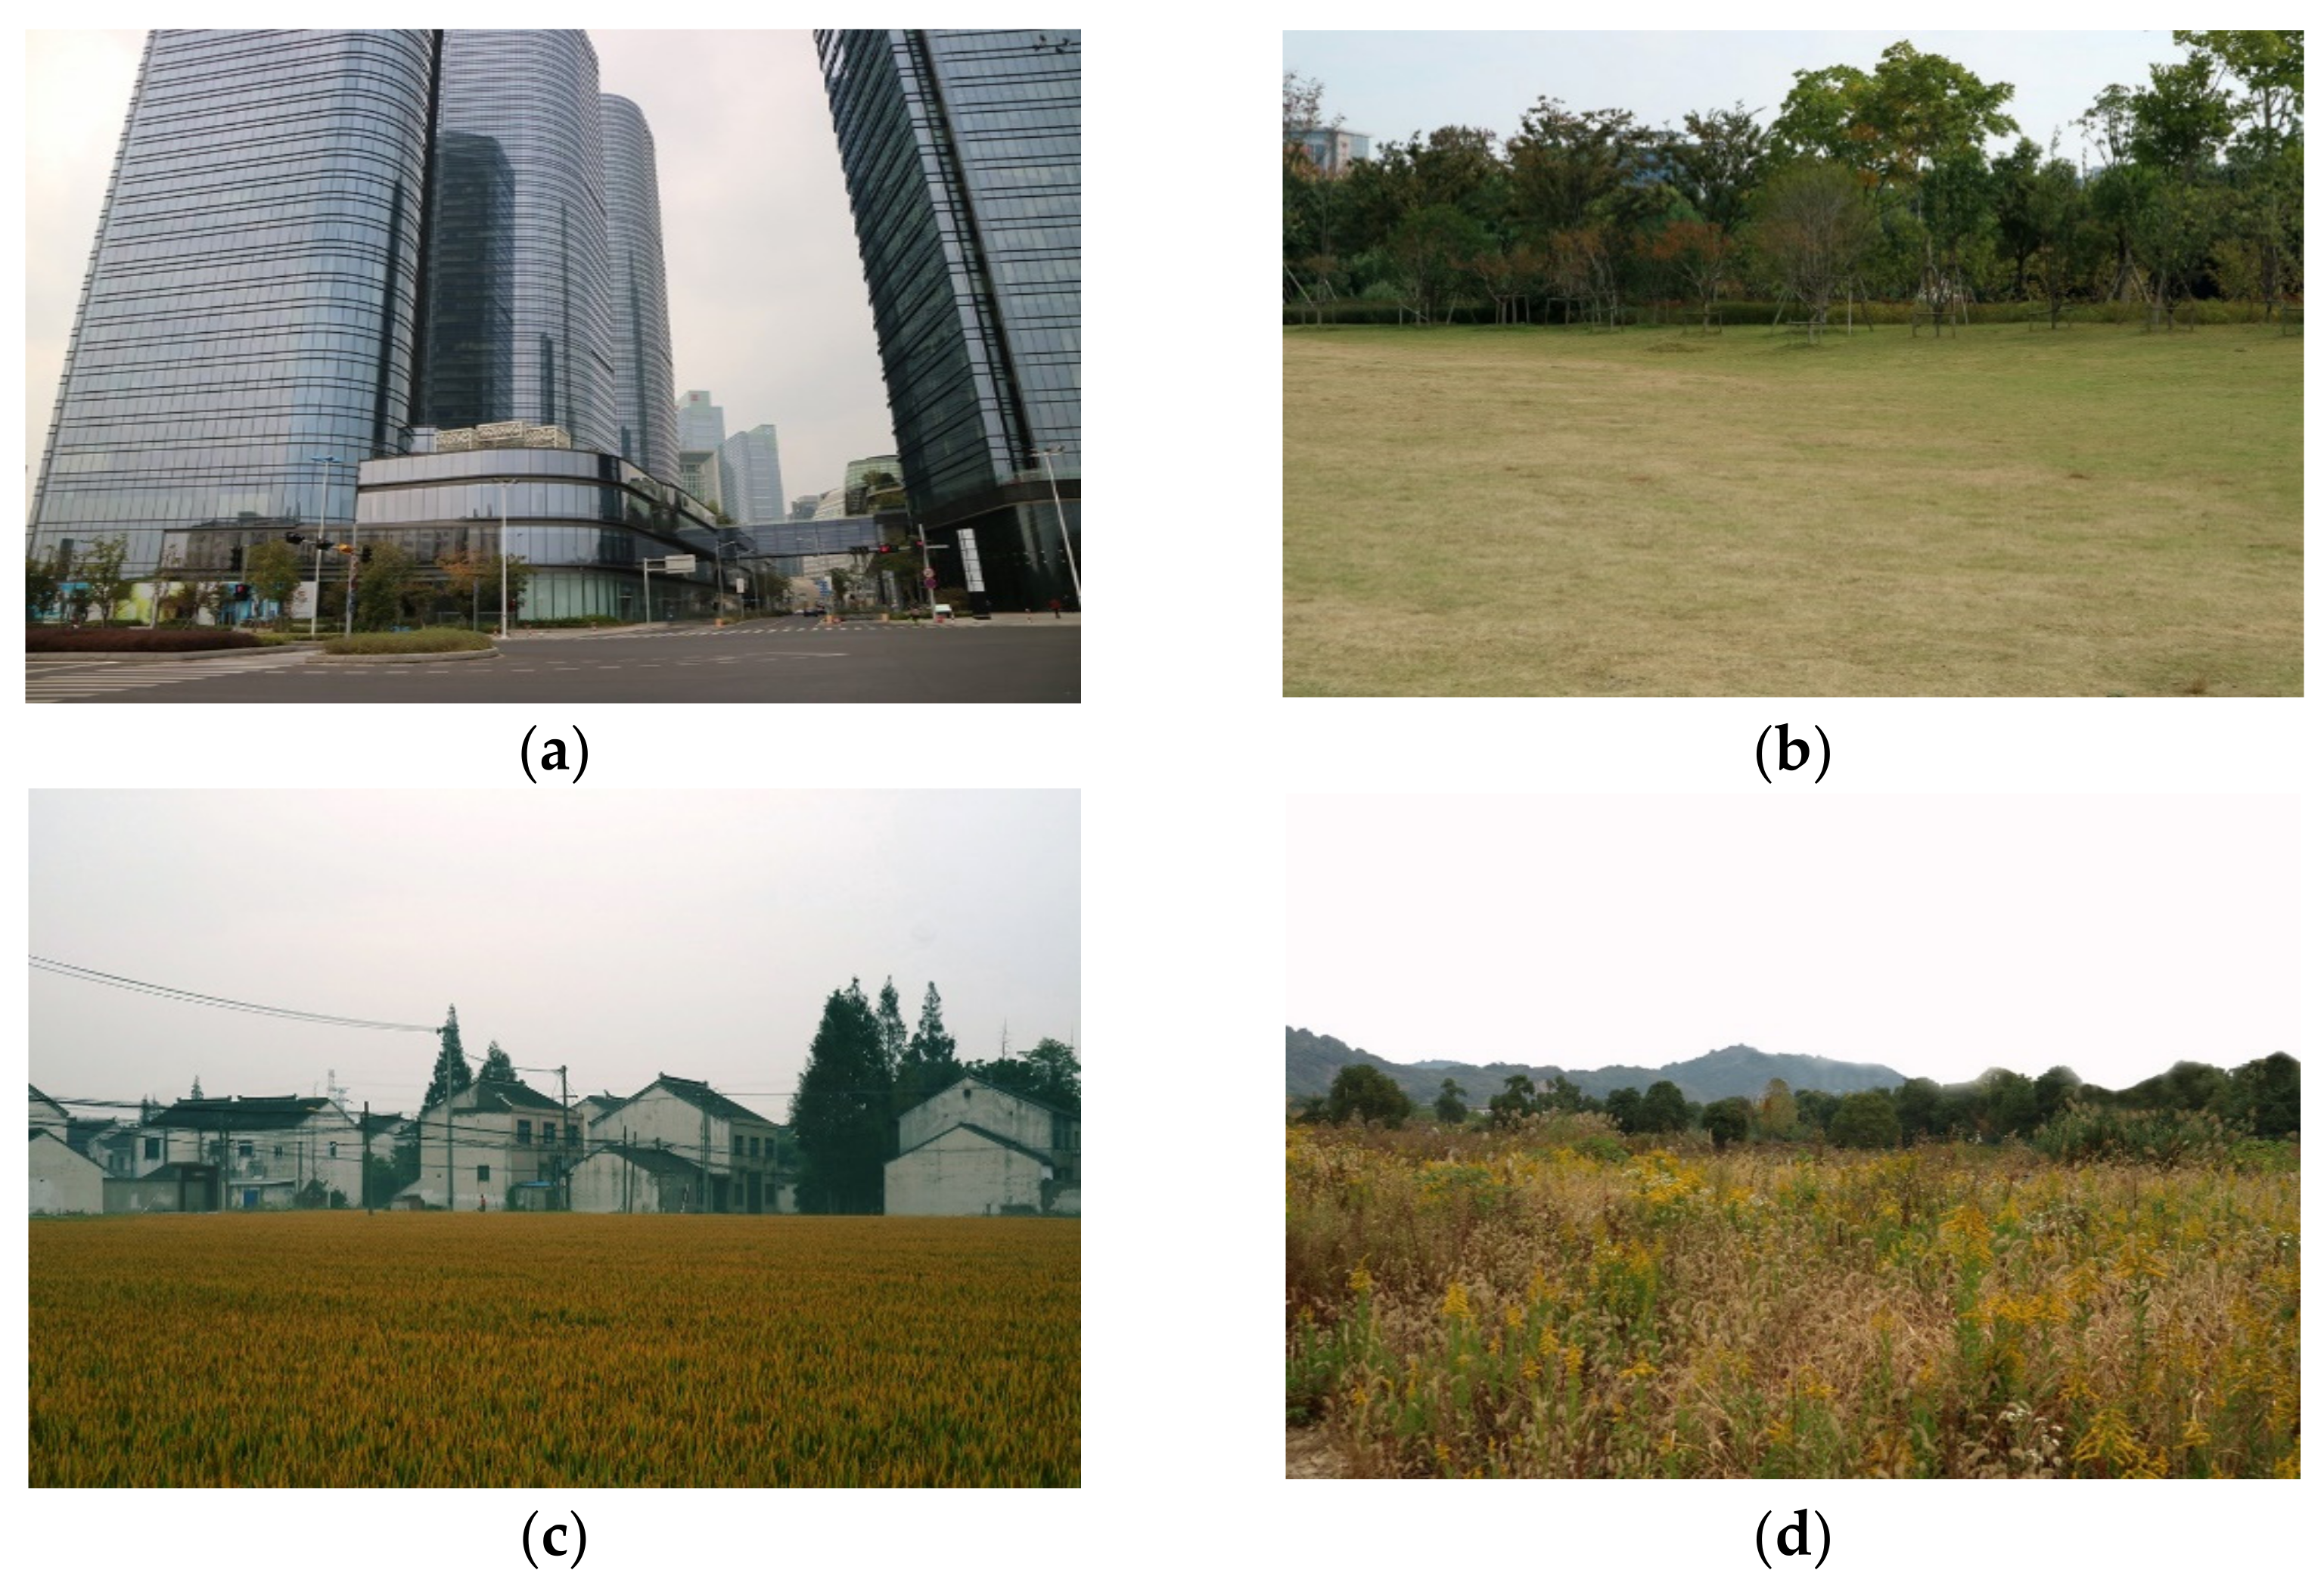
Figure 1. Study sample of photographic stimuli. (a) Urban artificial scene; (b) urban natural scene; (c) rural artificial scene; (d) rural natural scene.
Sustainability 14 03799 g001
Figure 2. Schematic diagram of the pixels of the pictures used as stimuli. (a) An original photograph; (b) the original photograph with pixel labeling; (c) the pixel labeling legend; (d) the percentage of typical landscape elements for each photograph of the four scene types.
Sustainability 14 03799 g002
Figure 3. Study procedure and experimental setting.
Sustainability 14 03799 g003
Figure 4. Comparison of average fixation duration among different types of senses. Note: data are shown as means (standard deviations). ** p < 0.01. UAS: urban artificial scene; UNS: urban natural scene; RAS: rural artificial scene; RNS: rural natural scene. Repeated measures analysis of variance followed by Bonferroni post hoc tests.
Sustainability 14 03799 g004
Figure 5. Comparison of fixation number among different types of senses. Note: data are shown as means (SDs). ** p < 0.01. UAS: urban artificial scene; UNS: urban natural scene; RAS: rural artificial scene; RNS: rural natural scene. Repeated measures analysis of variance followed by Bonferroni post hoc tests.
Sustainability 14 03799 g005
Figure 6. Comparison of pupil size among different types of senses. Note: data are shown as means (SDs). ** p < 0.01. UAS: urban artificial scene; UNS: urban natural scene; RAS: rural artificial scene; RNS: rural natural scene. Repeated measures analysis of variance followed by Bonferroni post hoc tests.
Sustainability 14 03799 g006
Table 1. Demographic data of participants.
GenderEthnicNationality
MaleFemaleHanChina
Number2693119119
Education LevelBirthplaceCurrent Living Area
UndergraduatePostgraduateUrbanRuralUrbanRural
Number1109109101190
Age
17181920212425262728
Number51543311642111
Table 2. Comparison of PRS scores, complexity, and visual data among different types of senses.
UAS 1UNS 2RAS 3RNS 4Fpη21 − β
Mean ± SDMean ± SDMean ± SDMean ± SD
Being away2.91 ± 0.153.93 ± 0.134.29 ± 0.164.23 ± 0.1722.660.0010.471.00
Fascination3.46 ± 0.163.78± 0.153.98 ± 0.154.24 ± 0.216.420.0010.200.96
Coherence4.70 ± 0.194.03 ± 0.144.92 ± 0.164.13 ± 0.207.800.0010.260.99
Scope4.50 ± 1.024.43 ± 1.004.61 ± 0.934.48 ± 1.113.270.0210.140.72
Compatibility3.97 ± 0.244.48 ± 0.243.75 ± 0.243.97 ± 0.240.390.7600.020.12
Perception complexity3.94 ± 0.083.32 ± 0.073.74 ± 0.063.96 ± 0.084.1380.0110.221.00
1 UAS: urban artificial scene; 2 UNS: urban natural scene; 3 RAS: rural artificial scene; 4 RNS: rural natural scene.
Table 3. Relationship between landscape composition and PRS score.
TypeSubscaleElementConstantBRR2FpCIVIF
Being awaywaterscape0.0040.400.380.14(1,44), 7.42<0.050.01; 0.071.00
Fascinationwaterscape3.582.660.760.58(2,43), 30.10<0.011.89; 3.441.05
paddy1.450.86; 2.051.05
Coherenceweed4.7−1.950.500.25(2,43), 7.01<0.01−3.09; −0.811.05
soil−1.47−2.84; −0.111.05
ScopeN
Compatibilitysoil4.42−2.670.910.84(4,41), 51.77<0.01−3.17; −2.161.24
weed−1.73−2.19; −1.271.47
hardscape−1.16−1.51; −0.821.13
shrub4.630.63; 8.631.35
RNSBeing awayweed5.11−1.280.990.97(2,9), 154.62<0.01−1.58; −0.991.44
sky−1.85−2.47; −1.221.44
Fascinationarbor4.021.170.600.36(1,10), 5.72<0.050.81; 2.271.00
Coherenceweed5.41−4.620.980.95(1,10), 202.32<0.01−5.34; −3.901.00
ScopeN
Compatibilityweed4.46−2.150.980.95(1,10), 207.48<0.01−2.49; −1.821.00
RASBeing awaysoil4.26−1.610.910.82(1,10), 45.03<0.01−2.14; −1.081.00
Fascinationpaddy3.381.740.890.79(2,9), 16.88<0.010.98; 0.251.01
weed−3.520.80; 6.231.01
CoherenceN
ScopeN
Compatibilitysoil4.27−2.480.970.94(1,10), 150.84<0.01−2.93; −2.031.00
UNSBeing awaywaterscape3.762.340.950.90(2,8), 35.72<0.011.70; 2.981.34
lawn0.880.31; 1.461.34
Fascinationwaterscape3.662.320.960.93(2,8), 49.60<0.011.70; 2.941.06
weed−58.34−106.20; −10.491.06
Coherencehardscape4.562.050.960.91(1,9), 93.59<0.011.57; 2.521.00
ScopeN
CompatibilityN
UASBeing awaybuilding2.51.840.990.97(2,8), 143.03<0.011.59; 2.091.11
shrub−10.29−16.23; −4.361.11
Fascinationweed4.1−3.320.970.94(2,8), 59.95<0.01−4.02; −2.621.67
hardscape−1.01−1.40; −0.621.67
Coherenceweed4.333.000.940.89(1,9), 73.49<0.012.21; 3.801.00
Scopeshrub3.66124.530.750.56(1,9), 11.61<0.0141.84; 207.221.00
Compatibilitybuilding3.61.510.950.91(1,9), 91.24<0.011.16; 1.871.00
Note: data are shown as means (SDs). UAS: urban artificial scene; UNS: urban natural scene; RAS: rural artificial scene; RNS: rural natural scene.
Table 4. Relationship between landscape composition and visual perception.
TypeSubscaleElementConstantBRR2FpCIVIF
TotalFixationhardscape21.863.710.750.56(3,42), 18.03<0.012.62; 4.791.11
building3.171.58; 4.761.12
waterscape1.910.26; 3.571.13
Average fixation duration (ms)hardscape375.26−60.510.710.50(3,42), 14.16<0.01−83.76; −37.261.05
building−60.49−94.35; −26.621.04
shrub121.59109.53; 600.281.04
Fixation duration (ms)N
Pupil size (μm)arbor1660.6478.290.720.52(2,43), 22.90<0.01325.36; 631.231.01
paddy133.58−221.45; −45.721.01
RNSFixationN
Average fixation duration (ms)N
Fixation duration (ms)N
Pupil size (μm)N
RASFixationhardscape22.414.810.670.45(1,10), 8.14< .051.05; 8.561.00
Average fixation duration (ms)hardscape392.08−176.460.860.75(2,9), 13.29< .01−256.43; −96.502.08
building−251.54−462.33; −40.762.08
Fixation duration (ms)paddy7424.1−302.680.610.37(1,10), 5.85<0.05−581.50; −23.861.00
Pupil size (μm)building1775.4−1226.860.850.56(2,9), 11.79<0.01−1805.01; −648.711.12
paddy128.671.64; 255.701.12
UNSFixationlawn22.94−1.680.610.37(1,9), 5.350.05−3.31; −0.041.00
Average fixation duration (ms)arbor263.91327.190.920.85(3,7), 12.92<0.01185.21; 469.171.61
weed−2528.72−4368.19; −692.241.04
sky104.485.13; 203.841.63
Fixation duration (ms)shrub7110.95876.050.620.39(1,9), 5.75<0.05330.43; 11421.671.00
Pupil size (μm)sky1873.4−441.740.690.48(1,9), 8.31<0.05−788.33; −95.141.00
UASFixationN
Average fixation duration (ms)N
Fixation duration (ms)N
Pupil size (μm)N
Publisher’s Note: MDPI stays neutral with regard to jurisdictional claims in published maps and institutional affiliations.