Article

An Assessment of the Effectiveness of Weather Information Dissemination among Farmers and Policy Makers

1
WIMEA-ICT Laboratory, Department of Networks, College of Computing and Information Sciences, Makerere University, Kampala P.O. Box 7062, Uganda
2
Digital and Technology Cluster, Institute of Development Studies, University of Sussex, Brighton BN1 9RE, UK
3
Department of Microbiology, Federal University of Lafia, PMB 146, Lafia 950101, Nigeria
4
Department of Biological Sciences, Elizade University, PMB 002, Ilara-Mokin 340271, Nigeria
5
India Tanzania Centre of Excellence in ICT (ITCoEICT), Dar es Salaam Institute of Technology, Dar Es Salaam P.O. Box 2958, Tanzania
6
Department of Physics, College of Applied and Industrial Sciences, University of Juba, Juba P.O. Box 80, South Sudan
7
Climatological Unit, Department of Research and Applied Meteorology, Ghana Meteorological Agency, Accra P.O. Box LG 87, Ghana
8
Marine and Numerical Weather Prediction Unit, Ghana Meteorological Agency, Accra P.O. Box LG 87, Ghana
9
Directorate of Forecasting Services, Uganda National Meteorological Authority, Kampala P.O. Box 7025, Uganda
10
Department of Geography, Geo-Informatics and Climatic Sciences, Makerere University, Kampala P.O. Box 7062, Uganda
11
Hub for Environmental and Atmospheric Research, Uganda National Meteorological Authority, Kampala P.O. Box 7025, Uganda
12
Department of Electrical and Computer Engineering, Makerere University, Kampala P.O. Box 7062, Uganda
*
Author to whom correspondence should be addressed.
Sustainability 2022, 14(7), 3870; https://doi.org/10.3390/su14073870
Submission received: 4 December 2021 / Revised: 17 February 2022 / Accepted: 23 February 2022 / Published: 25 March 2022

Abstract

:
The changing environment, climate, and the increasing manifestation of disasters, has generated an increased demand for accurate and timely weather information. This information is provided by the National meteorological authorities (NMAs) through different dissemination channels e.g., using radios, Televisions, emails among others. The use of ICTs to provide weather information is recently gaining popularity. A study was conducted in three countries, namely Nigeria, Uganda, and South Sudan to assess the efficiency of an ICT tool, known as “Weather Information Dissemination System”. The study involved 254 participants (Uganda: 71; South Sudan: 133; and Nigeria: 50). The collected primary data were first quality controlled and organized thematically for detailed analysis. Descriptive statistics was used to provide quantitative analysis as well as content scrutinized for qualitative analysis. The results showed that there is a need for timely weather information to plan farming activities such as planting and application of fertilizers and pesticides as well as to manage flood and drought by the water sector and disaster management. Results further showed that the majority of the respondents have access to the technology needed to access weather and climate information. The respondents who received weather information from NMAs noted that the forecast was good. However, they further noted that there is more room for improvement especially with making the forecasts location-specific, ensuring mobile access is adequate in all regions, provision of weather information by SMS (in countries where this service is currently unavailable) and improved timing of the weather information. Finally, uncertainty about the accuracy of weather information and the weather information not meeting specific needs are key barriers to people’s willingness to pay for it (Uganda: 33.3%; South Sudan: 46.1%; and Nigeria: 33.3%). Improved collaborations between the NMAs, ICT service providers, policymakers and farmers will facilitate an effective approach to weather information access and dissemination. Innovative sensitization approaches through the media houses will enable better understanding of weather products and utilization, and access to enabling ICTs would increase access to weather forecasts

1. Introduction

Weather is the present condition of the atmosphere at a given place. It is usually provided using the following parameters: temperature, relative humidity, precipitation, cloudiness and wind among other parameters. In the era of climate change, weather and its effects on human life are a critical issue to humans and property. A case in point is the increase in the occurrences of extreme weather events, which often cause loss of lives and property [1,2,3,4]. A shift in the start of seasons has been observed globally, leading to increased challenges in predicting the onset and cessation of rain seasons [3,4,5,6]. Human lives and property are increasingly lost due to floods and landslides that often come during rainy seasons. On the other hand, dry spells have been reported to span longer durations than in the past, with a remarkable increase in temperature [3]. The negative effects of increasing temperature have further reduced investment, depressed labor productivity, causing poorer human health [7,8], and lowering agricultural and industrial output among others [9]. These extreme weather events further negatively affect livelihoods, contributing to forced migration from landslide- and flood-prone areas in a bid to limit the impacts of these events [10,11,12].
The economies of many African countries have been majorly impacted by these extreme conditions owing to their reliance on rain-fed agriculture [3]. Agricultural productivity processes have been negatively affected starting from planting, post-harvest, and marketing [13]. Weather-related losses have been reported in the drying process, in which the quality of produce is lowered [14,15,16]. For example, 14.9% of all the cooking bananas that are produced in Uganda were found to suffer postharvest deterioration along the value chain while 7.2% of the bananas deteriorated completely and 7.7% deteriorated partially, leading to selling them at discounted prices [17]. Moreover, other sectors, which support the agricultural sector such as transport are equally affected. Additionally, losses as a result of bad roads which significantly deteriorate in the rainy seasons have been noted.
In some parts of Africa, farm produce, which was once seasonal, has been recently deseasonalized, since related activities/practices are no longer seasonal. Other farm produce has been improved to withstand changing weather/climate patterns. In the past decades, farming activities were largely subsistence, however farming is becoming a lucrative business venture [13]. In addition to agriculture, weather conditions affect several other sectors such as health [4,8], water resources [3], transportation [9], construction, and tourism among others. Communities are increasingly appreciating the value of local weather and climate information and thus the need for promoting decentralization of weather and climate services in order to adapt to climate shocks [18]. The key determinants in adaptation to climate shocks are access to information, total annual farm income, and market access [18,19,20]. Despite the increase in the volume of weather information produced, there is still only a limited amount of information that reaches the communities who need it most, the uptake of weather and climate services is still low and some local communities have resorted to the use of local indigenous knowledge [19].
In developing countries, farming communities have continued to decry the unreliability of weather information, timeliness and accuracy. This has resulted in a poor uptake of the provided weather information [20]. Information and Communication Technology (ICT)-based models including using web portals and mobile-based applications to disseminate information are effective but still face challenges [21,22,23,24]. One example of an ICT intervention is the use of ICT tools to provide farmers with Climate Smart Agriculture-related extension messages [24,25,26,27]. However, the effectiveness of ICT interventions is impeded by the high cost of accessing both the weather information and tools, preventing many low-income communities from using these systems [25,27]. Moreover, more affordable alternatives such as the use of traditional media channels and dissemination via community leaders are prone to delays in delivery, information distortion, and a lack of flexibility in terms of weather products of choice and time preferences. National Meteorological services are increasingly bringing together different stakeholders as a means of tailoring climate advisories to the different sectors as a co-production approach. One of the bodies at the forefront of promoting co-production is the IGAD Climate Applications and Prediction Center (ICPAC).
The national hydro-meteorological authorities generally offer a variety of weather and climate products including advisories. Weather and climate products are at varying timescales, ranging from: nowcasting, which is a weather forecast for a few hours ahead (e.g., up to 3 h), sub-seasonal e.g., a month, seasonal (e.g., March-May) including climate projections. These and other products are created with the aim of getting accurate and timely information to help communities adapt to extreme weather events. In this paper, we assess the effectiveness of the weather information dissemination models to communities across sectors, with emphasis on the different needs and contexts of communities in three countries including Nigeria, South Sudan and Uganda.

2. Materials and Methods

2.1. Theoretical Framework

Information is knowledge obtained from investigation, study, or instruction. It is a form of organized or classified data with meaningful values for the receiver. When communication provides meaning to the receiver, it is said to be effective. Effectiveness is the capability of producing a desired result or the ability to produce a desired output. Relevant information means information that pertains to the matter or problem at hand and is directly connected with effective communication. Information is considered relevant if it is important and useful, such as pertinent, valuable, of utility, applicable, helpful, appropriate, significant, topical, correspondence, fit, bearing, matching [26]. User perceptions determine the usefulness of weather information including; the complexity of weather information, packaging of information, accuracy and scale of forecasts, interpretation of the information, and timing among others. It is therefore important that all aspects of information be considered to ensure that its purpose is met. For instance, the provision of high-quality weather data is not a guarantee that communities benefit from weather information. Weather information dissemination is key to realizing the full potential of the weather and climate information to support communities in adapting to climate change. In this study weather, information was made available through the WIDS application [28]. People-related factors, such as: farmers’ ICT literacy, level of awareness and education, motivation, and attitude towards the information itself and source, affect the level of use of the information [29]. The study sought to assess the levels of effectiveness and determinants of the effectiveness of weather information dissemination methods amongst farmers and policymakers/service providers. Figure 1 shows the conceptual framework, which guided the study whereby the relevancy of weather and climate information coupled with the effectiveness of dissemination leads to the desired result; that is, using the information for better outcomes.

2.2. Survey Design and Administration
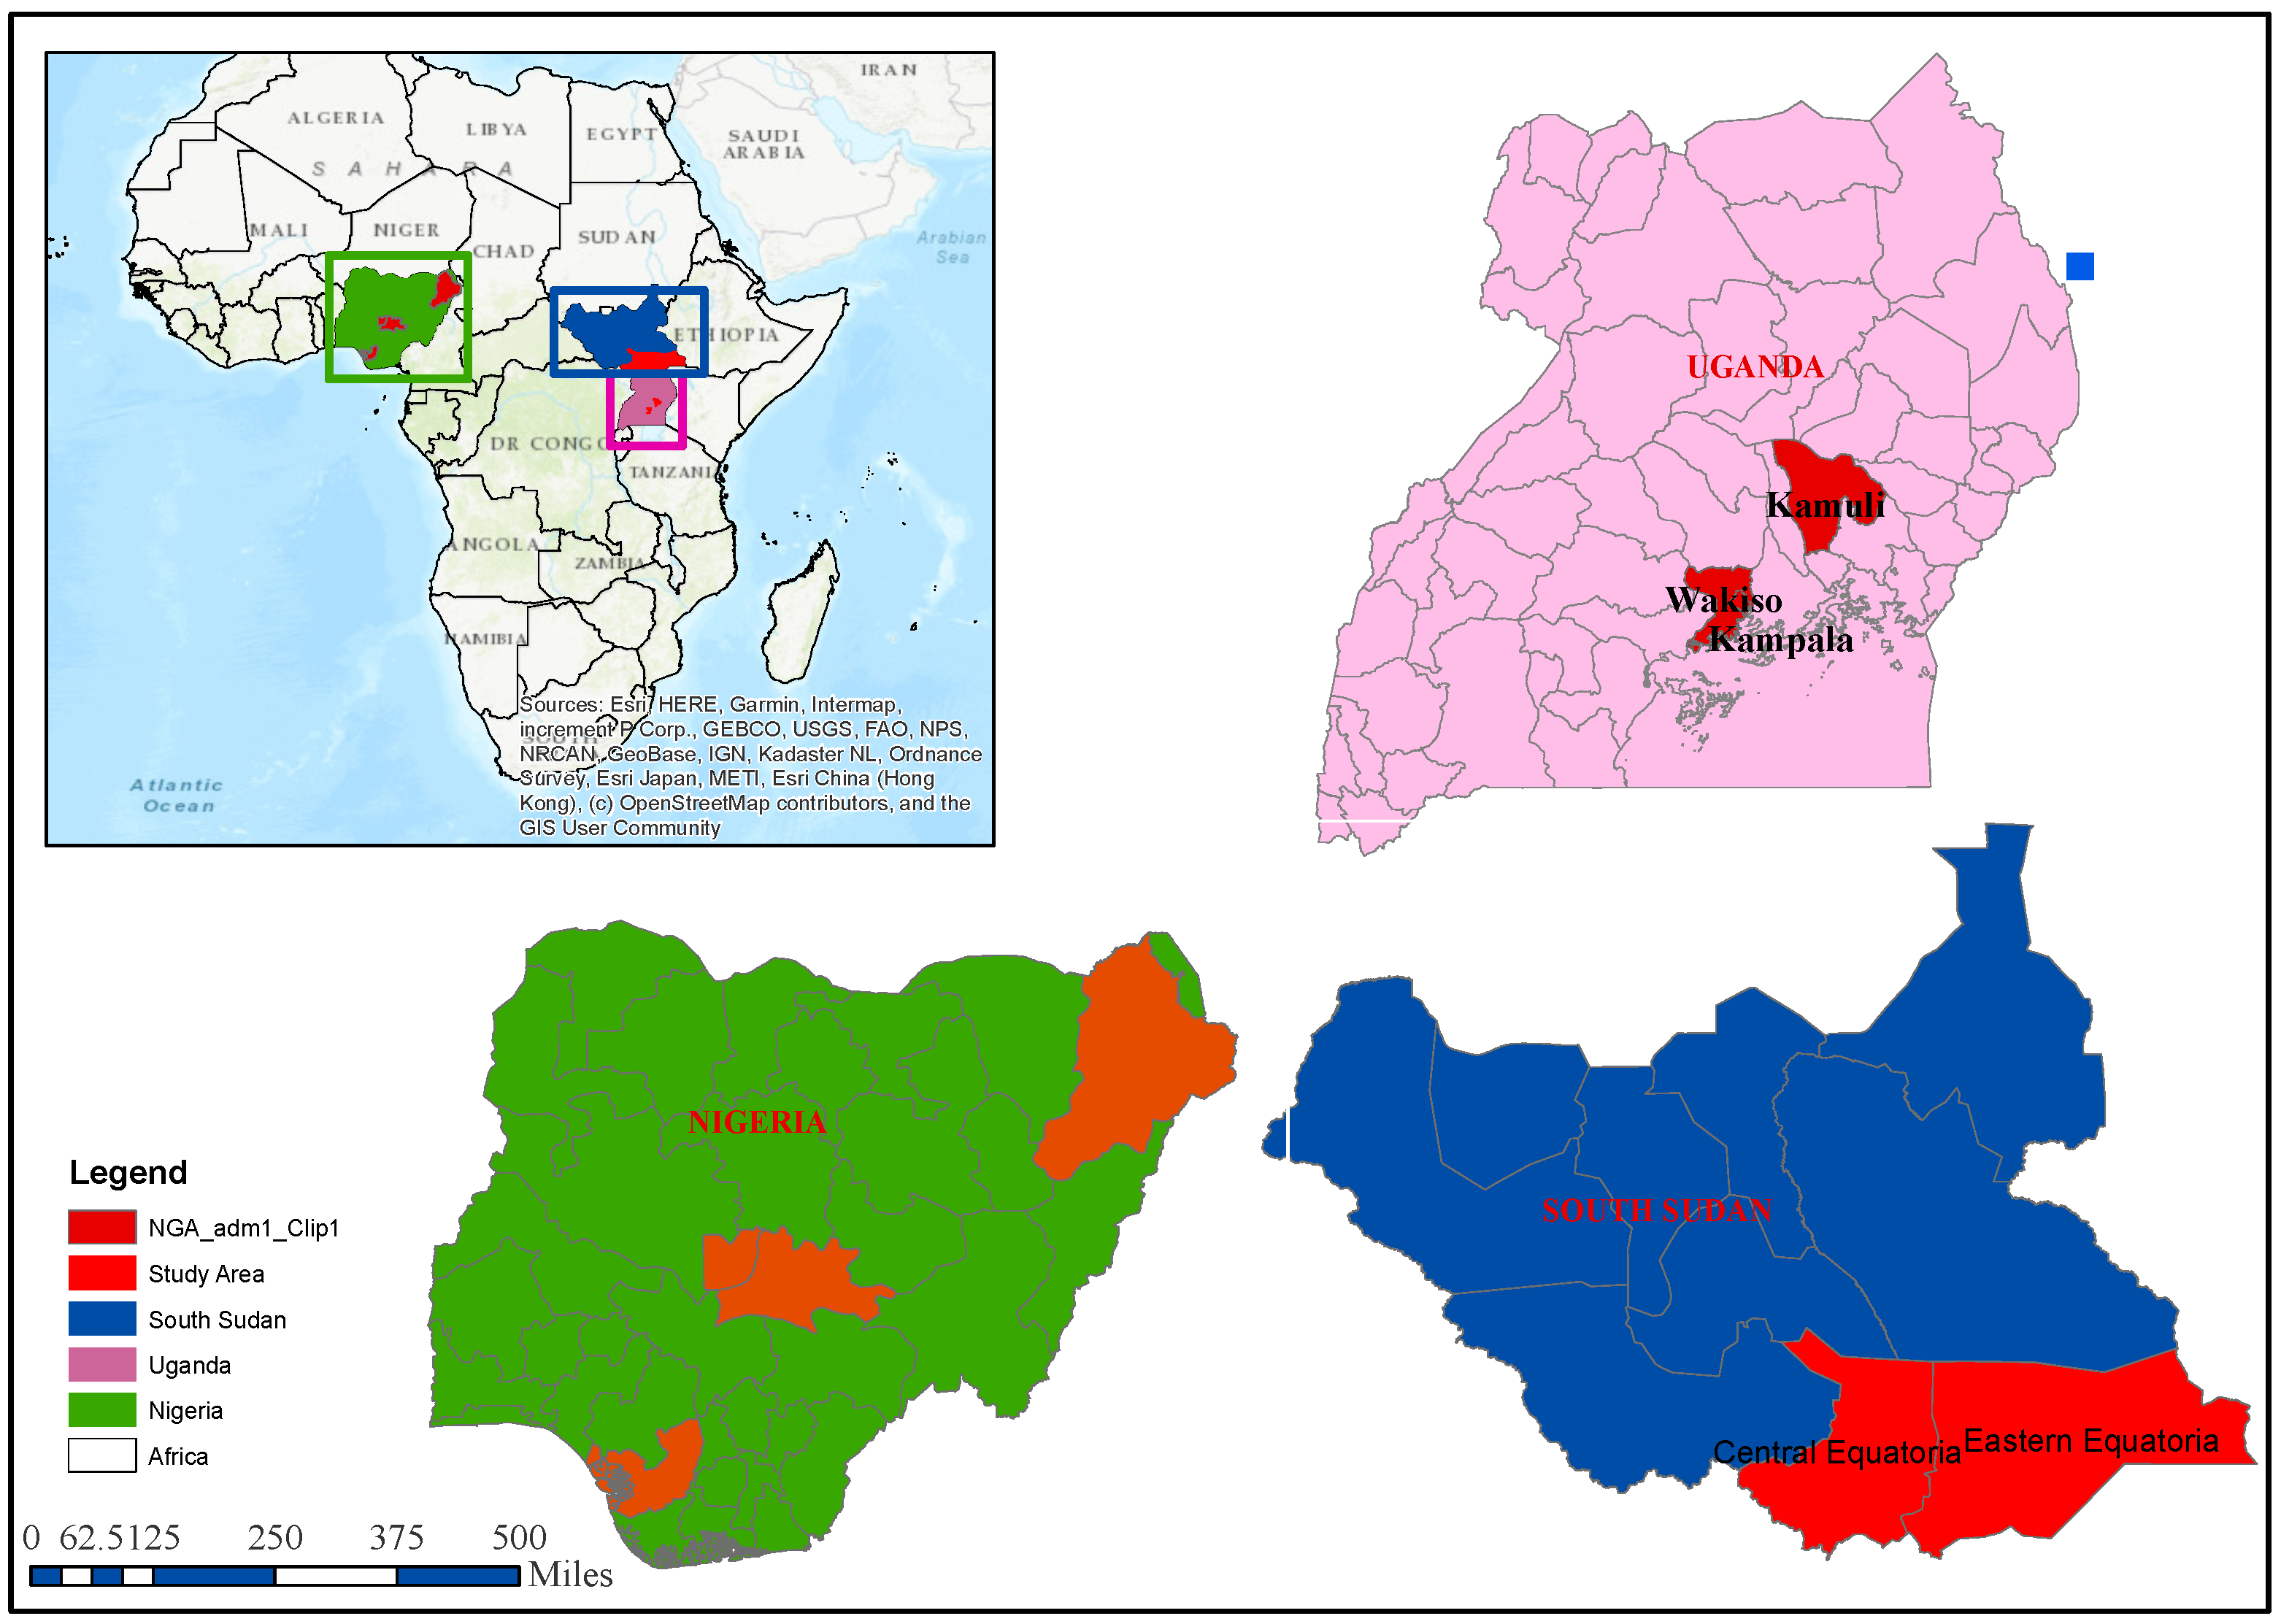
Questionnaires targeting two groups including farmers (Uganda: 71; South Sudan: 133; and Nigeria: 65) and policy makers/service providers (Uganda: 55; South Sudan: 45; and Nigeria: 5) were administered from June 2020 to late August 2020 in the three African countries, including Uganda, South Sudan and Nigeria. The farmers responded to the questionnaires during focus group discussions, while the policymakers/service providers were reached through Google forms. A minimum number of questions, which were considered by the researchers as the bare minimum for meaningful data analysis, were made mandatory for the Google form submission, while other questions were not required to be completed. Additional responses were received from both groups during scheduled webinars conducted in September 2020. Table 1 gives the distribution of farmers who responded to the questionnaire, while Table 2 is the distribution of the policymakers/service providers that participated in the study. The policy makers were from the agriculture sector, water and environment sector, health sector, ICT sector as well as the local governments. The service providers were from the ICT sector and from Academia. The humanitarian organizations (i.e., Non-Governmental Organizations (NGOs) and Community Based Organizations (CBOs)) that participated in the study were chosen on the basis of participating in the Weather information cycle especially targeting the agriculture, water resources and health sectors.

2.3. The Study Area

The study was carried out in identified areas in three countries in Africa namely; Uganda (in wakiso, Kampala, and Kamuli districts), South Sudan (in East equatorial and Central equatorial) and Nigeria (in Borno, FCT Abuja and Delta states) (Figure 2). Table 3 describes the characteristics of the selected areas in the study.

2.4. Data Analysis

Data were first cleaned and organized into question categories and later analyzed using R, a statistical package. This study used R version 3.6.3 used majorly the ‘stats’ package. Additionally, this study used descriptive statistics and graphical analysis to represent quantitative analysis.

3. Results

3.1. Demographic Characteristics of Respondents

From the data collected, the majority of the respondents were males (Figure 3) and had been living in the location for more than 10 years (66.7% in Uganda, 55% in South Sudan, and 74.5% in Nigeria) (Figure 4) and thus expected to have a good knowledge of the climatology, geography and policies of their particular region. The demographic distribution of policy makers and other actors is provided in Figure 5.
Analysis shows that the consumers of weather and climate information are domesticated in different ministries in different countries (Figure 5). Other sectors that make use of weather and climate information are academia, local government, Health, ICT and Humanitarian organizations (NGO/CBO). These statistics are also reflected in Section 2.2.

3.2. Weather Information Relevance

3.2.1. Weather Information Access and Frequency

The results regarding access of weather information shows that more than 60% of the recipients (85.5% in Uganda, 72.2% in South Sudan and 65.3% in Nigeria) are able to access weather information (Figure 6). The results further show that the most common channel of receiving weather information is through media houses (Uganda: 77.3%; South Sudan: 54.7%; and Nigeria: 23.4%) (Figure 7 left). Most of the policy makers in Uganda and Nigeria received weather information via email whereas in S. Sudan the information is received via local government officers (Figure 7 right).

3.2.2. Weather Information Products

Figure 8 shows the main weather parameters of interest for the policy makers. The results show that rainfall and air temperature are the main parameters of interest. Additionally, the famers from the three countries acknowledge reception of the forecast products made by the meteorology agencies most especially the daily and seasonal forecasts (Figure 9).
The rate at which the weather forecasts are received by farmers and policy makers was investigated and we noted that for all the three countries, both the famers and the policy makers largely received the weather forecasts on a daily (Figure 10) and seasonal basis except for South Sudan, where most policy makers never receive weather information. In addition, in Uganda and Nigeria the Farmers liked the way weather products were formatted and presented. This was not the case in South Sudan where the majority of the respondents were dissatisfied with the way weather products were formatted and presented (Figure 11).

3.2.3. Purpose of Information

The weather information generated by the weather agencies in the three countries is used in different ways by famers and policy makers. As shown in Figure 12, farmers in all three countries mainly use the weather for planning when to plant (Uganda: 70.5%; South Sudan: 51%; and Nigeria: 68.3%). Other purposes for which weather information is used by the farmers include planning irrigation activities, fertilizer and pesticide application. Policy makers used the weather information for a variety of purposes such as flood and drought management (Nigeria: 37.5%; South Sudan: 29.5%; and Uganda: 18.9%); managing domestic water supply (South Sudan: 45.5%; Nigeria: 25%; Uganda: 4%) (Figure 12). Other purposes for which policy makers use weather information are monitoring the water levels and development of water for production activities. A significant percentage of policy makers apparently did not make any use of the weather information as they gave no response when asked about the purpose for which they used it (58.1%, 12.5% and 6.8% in Uganda, Nigeria and South Sudan; Figure 12).
Figure 13 shows the benefits derived from using weather information as presented by the policy makers. Analysis shows that the outstanding benefits derived are improved decision making, and increased productivity.

3.2.4. Community Attitude towards Paying for Weather Information

Figure 14 shows an analysis of the willingness to pay for the weather information services. The results showed that most of the respondents in all the three countries were willing to pay for daily and seasonal weather updates. In Uganda (daily: 24.7% and seasonal: 45.2 %) were willing to pay for these updates, whereas in South Sudan (daily: 26.5% and seasonal: 23.2%) and in Nigeria (daily: 42% and seasonal: 18%) were willing to pay for the updates. Additional analysis (Figure 15) shows that on average, farmers were willing to pay a fee of up to USD 0.055 (Uganda: 44.8% and South Sudan: 38.3%). Most of the Nigerian farmers (62%) were not willing to pay any fee for the current weather information. Since the farmer respondents were among those in the subsistence production category and were therefore living on a very low income, it is not surprising that a significant percentage preferred to receive weather information for free or to pay only very small amounts.
As shown in Figure 16, the most notable barriers preventing farmers’ willingness to pay for the forecasts were inaccurate forecasts (46.1%, 33.3% and 33.3% in South Sudan, Uganda and Nigeria, respectively); affordability (35.8%, 19.1% and 9.8% in Uganda, South Sudan and Nigeria, respectively); and their specific area not being monitored in the forecast (35.3%, 16% and 13.5% in Nigeria, Uganda and South Sudan, respectively).

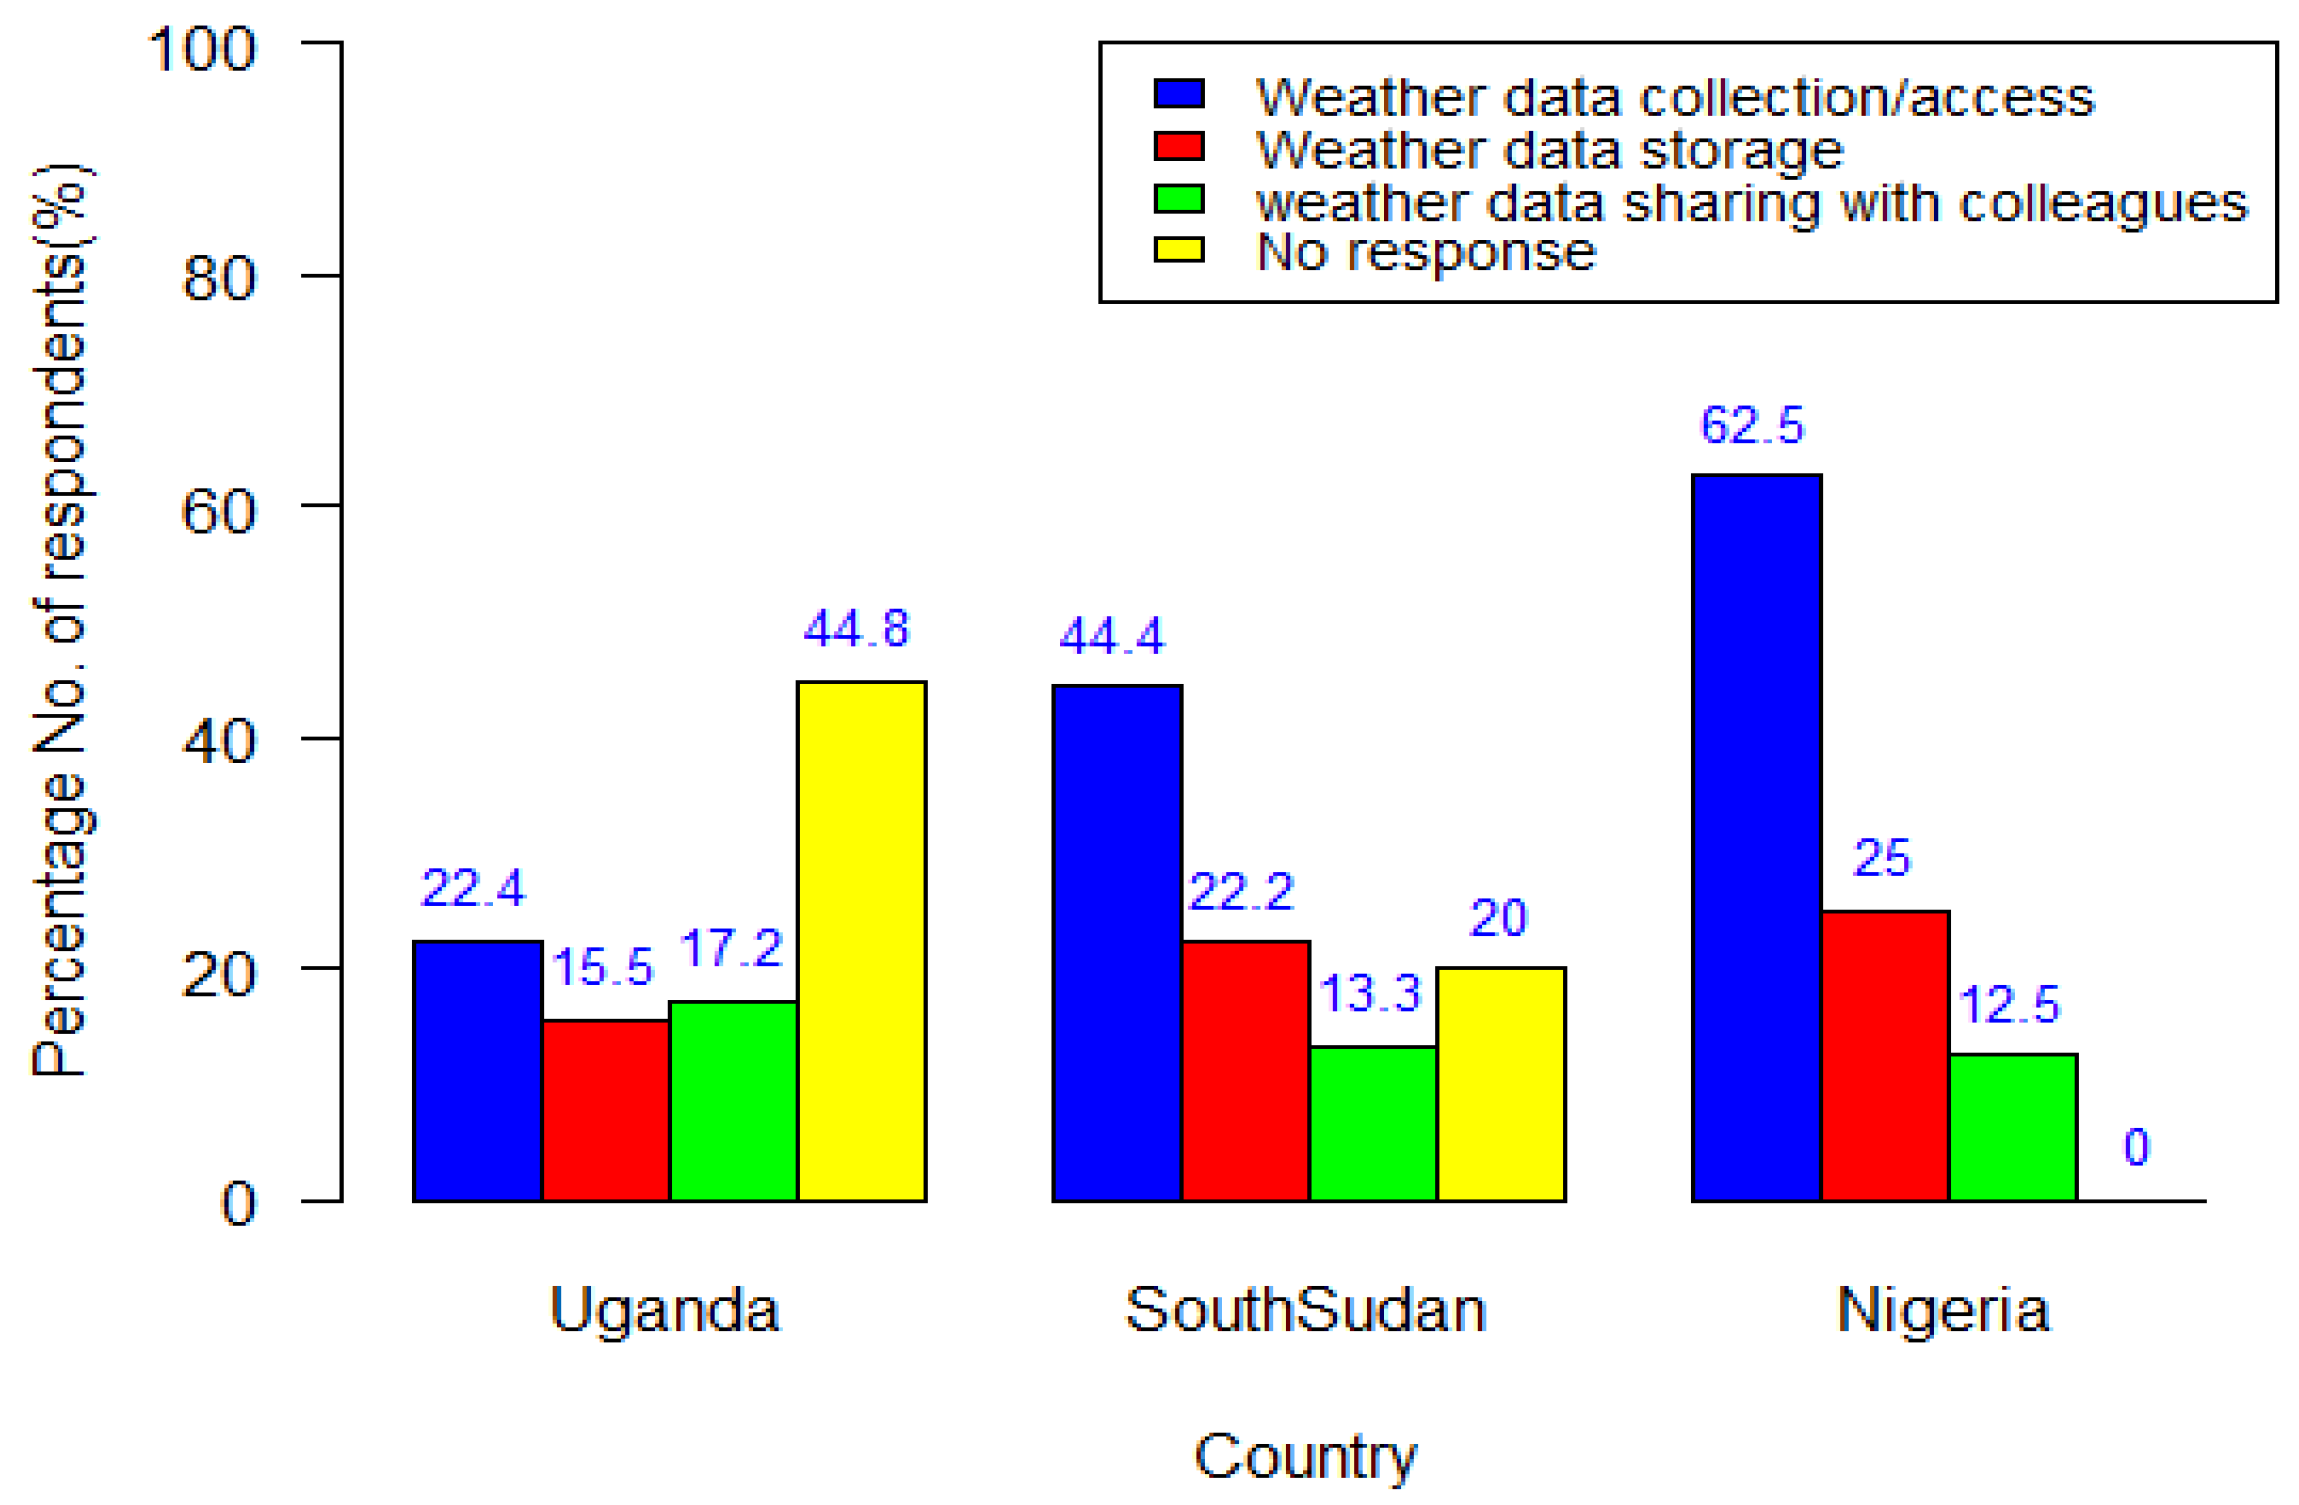
3.3. Dissemination Process and Tools

3.3.1. Evidence of Knowledge on Weather Services and Patterns

According to the farmers, the majority were aware of the existence of National Meteorological Authorities (NMAs) and that they received weather information from them (see Figure 17). Additionally, they stated that the study area experienced two rainy seasons (in Uganda and South Sudan) and one rainy season in Nigeria (see Figure 18).

3.3.2. Access to Relevant Tools and Technology

In all the three countries, the respondents had access to the tools and technology to receive weather information. In Uganda, the respondents had access mostly to radio (27.7%), TV (26.1%) and smartphones (22.7%). In South Sudan, the respondents had access mostly to radio (32.6%), smart phones (27%) and Facebook (22.4%) while in Nigeria, the respondents had access mostly to smart phones (31.3%), TV (20.9%) and radio (18.7%) (See Figure 19). Respondents also indicated that they had access to good quality mobile networks (Uganda (91.8%), South Sudan (75.9%) and Nigeria (95.8%) (see Figure 20).

3.3.3. Role of ICT in Weather and Climate Information Cycle

Figure 21 shows how ICT has been used for weather data collection and access, in storage of weather data and in sharing of the weather information in all three countries but mainly for weather data collection/access that is, in Uganda (22.2%), South Sudan (44.4) and in Nigeria (62.5%). A significant percentage gave no response to the use of ICT in Uganda (44.8%) and South Sudan (20%). This implies that further application of ICT could improve the weather and climate information cycle.

3.3.4. Inter-Organizational Collaboration among Policy Makers and Service Providers

Analysis of Figure 22 shows that in all three countries, different stakeholders engage in collaborative efforts in relation to weather information management. These most notably include NGOs/CBOs, ministries, academia and parliament. In Nigeria and South Sudan, a significant percentage of policy makers/service providers gave no response when asked about collaboration implying that weather information processes could benefit from increased collaboration.

3.4. A Case Study of Uganda for Bi-Variant Analysis

Additional chi-square analysis between the type of forecast and the importance of the forecast received. This was to ascertain the dependence of the usage of the different forecasts in any way according to their type. From the results (Table 4) it has been observed from people’s perception that the relationship between the purposes of the forecast issued and the type of the forecast issued is not statistically significant (at p < 0.05).
Additionally, an examination on whether the access to enabling ICT technology by farmers would influence the farmers’ choice to like the format the forecasts are made was performed (Table 5). From the results, the relationship between the access to enabling technologies and whether famers liked the format of forecasts was not statistically significant (at p < 0.05). However, the relationship between the access to enabling ICT technologies and access to forecasts had a significant relationship (at p < 0.05) (Table 6).

4. Discussion

Although meteorological services are the sole institution mandated to generate weather and climate information, our findings indicate that they do not have the capacity or equipment to effectively disseminate this vital information. For that reason, there is a need for the NMAs to collaborate with other sectors in order to leverage those sectors’ strengths. For instance, given that radio and TV can reach a wide audience, these channels are valuable for rapid and effective information dissemination. Meteorological services could sign MoUs with media houses so that these partnerships are mutually beneficial to both parties. The collaborations between the communities should also be strengthened to help meteorological services understand the needs of communities and tailor the information better [30]. Furthermore, collaborations among sectors are necessary in order to improve the advisories and tailor the weather and climate information to the needs of specific sectors in order in order to realize the relevance of the information within the different contexts [31]. Increased inter-organizational collaborations between the meteorological agencies and the stakeholders (agriculture, health and water sector, which use the weather products for planning, flood and drought management and policy making) will create better understanding and utilization of weather products [32]. Provision of a more flexible feedback mechanism by the meteorological agencies will provide information on how the users are receiving and utilizing the weather products.
Quality of information is key to effective dissemination of the information. For instance, communities will only invest in information if they think it is accurate and is valuable to them [33]. There is therefore a need to increase the data capture and quality of forecasts, to generate area-specific forecasts [34]. For example, a separate analysis of synoptic stations used to derive weather data for forecasts (Figure 23) shows a clear sparse weather station network. Therefore, improving the density of the weather station network will likely provide accurate forecasts. This will improve peoples’ appreciation of the information, hence, adoption of the advisories communicated.
Other potential areas for innovation and value addition include new processes, products and technologies supporting access to weather and climate information. These technologies improve access to weather information [35]. On the other hand, new products make the information appealing, valuable or affordable. These include promotion of weather and climate information using social media [36], developing ICT tools to ease access to information and innovating products around weather and climate information. Such innovations might include advisories related to crop insurance, agricultural products markets, as well as pests and diseases. The addition of such value-added services can generate revenue, since people become more familiar with mobile phone services when they use information services, leading to increased mobile phone use and hence, higher average revenue per user for the mobile provider [29,30]. Increased collaborations between the meteorological agencies and ICT service providers will enable improved and rapid dissemination of weather products. For example, presentation of weather information may be improved through graphical information.
Sensitization and awareness raising helps to inform stakeholders and especially rural communities on the importance of weather and climate information to their livelihoods [35]. Capacity building with the media is necessary to ensure that they interpret and are able to explain the information to other users. These engagements with stakeholders create new needs, which require innovation in order to provide solutions. For example, increased sensitization about the application of weather products through innovations will increase an understanding of the need for collaborations between the policymakers and service providers.
Weather and climate information cost is a barrier to access of information by rural communities. This can be solved by applying cost-sharing mechanisms. For instance, one person in a village might receive the weather forecast and share it with others. Other government sectors such as agriculture could also provide financial support for the weather and climate information since it is also of value to them. Furthermore, the government could subsidize the cost of receiving the weather and climate information by waiving taxes on tools and software for accessing the information. Modeling the cost–benefit analysis for the weather information and articulating this to the target policy makers and users is also likely to change attitudes.
From the case study, the type of forecast issued is independent of the purpose for which it is to be used and also the choice made by farmers to like the format of the forecasts issued or not is independent of the access to enabling ICTs. However, the access to forecasts issued in Uganda is dependent on access to enabling technologies, thus a need to introduce a policy to allow people have easy access to enabling ICTs.
The above recommendations have been summarized in Figure 24. Their implementation has potential to improve response to weather and climate information which would be evidenced by increased information access, improved trust in the information, increased productivity and increased willingness to pay for information.

5. Conclusions

This study was carried out to assess the effectiveness of weather information dissemination among farmers and policy makers in Nigeria, South Sudan and Uganda. We found that the majority of the respondents had access to technology needed to access weather and climate information. Although those who receive weather information from NMAs noted that the forecast was good, they further noted that there is more room for improvement, such as making the forecasts location-specific, ensuring mobile access is adequate in all regions, provision of weather information by SMS and through improved timing of the weather information dissemination process. Finally, uncertainty about the accuracy of weather information and the weather information not meeting specific needs are key barriers to people’s willingness to pay for it. We recommend improved collaboration between the NMAs and other sectors to improve weather information access while adoption of innovative sensitization approaches will enable improved understanding and utilization of weather products. A deeper analysis of weather information requirements for key sectors such as health, water resources, transport and tourism and collaborations with NMAs on innovative ICT-based approaches to weather dissemination is important in order to improve weather dissemination effectiveness.

6. Limitations to the Study

The study was carried out at the time when most of the countries were on lockdown, with restrictions on movement. Hence, limiting the number of respondents and restricting the questionnaire administration to online Google forms.

Author Contributions

This study was conceptualized by J.S.-O.; The design and administering of data collection instruments was done by A.M., B.F., M.O., O.O., D.M., B.K., P.A., S.O.A., M.A.A., V.O.-T., Y.B., R.A.; The introduction was written by M.N. and J.S.-O.; Presentation of the results was done by I.M., N.K., R.I.O. and M.N.; J.S.-O. contributed on discussing the results including writing the conclusion. All authors have read and agreed to the published version of the manuscript.

Funding

This research was funded by the Global Challenges Research Fund (GCRF) under the networking grant category through a project entitled “IMAgINe: ICT-enabled Multi-sector-based Approach to weather Information”.

Institutional Review Board Statement

Not applicable.

Informed Consent Statement

Informed consent was obtained from all participants involved in the study.

Data Availability Statement

The data used in this study can be made available on request by the WIMEA-ICT LAB under the college of computing and information science, Makerere University ([email protected]).

Acknowledgments

The following institutions provided research support to this study: The Institute of Development Studies in the UK together with five African academic partners (namely Makerere University in Uganda, the Regional Institute of Population Studies (RIPS) at University of Ghana, Dar es Salaam Institute of Technology in Tanzania, University of Juba in South Sudan and University of Lafia in Nigeria). The academic partners collaborated with the National Meteorological Agencies in each country i.e., Uganda National Meteorological Authority in Uganda, GMet in Ghana, Tanzania Meteorological Authority in Tanzania, South Sudan Meteorological Service in South Sudan and Nigeria Meteorological Agency (NiMet) in Nigeria. We also acknowledge the effort from student interns who supported the weather information dissemination system [28] under the WIMEA-ICT lab of Makerere University.

Conflicts of Interest

We declare no conflict of interest.

References

  1. Kron, W.; Löw, P.; Kundzewicz, Z.W. Changes in risk of extreme weather events in Europe. Environ. Sci. Policy 2019, 100, 74–83. [Google Scholar] [CrossRef]
  2. Ayanlade, A.; Omotoso, F.E.; Bisiriyu, L.A.; Jegede, M.O.; Ayanlade, O.S. Communicating Climate Change Impacts as Manifested in Extreme Weather: A Case of Newspapers’ Reports in Nigeria; Springer Science and Business Media LLC: Cham, Switzerland, 2020; pp. 401–421. [Google Scholar]
  3. Ongoma, V.; Chen, H.; Omony, G.W. Variability of extreme weather events over the equatorial East Africa, a case study of rainfall in Kenya and Uganda. Arch. Meteorol. Geophys. Bioclimatol. Ser. B 2018, 131, 295–308. [Google Scholar] [CrossRef]
  4. Horton, R.M.; Mankin, J.; Lesk, C.; Coffel, E.; Raymond, C. A Review of Recent Advances in Research on Extreme Heat Events. Curr. Clim. Chang. Rep. 2016, 2, 242–259. [Google Scholar] [CrossRef]
  5. Ohba, M.; Sugimoto, S. Differences in climate change impacts between weather patterns: Possible effects on spatial heterogeneous changes in future extreme rainfall. Clim. Dyn. 2019, 52, 4177–4191. [Google Scholar] [CrossRef]
  6. Dunning, C.M.; Black, E.; Allan, R. Later Wet Seasons with More Intense Rainfall over Africa under Future Climate Change. J. Clim. 2018, 31, 9719–9738. [Google Scholar] [CrossRef] [Green Version]
  7. Mugume, I.; Shen, S.; Tao, S.; Mujuni, G. Analysis of temperature variability over desert and urban areas of Northern China. J. Clim. Weather Forecast. 2016, 4, 2. [Google Scholar] [CrossRef] [Green Version]
  8. Segun, O.E.; Shohaimi, S.; Nallapan, M.; Lamidi-Sarumoh, A.A.; Salari, N. Statistical Modelling of the Effects of Weather Factors on Malaria Occurrence in Abuja, Nigeria. Int. J. Environ. Res. Public Health 2020, 17, 3474. [Google Scholar] [CrossRef] [PubMed]
  9. Acevedo, S.; Mrkaic, M.; Novta, N.; Pugacheva, E.; Topalova, P. The Effects of Weather Shocks on Economic Activity: What are the Channels of Impact? J. Macroecon. 2020, 65, 103207. [Google Scholar] [CrossRef]
  10. Ngailo, T.J.; Shaban, N.; Reuder, J.; Mesquita, M.D.S.; Rutalebwa, E.; Mugume, I.; Sangalungembe, C. Assessing Weather Research and Forecasting (WRF) Model parameterization schemes skill to simulate extreme rainfall events over Dar es Salaam on 21 December. J. Geosci. Environ. Prot. 2018, 6, 36. [Google Scholar]
  11. Du Plessis, J.A.; Schloms, B. An investigation into the evidence of seasonal rainfall pattern shifts in the Western Cape, South Africa. J. S. Afr. Inst. Civ. Eng. 2017, 59, 47–55. [Google Scholar] [CrossRef] [Green Version]
  12. Ngailo, T.; Shaban, N.; Reuder, J.; Rutalebwa, E.; Mugume, I. Non homogeneous poisson process modelling of seasonal extreme rainfall events in Tanzania. Int. J. Sci. Res. 2016, 5, 1858–1868. [Google Scholar]
  13. Tumwine, G.N.; Lokina, R.B.; Matovu, J.M. The Effect of Climate Change on Agricultural Crop Returns in Uganda. J. Econ. Behav. Stud. 2019, 11, 71–87. [Google Scholar] [CrossRef] [Green Version]
  14. Mugume, I.; Mesquita, M.D.S.; Basalirwa, C.; Bamutaze, Y.; Reuder, J.; Nimusiima, A.; Waiswa, D.; Mujuni, G.; Tao, S.; Ngailo, T.J. Patterns of Dekadal Rainfall Variation Over a Selected Region in Lake Victoria Basin, Uganda. Atmosphere 2016, 7, 150. [Google Scholar] [CrossRef] [Green Version]
  15. Nkrumah, F.; Vischel, T.; Panthou, G.; Klutse, N.A.B.; Adukpo, D.C.; Diedhiou, A. Recent Trends in the Daily Rainfall Regime in Southern West Africa. Atmosphere 2019, 10, 741. [Google Scholar] [CrossRef] [Green Version]
  16. Dickinson, K.L.; Monaghan, A.J.; Rivera, I.J.; Hu, L.; Kanyomse, E.; Alirigia, R.; Adoctor, J.; Kaspar, R.; Oduro, A.R.; Wiedinmyer, C. Changing weather and climate in Northern Ghana: Comparison of local perceptions with meteorological and land cover data. Reg. Environ. Chang. 2017, 17, 915–928. [Google Scholar] [CrossRef]
  17. Kikulwe, E.M.; Okurut, S.; Ajambo, S.; Nowakunda, K.; Stoian, D.; Naziri, D. Postharvest Losses and their Determinants: A Challenge to Creating a Sustainable Cooking Banana Value Chain in Uganda. Sustainability 2018, 10, 2381. [Google Scholar] [CrossRef] [Green Version]
  18. Zscheischler, J.; Martius, O.; Westra, S.; Bevacqua, E.; Raymond, C.; Horton, R.M.; van den Hurk, B.; Agha Kouchak, A.; Jézéquel, A.; Mahecha, M.D.; et al. A typology of compound weather and climate events. Nat. Rev. Earth Environ. 2020, 1, 333–347. [Google Scholar] [CrossRef]
  19. Amikuzuno, J. Socioeconomic Impacts of Climate Change on the Livelihood and Adaptation Strategies of Smallholder Farmers in the Upper White Volta Basin of Ghana. In Strategies for Building Resilience against Climate and Ecosystem Changes in Sub-Saharan Africa. Science for Sustainable Societies; Saito, O., Kranjac-Berisavljevic, G., Takeuchi, K., A. Gyasi, E., Eds.; Springer: Singapore, 2018. [Google Scholar] [CrossRef]
  20. Barrett, S.; Ndegwa, W.; Maggio, G. The value of local climate and weather information: An economic valuation of the decentralised meteorological provision in Kenya. Clim. Dev. 2021, 13, 173–188. [Google Scholar] [CrossRef]
  21. Etwire, P.M.; Buah, S.; Ouédraogo, M.; Zougmoré, R.; Partey, S.T.; Martey, E.; Dayamba, S.D.; Bayala, J. An assessment of mobile phone-based dissemination of weather and market information in the Upper West Region of Ghana. Agric. Food Secur. 2017, 6, 1–9. [Google Scholar] [CrossRef] [Green Version]
  22. Marie, M.; Yirga, F.; Haile, M.; Tquabo, F. Farmers’ choices and factors affecting adoption of climate change adaptation strategies: Evidence from northwestern Ethiopia. Heliyon 2020, 6, e03867. [Google Scholar] [CrossRef]
  23. Nyakaisiki, K.; Mugume, I.; Ngailo, T.; Nakabugo, R. The Use of Indigenous Knowledge in Predicting Changes in Seasonal Rainfall by Smallholder Farmers of Ruteete Subcounty, Kabarole District. J. Geosci. Environ. Prot. 2019, 07, 13–22. [Google Scholar] [CrossRef] [Green Version]
  24. Maguza-Tembo, F.; Mangison, J.; Edris, A.K.; Kenamu, E. Determinants of adoption of multiple climate change adaptation strategies in Southern Malawi: An ordered probit analysis. J. Dev. Agric. Econ. 2017, 9, 1–7. [Google Scholar]
  25. Singh, C.; Daron, J.; Bazaz, A.; Ziervogel, G.; Spear, D.; Krishnaswamy, J.; Zaroug, M.; Kituyi, E. The utility of weather and climate information for adaptation decision-making: Current uses and future prospects in Africa and India. Clim. Dev. 2018, 10, 389–405. [Google Scholar] [CrossRef] [Green Version]
  26. Saracevic, T. Relevance: A review of the literature and a framework for thinking on the notion in information science. Part II: Nature and manifestations of relevance. J. Am. Soc. Inf. Sci. Technol. 2007, 58, 1915–1933. [Google Scholar] [CrossRef]
  27. Mase, A.S.; Prokopy, L.S. Unrealized Potential: A Review of Perceptions and Use of Weather and Climate Information in Agricultural Decision Making. Weather. Clim. Soc. 2014, 6, 47–61. [Google Scholar] [CrossRef]
  28. Dissemination. WIMEA-ICT Weather Information Dissemination System. WIMEA-ICT Project. 2019. Available online: http://wids.mak.ac.ug/wids/ (accessed on 6 December 2021).
  29. Zhang, Y.; Wang, L.; Duan, Y. Agricultural information dissemination using ICTs: A review and analysis of information dissemination models in China. Inf. Process. Agric. 2016, 3, 17–29. [Google Scholar] [CrossRef] [Green Version]
  30. Ofoegbu, C.; New, M. Collaboration Relations in Climate Information Production and Dissemination to Subsistence Farmers in Namibia. Environ. Manag. 2021, 67, 133–145. [Google Scholar] [CrossRef]
  31. Buckland, S.F.; Campbell, D. An assessment of factors influencing awareness, access and use of agro-climate services among farmers in Clarendon, Jamaica. Geoforum 2021, 126, 171–191. [Google Scholar] [CrossRef]
  32. Uccellini, L.W.; Hoeve, J.E.T. Evolving the National Weather Service to Build a Weather-Ready Nation: Connecting Observations, Forecasts, and Warnings to Decision-Makers through Impact-Based Decision Support Services. Bull. Am. Meteorol. Soc. 2019, 100, 1923–1942. [Google Scholar] [CrossRef]
  33. Wehde, W.; Ripberger, J.T.; Jenkins-Smith, H.; Jones, B.A.; Allan, J.N.; Silva, C.L. Public Willingness to Pay for Continuous and Probabilistic Hazard Information. Nat. Hazards Rev. 2021, 22, 04021004. [Google Scholar] [CrossRef]
  34. Kox, T.; Kempf, H.; Lüder, C.; Hagedorn, R.; Gerhold, L. Towards user-orientated weather warnings. Int. J. Disaster Risk Reduct. 2018, 30, 74–80. [Google Scholar] [CrossRef]
  35. Gbangou, T.; Sarku, R.; Van Slobbe, E.; Ludwig, F.; Kranjac-Berisavljevic, G.; Paparrizos, S. Coproducing Weather Forecast Information with and for Smallholder Farmers in Ghana: Evaluation and Design Principles. Atmosphere 2020, 11, 902. [Google Scholar] [CrossRef]
  36. Ripberger, J.; Jenkins-Smith, H.C.; Silva, C.L.; Carlson, D.E.; Henderson, M. Social Media and Severe Weather: Do Tweets Provide a Valid Indicator of Public Attention to Severe Weather Risk Communication? Weather. Clim. Soc. 2014, 6, 520–530. [Google Scholar] [CrossRef]
Figure 1. Theoretical framework of the study.
Sustainability 14 03870 g001
Figure 2. The study area: Uganda (in Wakiso, Kampala and Kamuli districts), South Sudan (in East equatorial and Central equatorial) and Nigeria (in Borno, FCT Abuja and Delta states).
Sustainability 14 03870 g002
Figure 3. Percentage of respondents organized by gender in the three countries.
Sustainability 14 03870 g003
Figure 4. Percentage of respondents (farmers) and the period of stay in the area, organized by country.
Sustainability 14 03870 g004
Figure 5. The sectors of respondents (policy makers and service providers) responsible for weather and climate information dissemination.
Sustainability 14 03870 g005
Figure 6. Percentage of respondents (farmers) with access to weather forecast and advisory information.
Sustainability 14 03870 g006
Figure 7. Percentage of respondents and the source of weather information -farmers (on left), policy makers and service providers (right).
Sustainability 14 03870 g007
Figure 8. Percentage of respondents (policy makers) and the weather parameters they observe/require, organized by country.
Sustainability 14 03870 g008
Figure 9. Percentage of respondents (farmers) and the weather products received, organized by country.
Sustainability 14 03870 g009
Figure 10. Frequency of weather products being received by farmers and policy makers—farmers (on the top), policy makers (on the bottom).
Sustainability 14 03870 g010
Figure 11. Percentage of respondents (farmers) that like or dislike the way weather products are formatted and presented.
Sustainability 14 03870 g011
Figure 12. Purpose of weather information—farmers (on the left), policy makers and service providers (on the right).
Sustainability 14 03870 g012
Figure 13. Benefits of weather information received by the policy makers.
Sustainability 14 03870 g013
Figure 14. Weather products farmers are willing to pay for in the three countries.
Sustainability 14 03870 g014
Figure 15. Amount in USD farmers are willing to pay for the weather products.
Sustainability 14 03870 g015
Figure 16. Factors that hinder farmers from paying for the weather products.
Sustainability 14 03870 g016
Figure 17. Percentage of respondents with knowledge of the existence and functions of NMAs in the three countries.
Sustainability 14 03870 g017
Figure 18. Number of seasons in a year experienced by the farmer in the three countries.
Sustainability 14 03870 g018
Figure 19. ICT tools and technology used to access weather information in the three countries.
Sustainability 14 03870 g019
Figure 20. Percentage of respondents having access to good quality mobile networks.
Sustainability 14 03870 g020
Figure 21. Percentage of respondents and the role of ICT in the weather and climate information cycle.
Sustainability 14 03870 g021
Figure 22. Collaborations that exist amongst sectors for policy makers and service providers.
Sustainability 14 03870 g022
Figure 23. The location of synoptic stations in the three countries (i.e., Nigeria, Uganda and South Sudan). The “dots” represent the geographical location for each synoptic station.
Sustainability 14 03870 g023
Figure 24. Framework for Improved Efficiency in Weather Information Dissemination.
Sustainability 14 03870 g024
Table 1. Respondents to the farmer questionnaire across the three countries.
CountryNumber of RespondentsPercentage (%)
Scheme 13313352
Nigeria5020
Uganda7128
Total254100
Table 2. The policy makers and service providers that participated in the study.
SectorSouth SudanNigeriaUganda
Academia10010
Local Government401
Water and Environment048
Agriculture408
Health009
ICT service providers16110
Humanitarian (NGO/ CBO)1109
Total45555
Table 3. Demographics of the study areas.
CountryAreaLand (Km2)Population
(People)
Main Economic
Activity
Nigeria (states)Nasarawa27,1171,869,377Agriculture and mining
Borno70,8985,860,200Agriculture and Trade
FCT Abuja73153,095,118Trade, Industry, Agriculture
Delta 17,6985,663,400Oil and Agriculture
Kaduna46,0531,133,430Agriculture and Trade
Uganda (districts)Kampala1891,680,000Industry and Trade
Wakiso 1906.71,997,418Trade, Industry,
Agriculture
Kamuli1557500,800Agriculture, Fishing, Trade, Quarrying
South Sudan (states)Central
Equatoria
43,0331,103,592Unknown
Eastern
Equatoria
73,472906,126Unknown
Table 4. Showing the relationship between the type of forecast and the purpose of the forecasts.
Agriculture Drought/Flood Management Monitoring and Managing Water LevelsProduction Activities Domestic Water SupplyRow Totals
Daily2 (3.66) [0.75]10 (8.73) [0.18]3 (1.41) [1.80]4 (4.23) [0.01]1 (1.97) [0.48]20
Seasonal2 (3.11) [0.40]7 (7.42) [0.02]1 (1.20) [0.03]5 (3.59) [0.55]2 (1.68) [0.06]17
10 day6 (2.93) [3.22]9 (6.99) [0.58]0 (1.13) [1.13]1 (3.38) [1.68]0 (1.58) [1.58]16
Monthly1 (0.92) [0.01]1 (2.18) [0.64]0 (0.35) [0.35]2 (1.06) [0.84]1 (0.49) [0.52]5
Seasonal2 (3.11) [0.40]7 (7.42) [0.02]1 (1.20) [0.03]5 (3.59) [0.55]2 (1.68) [0.06]17
No response2 (2.38) [0.06]4 (5.68) [0.49]1 (0.92) [0.01]3 (2.75) [0.02]3 (1.28) [2.30]13
Sub total1331515771 (Grand Total)
The Chi-square statistic is 17.7322. The p-value is 0.339813. The result is not significant at p < 0.05.
Table 5. Chi-square analysis between whether the access to enabling ICT technology by farmers is dependent on the format the forecasts are made.
Like the Way Weather Products Are FormattedDon’t Like the Way Weather Products Are FormattedRow Totals
Smart phones9 (8.00) [0.12]7 (8.00) [0.12]16
Feature Phone6 (5.00) [0.20]4 (5.00) [0.20]10
Radio9 (8.50) [0.03]8 (8.50) [0.03]17
TV7 (9.50) [0.66]12 (9.50) [0.66]19
FB and Email4 (4.00) [0.00]4 (4.00) [0.00]8
Column Totals353570 (Grand Total)
The Chi-square statistic is 2.0246. The p-value is 0.731232. The result is not significant at p < 0.05.
Table 6. Chi-square analysis between access to forecasts and access to enabling ICT technologies.
Access to ForecastsNo Access to Forecasts Marginal Row Totals
Access to enabling ICT technology34 (37.32) [0.3]19 (15.68 [0.7]53
No Access to enabling ICT technology16 (12.68) [0.87]2 (5.32) [2.08]18
Marginal Column Totals502171 (Grand Total)
The Chi-square statistic is 3.9477. The p-value is 0.046935. Significant at p < 0.05. The chi-square statistic with Yates correction is 2.8494. The p-value is 0.09141. Not significant at p < 0.05.
Publisher’s Note: MDPI stays neutral with regard to jurisdictional claims in published maps and institutional affiliations.

