Article

Changes in Mangrove Carbon Stocks and Exposure to Sea Level Rise (SLR) under Future Climate Scenarios

by
Minerva Singh
1,*,
Luitgard Schwendenmann
2,
Gang Wang
3,
Maria Fernanda Adame
4 and
Luís Junior Comissario Mandlate
5
1
Centre for Environmental Policy, Imperial College London, London SW7 2BX, UK
2
School of Environment, The University of Auckland, Private Bag 92019, Auckland 1142, New Zealand
3
School of Management, Guangdong University of Technology, Guangzhou 510520, China
4
Centre for Marine and Coastal Research, Australian Rivers Institute, Griffith University, Brisbane, QLD 4222, Australia
5
Forestry Engineering Course, Agriculture Division, Higher Polytechnic Institute of Gaza (ISPG), Chokwe 1204, Mozambique
*
Author to whom correspondence should be addressed.
Sustainability 2022, 14(7), 3873; https://doi.org/10.3390/su14073873
Submission received: 25 January 2022 / Revised: 11 March 2022 / Accepted: 15 March 2022 / Published: 25 March 2022

Abstract

:
Mangrove ecosystems are threatened by a variety of anthropogenic changes, including climate change. The main aim of this research is to quantify the spatial variation in the different mangrove carbon stocks, aboveground carbon (AGC), belowground carbon (BGC), and soil carbon (SOC), under future climate scenarios. Additionally, we sought to identify the magnitude of sea-level rise (SLR) exposure with the view of identifying the mangrove regions most likely to face elevated inundation. Different representative concentration pathways (RCPs) ranging from the most optimistic (RCP 2.6) to medium emissions (RCP 4.5) and the most pessimistic (RCP 8.5) were considered for 2070. We used the Marine Ecoregions of the World (MEOW), a biogeographical classification of coastal ecosystems, to quantify the variation in future carbon stocks at a regional scale and identify areas of potential carbon stock losses and gains. Here, we showed that the mangroves of Central and Western Indo-Pacific islands (Andamans, Papua New Guinea, and Vanuatu), the west African coast, and northeastern South America will be the worst hit and are projected to affect all three carbon stocks under all future scenarios. For instance, the Andaman ecoregion is projected to have an 11–25% decline in SOC accumulation, while the Western Indo-Pacific realm is projected to undergo the sharpest declines, ranging from 10% to 12% under all three scenarios. Examples of these areas are those in Amazonia and the eastern part of South Asia (such as in the Northern Bay of Bengal ecoregion). Based on these findings, conservation management of mangroves can be conducted.

1. Introduction

Mangrove ecosystems found in intertidal and coastal zones, such as those in the deltas of the Bay of Bengal, the Ganges, Irrawaddy, and Mekong Rivers, provide vital ecosystem services including provisioning services (e.g., fish, fuelwood, and materials) and regulating services (e.g., coastal protection, flood prevention, and water quality) [1]. In addition to these services, mangroves are also important in climate mitigation via carbon sequestration. They can store up to five times more carbon per hectare as compared to other vegetated ecosystems [2], such as tropical evergreen rainforests. Due to the high ability of mangroves to sequester carbon, mangrove ecosystems are vital for maintaining the global carbon cycle [3].
The carbon sequestration potential of mangrove ecosystems varies across geographic regions and is governed by local factors relating to forest structure and biophysical characteristics [4,5]. The ability to sequester carbon is dependent on plant growth and more importantly on hydrology and geomorphic characteristics, such as sea level rise history. For instance, tropical mangrove ecosystems store larger carbon stocks (895 ± 90 t C ha−1) than subtropical or temperate forests (547 ± 66 t C ha−1) [6]. Additionally, mangrove forest structure is also controlled by a variety of bioclimatic factors, notably precipitation and temperature [7]. The regional variation in these bioclimatic factors has a much greater impact on biomass variation than latitudinal factors [8]. In fact, previous studies that have provided estimates on mangrove aboveground biomass (ABG) both at local and regional scales used models based on bioclimatic variables that included both temperature and precipitation [9,10].
Mangroves are threatened by a variety of anthropogenic factors, including climate change, degradation, deforestation, and land conversion to aquaculture farms [11]. Climate-related factors such as increasing temperatures, altered precipitation patterns, changes in sea level, and frequency of storms are threatening mangroves at regional scales [12]. Despite the role that mangroves can play in influencing climate change mitigation efforts [13], there currently exist no global-scale studies on how mangrove carbon stocks may vary under future climate scenarios. The term blue carbon has been used to refer to integrated ecosystem-level carbon assessments (i.e., in coastal and marine environments, carbon stored in biomass and soil combined) with aboveground (AGC), belowground (BGC), and soil organic carbon (SOC) being the most common measures [11,13,14,15,16]. BGC corresponds to woody (axial roots) and nonwoody (fine roots) tissues present in the tree’s root systems [17]. It is one of the five primary carbon reserves in forested areas [18] and represents one of the largest carbon stocks in tropical regions [19]. Both AGC and BGC are components of vegetation biomass, while SOC is composed of dead roots and allochthonous material deposited during tidal inundation. It has been recommended that SOC be fully incorporated into national climate change mitigation policies [20]. However, many previous studies on global and regional mangrove blue carbon have focused on evaluating the aboveground stocks alone [9,21,22], yet examples exist indicating the relative importance of belowground and soil stocks. For example, in Indonesia alone, mangroves provide, on average, a total blue carbon storage of 950.5 Mg C ha−1 [23], with more than 700 Mg C/ha from soil carbon. Hence, it is vital to quantify the spatial variation in the different carbon stocks instead of just focusing on AGC. This evaluation can be carried out under future climate scenarios to identify areas projected to gain or lose their carbon stocks, with significant conservation implications.
The lack of a clear, comprehensive biogeographic system to classify the seas has complicated efforts to monitor progress, as well as to strategically plan and prioritize new marine conservation initiatives. The Marine Ecoregions of the World, or MEOW, is a nested system of 12 realms, 62 provinces, and 232 ecoregions that covers coastal and shelf areas across the world [24].
This system has a far higher spatial resolution than previous global systems, yet it still retains many common characteristics and may be cross-referenced with a variety of regional biogeographic categories. MEOW acts as a unit of analysis, owing to relatively homogeneous compositions and biogeographical driving agents (for example, nutrient inputs, freshwater influx, temperature, currents, and coastal complexity) [25]. The use of the hierarchical MEOW classifications aims to support conservation priority setting for the marine sphere [25]. Realms are the largest spatial units in the MEOW system. These are composed of large regions of coastal, benthic, or pelagic ocean across which biotas are internally coherent at higher taxonomic levels because of a shared and unique evolutionary history. They have elevated levels of endemism, including unique taxa at generic and family levels in some groups. On the other hand, provinces are large areas defined by the presence of distinct biotas that have at least some cohesions over evolutionary time frames. They will hold some level of endemism, principally at the species level. Lastly, ecoregions are the smallest scale units in the MEOW system. These are areas of homogeneous species composition, clearly distinct from adjacent systems. The species composition is likely to be determined by the predominance of a small number of ecosystems and/or a distinct suite of oceanographic or topographic features [24].
The marine categorizations are based on abiotic and biotic characteristics of the coastal ocean [24]. They were developed from previous biogeographic classifications, published information, grey literature, and expert opinion, and they have been extremely useful for the study of ecological patterns and management of marine resources at a global scale [26], including carbon stocks and emissions from mangrove forests [27]. Additionally, the projected change in mangrove areas in terms of inundation because of SLR is expected to vary across different emissions scenarios and regions [28,29,30]. However, the impact of changes in SLR in terms of inundation impacts has not been systematically assessed on a global scale.
The main objectives of this study are to (i) quantify the variation in mangrove carbon (AGC, BGC, and SOC) stocks across different marine bioregion settings under the present climatic conditions, (ii) quantify the variation in mangrove carbon stocks across marine bioregions under different emissions scenarios for 2070, and (iii) identify the most important variables that explain the variation in mangrove carbon stocks under future scenarios. The year 2070 is used because most future prediction data are available for said period. Furthermore, soil erosion data are currently only available for 2070, as well as projected future data for 2070, which have been used in several ecological studies [31,32,33,34]. This study will identify which of the hierarchical categorizations (realms, provinces, or ecoregions) has the greatest role on influencing carbon stock variation and identify the areas that are projected to have notable changes in the different carbon stocks. Finally, we will also quantify the SLR-driven inundation exposure of these categorizations. We believe identifying changes in carbon variation, especially areas predicted to undergo steep biomass declines and/or elevated SLR exposure, can support future mangrove conservation prioritization.

2. Materials and Methods

2.1. Mangrove Data

In order to identify the spatial variation in carbon stocks, we used the Marine Ecoregions of the World (MEOW) framework, which is a nested system of 12 realms, 62 provinces, and 232 ecoregions. The database aims to capture the generic patterns of biodiversity and habitats present within the marine and coastal regions [24]. Since MEOW is a global-scale database, only the areas that overlapped with the mangrove distribution as mapped by Giri et al. [35] were retained. The final mangrove-dominated MEOW categorizations retained as a part of this research are tabulated in Table 1.
For this research, AGB field data for different tropical and sub-tropical mangroves across the world were obtained from a combination of peer-reviewed published articles and the Sustainable Wetlands Adaptation and Mitigation Program (SWAMP), a free-access mangrove biomass database [36]. The Sustainable Wetlands Adaptation and Mitigation Program is a collaborative effort by the Center for International Forestry Research (CIFOR) and the USDA Forest Service (USFS) with support from the US Agency for International Development (USAID) [36]. SWAMP has led a number of wetland research studies around the tropics, including extensive mangrove forest mensuration data, sponsored a number of trainings to build local and regional competence, and collaborated with policymakers and natural resource officials to develop adaptation and mitigation plans [37]. List of AGB sources (other than the SWAMP data) used in this research has been provided in the Supplementary File S1. Belowground biomass (BGB) was derived from the field AGB data, using the conversion factor of 0.5, which has been consistently used across recent global C stock estimates in mangroves to derive BGB directly from AGB [7,9,16,38]. Soil carbon data were obtained from Sanderman et al. [39]. The SOC stock was obtained by the authors at 1 m depth in Mg C/ha while the aboveground biomass and BGB were converted to aboveground and belowground carbon stocks (AGC and BGC, respectively) using a conversion factor of 0.47 [40,41].

2.2. Data for Predictors

To predict the variation in carbon stocks, the following variables were considered under the present and future time periods: bioclimate, topography, mangrove species richness, and soil erosion by water. Bioclimatic variables function as proxies for both edaphic and biological factors and thus are important determinants of carbon stocks [42]. Nineteen bioclimatic variables that represent annual, seasonal, and extreme climatic trends relating to precipitation and temperature were obtained from the WorldClim database [43] (see Supplementary File S2). These data were obtained at 1 km spatial resolution for both the present and future time period (2070).
Representative concentration pathways, or RCP scenarios, were used in this study. RCP is a set of four new pathways developed for the climate modeling community as a basis for long-term and near-term modeling experiments. The core of the RCP concept is that any single path of radiative forcing can be generated by multiple socio-economic, technological, and policy development scenarios [44]. The four RCPs together span the range of year 2100 radiative forcing values found in the open literature, i.e., from 2.6 to 8.5 W/m2 [45]. In this study, three scenarios were considered: RCP 2.6, 4.5, and 8.5. These represent a radiative forcing of ~3 W/m2, 4.5 W/m2, and 8.5 W/m2, respectively [46]. RCP 2.6 provides the lowest possible carbon dioxide emissions; RCP 4.5 provides milder emission scenarios, where GHG emissions increase slightly and reach a peak around 2040. RCP 8.5 is an extreme case, where GHG emissions are three times higher than the current atmospheric level. Thus, RCP 2.6, RCP 4.5, and RCP 8.5 relate to the radiative forcing of 2.6 W/m2, 4.5 W/m2, and 8.5 W/m2, respectively [44]. RCP 8.5 is the most pessimistic of scenarios with CO2 emissions increasing at a high rate during the first part of the century, and while they stabilize by 2100, the concentrations of CO2 are over three times those in 2000 [47].
In this study, for AGC and BGC, annual temperature (BIO1), temperature seasonality (BIO4), annual precipitation (BIO12), and precipitation seasonality (BIO15) were included for both present and future scenarios as performed by [9,47]. For soil carbon, only BIO1 and BIO12 were considered as performed by [42,48,49]. An increase in rainfall may lead to an expansion of mangrove ecosystems because it helps ensure flushing of soils and sediments, thus minimizing the degree of salt stress for mangroves. On the other hand, a decrease in rainfall may reduce the geographic area where mangroves grow. In addition to bioclimatic variables, coastal erosion was considered for all three scenarios [50]. Previous studies showed that an increase in temperature may already be leading mangrove expansion into higher latitudes around the globe, even increasing mangrove productivity where temperature does not exceed an upper threshold [51].
Shuttle radar topographic mission (SRTM) digital elevation model (DEM) was obtained from USGS Earth Explorer. The SRTM elevation data are a globally consistent source of elevational data, which can also be used to derive other topographic products such as slope, roughness, and topographic wetness index [52]. Topographic products such as those obtained from SRTM DEM have been previously used for mangrove biomass estimates [53], where a landscape scale map of mean tree height in mangrove forests in Everglades National Park was produced using the elevation data from the SRTM. Mangrove species distribution data were obtained from the IUCN Red List of mangrove species. Species diversity has a positive association with mangrove carbon stocks [54] and was therefore included in the analysis. This was used to derive mangrove species richness by extracting a presence–absence matrix for the mangrove species using the letsR package of the R programming language. The presence–absence values for the mangrove species richness were summed to obtain a species richness raster at 1 km resolution [55]. The full list of predictors, presented in Table 2, includes:

2.3. Data Analysis for Quantifying Biomass Variation under the Different Scenarios

Random forest (RF) is an ensemble-based machine learning algorithm that creates many decision trees and provides response variable (a continuous numerical variable such as biomass) estimates by averaging the predictions of all regression trees [55]. The decision trees are created using bootstrap resampling from the original dataset [18]. For a dataset with n features, the square root of n may be used in each subset [40]. Compared to statistical techniques, random forest models are not as strongly affected by the number of predictor variables or the correlation between these [42]. The RF algorithm has been extensively used for mapping the spatial distribution of biomass using a combination of field data and spatial data [18,19]. In this research, the carbon stock variables (AGC, BGC, and SOC) were taken as response variables, and the random forest model was implemented using the “caret” package of the R programming language [56]. To assess the performance of the random forest models, we implemented leave-one-out cross-validation (LOOCV). LOOCV sequentially removes one observation from the dataset and fits the model to the (n − 1) data observations. This model is then tested/validated on the observation that was left out. This process is repeated iteratively, and the test error rate observed in each of the iterations is averaged to help reduce overfitting and provide unbiased error rates [57]. The accuracy of these random forest models was evaluated by computing the Pearson’s correlation coefficient between the actual and model-predicted AGB values [57]. Additionally, the most important variables influencing the variation in carbon stock values were identified, along with the role of the most important predictors in influencing carbon stocks under different scenarios. For the latter, partial difference plots of the most influential predictor variables were derived using partial dependence plots (PDPs) that help visualize non-linear and complex relationships, along with the direction of the relationship between the response and predictor variable [55] (see Supplementary File S3).

2.4. Sea Level Rises (SLR) under Future Climate Scenarios

The Intergovernmental Panel on Climate Change (IPCC) predicts that global SLR may increase by approximately 0.28 to 1.4 m by the end of the 21st century. The magnitude of the projected SLR increase varies under the different RCP scenarios. We considered the RCP 2.6 and 8.5 SLR scenario for 2100 as 0.30–0.65 m for RCP 2.6 and 0.63–1.32 m for RCP 8.5 [58]. A digital elevation model (DEM) was used to identify areas susceptible to SLR-induced inundation under the RCP 2.6 and RCP 8.5 scenarios [59]. For this analysis, we used the multi-error-removed improved-terrain (MERIT) DEM, which is available for all land areas between 90° north and 60° south latitude at 3-arc-s (90-m) grid spacing [60]. The MERIT DEM is free of multiple elevation errors that exist in other global DEMs such as SRTM. Due to the improved accuracy of the elevation representation of flat regions, the MERIT DEM is especially helpful for flood inundation modeling [61]. The DEM pixels whose elevation was below the SLR specified in the scenarios were defined as inundation areas. Such inundation areas were assigned with values of 1, and other areas were given values of 0. It is assumed that the areas with an inundation value of 1 are not suitable for sustaining mangroves in an inundation-only scenario [28,59]. We acknowledge that there are limitations to these assumptions, as the capacity of mangroves to keep pace to SLR is determined not only by inundation level but also by sediment availability and sea level rise history [62]. However, these analyses allowed us to compare globally regions that are likely to be more exposed to the effects of SLR.
The magnitude of each ecoregion’s exposure to projected SLR has been computed using dimension index (DI).
DI = (X − Min)/(Max − Min)
where X = predicted sea-level change for an ecoregion, Min = minimum predicted sea level for all ecoregions, and Max = maximum predicted sea level for all ecoregions under the different scenarios. DI varies from 0 to 1, where ecoregions with high scores are interpreted as having high exposure to sea-level change, and the sub-district with low scores is considered as having low exposure [63].

3. Results

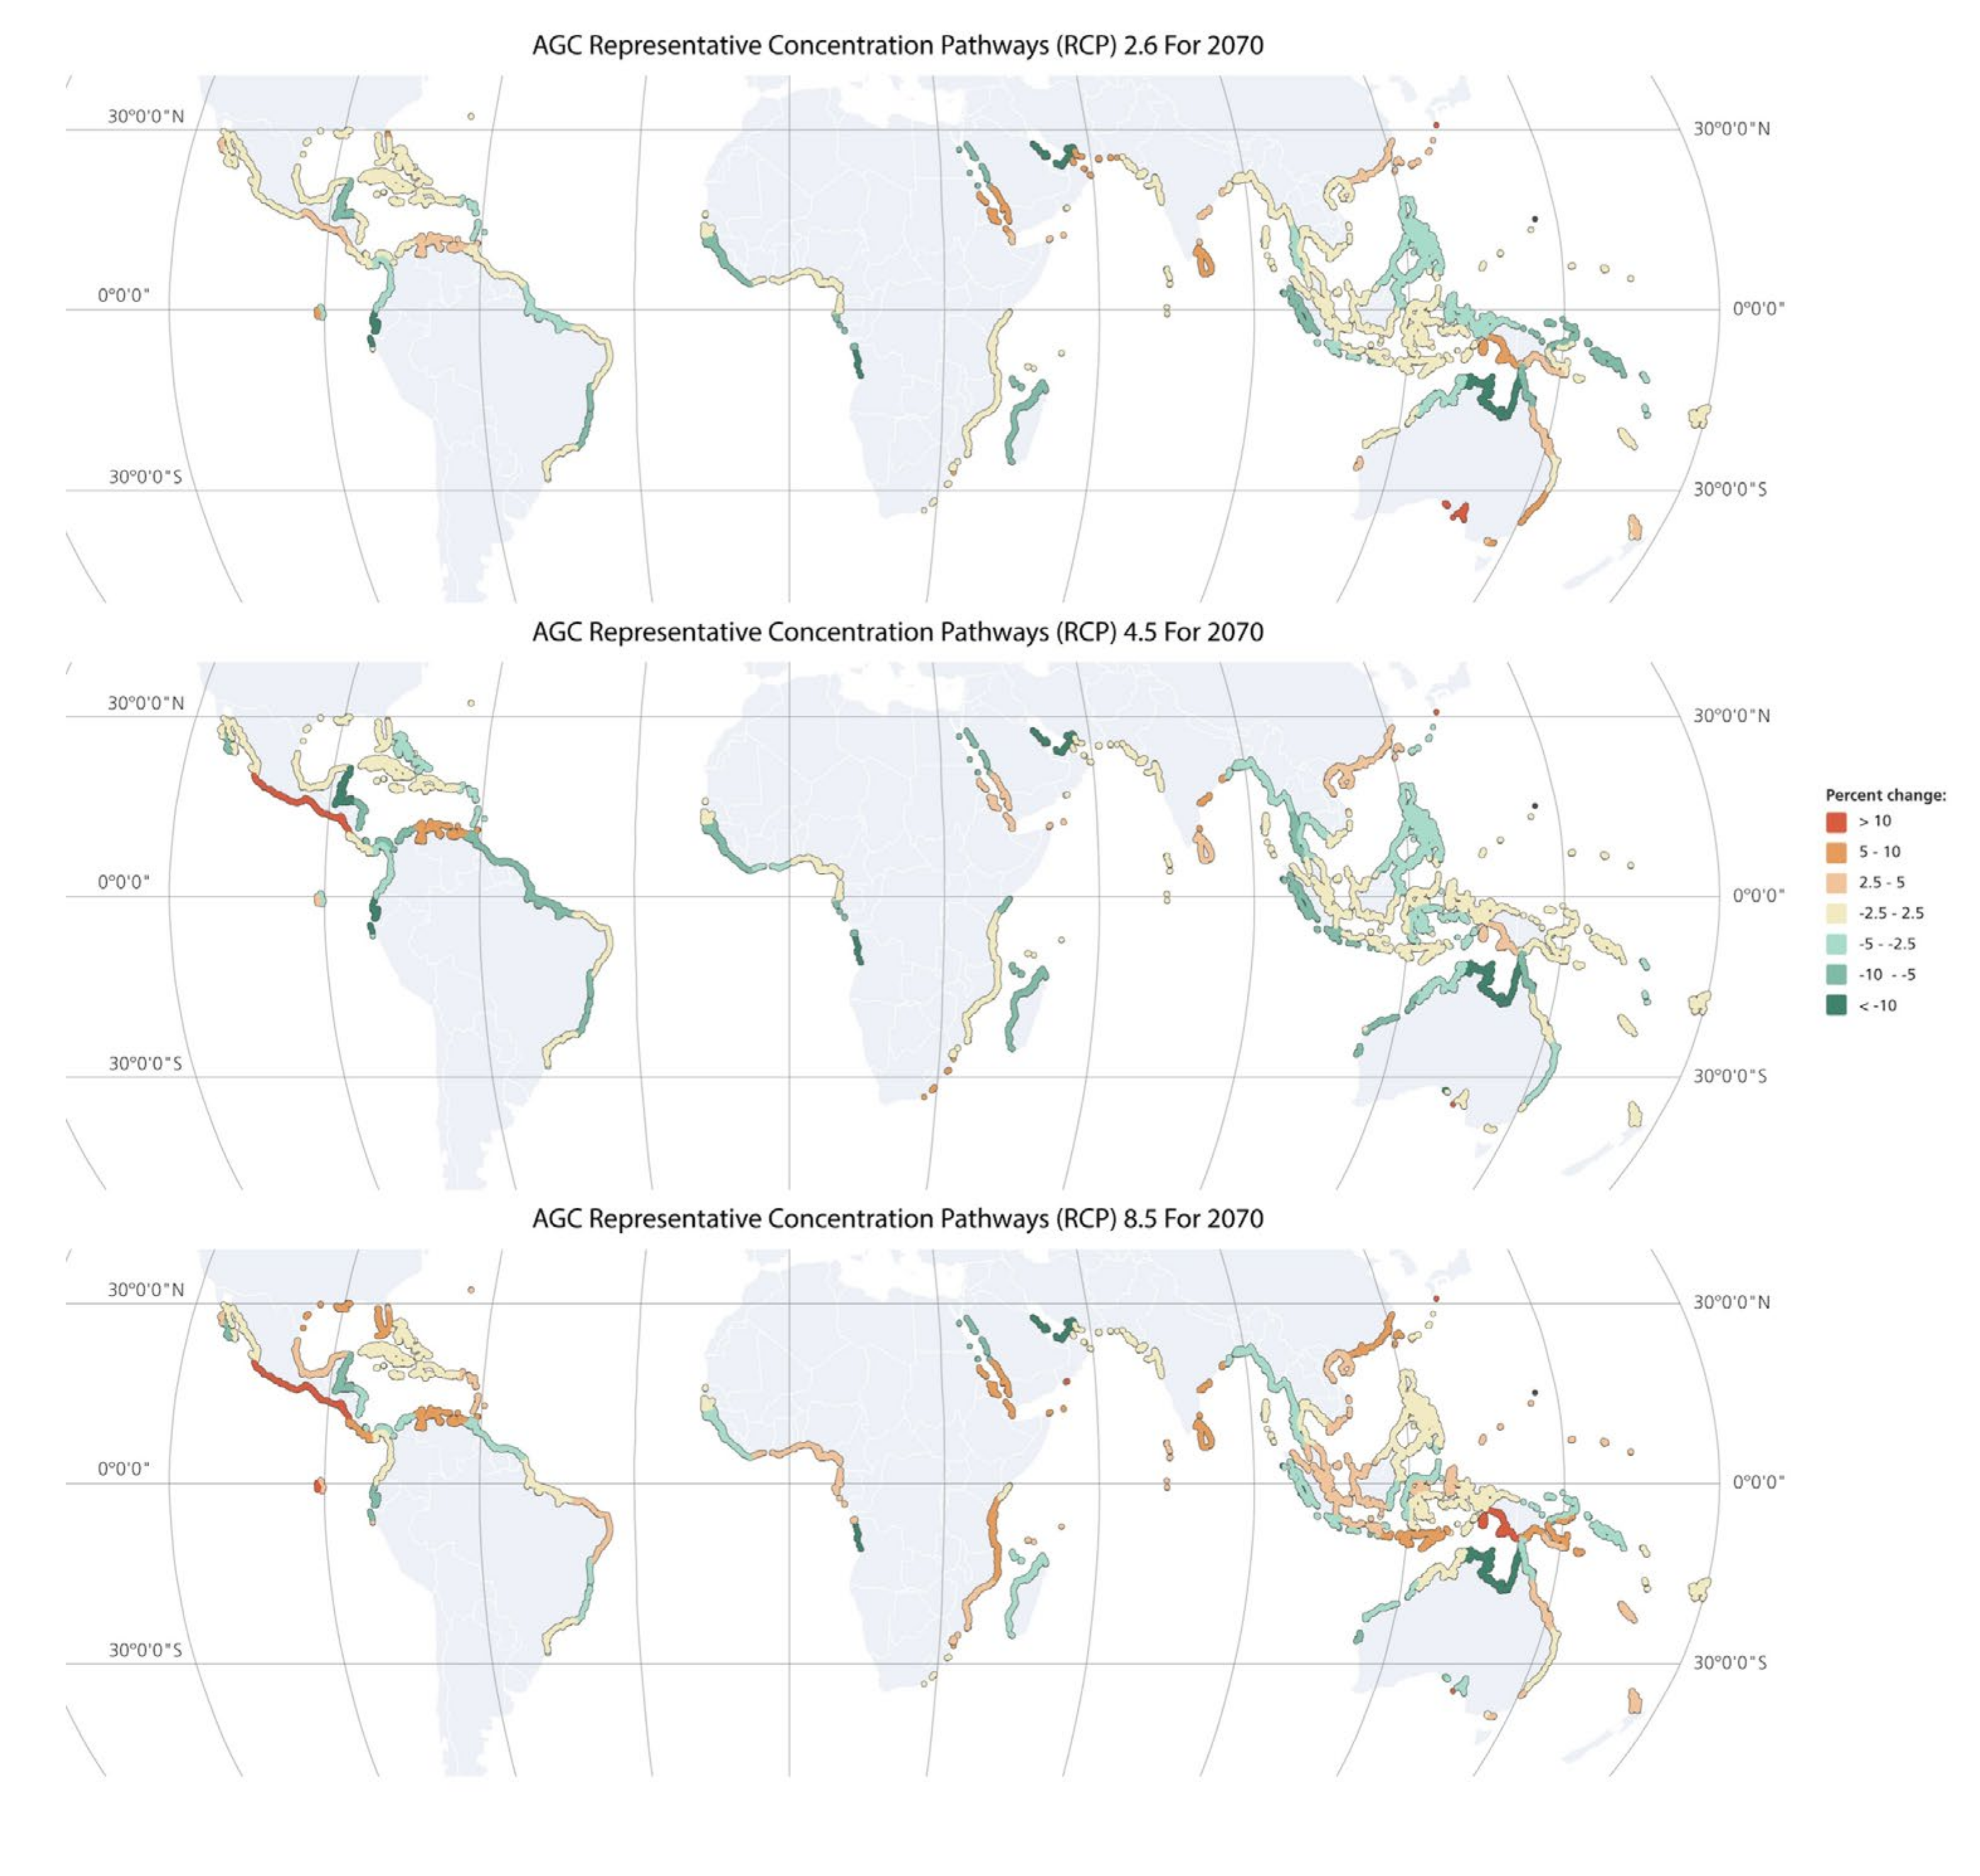
3.1. Modelling Mangrove AGC Variation under the Present and Future Climate Scenarios

The average predicted global AGC value was 86.62 Mg C/ha under the present scenario and was projected to decline under all future climate scenarios (Figure 1). Under the RCP 2.6 scenario, the projected AGC values decreased to 81Mg C/ha, further declining to 80.45 Mg C/ha and 79.42 Mg C/ha under the RCP 4.5 and 8.5 scenarios, respectively. However, future AGC variations have been projected to vary across the different ecological units considered. Except for the Temperate Australasia and Temperate Southern Africa realms, all realms are projected to undergo a decline in AGC values under all future scenarios. The former is projected to have a slight increase in AGC values under RCP 2.6 (1.37% increase), and the latter is projected to have an increase of 1.37% and 7.64% under RCP 2.6 and 4.5, respectively. This is because frosts limit mangrove growth in these areas, so with increase in temperature, these areas will benefit from an increase of mangrove productivity. Except for the Northeastern Australian Shelf province within the Central Indo-Pacific realm (under RCP 2.6 scenario), South China Sea (under RCP scenarios 4.5 and 8.5), and the Galapagos province of the Tropical Eastern Pacific realm (under RCP 2.6 scenario), all the marine provinces too are projected to undergo a decline in AGC values ranging from less than 1% to 15% under all RCP scenarios (see Supplementary File S4).
Out of all the realms, the Western Indo-Pacific realm is projected to undergo the sharpest declines, ranging from 10% to 12% under all three scenarios, while the Tropical Atlantic realm is projected to have declines ranging from 8% to 11%. Out of all the realms, the Western Indo-Pacific is by far the most species rich, with the Andamans province containing 34 species alone [48]. While the Andaman province has the highest carbon storage (91 Mg C/ha) compared to all the other provinces within the realm, it along with its three constituent ecoregions (Andaman and Nicobar Islands, Andaman Sea Coral Coast, and Western Sumatra) are projected to undergo declines in AGC values, ranging from less than 1% to 10% under all future scenarios. The ecoregion of Western Sumatra is projected to have declined by 7.5%, 6.12%, and 10.7% under RCP 2.6, 4.5, and 8.5, respectively. While the declines in the Bay of Bengal province are projected to range from 7% to 11%, the East India ecoregion is projected to have a 2% to 5% increase in AGC values while the North Bay of Bengal is projected to decline by 8% to 12%. The provinces of the Tropical Atlantic realm are projected to undergo a decline in AGC values with the Angolan and Gulf of Guinea West ecoregions undergoing declines ranging from 20% to 25% under the future scenarios.

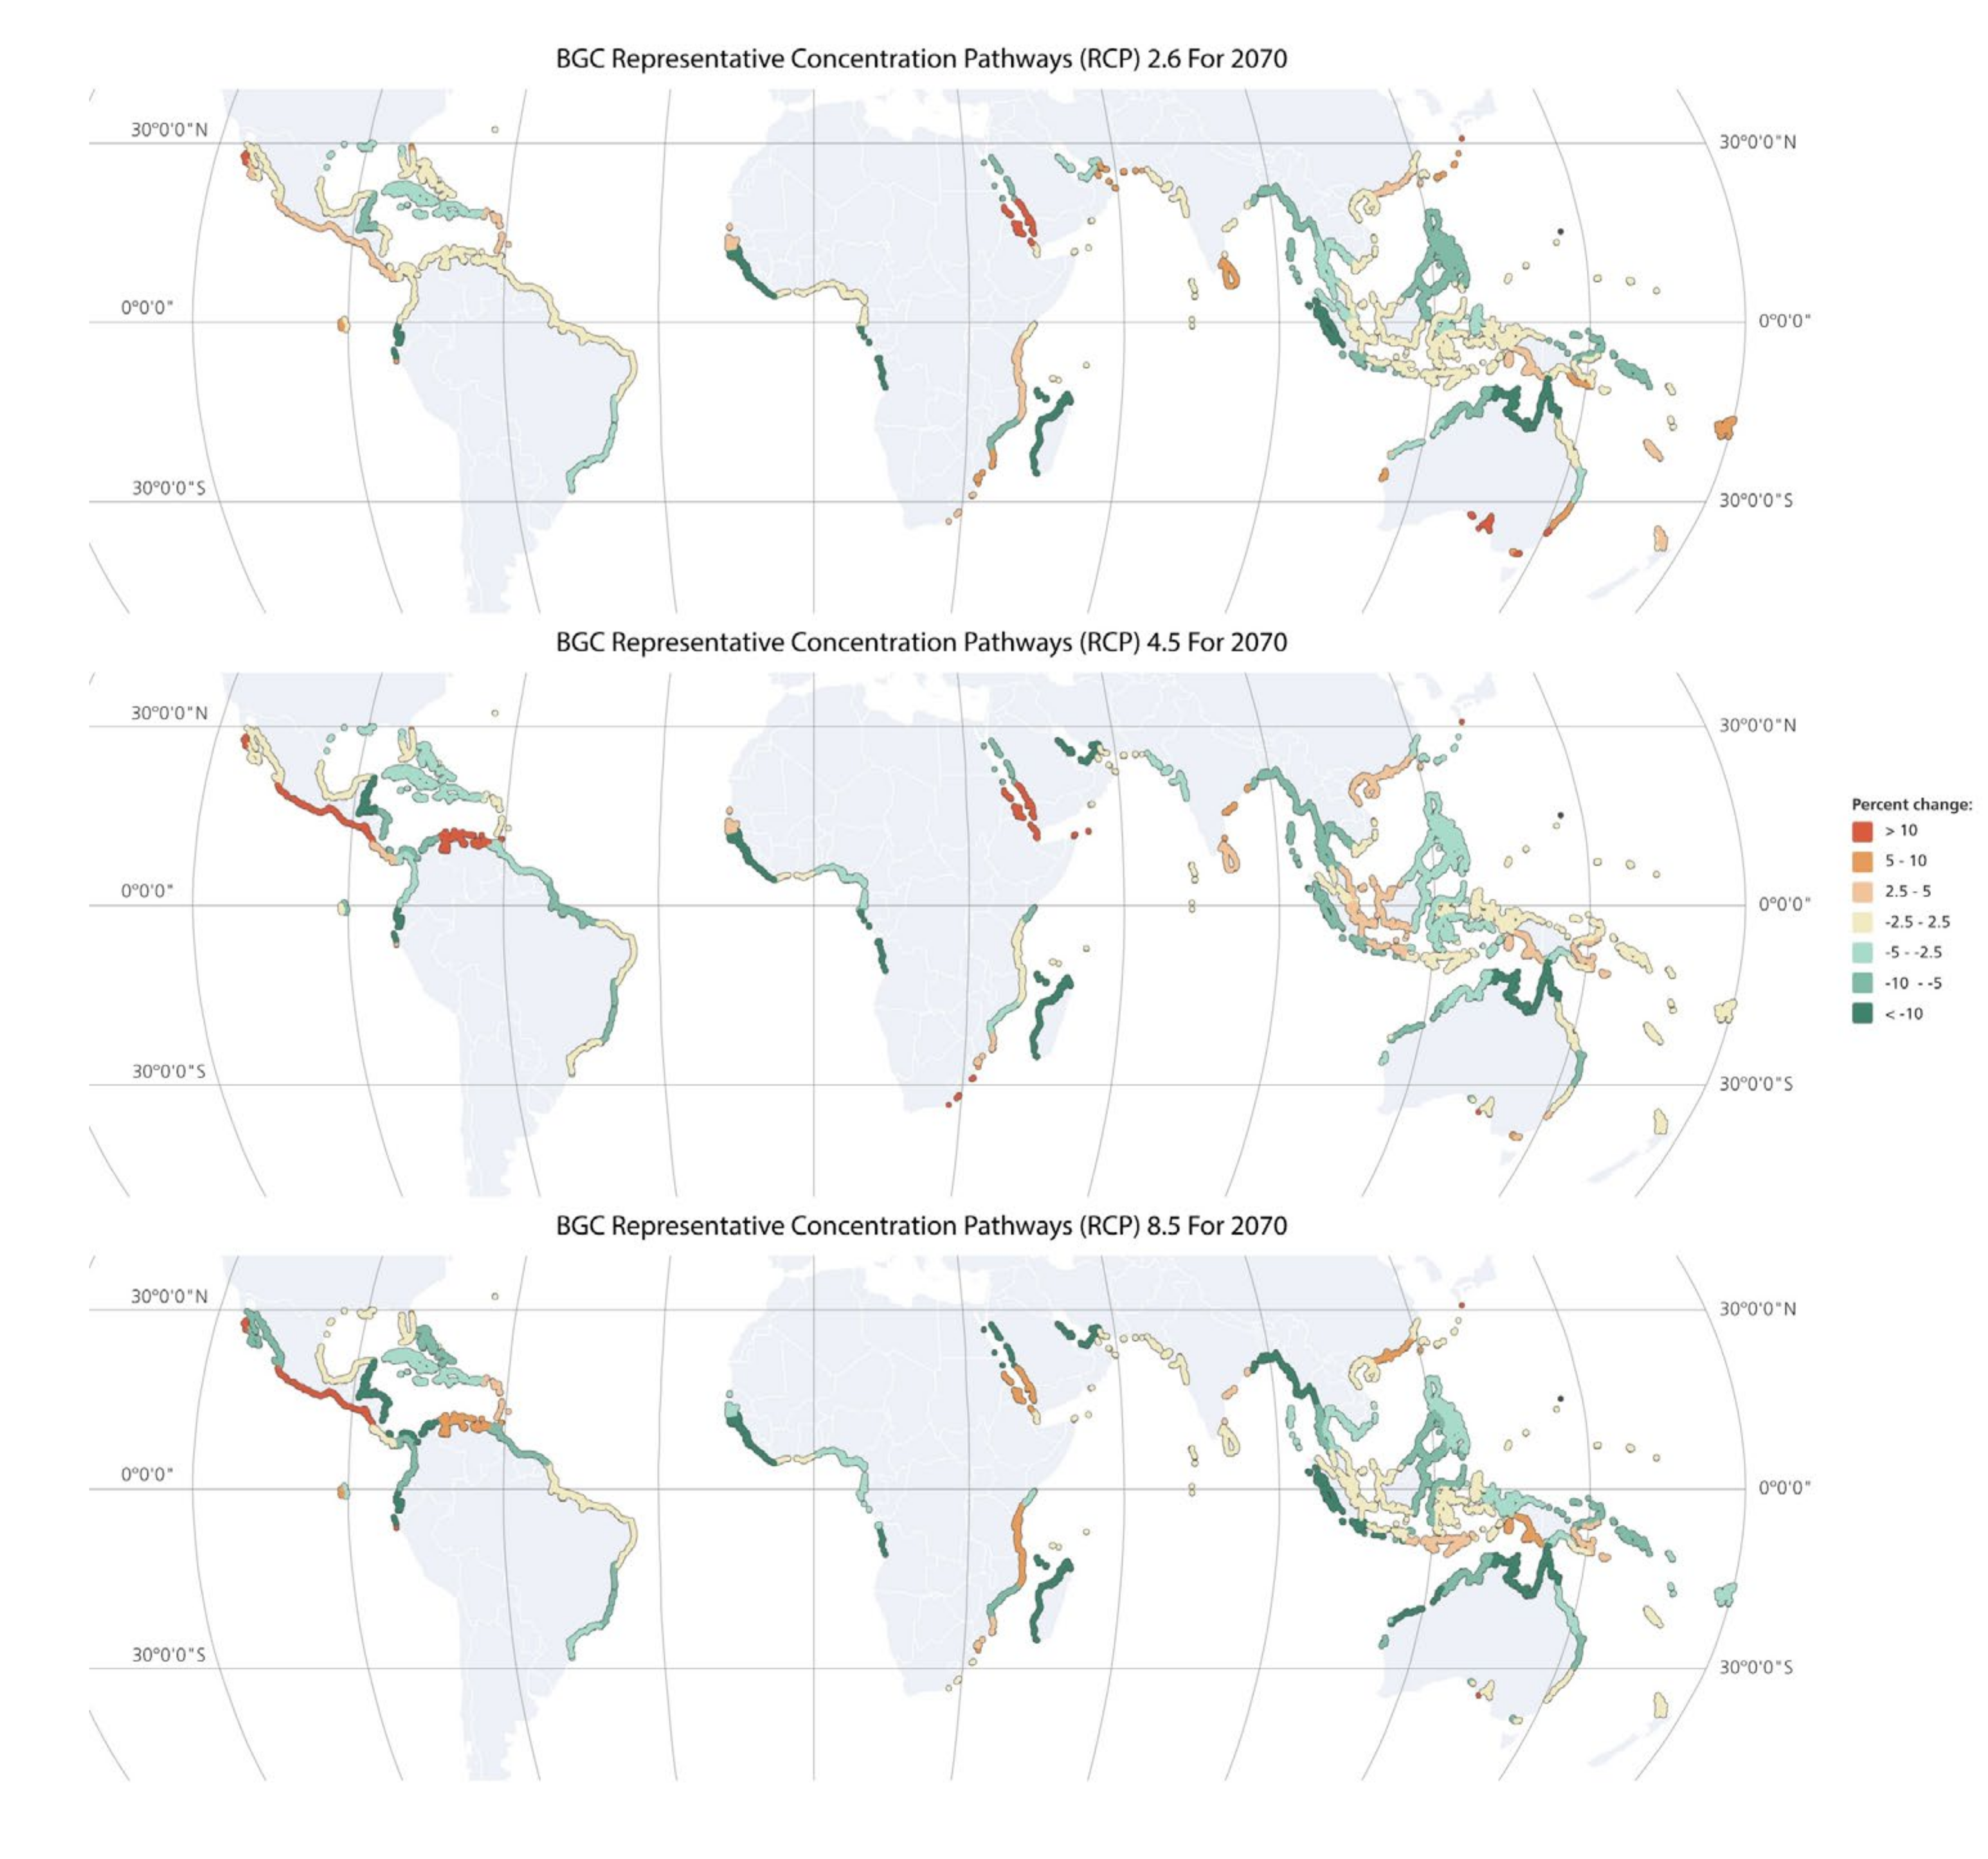
3.2. Modelling Mangrove BGC Stocks under the Present and Future Climate Scenarios

The average predicted global BGC stock was 34.81 Mg/ha under the present scenario and was projected to decline under all future climate scenarios (Figure 2). This result is consistent with those found for AGC. Under the RCP 2.6 scenario, the projected BGC stocks decreased to 33.4 Mg/ha and to 33.6 Mg/ha and 33.1 Mg/ha under the RCP 4.5 and 8.5 scenarios, respectively. The Central Indo-Pacific, Temperate North Atlantic, Temperate North Pacific, Temperate South America, Tropical Atlantic, and Western Indo-Pacific realms are projected to undergo a decline in BGC stocks under all future scenarios, and BGC values are projected to increase under all future climate scenarios for the Temperate South Africa realm. The BGC stock of the South China Sea province (of the Central Indo-Pacific realm) and the Warm Temperate Southeastern Pacific (of the Temperate South American realm) are projected to increase by 0.5% to 1% and 2% to 16%, respectively, under all future climate scenarios (see Supplementary File S4).
Out of all the realms, the Western Indo-Pacific realm is projected to undergo the sharpest declines in BGC ranging from 5% to 7% under all three scenarios. The Bay of Bengal province is projected to have sharper declines in BGC values (5% to 11%) compared to the Andaman province. However, similar to AGC, the BGC stores of the constituent ecoregions of the latter (Andaman and Nicobar Islands, Andaman Sea Coral Coast, and Western Sumatra) are projected to undergo a decline in BGC under future scenarios. Among the constituent ecoregions of the Bay of Bengal province, the East India ecoregion is projected to have a less than 1% decline in BGC values under RCP 2.6 and an increase in RCP 4.5 and 8.5, while the North Bay of Bengal is projected to decline by 5% to 12%.

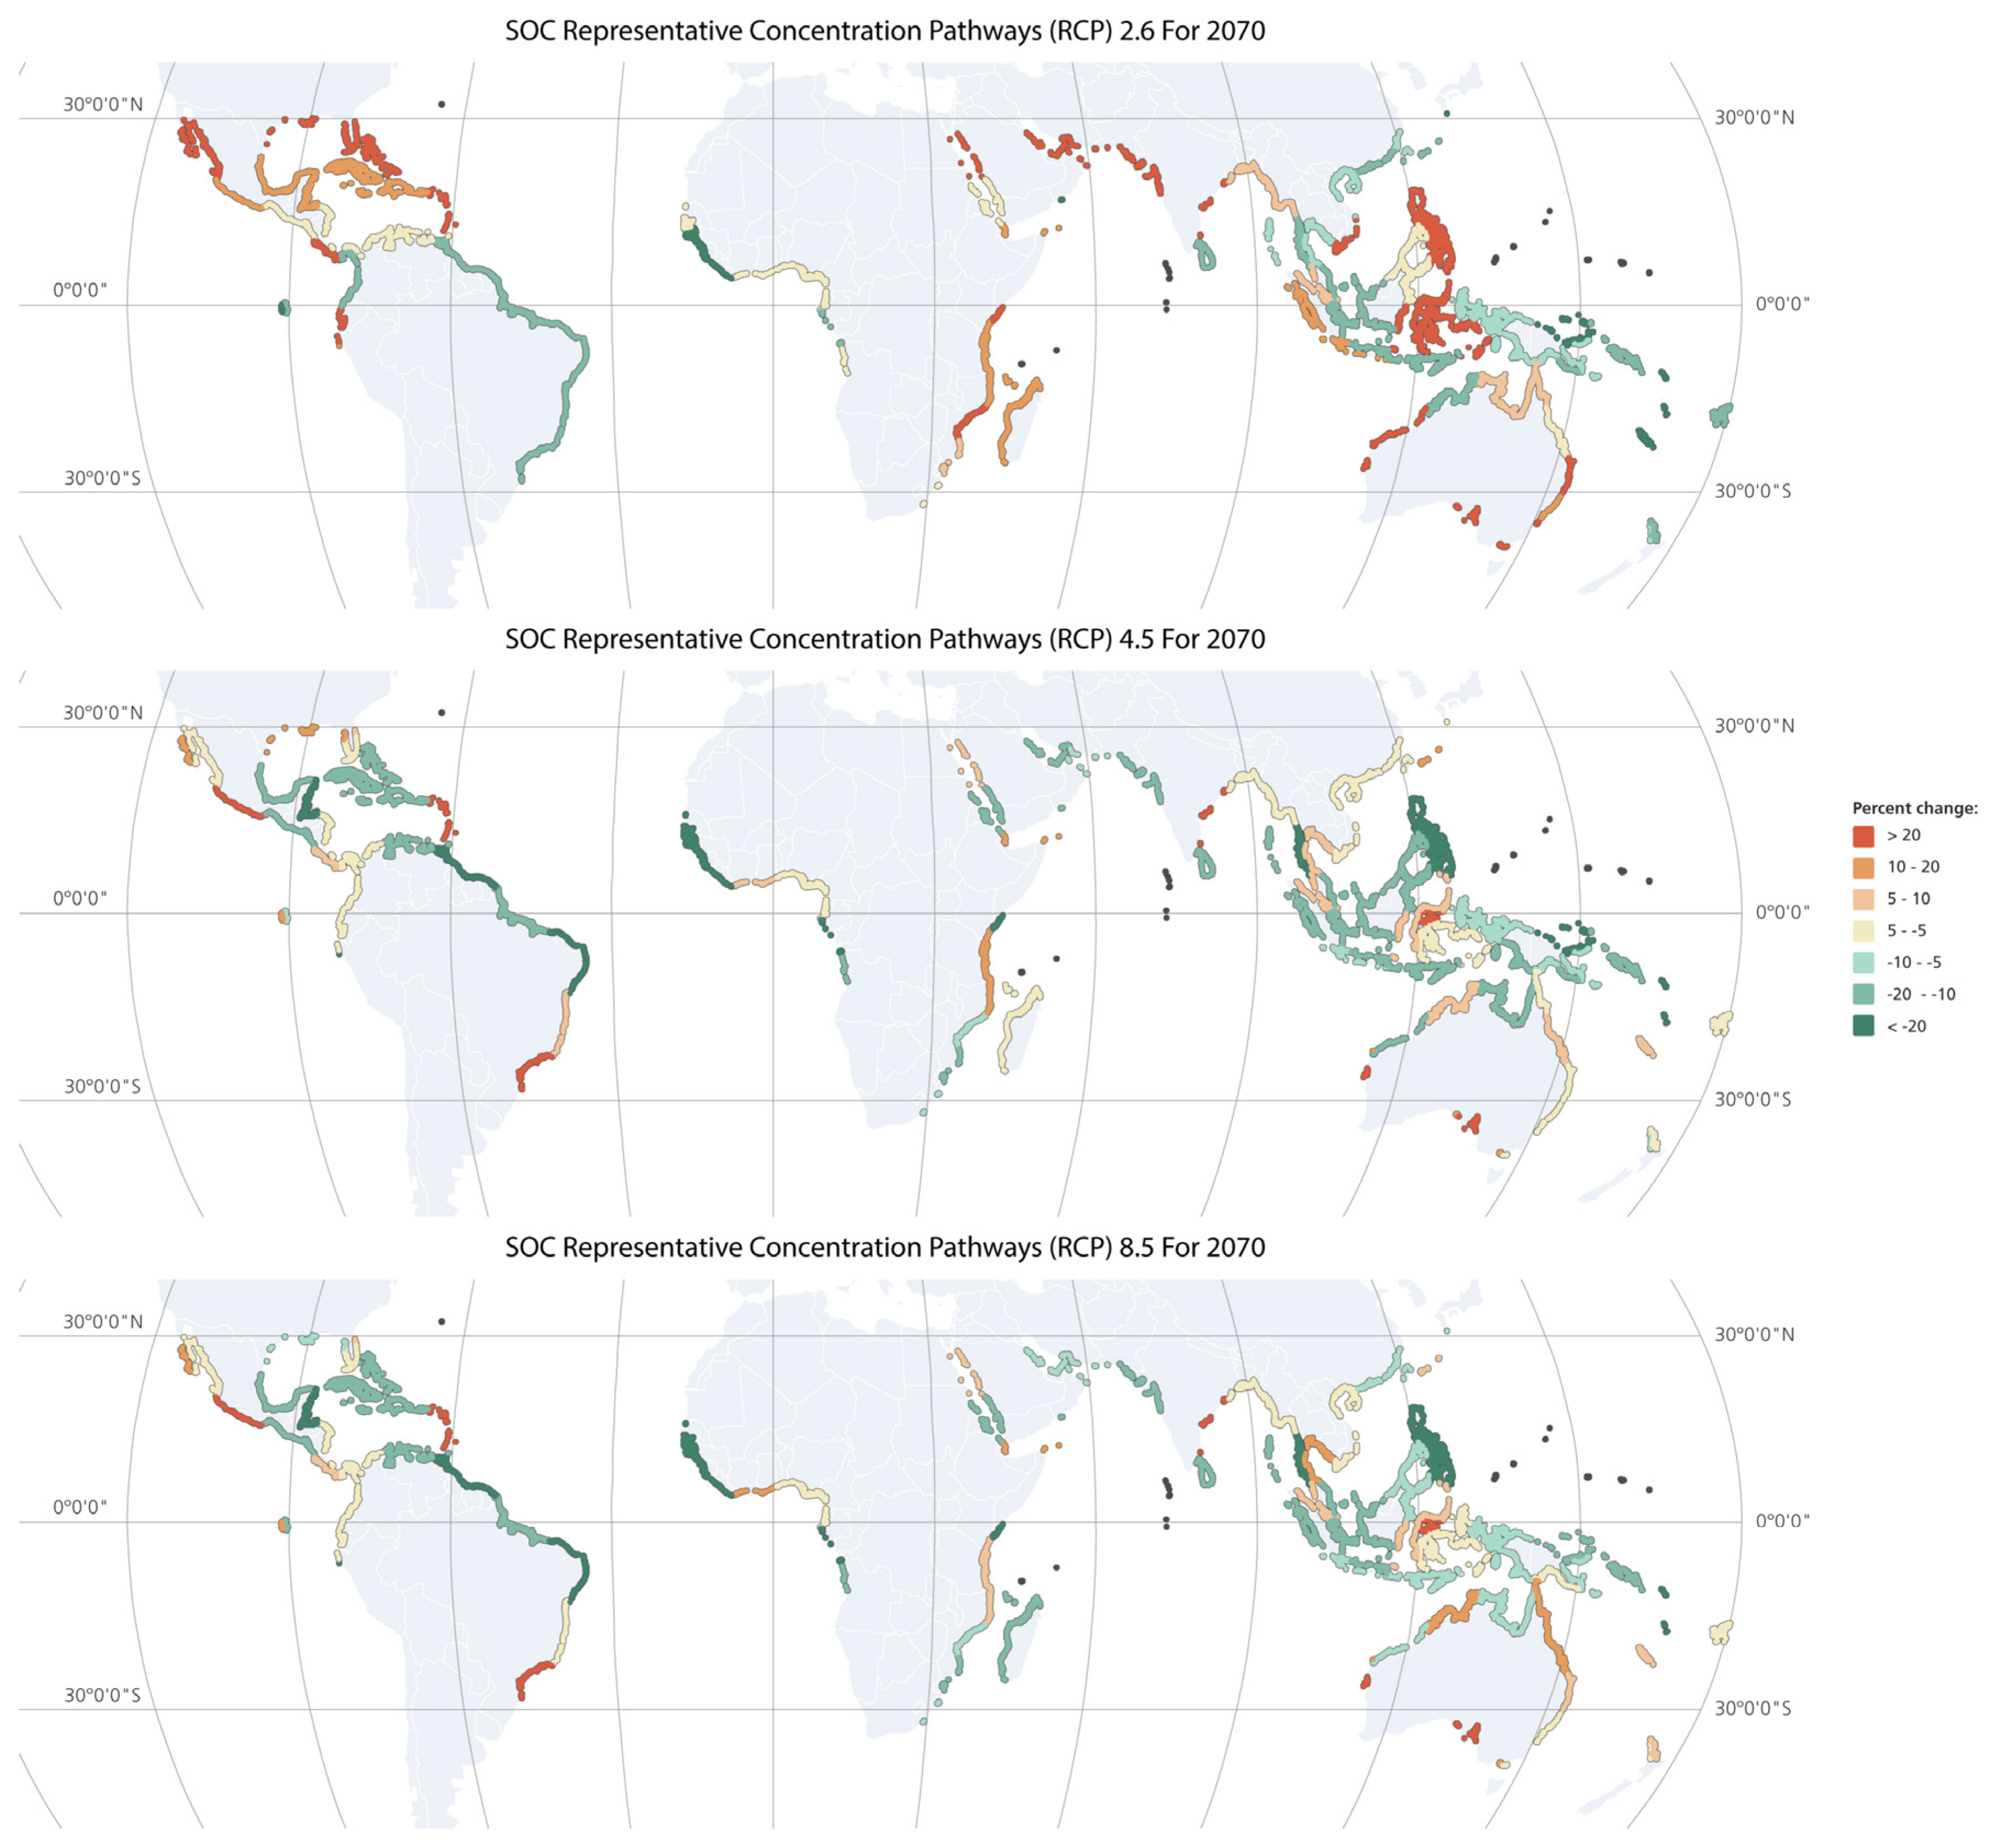
3.3. Modelling Mangrove SOC Stocks under the Present and Future Climate Scenarios

The average predicted global SOC stocks were 290.5 Mg C/ha under the present scenario. Out of all the marine realms, the mangroves of the Central Indo-Pacific (except the province of the Northeastern Australian Shelf), Eastern Indo-Pacific, and Tropical Atlantic realms (except its provinces of Tropical NW Atlantic and West African Transitions under RCP 2.6) are projected to undergo a decline in SOC accumulation under all the future climate scenarios. All the provinces and ecoregions within the Eastern Indo-Pacific Realm are projected to undergo a decline in future SOC stocks, with the province of Central Polynesia projected to lose more than 50% of its SOC stocks under all the future scenarios. The realms of Temperate Australasia and Temperate Northern Pacific, on the other hand, are projected to undergo an increase in all SOC stocks under all future scenarios, as is the province of Bay of Bengal. Temperate Southern Africa and Western Indo-Pacific are projected to undergo an increase in SOC stocks under RCP 2.6 (of 1.2% and 7.9%, respectively) but decline under both RCP 4.5 and 8.5. However, the Andaman province of the latter is projected to undergo a decline of 11%, 23%, and 25% under the scenarios RCP 2.6, 4.5, and 8.5, respectively. See Figure 3.

3.4. Modelling Mangrove Total Carbon Stocks under the Present and Future Climate Scenarios

Many ecoregions within the different realms and provinces are projected to undergo an increase in carbon stock values (even when the realm or province overall is projected to decline). For instance, Southern China and the Southern Vietnam ecoregions of the Central-Indo Pacific realm are projected to undergo a 1–4% increase in AGC stocks under all climate scenarios. Southern California Bight of the Temperate Northern Pacific is projected to undergo a 5–7% increase in AGC stocks under the future scenarios. While the Warm Temperate province and its constituent ecoregions (Cortezinian, Magdalena Transition, and Southern California Bight) are projected to undergo an increase in SOC stocks under future scenarios, the province of Warm Temperate North Pacific and its constituent ecoregions of Central Kuroshio Current and the East China Sea are projected to undergo an SOC stock decline under all future scenarios. The former is projected to undergo a decline in both AGC and BGC stocks for all scenarios, and the latter is projected to have a 2% increase in BGC stocks under the RCP 2.6 scenario. The ecoregions listed in Table 3 are predicted to undergo a decline in all three carbon stocks under all the future scenarios.
However, only two ecoregions, Southern California Bight and Mexican Tropical Pacific, both located in the North American region, are projected to gain carbon stocks across all three carbon pools (AGC, BGC, and SOC) under the three different RCP scenarios. On the other hand, mangroves of Central and Western Indo-Pacific islands (Andamans, Papua New Guinea, Vanuatu), west African coast, and northeastern South America are projected to decrease all three of their carbon stocks under all future climate scenarios. Many other ecoregions such as Western Sumatra, Southern Java, Bonaparte coast, Eastern Philippines, and North Sulawesi are projected to decrease in both AGC and BGC stocks under all future scenarios.

3.5. Modelling Mangrove Sea-Level Rise Exposure under the Present and Future Climate Scenarios

In terms of anticipated sea-level changes under the future emissions scenarios, the overall exposure of the different ecoregions to changing sea levels is projected to be greater under the RCP 8.5 scenario as compared to the RCP 2.6 scenario (see Supplementary File S4). The Northern Gulf of Mexico ecoregion is predicted to have the highest SLR exposure under both RCP 2.6 and 8.5. This is followed by the Northern Bay of Bengal marine ecoregion, where the inundation exposure is projected to increase from 0.394 (under RCP 2.6) to 0.44 (under RCP 8.5). In the Amazonian ecoregion, the inundation exposure is projected to increase from 0.31 (under RCP 2.6) to 0.34 (under RCP 8.5), while for the East China Sea ecoregion the SLR exposure is projected to decline from 0.33 (under RCP 2.6) to 0.285 (under RCP 8.5). However, the Gulf of Guinea ecoregions are projected to have the steepest difference between the two scenarios, with an SLR exposure of 0.264 for RCP 2.6 and 0.37 for RCP 8.5. On the other hand, the inundation exposure of the Bonaparte ecoregion is projected to remain similar under both scenarios.

4. Discussion

4.1. Drivers of Blue Carbon Stocks

Our research has shown that the importance of the factors influencing the variation in the different mangrove carbon stocks varied across all the RCP scenarios. Ecoregion-based analysis was found to be more significant in predicting total carbon stocks than realms and provinces. It was also found that temperature, temperature seasonality, annual precipitation, and soil erosion were the most critical of the drivers tested of AGC stocks under RCP 2.6 and 4.5 and superseded the spatial categorizations. Specifically, annual temperature and precipitation in ecoregions were the most important drivers of AGC variation under RCP 4.5. The importance of precipitation and temperature in driving mangrove biomass is consistent with previous findings on the effect of rainfall and temperature on mangrove ecosystems [9]. Reduced rainfall leads to high salinity and increased salt stress in mangroves. Moreover, mangroves generally thrive within a temperature range of 15–25 °C, and though an increase in atmospheric temperature may lead to an increase in mangrove productivity, this positive effect is only until an upper threshold; when crossed, it will negatively impact coastal vegetation, including mangroves. Hence, higher mean annual temperatures may result in lower mangrove biomass under future scenarios [64]. Conversely, an increase in rainfall under future climate scenarios could result in an increase in carbon stocks in many mangrove ecosystems. The study further projected that halting mangrove deforestation could result in carbon stocks increasing by almost 10% by 2115 because of increased rainfall [65]. A detailed analysis of the impacts of future changes in temperature and precipitation indicated that different mangrove regions could support the expansion of mangroves in Australasia, the Americas, Africa, and Asia [12].
Partial dependence plots (PDPs) revealed that soil erosion was inversely associated with carbon stocks for all the scenarios. Mangrove species richness, annual temperature, and annual precipitation on the other hand showed a positive association with AGC, BGC, and SOC under all RCP scenarios. These findings are consistent with the existing body of research; temperature and precipitation were previously identified as being the main drivers of mangrove carbon storage at a global scale [7].
Species richness was also found to be an important driver of mangrove carbon stocks, but carbon storage varies across species [66]. While the research conducted on the mangroves of Tanzania discovered that erosion has a negative impact on soil organic carbon, a global-scale analysis of the impacts of soil erosion on mangrove carbon stocks has not been performed [20]. However, the research conducted on other tropical ecosystems suggests that both soil erosion and loss in vegetation cover can result in a decline in carbon stocks [67]. Globally, mangroves are deforested and degraded [68,69], further contributing to declines in stocks and exacerbating coastal erosion [70,71].
Based on these research findings and existing literature, we predict that increasing soil erosion could potentially be brought on by an increase in future precipitation combined with increasing rates of deforestation affecting mangrove carbon storage and sequestration. However, how mangrove deforestation dynamics could vary under future scenarios is unknown, hampering efforts to assess potential domino effects on factors such as soil erosion.

4.2. Conservation Implications

The ecoregion-centered approach is an integral feature of terrestrial conservation prioritization [72,73]. Previous research has established that, at a regional scale, the distribution of mangroves is controlled by abiotic and biotic factors [74]. This research confirms carbon stock variations across the different marine ecoregion categorizations and showed the relevance of ecoregions in influencing the variation in carbon stock values.
This study had also identified that some of the ecoregions that are projected to be mostly affected because of climatic changes under the different emissions scenarios face too-high levels of SLR inundation exposure under RCP 2.6 and 8.5. Based on these findings, we argue that the mangroves of the Amazonian biome, the eastern part of South Asia (where both the Andaman and North Bay of Bengal marine ecoregions are located), SE Asia, and the Gulf of Guinea are the most vulnerable to decline in carbon stocks (elevated SLR inundation could result in declines in mangrove area availability and changes in species composition, owing to a combination of increased salinity and the loss of suitable habitats for many mangrove species) [28,29,75]. These could result in additional mangrove carbon stock losses. The impacts of SLR on mangroves are expected to vary regionally, and there is a paucity of data relating to drivers such as sea-level rise and tidal dynamics in many regions such as Africa [12]. This makes establishing links between SLR and mangrove carbon stock changes at a global scale difficult. For instance, inundation or submergence because of rising sea level water is one aspect of future SLR change. In some places, mangroves may be able to keep pace with regional sea level rises if root growth and sediment availability are adequate [62]. Accretion rates in turn can be affected by subsurface mechanisms such as sedimentation and subsidence/uplift [28]. Additionally, the response of mangroves to both the changing climate and sea level is expected to be mediated by mangrove ecosystem composition [76] and the ability of mangrove species to migrate and undergo a landward extension [77]. Further, changes in precipitation are projected to affect riverine discharge, which in turn is expected to increase mangrove surface elevation. This will affect the resilience of estuarine mangroves to SLR and reduce its impact by supporting mangrove expansion in different regions, such as Australia [12]. On the other hand, dwarf mangroves of NZ [78], those that could be colonized by alternate coastal ecosystems [4] such as seagrass and mangroves affected by micro-tidal dynamics, are at a higher risk [12].

5. Conclusions and Recommendations

This research has focused on adapting a bioclimatic variables-based model of carbon stock variation. These bioclimatic variables were used in conjunction with soil erosion and topographic and coastal ecosystem classification variables for both the present and future scenarios, along with identifying the SLR exposure of different marine ecoregions in an inundation-only scenario. The importance of marine ecoregions in influencing carbon stocks variation under different scenarios was identified, and the ecoregions projected to lose one or more of their carbon stocks and their vulnerability to projected SLR exposure were shown. Based on this assessment, an ecoregion-based approach could help model the variation in carbon stock variation, identify exposure to SLR, and prioritize regions such as those in South Asia, Amazonia, and SE Asia for conservation.
It is not known how the future changes in salinity and other bioclimatic variables will influence species composition, their carbon storage, and their ability to shift in response to changing SLR across different regions. Additionally, little is known about future mangrove deforestation scenarios and their interactions with other potential drivers of mangrove carbon stock changes, including SLR changes and shifts in species composition, owing to which these were not incorporated in this research. Furthermore, tidal inundation, wave action, and cyclones influence both mangrove forest structure and species composition [6,63,64], but there is limited information about how these will vary under future scenarios and interact with the other mangrove change drivers to drive carbon stock changes. Hence, we recommend that future studies be made to develop models that will incorporate these factors.

Supplementary Materials

The following are available online at https://www.mdpi.com/article/10.3390/su14073873/s1, Supplementary File S1: Other results of the research, Supplementary File S2: The 19 bioclimatic variables, Supplementary File S3: Variables Influencing the Carbon Stock Values, Supplementary File S4: Ecoregions data. References [22,79,80,81] were cited in Supplementary Materials.

Author Contributions

Data collating and conducting the analysis, M.S.; providing data and advice on the methodology, L.S., M.F.A., G.W. and L.J.C.M.; writing the methods section and creating the figures and tables, M.S.; advised on the framework for the paper, L.S., M.F.A., G.W. and L.J.C.M.; writing most of the main text, M.S.; providing rigorous criticism, L.S., M.F.A., G.W. and L.J.C.M. All authors have read and agreed to the published version of the manuscript.

Funding

This research received no external funding.

Institutional Review Board Statement

Not applicable.

Data Availability Statement

The data are available from https://github.com/Jojo666/MangroveData (accessed on 20 December 2021).

Conflicts of Interest

The authors declare no conflict of interest. They declare that they have no known competing financial interests or personal relationships that could have appeared to influence the work reported in this paper.

References

  1. Brander, L.M.; Wagtendonk, A.J.; Hussain, S.S.; McVittie, A.; Verburg, P.H.; de Groot, R.S.; van der Ploeg, S. Ecosystem service values for mangroves in Southeast Asia: A meta-analysis and value transfer application. Ecosyst. Serv. 2012, 1, 62–69. [Google Scholar] [CrossRef] [Green Version]
  2. Friess, D.A. Where the tallest mangroves are. Nat. Geosci. 2018, 12, 4–5. [Google Scholar] [CrossRef]
  3. Alongi, D.M. Carbon Cycling and Storage in Mangrove Forests. Annu. Rev. Mar. Sci. 2014, 6, 195–219. [Google Scholar] [CrossRef] [PubMed]
  4. Kauffman, J.B.; Bhomia, R.K. Ecosystem carbon stocks of mangroves across broad environmental gradients in West-Central Africa: Global and regional comparisons. PLoS ONE 2017, 12, e0187749. [Google Scholar] [CrossRef] [Green Version]
  5. Jones, T.G.; Ratsimba, H.R.; Ravaoarinorotsihoarana, L.; Cripps, G.; Bey, A. Ecological Segregation of the Late Jurassic Stegosaurian and Iguanodontian Dinosaurs of the Morrison Formation in North America: Pronounced or Subtle? Forests 2014, 5, 177–205. [Google Scholar] [CrossRef] [Green Version]
  6. Sanders, C.J.; Maher, D.; Tait, D.; Williams, D.; Holloway, C.; Sippo, J.Z.; Santos, I. Are global mangrove carbon stocks driven by rainfall? J. Geophys. Res. Biogeosci. 2016, 121, 2600–2609. [Google Scholar] [CrossRef]
  7. Simard, M.; Fatoyinbo, L.; Smetanka, C.; Rivera-Monroy, V.H.; Castañeda-Moya, E.; Thomas, N.; Van Der Stocken, T. Mangrove canopy height globally related to precipitation, temperature and cyclone frequency. Nat. Geosci. 2019, 12, 40–45. [Google Scholar] [CrossRef]
  8. Rovai, A.S.; Twilley, R.R.; Castañeda-Moya, E.; Midway, S.R.; Friess, D.A.; Trettin, C.C.; Bukoski, J.J.; Stovall, A.E.; Pagliosa, P.R.; Fonseca, A.L.; et al. Macroecological patterns of forest structure and allometric scaling in mangrove forests. Glob. Ecol. Biogeogr. 2021, 30, 1000–1013. [Google Scholar] [CrossRef]
  9. Hutchison, J.; Manica, A.; Swetnam, R.; Balmford, A.; Spalding, M. Predicting Global Patterns in Mangrove Forest Biomass: Global patterns in mangrove biomass. Conserv. Lett. 2014, 7, 233–240. [Google Scholar] [CrossRef] [Green Version]
  10. Inoue, T. Blue Carbon in Shallow Coastal Ecosystems. Blue Carbon Shallow Coast. Ecosyst. 2019. [Google Scholar] [CrossRef]
  11. Walcker, R.; Gandois, L.; Proisy, C.; Corenblit, D.; Mougin, É.; Laplanche, C.; Ray, R.; Fromard, F. Control of “blue carbon” storage by mangrove ageing: Evidence from a 66-year chronosequence in French Guiana. Glob. Change Biol. 2018, 24, 2325–2338. [Google Scholar] [CrossRef]
  12. Ward, R.D.; Friess, D.A.; Day, R.H.; MacKenzie, R.A. Impacts of climate change on mangrove ecosystems: A region by region overview. Ecosyst. Health Sustain. 2016, 2, e01211. [Google Scholar] [CrossRef] [Green Version]
  13. Taillardat, P.; Friess, D.A.; Lupascu, M. Mangrove blue carbon strategies for climate change mitigation are most effective at the national scale. Biol. Lett. 2018, 14, 20180251. [Google Scholar] [CrossRef] [PubMed]
  14. Rovai, A.S.; Coelho, C., Jr.; de Almeida, R.; Cunha-Lignon, M.; Menghini, R.P.; Twilley, R.R.; Cintrón-Molero, G.; Schaeffer-Novelli, Y. Ecosystem-level carbon stocks and sequestration rates in mangroves in the Cananéia-Iguape lagoon estuarine system, southeastern Brazil. For. Ecol. Manag. 2020, 479, 118553. [Google Scholar] [CrossRef]
  15. Thompson, B.S.; Clubbe, C.P.; Primavera, J.H.; Curnick, D.; Koldewey, H.J. Locally assessing the economic viability of blue carbon: A case study from Panay Island, the Philippines. Ecosyst. Serv. 2014, 8, 128–140. [Google Scholar] [CrossRef]
  16. Rovai, A.S.; Twilley, R.R.; Worthington, T.A.; Riul, P. Brazilian Mangroves: Blue Carbon Hotspots of National and Global Relevance to Natural Climate Solutions. Front. For. Glob. Chang. 2022, 4, 217. [Google Scholar] [CrossRef]
  17. Daniel, F.; Sidik, F. Dynamic Sedimentary Environments of Mangrove Coasts; Daniel, F., Sidik, F., Eds.; Elsevier: Amsterdam, The Netherlands, 2020. [Google Scholar]
  18. Qiu, P.; Wang, D.; Zou, X.; Yang, X.; Xie, G.; Xu, S.; Zhong, Z. Finer Resolution Estimation and Mapping of Mangrove Biomass Using UAV LiDAR and WorldView-2 Data. Forests 2019, 10, 871. [Google Scholar] [CrossRef] [Green Version]
  19. Singh, M.; Evans, D.; Friess, D.A.; Tan, B.S.; Nin, C.S. Mapping Above-Ground Biomass in a Tropical Forest in Cambodia Using Canopy Textures Derived from Google Earth. Remote Sens. 2015, 7, 5057–5076. [Google Scholar] [CrossRef] [Green Version]
  20. Cleyndert, G.D.J.; Cuni-Sanchez, A.; Seki, H.A.; Shirima, D.D.; Munishi, P.K.T.; Burgess, N.; Calders, K.; Marchant, R. The effects of seaward distance on above and below ground carbon stocks in estuarine mangrove ecosystems. Carbon Balance Manag. 2020, 15, 27. [Google Scholar] [CrossRef]
  21. Wang, D.; Wan, B.; Qiu, P.; Zuo, Z.; Wang, R.; Wu, X. Mapping Height and Aboveground Biomass of Mangrove Forests on Hainan Island Using UAV-LiDAR Sampling. Remote Sens. 2019, 11, 2156. [Google Scholar] [CrossRef] [Green Version]
  22. Estrada, G.C.D.; Soares, M.L.G. Global Patterns of Aboveground Carbon Stock and Sequestration in Mangroves. An. Acad. Bras. Cienc. 2017, 89, 973–989. [Google Scholar] [CrossRef] [Green Version]
  23. Alongi, D.M.; Murdiyarso, D.; Fourqurean, J.; Kauffman, J.B.; Hutahaean, A.; Crooks, S.; Lovelock, C.; Howard, J.B.; Herr, D.; Fortes, M.D.; et al. Indonesia’s blue carbon: A globally significant and vulnerable sink for seagrass and mangrove carbon. Wetl. Ecol. Manag. 2015, 24, 3–13. [Google Scholar] [CrossRef]
  24. Atwood, T.B.; Connolly, R.M.; Almahasheer, H.; Carnell, P.E.; Duarte, C.M.; Lewis, C.J.E.; Irigoien, X.; Kelleway, J.J.; Lavery, P.S.; Macreadie, P.I.; et al. Global patterns in mangrove soil carbon stocks and losses. Nat. Clim. Chang. 2017, 7, 523–528. [Google Scholar] [CrossRef]
  25. Spalding, M.D.; Fox, H.E.; Allen, G.R.; Davidson, N.; Ferdaña, Z.A.; Finlayson, M.; Halpern, B.S.; Jorge, M.A.; Lombana, A.; Lourie, S.A.; et al. Marine Ecoregions of the World: A Bioregionalization of Coastal and Shelf Areas. Bioscience 2007, 57, 573–583. [Google Scholar] [CrossRef] [Green Version]
  26. Van der Stocken, T.; Carroll, D.; Menemenlis, D.; Simard, M.; Koedam, N. Global-scale dispersal and connectivity in mangroves. Proc. Natl. Acad. Sci. USA 2018, 116, 915–922. [Google Scholar] [CrossRef] [PubMed] [Green Version]
  27. Adame, M.F.; Roberts, M.E.; Hamilton, D.P.; Ndehedehe, C.E.; Reis, V.; Lu, J.; Griffiths, M.; Curwen, G.; Ronan, M. Tropical Coastal Wetlands Ameliorate Nitrogen Export During Floods. Front. Mar. Sci. 2019, 6, 671. [Google Scholar] [CrossRef] [Green Version]
  28. Mafi-Gholami, D.; Zenner, E.K.; Jaafari, A. Mangrove regional feedback to sea level rise and drought intensity at the end of the 21st century. Ecol. Indic. 2019, 110, 105972. [Google Scholar] [CrossRef]
  29. Payo, A.; Mukhopadhyay, A.; Hazra, S.; Ghosh, T.; Ghosh, S.; Brown, S.; Nicholls, R.J.; Bricheno, L.; Wolf, J.; Kay, S.; et al. Projected changes in area of the Sundarban mangrove forest in Bangladesh due to SLR by 2100. Clim. Chang. 2016, 139, 279–291. [Google Scholar] [CrossRef] [PubMed] [Green Version]
  30. Lovelock, C.E.; Cahoon, D.R.; Friess, D.A.; Guntenspergen, G.R.; Krauss, K.W.; Reef, R.; Rogers, K.; Saunders, M.L.; Sidik, F.; Swales, A.; et al. The vulnerability of Indo-Pacific mangrove forests to sea-level rise. Nature 2015, 526, 559–563. [Google Scholar] [CrossRef] [PubMed] [Green Version]
  31. Remya, K.; Ramachandran, A.; Jayakumar, S. Predicting the current and future suitable habitat distribution of Myristica dactyloides Gaertn. using MaxEnt model in the Eastern Ghats, India. Ecol. Eng. 2015, 82, 184–188. [Google Scholar] [CrossRef]
  32. Mpelasoka, F.; Awange, J.L.; Goncalves, R.M. Accounting for dynamics of mean precipitation in drought projections: A case study of Brazil for the 2050 and 2070 periods. Sci. Total Environ. 2018, 622–623, 1519–1531. [Google Scholar] [CrossRef] [PubMed]
  33. Tramblay, Y.; Badi, W.; Driouech, F.; El Adlouni, S.; Neppel, L.; Servat, E. Climate change impacts on extreme precipitation in Morocco. Glob. Planet. Chang. 2012, 82, 104–114. [Google Scholar] [CrossRef]
  34. Tang, X.; Yuan, Y.; Li, X.; Zhang, J. Maximum Entropy Modeling to Predict the Impact of Climate Change on Pine Wilt Disease in China. Front. Plant Sci. 2021, 12, 764. [Google Scholar] [CrossRef] [PubMed]
  35. Giri, C.; Ochieng, E.; Tieszen, L.L.; Zhu, Z.; Singh, A.; Loveland, T.; Masek, J.; Duke, N. Status and distribution of mangrove forests of the world using earth observation satellite data. Glob. Ecol. Biogeogr. 2011, 20, 154–159. [Google Scholar] [CrossRef]
  36. Center for International Forestry Research (CIFOR). The Sustainable Wetlands Adaptation and Mitigation Program (SWAMP). Available online: https://www2.cifor.org/swamp/ (accessed on 3 January 2022).
  37. Kolka, R.K.; Murdiyarso, D.; Kauffman, J.B.; Birdsey, R.A. Tropical wetlands, climate, and land-use change: Adaptation and mitigation opportunities. Wetl. Ecol. Manag. 2016, 24, 107–112. [Google Scholar] [CrossRef] [Green Version]
  38. Hamilton, S.E.; Friess, D.A. Global carbon stocks and potential emissions due to mangrove deforestation from 2000 to 2012. Nat. Clim. Chang. 2018, 8, 240–244. [Google Scholar] [CrossRef] [Green Version]
  39. Sanderman, J.; Hengl, T.; Fiske, G.; Solvik, K.; Adame, M.F.; Benson, L.; Bukoski, J.J.; Carnell, P.; Cifuentes-Jara, M.; Donato, D.; et al. A global map of mangrove forest soil carbon at 30 m spatial resolution. Environ. Res. Lett. 2018, 13, 055002. [Google Scholar] [CrossRef]
  40. Mewded, B.; Lemessa, D. Factors affecting woody carbon stock in Sirso moist evergreen Afromontane forest, southern Ethiopia: Implications for climate change mitigation. Environ. Dev. Sustain. 2019, 22, 6363–6378. [Google Scholar] [CrossRef]
  41. Andriamananjara, A.; Ranaivoson, N.; Razafimbelo, T.M.; Hewson, J.; Ramifehiarivo, N.; Rasolohery, A.; Andrisoa, R.H.; Razafindrakoto, M.A.; Razafimanantsoa, M.-P.; Rabetokotany, N.; et al. Towards a better understanding of soil organic carbon variation in Madagascar. Eur. J. Soil Sci. 2017, 68, 930–940. [Google Scholar] [CrossRef]
  42. Hijmans, R.J.; Cameron, S.E.; Parra, J.L.; Jones, P.G.; Jarvis, A. Very high resolution interpolated climate surfaces for global land areas. Int. J. Climatol. 2005, 25, 1965–1978. [Google Scholar] [CrossRef]
  43. Yang, Y.; Javanroodi, K.; Nik, V.M. Climate Change and Renewable Energy Generation in Europe—Long-Term Impact Assessment on Solar and Wind Energy Using High-Resolution Future Climate Data and Considering Climate Uncertainties. Energies 2022, 15, 302. [Google Scholar] [CrossRef]
  44. Van Vuuren, D.P.; Edmonds, J.; Kainuma, M.; Riahi, K.; Thomson, A.; Hibbard, K.; Hurtt, G.C.; Kram, T.; Krey, V.; Lamarque, J.-F. The representative concentration pathways: An overview. Clim. Chang. 2011, 109, 5. [Google Scholar] [CrossRef]
  45. Cabrera, C.V.P.; Selvaraj, J.J. Geographic shifts in the bioclimatic suitability for Aedes aegypti under climate change scenarios in Colombia. Heliyon 2019, 6, e03101. [Google Scholar] [CrossRef] [PubMed] [Green Version]
  46. De Luis, M.; Álvarez-Jiménez, J.; Labarga, J.M.M.; Bartolomé, C. Four climate change scenarios for Gypsophila bermejoi G. López (Caryophyllaceae) to address whether bioclimatic and soil suitability will overlap in the future. PLoS ONE 2019, 14, e0218160. [Google Scholar] [CrossRef] [Green Version]
  47. Yigini, Y.; Panagos, P. Assessment of soil organic carbon stocks under future climate and land cover changes in Europe. Sci. Total Environ. 2016, 557–558, 838–850. [Google Scholar] [CrossRef]
  48. Dimobe, K.; Kouakou, J.L.N.; Tondoh, J.E.; Zoungrana, B.J.-B.; Forkuor, G.; Ouédraogo, K. Predicting the Potential Impact of Climate Change on Carbon Stock in Semi-Arid West African Savannas. Land 2018, 7, 124. [Google Scholar] [CrossRef] [Green Version]
  49. Borrelli, P.; Robinson, D.A.; Panagos, P.; Lugato, E.; Yang, J.E.; Alewell, C.; Wuepper, D.; Montanarella, L.; Ballabio, C. Land use and climate change impacts on global soil erosion by water (2015–2070). Proc. Natl. Acad. Sci. USA 2020, 117, 21994–22001. [Google Scholar] [CrossRef]
  50. Wilson, R. Impacts of Climate Change on Fisheries in the Coastal and Marine Environments of Caribbean Small Island Developing States. Sci. Rev. 2017, 1994, 23–30. [Google Scholar]
  51. Chen, L.; Wang, Y.; Ren, C.; Zhang, B.; Wang, Z. Optimal Combination of Predictors and Algorithms for Forest Above-Ground Biomass Mapping from Sentinel and SRTM Data. Remote Sens. 2019, 11, 414. [Google Scholar] [CrossRef] [Green Version]
  52. Simard, M.; Zhang, K.; Rivera-Monroy, V.H.; Ross, M.S.; Ruiz, P.L.; Castañeda-Moya, E.; Twilley, R.R.; Rodriguez, E. Mapping Height and Biomass of Mangrove Forests in Everglades National Park with SRTM Elevation Data. Photogramm. Eng. Remote Sens. 2006, 72, 299–311. [Google Scholar] [CrossRef]
  53. Bai, J.; Meng, Y.; Gou, R.; Lyu, J.; Dai, Z.; Diao, X.; Zhang, H.; Luo, Y.; Zhu, X.; Lin, G. Mangrove diversity enhances plant biomass production and carbon storage in Hainan island, China. Funct. Ecol. 2021, 35, 774–786. [Google Scholar] [CrossRef]
  54. Singh, M.; Friess, D.A.; Vilela, B.; De Alban, J.D.T.; Monzon, A.K.V.; Veridiano, R.K.A.; Tumaneng, R.D. Spatial relationships between above-ground biomass and bird species biodiversity in Palawan, Philippines. PLoS ONE 2017, 12, e0186742. [Google Scholar] [CrossRef] [PubMed] [Green Version]
  55. Wang, D.; Wan, B.; Liu, J.; Su, Y.; Guo, Q.; Qiu, P.; Wu, X. Estimating aboveground biomass of the mangrove forests on northeast Hainan Island in China using an upscaling method from field plots, UAV-LiDAR data and Sentinel-2 imagery. Int. J. Appl. Earth Obs. Geoinf. 2019, 85, 101986. [Google Scholar] [CrossRef]
  56. Kuhn, M.; Wing, J.; Weston, S.; Williams, A.; Keefer, C.; Engelhardt, A.; Cooper, T.; Mayer, Z.; Kenkel, B. Caret: Classification and Regression Training. R Package Version 6.0-86; RStudio: Boston, MA, USA, 2020. [Google Scholar]
  57. Singh, M.; Evans, D.; Coomes, D.A.; Friess, D.A.; Tan, B.S.; Nin, C.S. Incorporating Canopy Cover for Airborne-Derived Assessments of Forest Biomass in the Tropical Forests of Cambodia. PLoS ONE 2016, 11, e0154307. [Google Scholar] [CrossRef] [PubMed] [Green Version]
  58. Horton, B.P.; Khan, N.S.; Cahill, N.; Lee, J.S.H.; Shaw, T.A.; Garner, A.J.; Kemp, A.C.; Engelhart, S.E.; Rahmstorf, S. Estimating global mean sea-level rise and its uncertainties by 2100 and 2300 from an expert survey. NPJ Clim. Atmos. Sci. 2020, 3, 18. [Google Scholar] [CrossRef]
  59. Dang, A.T.; Kumar, L.; Reid, M.; Anh, L.N.T. Modelling the susceptibility of wetland plant species under climate change in the Mekong Delta, Vietnam. Ecol. Inform. 2021, 64, 101358. [Google Scholar] [CrossRef]
  60. Gesch, D.B. Best Practices for Elevation-Based Assessments of Sea-Level Rise and Coastal Flooding Exposure. Front. Earth Sci. 2018, 6, 230. [Google Scholar] [CrossRef] [Green Version]
  61. Minderhoud, P.S.J.; Coumou, L.; Erkens, G.; Middelkoop, H.; Stouthamer, E. Mekong delta much lower than previously assumed in sea-level rise impact assessments. Nat. Commun. 2019, 10, 3847. [Google Scholar] [CrossRef]
  62. Rogers, K.; Saintilan, N.; Mazumder, D.; Kelleway, J. Mangrove dynamics and blue carbon sequestration. Biol. Lett. 2019, 15, 20180471. [Google Scholar] [CrossRef] [Green Version]
  63. Panpeng, J.; Ahmad, M.M. Vulnerability of Fishing Communities from Sea-Level Change: A Study of Laemsing District in Chanthaburi Province, Thailand. Sustainability 2017, 9, 1388. [Google Scholar] [CrossRef] [Green Version]
  64. Chatting, M.; Al-Maslamani, I.; Walton, M.; Skov, M.W.; Kennedy, H.; Husrevoglu, Y.S.; Le Vay, L. Future Mangrove Carbon Storage Under Climate Change and Deforestation. Front. Mar. Sci. 2022, 9, 781876. [Google Scholar] [CrossRef]
  65. Chatting, M.; LeVay, L.; Walton, M.; Skov, M.W.; Kennedy, H.; Wilson, S.; Al-Maslamani, I. Mangrove carbon stocks and biomass partitioning in an extreme environment. Estuar. Coast. Shelf Sci. 2020, 244, 106940. [Google Scholar] [CrossRef]
  66. Banerjee, K.; Sahoo, C.K.; Bal, G.; Mallik, K.; Paul, R.; Mitra, A. High blue carbon stock in mangrove forests of Eastern India. Trop. Ecol. 2020, 61, 150–167. [Google Scholar] [CrossRef]
  67. Atsbha, T.; Desta, A.B.; Zewdu, T. Carbon sequestration potential of natural vegetation under grazing influence in Southern Tigray, Ethiopia: Implication for climate change mitigation. Heliyon 2019, 5, e02329. [Google Scholar] [CrossRef] [PubMed] [Green Version]
  68. Richards, D.R.; Friess, D.A. Rates and drivers of mangrove deforestation in Southeast Asia, 2000–2012. Proc. Natl. Acad. Sci. USA 2016, 113, 344–349. [Google Scholar] [CrossRef] [Green Version]
  69. Gandhi, S.; Jones, T.G. Identifying Mangrove Deforestation Hotspots in South Asia, Southeast Asia and Asia-Pacific. Remote Sens. 2019, 11, 728. [Google Scholar] [CrossRef] [Green Version]
  70. Sharma, S.; MacKenzie, R.A.; Tieng, T.; Soben, K.; Tulyasuwan, N.; Resanond, A.; Blate, G.; Litton, C.M. The impacts of degradation, deforestation and restoration on mangrove ecosystem carbon stocks across Cambodia. Sci. Total Environ. 2019, 706, 135416. [Google Scholar] [CrossRef] [PubMed]
  71. Blanco, J.F.; Estrada, E.A.; Ortiz, L.F.; Urrego, L.E. Ecosystem-Wide Impacts of Deforestation in Mangroves: The Urabá Gulf (Colombian Caribbean) Case Study. ISRN Ecol. 2012, 2012, 958709. [Google Scholar] [CrossRef] [Green Version]
  72. Dinerstein, E.; Olson, D.; Joshi, A.; Vynne, C.; Burgess, N.D.; Wikramanayake, E.; Hahn, N.; Palminteri, S.; Hedao, P.; Noss, R.; et al. An Ecoregion-Based Approach to Protecting Half the Terrestrial Realm. Bioscience 2017, 67, 534–545. [Google Scholar] [CrossRef]
  73. Saura, S.; Bastin, L.; Battistella, L.; Mandrici, A.; Dubois, G. Protected areas in the world’s ecoregions: How well connected are they? Ecol. Indic. 2017, 76, 144–158. [Google Scholar] [CrossRef]
  74. Saenger, P.; Ragavan, P.; Sheue, C.-R.; López-Portillo, J.; Yong, J.W.H.; Mageswaran, T. Mangrove Biogeography of the Indo-Pacific. In Sabkha Ecosystems; Springer: Berlin/Heidelberg, Germany, 2019; pp. 379–400. [Google Scholar] [CrossRef]
  75. Banerjee, K.; Gatti, R.C.; Mitra, A. Climate change-induced salinity variation impacts on a stenoecious mangrove species in the Indian Sundarbans. Ambio 2016, 46, 492–499. [Google Scholar] [CrossRef] [PubMed] [Green Version]
  76. Sasmito, S.D.; Murdiyarso, D.; Friess, D.A.; Kurnianto, S. Can mangroves keep pace with contemporary sea level rise? A global data review. Wetl. Ecol. Manag. 2015, 24, 263–278. [Google Scholar] [CrossRef]
  77. Di Nitto, D.; Neukermans, G.; Koedam, N.; Defever, H.; Pattyn, F.; Kairo, J.G.; Dahdouh-Guebas, F. Mangroves facing climate change: Landward migration potential in response to projected scenarios of sea level rise. Biogeosciences 2014, 11, 857–871. [Google Scholar] [CrossRef] [Green Version]
  78. Suyadi; Gao, J.; Lundquist, C.J.; Schwendenmann, L. Land-based and climatic stressors of mangrove cover change in the Auckland Region, New Zealand. Aquat. Conserv. Mar. Freshw. Ecosyst. 2019, 29, 1466–1483. [Google Scholar] [CrossRef]
  79. Komiyama, A.; Kato, S.; Poungparn, S.; Sangtiean, T.; Maknual, C.; Piriyayotha, S.; Jintana, V.; Prawiroatmodjo, S.; Sastrosuwondo, P.; Ogino, K. Comprehensive dataset of mangrove tree weights in Southeast Asia. Ecol. Res. 2016, 32, 3. [Google Scholar] [CrossRef]
  80. Gao, J; Lundquist, C.J.; Schwendenmann, L. Aboveground Carbon Stocks in Rapidly Expanding Mangroves in New Zealand: Regional Assessment and Economic Valuation of Blue Carbon. Estuaries Coasts 2020, 43, 1456–1469. [Google Scholar] [CrossRef]
  81. Thormann, I.; Reeves, P.; Reilley, A.; Engels, J.M.M.; Lohwasser, U.; Börner, A.; Pillen, K.; Richards, C. Geography of Genetic Structure in Barley Wild Relative Hordeum vulgare subsp. spontaneum in Jordan. PLoS ONE 2016, 11, e0160745. [Google Scholar] [CrossRef] [PubMed] [Green Version]
Figure 1. Changes in AGC stocks between the present and future of the RCP scenarios 2.6, 4.5, and 8.5 (2070).
Sustainability 14 03873 g001
Figure 2. Changes in BGC stocks between the present and future of the RCP scenarios 2.6, 4.5, and 8.5 (2070).
Sustainability 14 03873 g002
Figure 3. Changes in SOC stocks between the present and future of the RCP scenarios 2.6, 4.5, and 8.5 (2070).
Sustainability 14 03873 g003
Table 1. Mangrove-dominated MEOWs.
RealmProvinceEcoregion
Central Indo-PacificEastern Coral TriangleBismarck Sea
Solomon Archipelago
Solomon Sea
Southeast Papua New Guinea
Java TransitionalSouthern Java
Northern Australian ShelfCentral and Southern Great Barrier Reef
Torres Strait Northern Great Barrier Reef
Northwest Australian ShelfExmouth to Broome
Ningaloo
Sahul ShelfArafura Sea
Arnhem Coast to Gulf of Carpenteria
Bonaparte Coast
Gulf of Papua
South China SeaGulf of Tonkin
Southern China
South KuroshioSouth Kuroshio
Sunda ShelfGulf of Thailand
Malacca Strait
Southern Vietnam
Sunda Shelf/Java Sea
Tropical Southwestern PacificFiji Islands
New Caledonia
Tonga Islands
Vanuatu
Western Coral TriangleBanda Sea
Eastern Philippines
Halmahera
Lesser Sunda
Northeast Sulawesi
Palawan/North Borneo
Papua
Sulawesi Sea/Makassar Strait
Eastern Indo-PacificCentral PolynesiaSamoa Islands
HawaiiHawaii
Temperate AustralasiaEast Central Australian ShelfManning-Hawkesbury
Tweed-Moreton
Northern New ZealandNortheastern New Zealand
Southeast Australian ShelfBassian
Cape Howe
Southwest Australian ShelfGreat Australian Bight
South Australian Gulfs
West Central Australian ShelfShark Bay
Temperate Northern AtlanticWarm Temperate Northwest AtlanticCarolinian
Northern Gulf of Mexico
Temperate Northern PacificWarm Temperate Northeast PacificCortezian
Magdalena Transition
Southern California Bight
Warm Temperate Northwest PacificCentral Kuroshio Current
East China Sea
Temperate South AmericaWarm Temperate Southeastern PacificCentral Peru
Warm Temperate Southwestern AtlanticSoutheastern Brazil
Temperate Southern AfricaAgulhasNatal
Tropical AtlanticGulf of GuineaAngolan
Gulf of Guinea Central
Gulf of Guinea South
Gulf of Guinea Upwelling
Gulf of Guinea West
North Brazil ShelfAmazonia
Guianan
Tropical Northwestern AtlanticBahamian
Eastern Caribbean
Floridian
Greater Antilles
Southern Caribbean
Southern Gulf of Mexico
Southwestern Caribbean
Western Caribbean
Tropical Southwestern AtlanticEastern Brazil
Northeastern Brazil
West African TransitionSahelian Upwelling
Tropical Eastern PacificGalapagosEastern Galapagos Islands
Western Galapagos Islands
Tropical East PacificChiapas-Nicaragua
Guayaquil
Mexican Tropical Pacific
Nicoya
Panama Bight
Western Indo-PacificAndamanAndaman and Nicobar Islands
Andaman Sea Coral Coast
Western Sumatra
Bay of BengalEastern India
Northern Bay of Bengal
Red Sea and Gulf of AdenGulf of Aden
Northern and Central Red Sea
Southern Red Sea
Somali/ArabianArabian (Persian) Gulf
Gulf of Oman
Western Arabian Sea
West and South Indian ShelfSouth India and Sri Lanka
Western India
Western Indian OceanBight of Sofala/Swamp Coast
Delagoa
East African Coral Coast
Northern Monsoon Current Coast
Western and Northern Madagascar
Table 2. Predictors used in research.
Variable CategoriesVariables
Bioclimatic variablesAnnual temperature (BIO1), temperature seasonality (BIO4), annual precipitation (BIO12), and precipitation seasonality (BIO15)
SpeciesMangrove species richness
TopographyElevation, soil erosion by water
Table 3. Ecoregions projected to undergo a decline in all three carbon stocks.
EcoregionsCountries
Gulf of PapuaOceania (Papua New Guinea)
VanuatuOceania (Vanuatu)
Palawan/North BorneoSE Asia (Borneo and the Palawan Islands, Philippines)
PapuaOceania (Papua New Guinea)
Central Kuroshio CurrentEast Asia (Japan)
AngolanSW Africa (Angola)
Gulf of Guinea WestNW Africa
AmazoniaSouth America (Brazil)
GuiananSouth America (French Guiana, Guyana, Suriname)
Northeastern BrazilSouth America (Brazil)
Andaman and Nicobar IslandsSouth Asia (Southeastern India)
Andaman Sea Coral CoastSE Asia (Thailand)
Publisher’s Note: MDPI stays neutral with regard to jurisdictional claims in published maps and institutional affiliations.

