Article

SARS-CoV-2 Dynamics in the Mucus Layer of the Human Upper Respiratory Tract Based on Host–Cell Dynamics

1
Interdisciplinary Graduate School of Engineering Sciences, Kyushu University, Fukuoka 816-8580, Japan
2
Faculty of Engineering Sciences, Kyushu University, Fukuoka 816-8580, Japan
*
Author to whom correspondence should be addressed.
Sustainability 2022, 14(7), 3896; https://doi.org/10.3390/su14073896
Submission received: 10 February 2022 / Revised: 9 March 2022 / Accepted: 23 March 2022 / Published: 25 March 2022
(This article belongs to the Special Issue Ventilation and Indoor Air Quality in Sustainable Buildings)

Abstract

:
A thorough understanding of the inhalation dynamics of infectious aerosols indoors and infection dynamics within the host by inhaled viruses such as severe acute respiratory syndrome coronavirus 2 (SARS-CoV-2) plays an important role in the assessment and control of infection risks indoors. Here, by combining computational fluid–particle dynamics (CFPD) and host–cell dynamics (HCD), SARS-CoV-2 infection dynamics in the mucus layer of the human upper airway were studied. To reproduce the diffusive and convective transport of the virus in the nasal cavity–nasopharynx by mucociliary motion, a three-dimensional (3D)-shell model with a mucus layer was developed. The initial virus concentrations for HCD calculation were estimated based on the deposition distribution of droplets with representative sizes analyzed by CFPD. To develop a new HCD model, the target-cell-limited model was integrated with the convection–diffusion equation. Additionally, the sensitivity of the infection rate β to the infection dynamics was systematically investigated. The results showed that the time series of SARS-CoV-2 concentration in the mucus layer strongly depended on diffusion, convection, and β. Although the SARS-CoV-2 dynamics obtained here have not been verified by corresponding clinical data, they can preliminarily reveal its transmission mode in the upper airway, which will contribute to the prevention and treatment of coronavirus disease 2019.

1. Introduction

The spread of the coronavirus disease 2019 (COVID-19), which has beset the people worldwide for nearly two years as of February 2022, remains an ongoing issue. To date, more than 0.44 billion transmission cases have been confirmed, including over 5.9 million deaths [1]. The severe acute respiratory syndrome coronavirus 2 (SARS-CoV-2), a novel coronavirus with a diameter of approximately 0.1 μm, plays a critical role in causing pneumonia [2,3].
To better understand the infection dynamics of SARS-CoV-2, many researchers have conducted extensive clinical case studies and evaluated its transmission and the pathogenesis of COVID-19. Among them, several studies [4,5,6,7,8] have assessed the viral load from multiple sampling sites (nasopharyngeal, sputum, blood, urine, and stool) of patients in different regions, ages, and stages for several days and analyzed the epidemiological characteristics and clinical course of COVID-19 to provide a clear understanding of its natural history. In addition, some experts [9,10,11] focused on the dynamic analysis of SARS-CoV-2 in the saliva of patients with a consistently high viral load. Therefore, saliva has the potential to be a non-invasive specimen for SARS-CoV-2 diagnosis and viral load monitoring, which can reduce the risk of nosocomial transmission. However, further investigation is needed to elucidate the correlation between salivary viral load and disease severity. Unlike previous studies, Zou et al. [12] observed the changes in the viral load in the upper respiratory tract of 17 patients using nasal and pharyngeal swabs and detected high viral loads shortly after symptom onset, with higher viral loads being detected in the nose than in the throat; however, comprehensive data were needed to determine transmission dynamics. He et al. [13] reported the temporal patterns of viral shedding in 94 confirmed COVID-19 patients and simulated the characteristics of SARS-CoV-2 infectivity in 77 infector–infectee transmission pairs. The findings indicated that the viral load was the highest in the throat swabs at the time of symptom onset and inferred that the infectious peak time was at or before symptom onset; hence, there could be a lot of potential for pre-symptomatic transmission. Similar results were reported by To et al. [14], but their findings also underscored the importance of strict infection control and early use of powerful antiviral drugs in high-risk groups. Kissler et al. [15] measured viral RNA trajectories in 68 patients. Among these, the peak viral concentration and duration of the viral proliferation and clearance phases were inferred in 46 acutely infected patients. The results showed that symptom severity did not affect the rapid peak of SARS-CoV-2 concentration. Kim et al. [16] indicated that the viral load dynamics of SARS-CoV-2 may differ from those of previously reported coronavirus infections, such as SARS-CoV, after studying the viral load dynamics in the first two confirmed patients in South Korea. Severe acute respiratory syndrome coronavirus 2 can infect multiple cell types, and then replicate in them, including epithelial cells in the respiratory tract [17]. In particular, there is evidence that unlike SARS-CoV, SARS-CoV-2 can replicate in the upper respiratory tract, as reported by Wölfel et al. [18]. They performed detailed virological analyses of nine cases, confirming that the virus was actively replicating in the larynx. These findings have important implications for the prevention of infection. In addition, the viral loads of several symptomatic and asymptomatic patients with nasopharyngeal swabs showed that nasal epithelial cells were the initial point of infection and transmission [19].
To accurately predict the evolution of viral load, researchers in the field of mathematical or theoretical biology have proposed reasonable methods, that is, the host–cell dynamics (HCD) model. Hernandez-Vargas et al. [17] first studied the human–host mathematical model based on a target-cell-limited model for SARS-CoV-2. The results showed that the viral replication number of SARS-CoV-2 in the host was consistent with the broad value of human influenza infection. In addition, a complex model that considered immune cell responses suggested slow immune response peaks at 5 to 10 d after symptom onset. Fatehi et al. [20] presented an intracellular dynamics model of COVID-19 based on random subjects. They tried to combine these predictions with an intercellular model of intra-host infection dynamics to fit clinical data [18], and then to obtain a profile of disease progression in recovered patients without treatment. A multi-scale semi-mechanistic model was developed by Dogra et al. [21] to predict the systemic viral distribution dynamics and viral excretion of SARS-CoV-2 by combining human cell-scale viral dynamics with physiological processes related to viral transport and innate and adaptive immune responses; the model was well calibrated with published in vivo and clinical data. However, the limitation of this model was that it could not be verified clinically with the prediction of extrapulmonary compartments. Sadria et al. [22] combined the adaptive immunity term to the dynamic model of the innate immune response to influenza A virus infection and developed a new model represented by SARS-CoV-2 specific antibody to study SARS-CoV-2 dynamics. Although the clinical relevance of the analysis and conclusions might be limited by the simplification presented in the model and the continuing lack of characterization of the nature and immune response of SARS-CoV-2, this did not prevent it from describing the complex dynamics of SARS-CoV-2 in systemic circulation, as well as the innate and adaptive immune responses of the host. In addition, some scholars have evaluated the effects of drugs on viral load dynamics, based on studies of viral dynamics and in conjunction with other disciplines. Gonçalves et al. [23] matched a mathematical model of viral dynamics with in vivo data to estimate the parameters driving viral replication. Their study combined pharmacokinetic/pharmacodynamic and viral dynamics modeling to predict the effects of lopinavir/ritonavir, hydroxychloroquine, interferon (IFN)-β-1 A, and remdesivir on viral load dynamics. Nevertheless, Czuppon et al. [24] studied SARS-CoV-2 dynamics using a stochastic analog of a standard target-cell-limited model, which considered the virus eclipse period and whether it was a noninfectious virion, and found that precise values of the basic reproduction number R0 and the burst size N within the host were critical for predicting the outcome. In addition, they used a more sophisticated model to evaluate the effects of different drugs on the early stages of viral infection and found that the maximum delay in viral infection was achieved by reducing viral production in infected cells. Both studies agreed that early intervention with drugs was necessary to inhibit viral load growth.
The transmission mechanism of this virus is changeable and intricate, and aerosol transmission is commonly considered as an important and hot topic in the current discussion. Droplets carrying the virus spread when a patient sneezes and coughs. Of these, larger particles settle naturally, while small particles can remain suspended in the air for a long time. Therefore, five detailed case studies and an airborne physical model were used by Prentiss et al. [25] to estimate the characteristic number of SARS-CoV-2 required to induce infection in each case and to provide a basis for estimating the risk of daily activities. If these virus-laden droplets are inhaled by others, some will be deposited in the upper respiratory tract. Similar to the influenza A virus (IAV) studied by Haghnegahdar et al. [26], airborne transmission of infectious materials from infected people is often considered the decisive mechanism of transmission. They developed and used an experimentally validated computational fluid and particle dynamics (CFPD-HCD) model to simulate the transport and immune system response of inhaled IAV-loaded droplets in the human respiratory system. In addition to considering the droplet interaction with water vapor, a one-way coupled Euler–Lagrange-format CFPD model was used to simulate the aerodynamics of virus-carrying droplets in the respiratory system with transient breathing patterns. The simulation results of the local deposition patterns could be transferred to the HCD model as an input to determine the regional host dynamic response. The results showed that most of the droplets in the case of nasal inhalation were concentrated in the nasal cavity, with a few concentrated in the pharynx, but in the case of oral inhalation, the droplets were mainly deposited in the oral cavity and pharynx. Accordingly, the activated dendritic cells had a similar distribution.
Nevertheless, it is important to note that when virus-laden droplets enter the upper respiratory tract, they are deposited in the mucus layer on the airway surface. A series of activities, such as convection, diffusion, and apoptosis in the mucus layer before the virus reaches the target cells, are often ignored in viral load calculations. It is impractical and unethical to experiment with viruses in the human respiratory tract. At this point, the computational fluid dynamics (CFD) simulations should be considered. Given that the mucus layer is thin compared to the size of the airway structure, modeling and calculating it is not easy. Some scholars have tried a few methods to simulate mucus motion, especially in the field of intranasal drug delivery, which is worth learning from. For the nasal cavity, Rygg et al. [27] proposed a method to transform the nasal cavity into a surface-based two-dimensional (2D) model, introducing mucus uniformly into the surface computational domain, delivering it to the nasopharynx, and performing CFD simulations. On this basis, Shang et al. [28] developed two new models: the unwrapped-surface model and three-dimensional (3D)-shell surface model using the surface unwrapping technique that preserves the nasal topology. Comparing the two models, the shell model was recommended because the results of the calculated mucus flow were more consistent with the experimental data.
As mentioned above, in this study, a combination of CFPD and HCD with a 3D shell human airway model was proposed to better characterize the infection dynamics of SARS-CoV-2 along the mucus layer of the upper respiratory tract.

2. Materials and Methods

2.1. SARS-CoV-2 Dynamics Prediction Based on the Target-Cell-Limited Model

This study was based on a 3D respiratory tract model created from the CT data of a healthy human by using Mimics (Materialise NV), as shown in Figure 1. The geometric model was divided into six sites, including the nasal vestibule, central nasal passage, nasopharynx, trachea, mouth cavity, and lower respiratory tract. Moreover, its surface mesh and volume mesh were created by using ANSYS/Spaceclaim for CFPD model. Assuming the worst-case scenario, in which a healthy person who has a breathing rate of 7.5 L/min (gentle breathing state) is in a close conversation with an infected person, 10,000 droplets coughed up by the infected person are assumed to be directly inhaled by the other person through nasal inhalation. Therefore, the mouth cavity and lower respiratory tract were neglected in this study.
Based on previously reported studies [29,30], the distribution of droplets released from a human cough is summarized and plotted in Figure 2. It can be clearly seen that more than 70% of the droplets were less than 10μm in diameter; therefore, five particle sizes (1, 2.5, 5, 7.5, and 10 μm) were selected as representatives consistent with the previous study [31] for the Lagrangian particle tracking analysis. Evaporation or condensation was not considered in this study. The regional and total deposition results were calculated according to the proportion in Figure 2 and detailed information is shown in Table 1.
The deposition of SARS-CoV-2-laden droplets in the upper respiratory tract is shown in Figure 3. This visual result was obtained by scaling and simply summing up the deposition data for the five particle sizes referring to their proportion of droplet size distribution. These deposition distribution results of SARS-CoV-2-laden droplets in the upper respiratory tract shown in Figure 3 are based on our previous reported CFPD analysis [31]. These droplets were mainly concentrated around the nasal cavity and throat, which may be responsible for nasal congestion and a sore throat in the early stages of infection. As can be seen from the percentage of deposited particles in Table 1, more than 90% of the fine particles entering the lower portion may cause serious symptoms.
In this study, SARS-CoV-2 dynamics were preliminarily calculated and described using the target-cell-limited model in HCD [17], which has been verified to fit the trend of clinical data well. The formulas used are as follows:
d T d t = β T V  
d I d t = β T V δ I
d V d t = p V m u c u s I c V
where T, I, and V represent the number of susceptible target cells, infected cells, and viral load, respectively. Referring to the initial conditions and parameter values of the validated model, infection occurred 3 d before symptom onset was assumed. For the initial conditions, the initial number of target cells, T(0), was estimated according to the regional surface area of the airway and the surface area of each epithelial cell that was selected as 4 × 10⁻¹¹ m2/cell [32]. Moreover, the initial virus load, V(0), was calculated from the droplet sizes and the percentage of deposition, as well as the amount of virus carried by each droplet, assumed to be 105 copies/mL, which depended greatly on the infection stages of the individuals. For the parameters, according to the mean values of the fitting parameters in Esteban’s study [17], which more closely fit the clinical data, that is, the onset of infection is 3 d before the onset of symptoms, the infection rate of the target cells, β, was assumed to be 4.71 × 10⁻⁸ (copies/mL) day−1, and the apoptosis of infected cells occurred at the rate of δ = 1.07 day−1. Meanwhile, the virus can be cleared at a rate of c = 2.4 day−1. Nevertheless, Equation (3) was modified slightly from the original model, and the rate of virus production in each part of the respiratory tract was calculated separately to replace the uniform rate p of virus production ((copies/mL)/day/cell), making the results closer to the actual situation. Hence, the virus production rate was set as p’ = 0.74 copies/day/cell, and the volume of mucus, Vmucus, was calculated as the product of surface area and thickness, which was set as 15 μm [28]. The results of this model were compared with the clinical data of nine patients, and Wölfel [18] verified its feasibility.

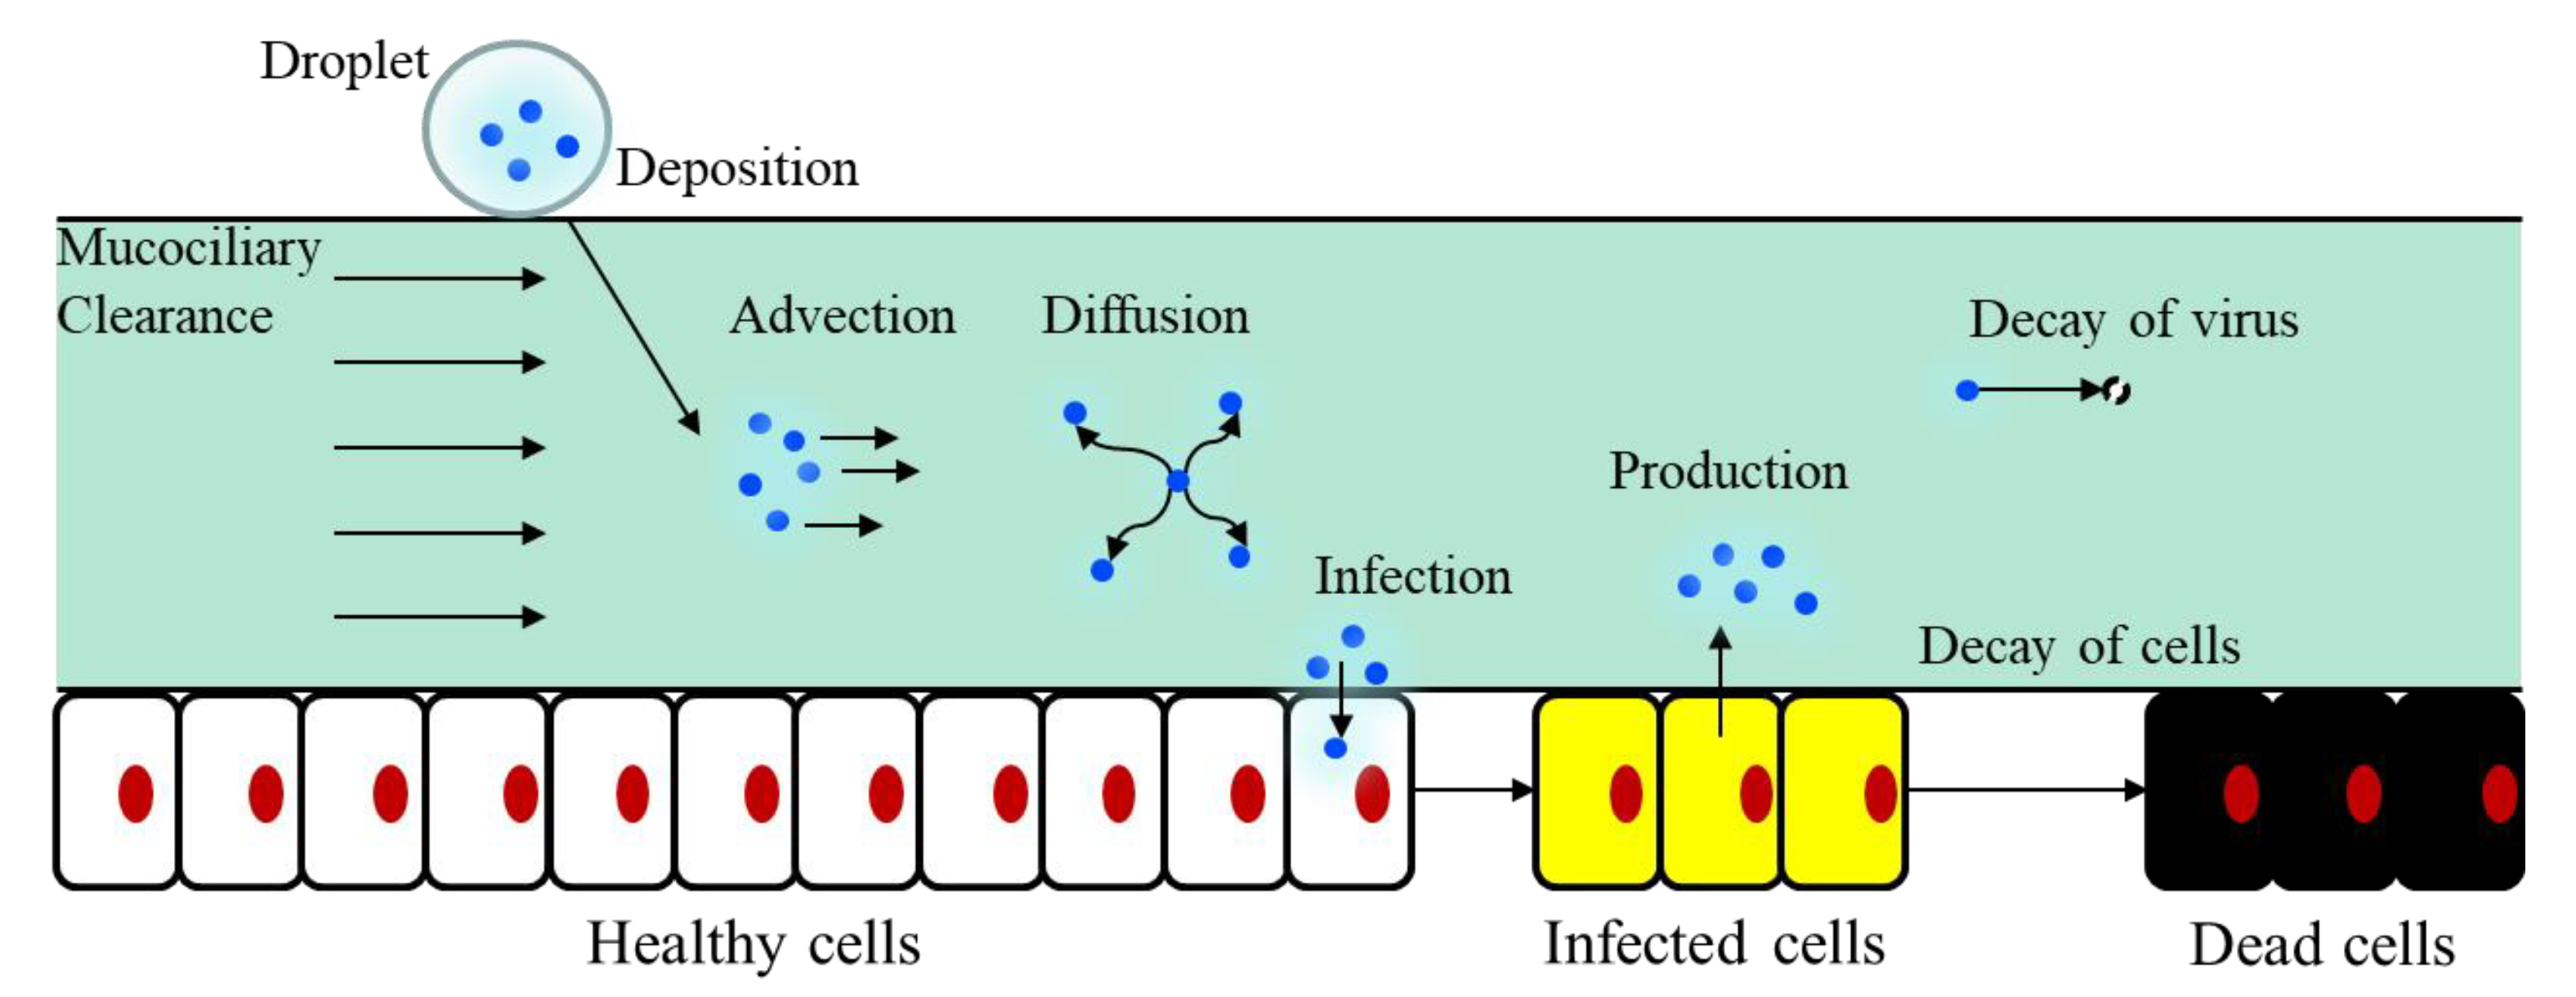
2.2. Coupling of Target-Cell Limited Model and Convection–Diffusion Model

The upper airway is the first entrance for inhaled infectious droplets to enter the human body. The deposition fraction of droplets in the upper airway, including the nasal cavity–nasopharynx, is significant. The SARS-CoV-2 dynamics in the human airway are closely related to the mucus layer that attaches to epithelial cells. Mucus is composed of two parts: the upper layer is a high-viscosity gel layer composed of 97% water and 3% other substances (mucin, salts, lipids, and immunoglobulins, etc.), with a thickness of 0.5~5 μm, and the lower layer is a 7~10-μm thick periciliary fluid layer infiltrating the cilia with viscosity similar to that of water [11,33,34]. The primary function of the mucus layer is to remove unwanted particles such as inhaled bacteria and viruses by rhythmic beating of cilia on the epithelium, which is called mucociliary clearance [34]. To highlight viral changes, as shown in Figure 4, the mucus layer was simplified to a single layer.
The model was divided into the upper and lower parts of the pharynx because mucociliary transport forms a flow from the entire airway to the pharynx and needs to be calculated separately. Here, the infection dynamics in the upper part, including the nasal cavity and nasopharynx, were studied. As shown in Figure 5, a 3D-shell model with a 15-μm thick mucus layer was developed. Meanwhile, the surface area was approximately 0.021 m2, so the mucus volume was calculated as 0.32 mL. Here, a source term was added to the continuity equation for the mucus domain [35], as follows:
S m = ρ ( · u )
The density ρ and viscosity μ were assumed as 1000 kg/m3 and 12 Pa·s, respectively. The nasopharynx, which is the site of the posterior nose, was assumed to be the exit of mucus produced in the nasal cavity. The mucus flow velocity at the pharynx region was assumed to be 10 mm/min [28], which determined the value of Sm. The outlets of the two nostrils were set as the pressure outlet at 0 Pa. Although two layers of mucus were simplified into one layer for calculation, and the specified shear stress of the mucus surface was set as 0, the contact surface of mucus and respiratory epithelium was set as the no-slip boundary, according to the characteristics of the cilia layer. Based on the droplet deposition results, appropriate sites were selected to simulate the local viral load with HCD and CFPD for 50 d in the milieu with mucus properties. In addition, mucus was assumed to be secreted by goblet cells in the epithelial cells [36] (sinus secretion was ignored here).
The evolution of viral load (V) was calculated by coupling the target-cell-limited model with the convection and diffusion terms. The parameter values such as T(0), V(0), β, δ, c, p’, and Vmucus were set to be the same as those in Section 2.1. The improved formulas are as follows:
V ¯ t + U i ¯ V ¯ x i = D m 2 V ¯ x i 2 + p V m u c u s I i c V ¯
T i t = β T i V
I i t = β T i V δ I i
Here, Ui represents the convection velocity of mucus flow. For the estimation of the virus diffusivity Dm, the formulas selected here refer to the calculation method of drug spray diffusion in the nasal mucus layer during intranasal administration [35]:
D m D 0 = e π 4 ( r v + r f r g + r f ) 2
D 0 = k B T 6 π μ 0 r v
where D0 represents the virus diffusion coefficient in water, while rv, rf, and rg express the effective radius of the virus, the mucin fiber radius, and the mucin network’s effective mesh fiber spacing, with values of 5 × 10⁻⁸ m, 3.5 × 10⁻⁹ m, and 5 × 10⁻⁸ m, respectively. To calculate D0, a constant temperature T of 310 K in the airway was assumed, and the viscosity of water μ0 was set as 0.00071 Pa·s. In addition, kB is the Boltzmann’s constant at 1.380649 × 10⁻²³ J/K.
In this study, we calculated two cases: Case 1 with only virus diffusion (no mucus flow) and Case 2 with both convection and diffusion (with mucus flow).

2.3. Changes in the Infection Rate of the Target Cells β

Owing to the limited clinical data currently available, parameters fitted by different studies based on different patient data varied greatly. Here, the initial number of target cells, T(0), in the nasal cavity–nasopharynx could be determined by the methods and values used in previous calculations in Section 2.1. According to Equations (5)–(7), the infection rate of the target cells, β, had the main effect on both the peak viral load and the time to reach the peak viral load, which should be focused on. Among the references [17,20,37,38], β has a wide range, varying from 1.9 × 10⁻⁴ to 3.86 × 10⁻¹⁴ ((copies/mL) day−1). Based on this range, this study selected a larger general range to include these values and divided them into seven cases to assess their effects on SARS-CoV-2 dynamics prediction. The detailed values are listed in Table 2. The first two methods and conditions in Section 2.1 and Section 2.2 were used to calculate these cases simultaneously, and the influences of the mucus layer on the calculation results were compared.

3. Results

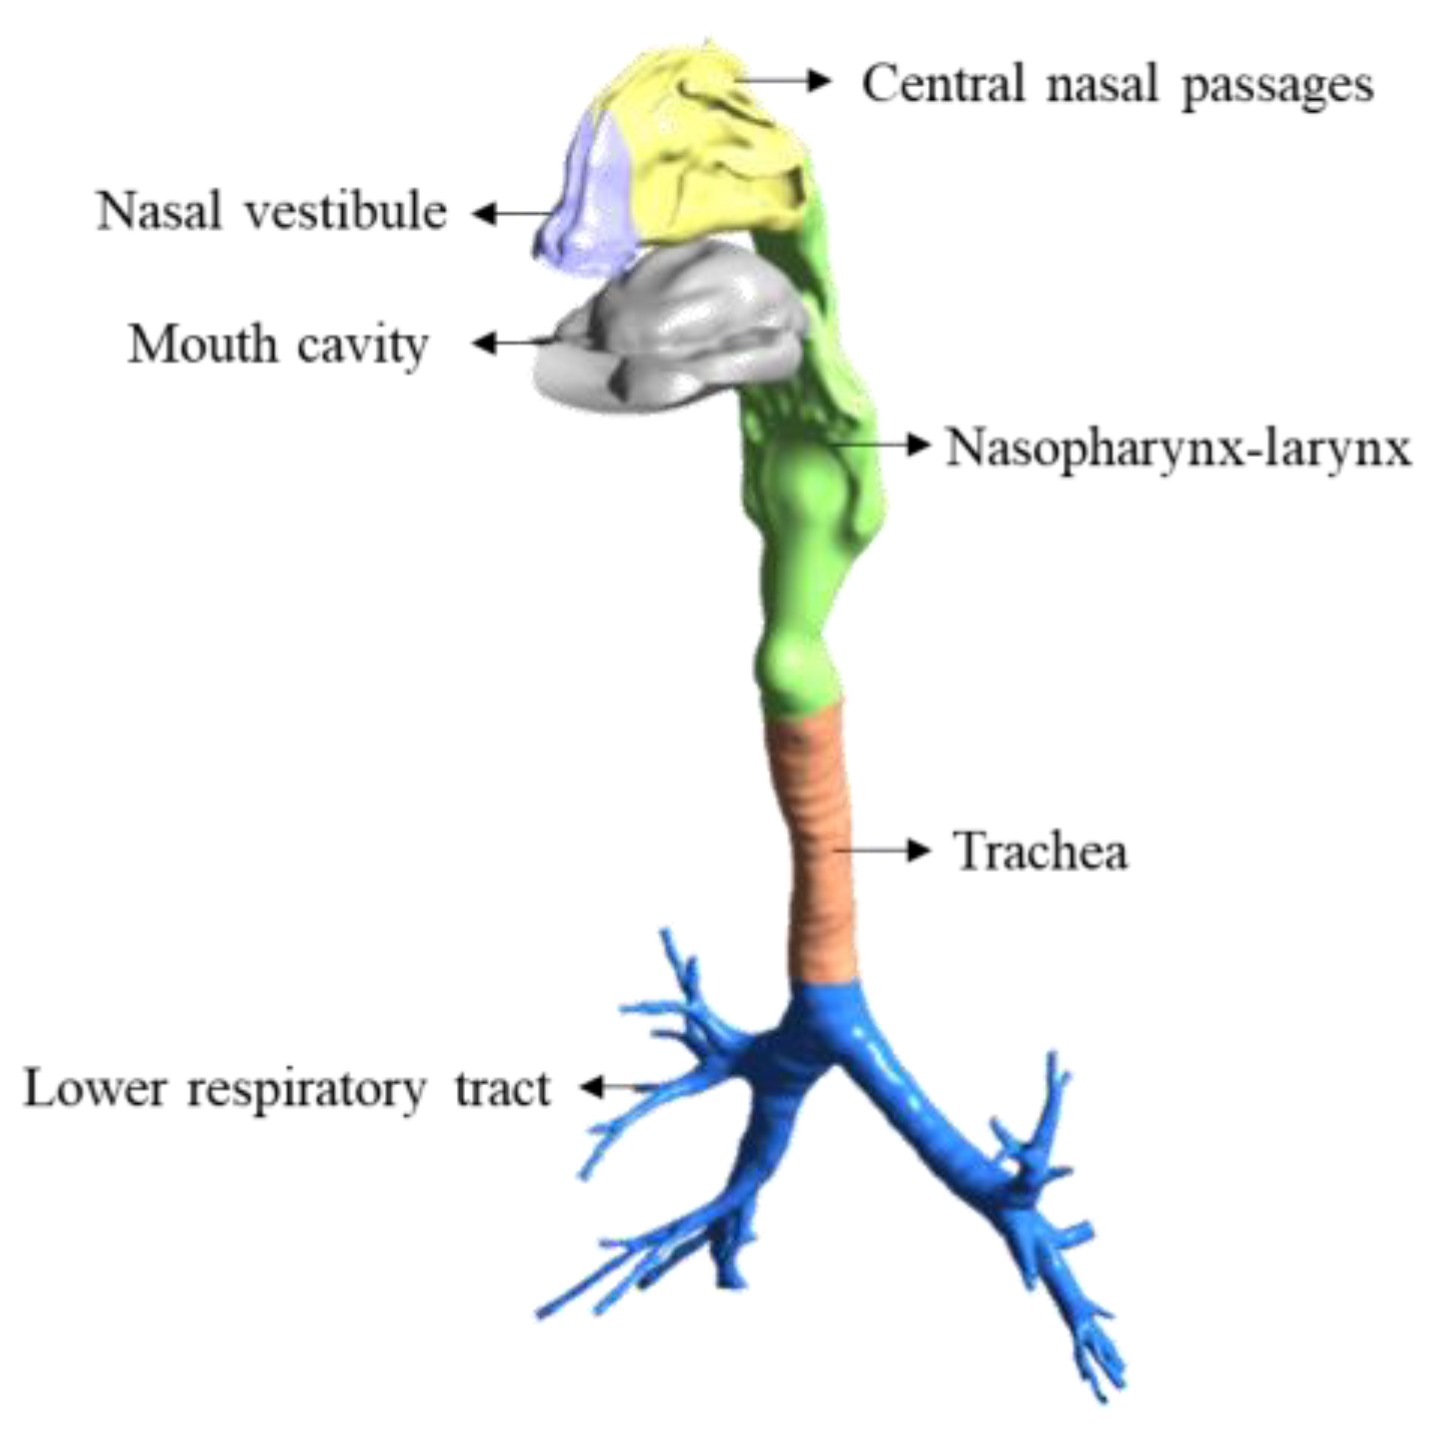
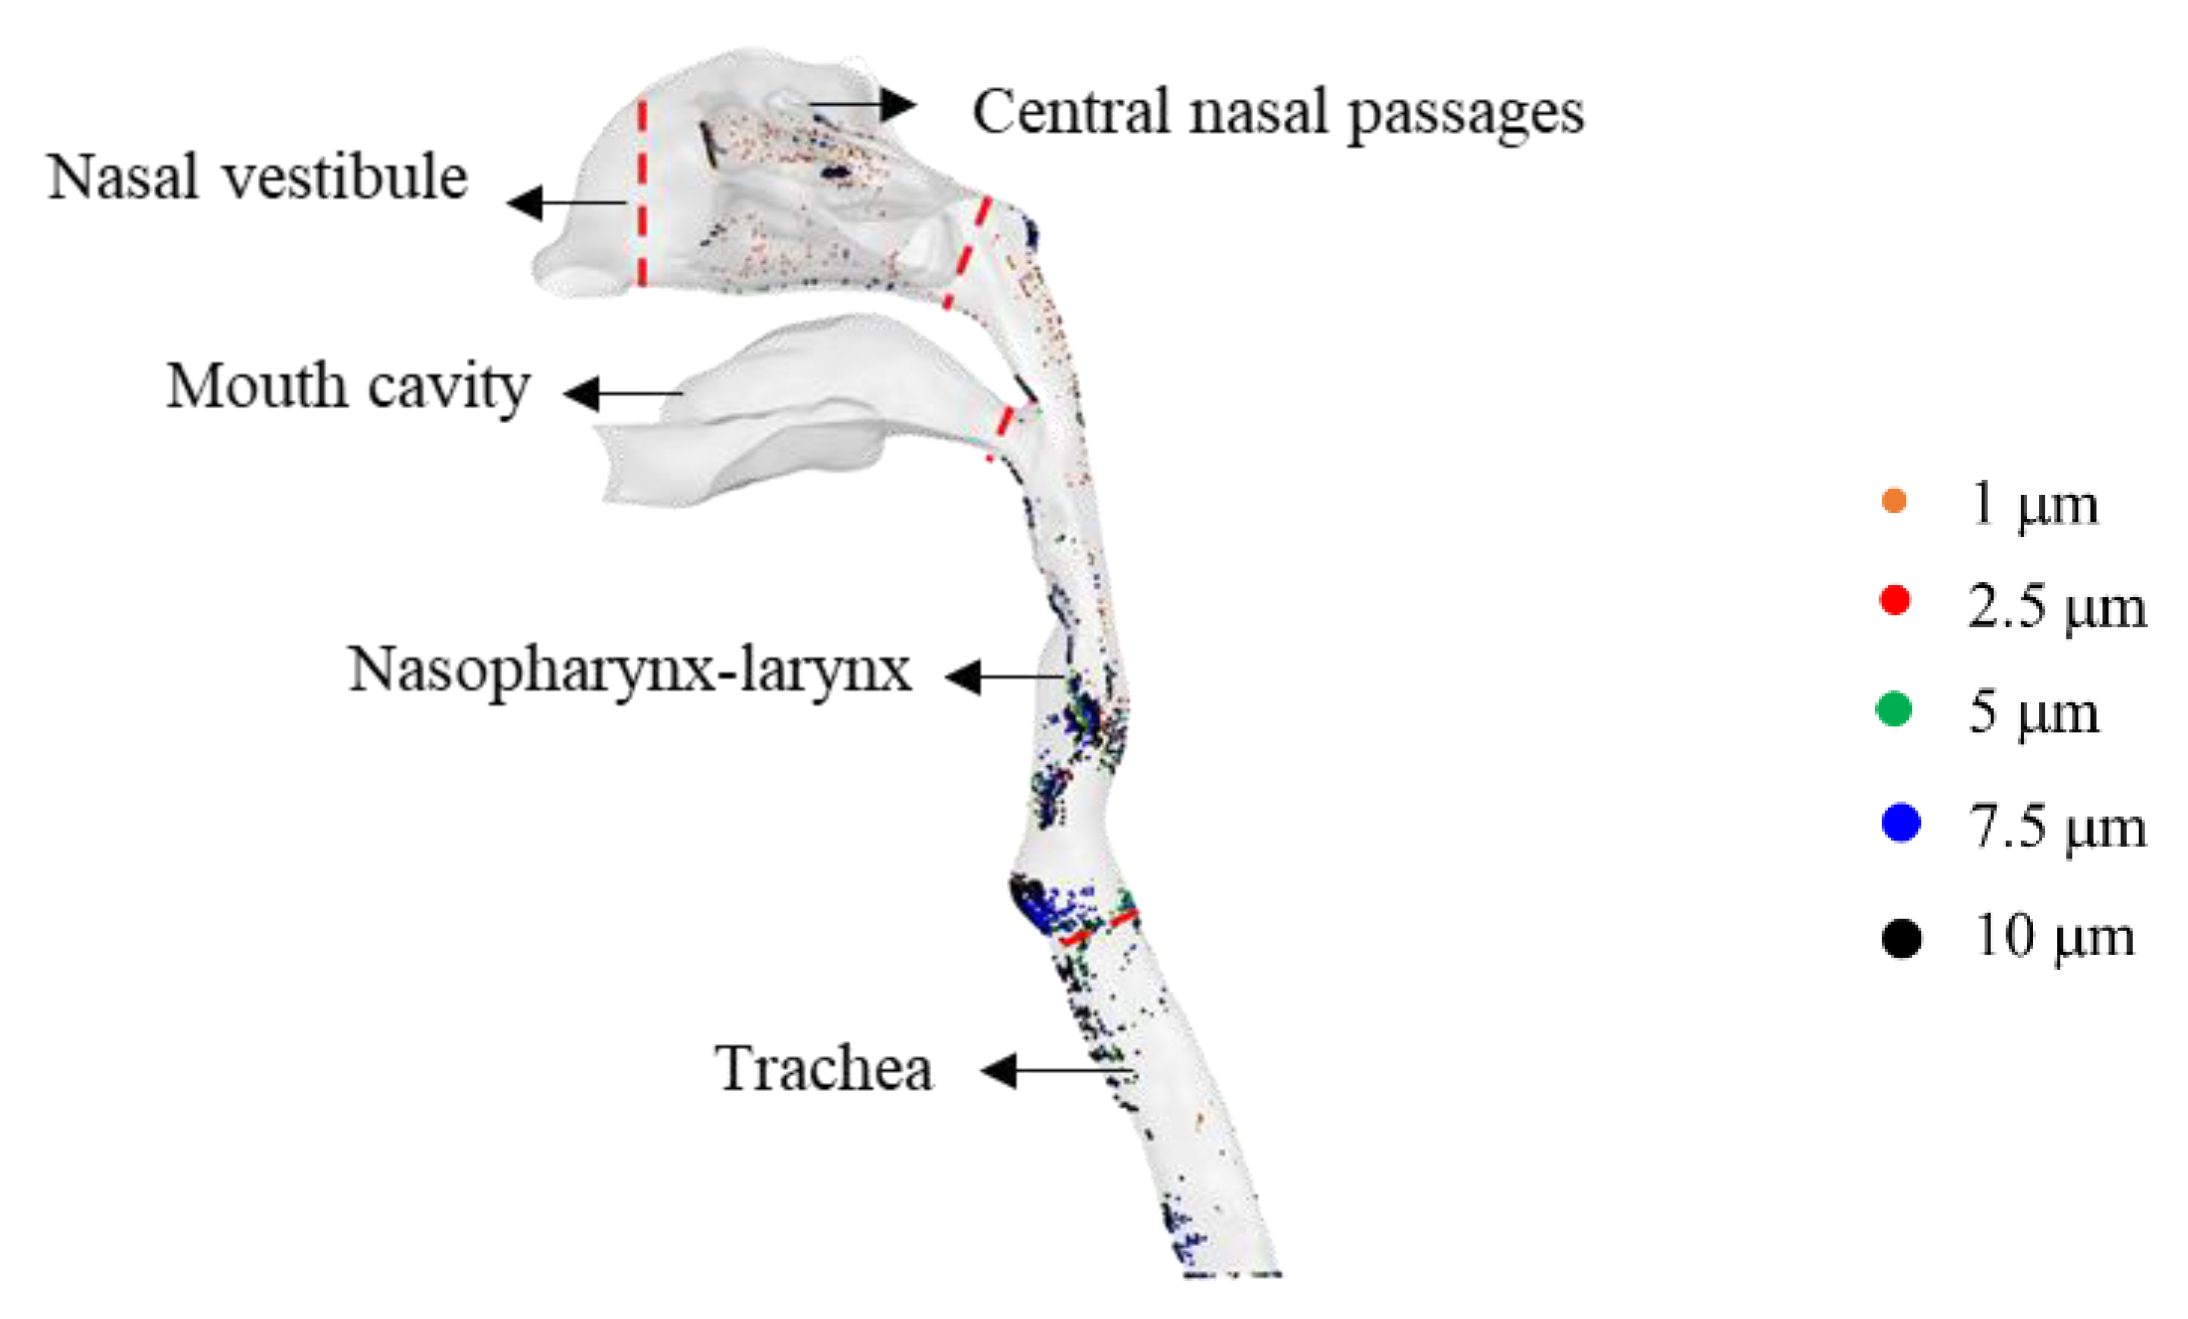
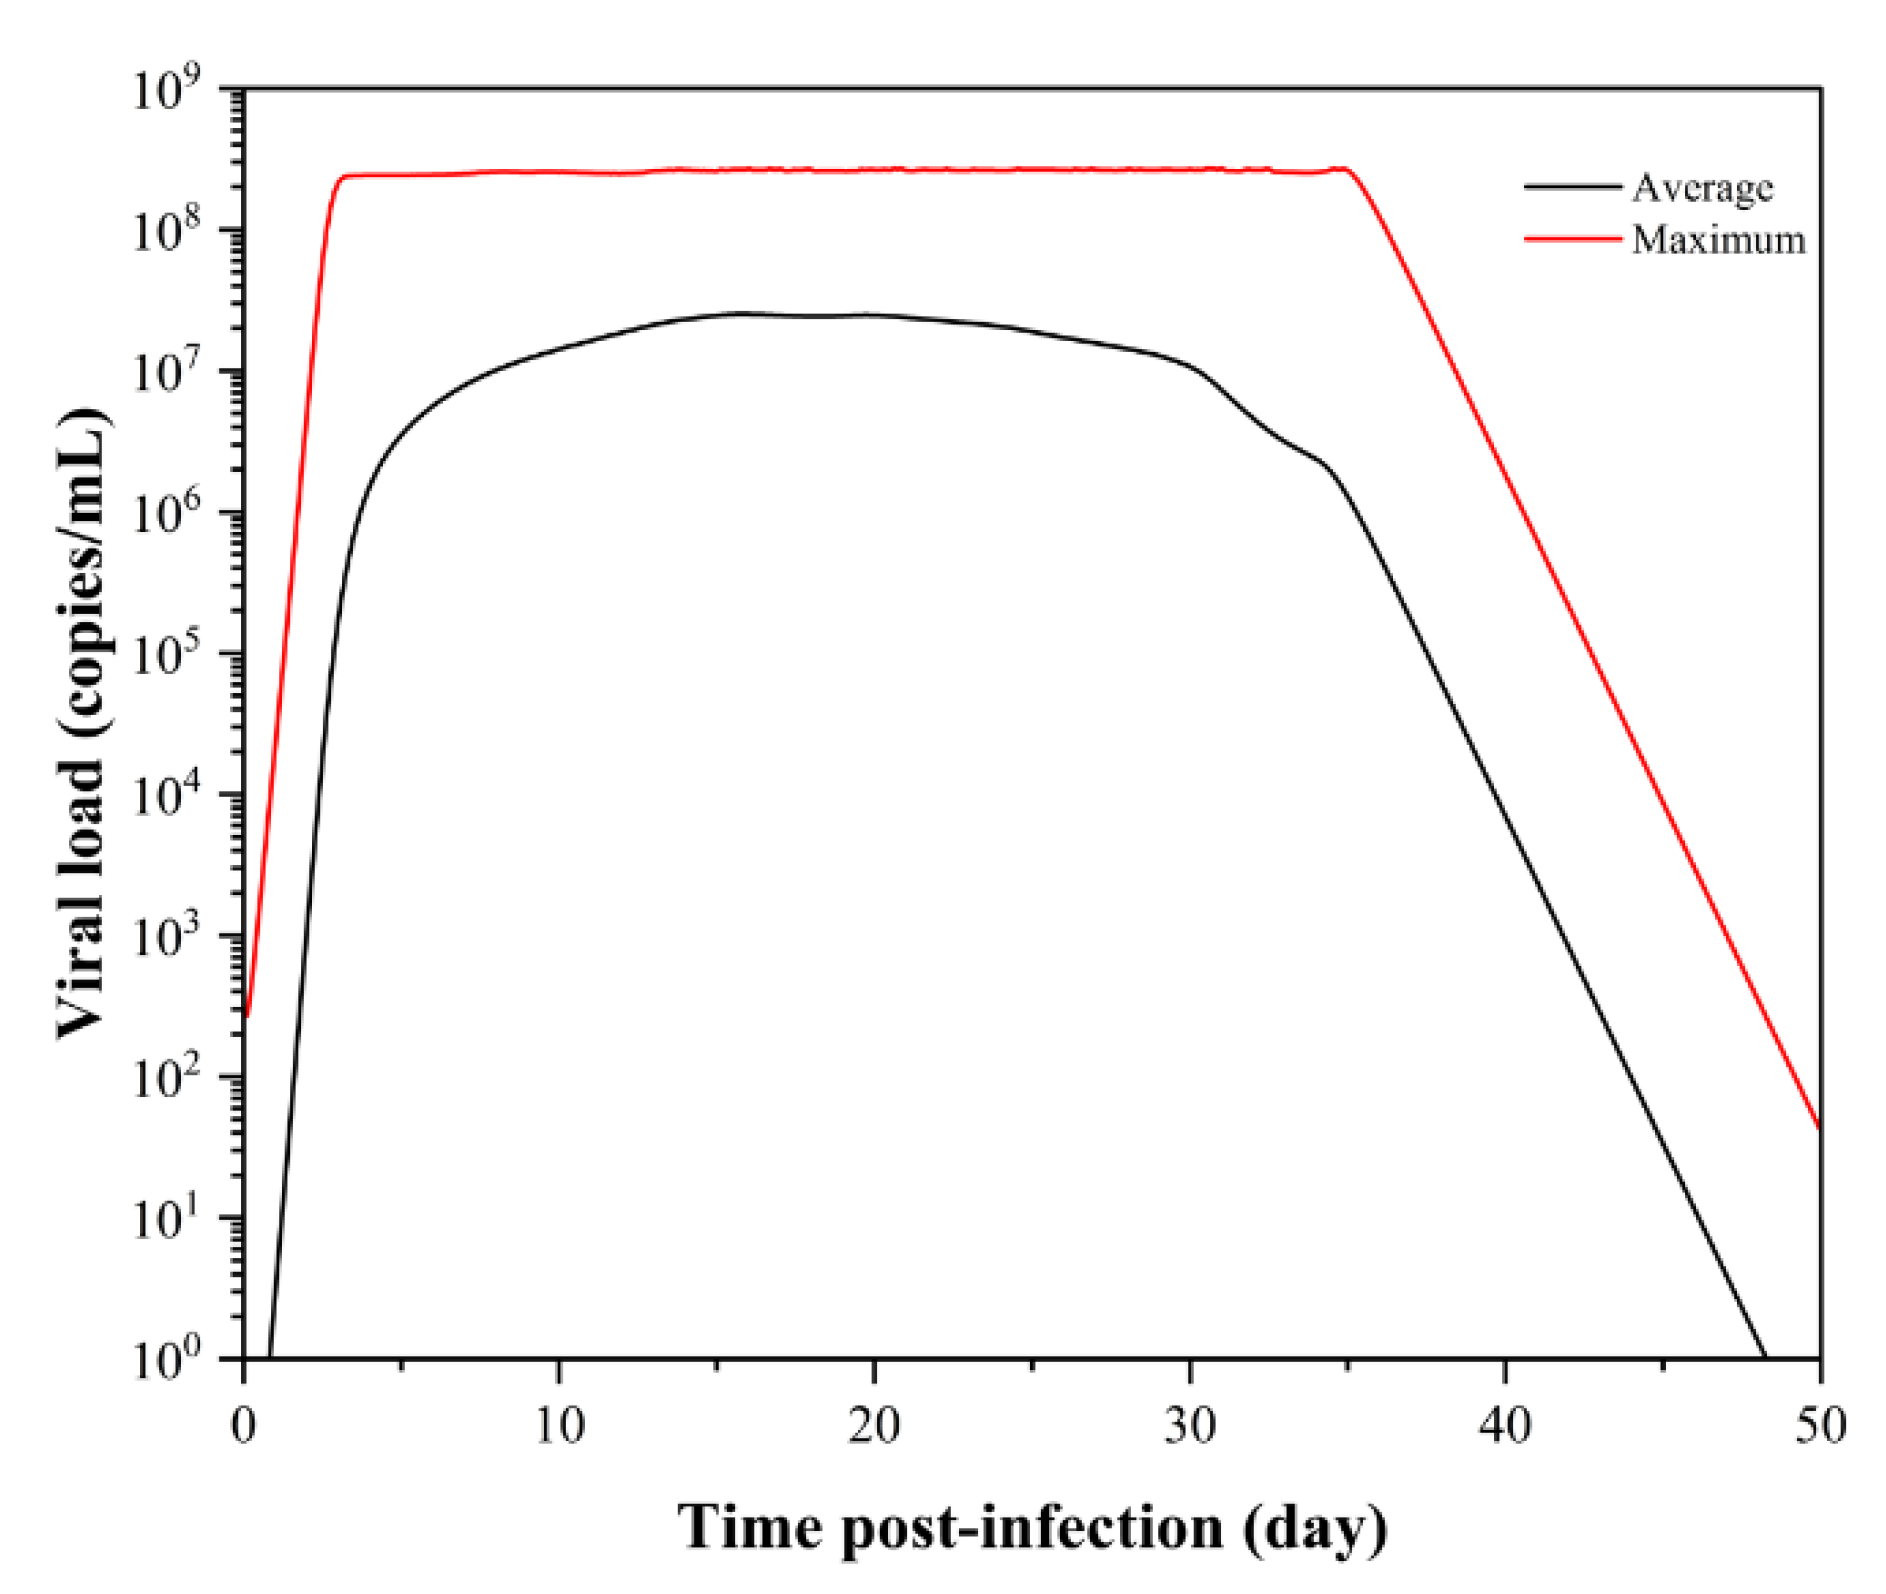
3.1. SARS-CoV-2 Dynamics Prediction of the Upper Respiratory Tract Based on the Target-Cell-Limited Model

According to the droplet deposition in Figure 3 and the initial conditions in Table 1 mentioned in Section 2.1, Figure 6 shows that the results obtained by using the target-cell-limited model to directly predict the viral load were similar to the changing trend of the clinical data of nine patients (a–i). The virus peaked at more than 108 copies/mL, which was also consistent with the range of the peak value of the viral load (106–109 copies/mL) in their clinical data in the early stages of COVID-19 symptoms. [18] Furthermore, the viral load peaked around 5 d after infection and decreased below the detection limit at approximately 18 d after infection.
In Figure 7, the virus load in the vestibule remained at zero because there was almost no droplet left there. Meanwhile, the peak value of the viral load and the time to reach the peak at other sites were almost identical to the overall viral load, with only minor differences. Because only the initial value of the virus had a small difference, the effect on the change in the viral load was small.

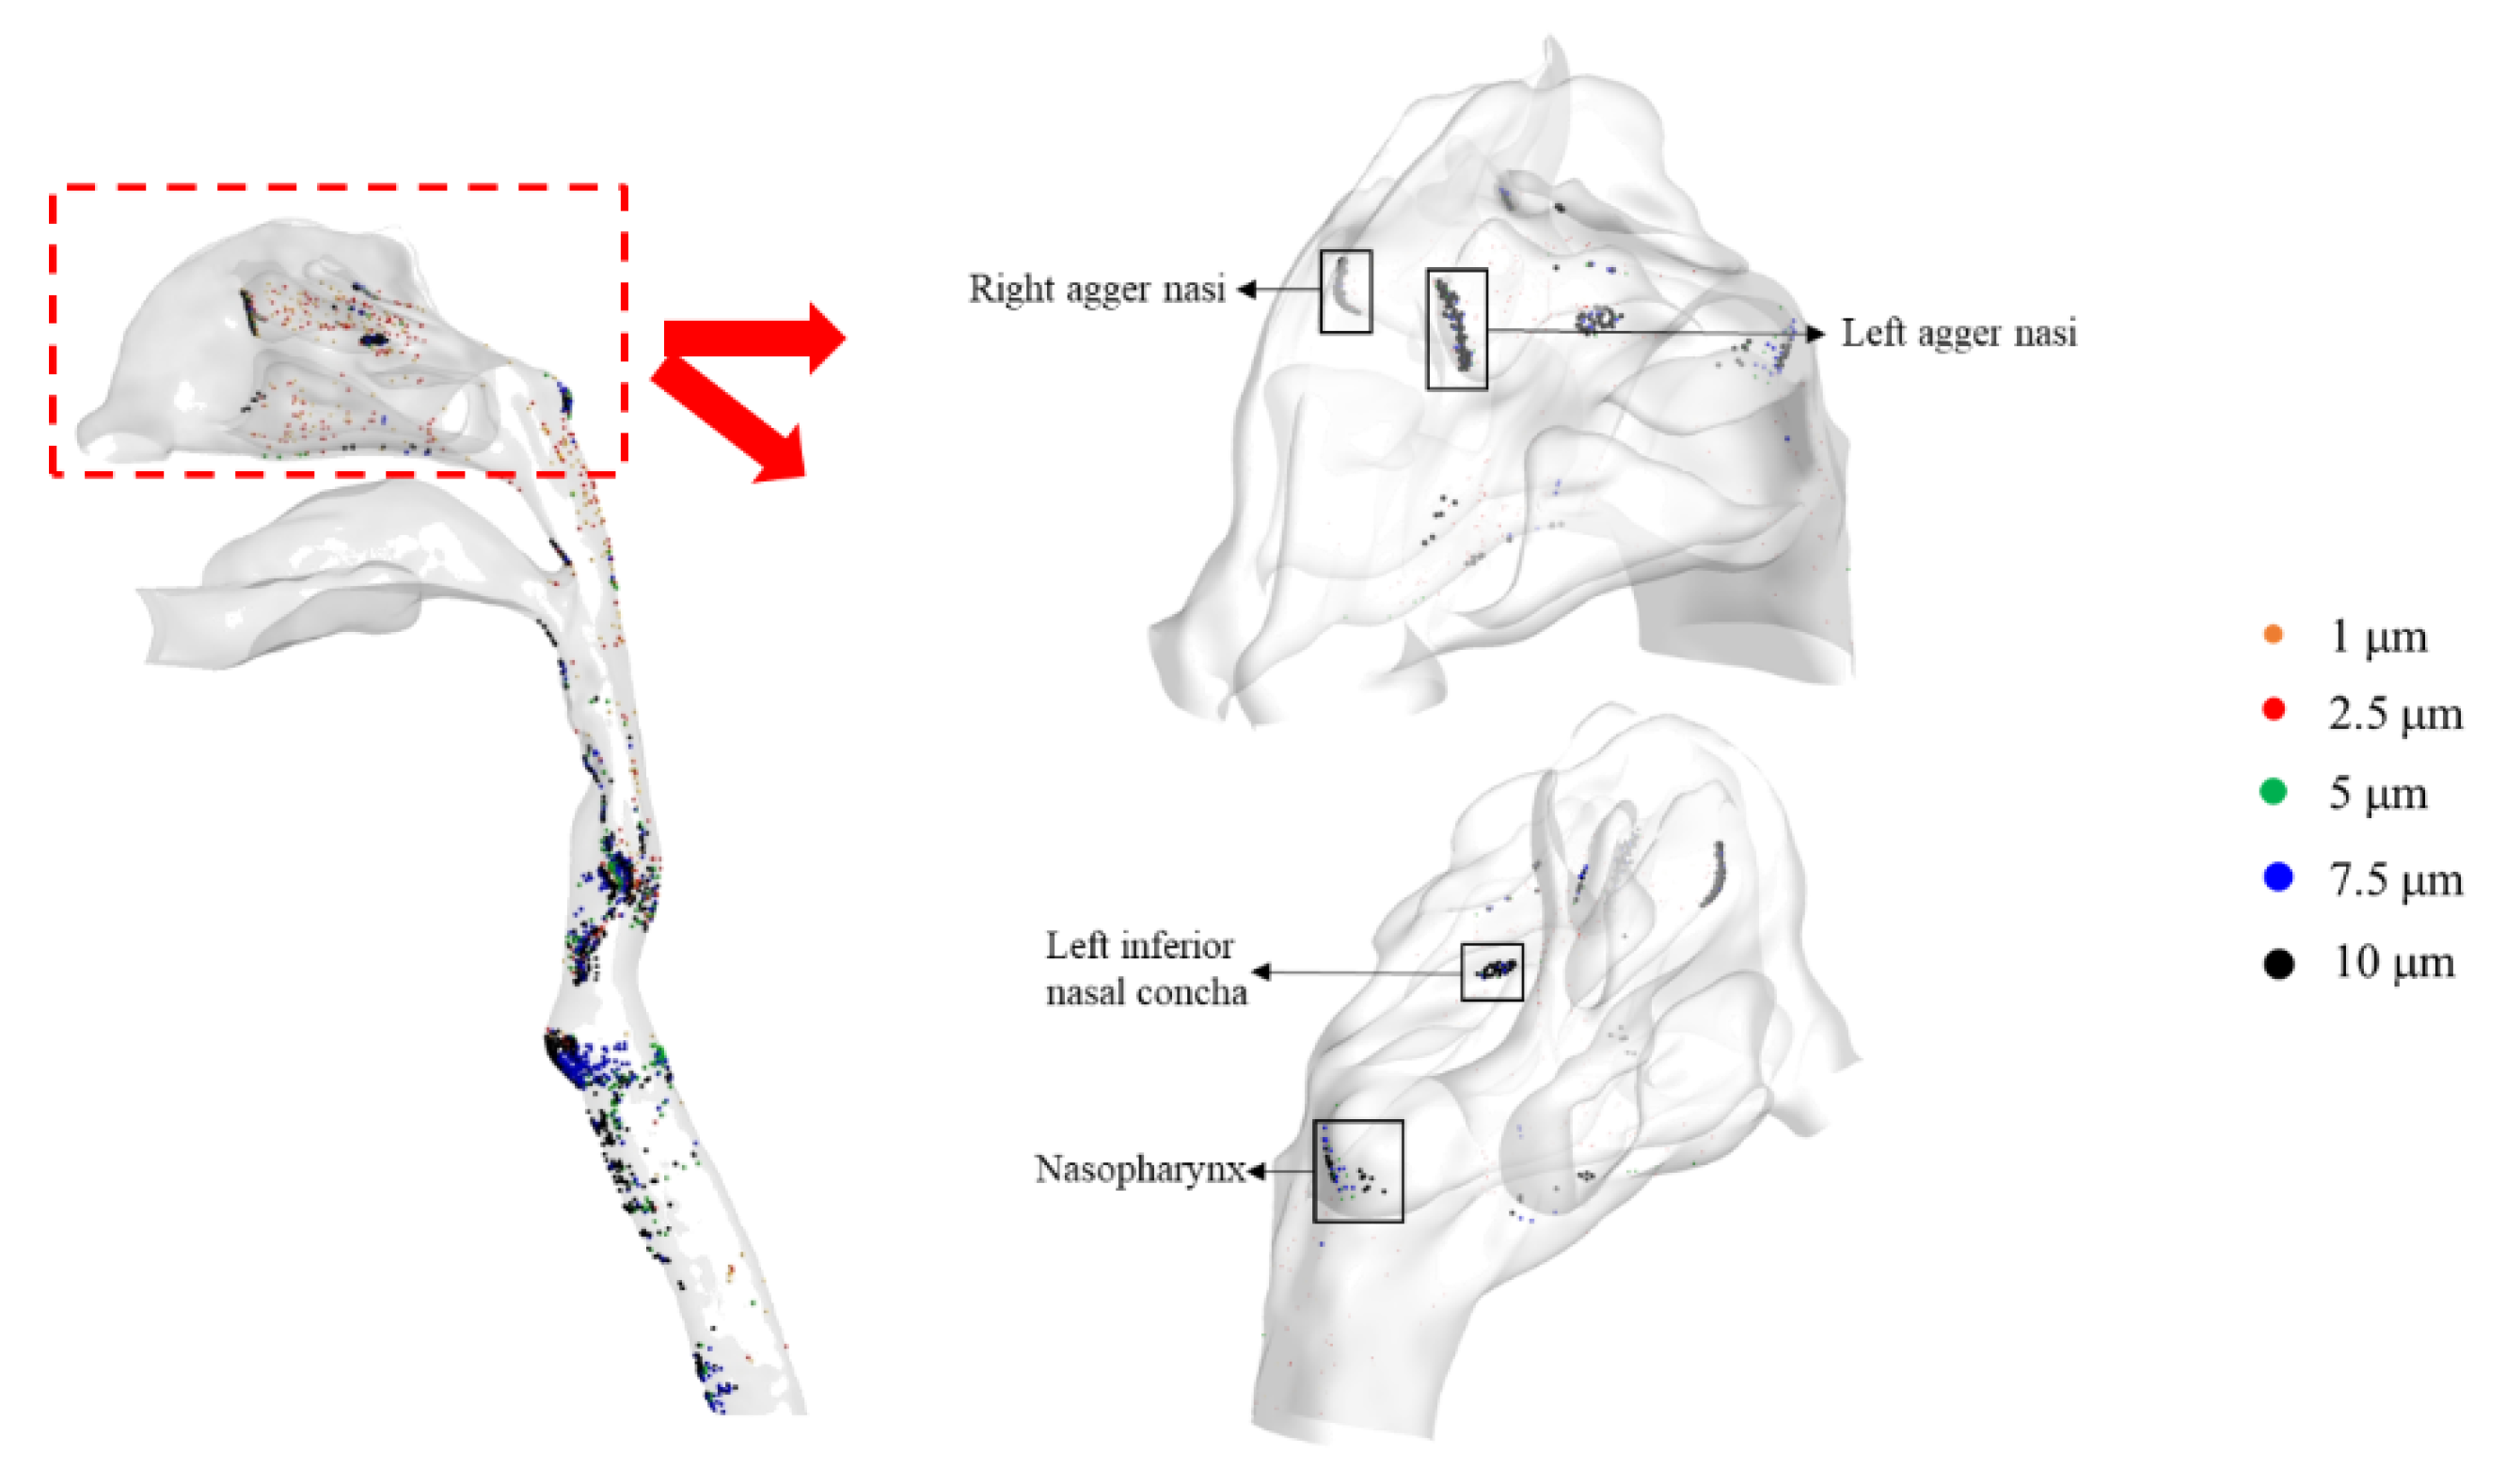
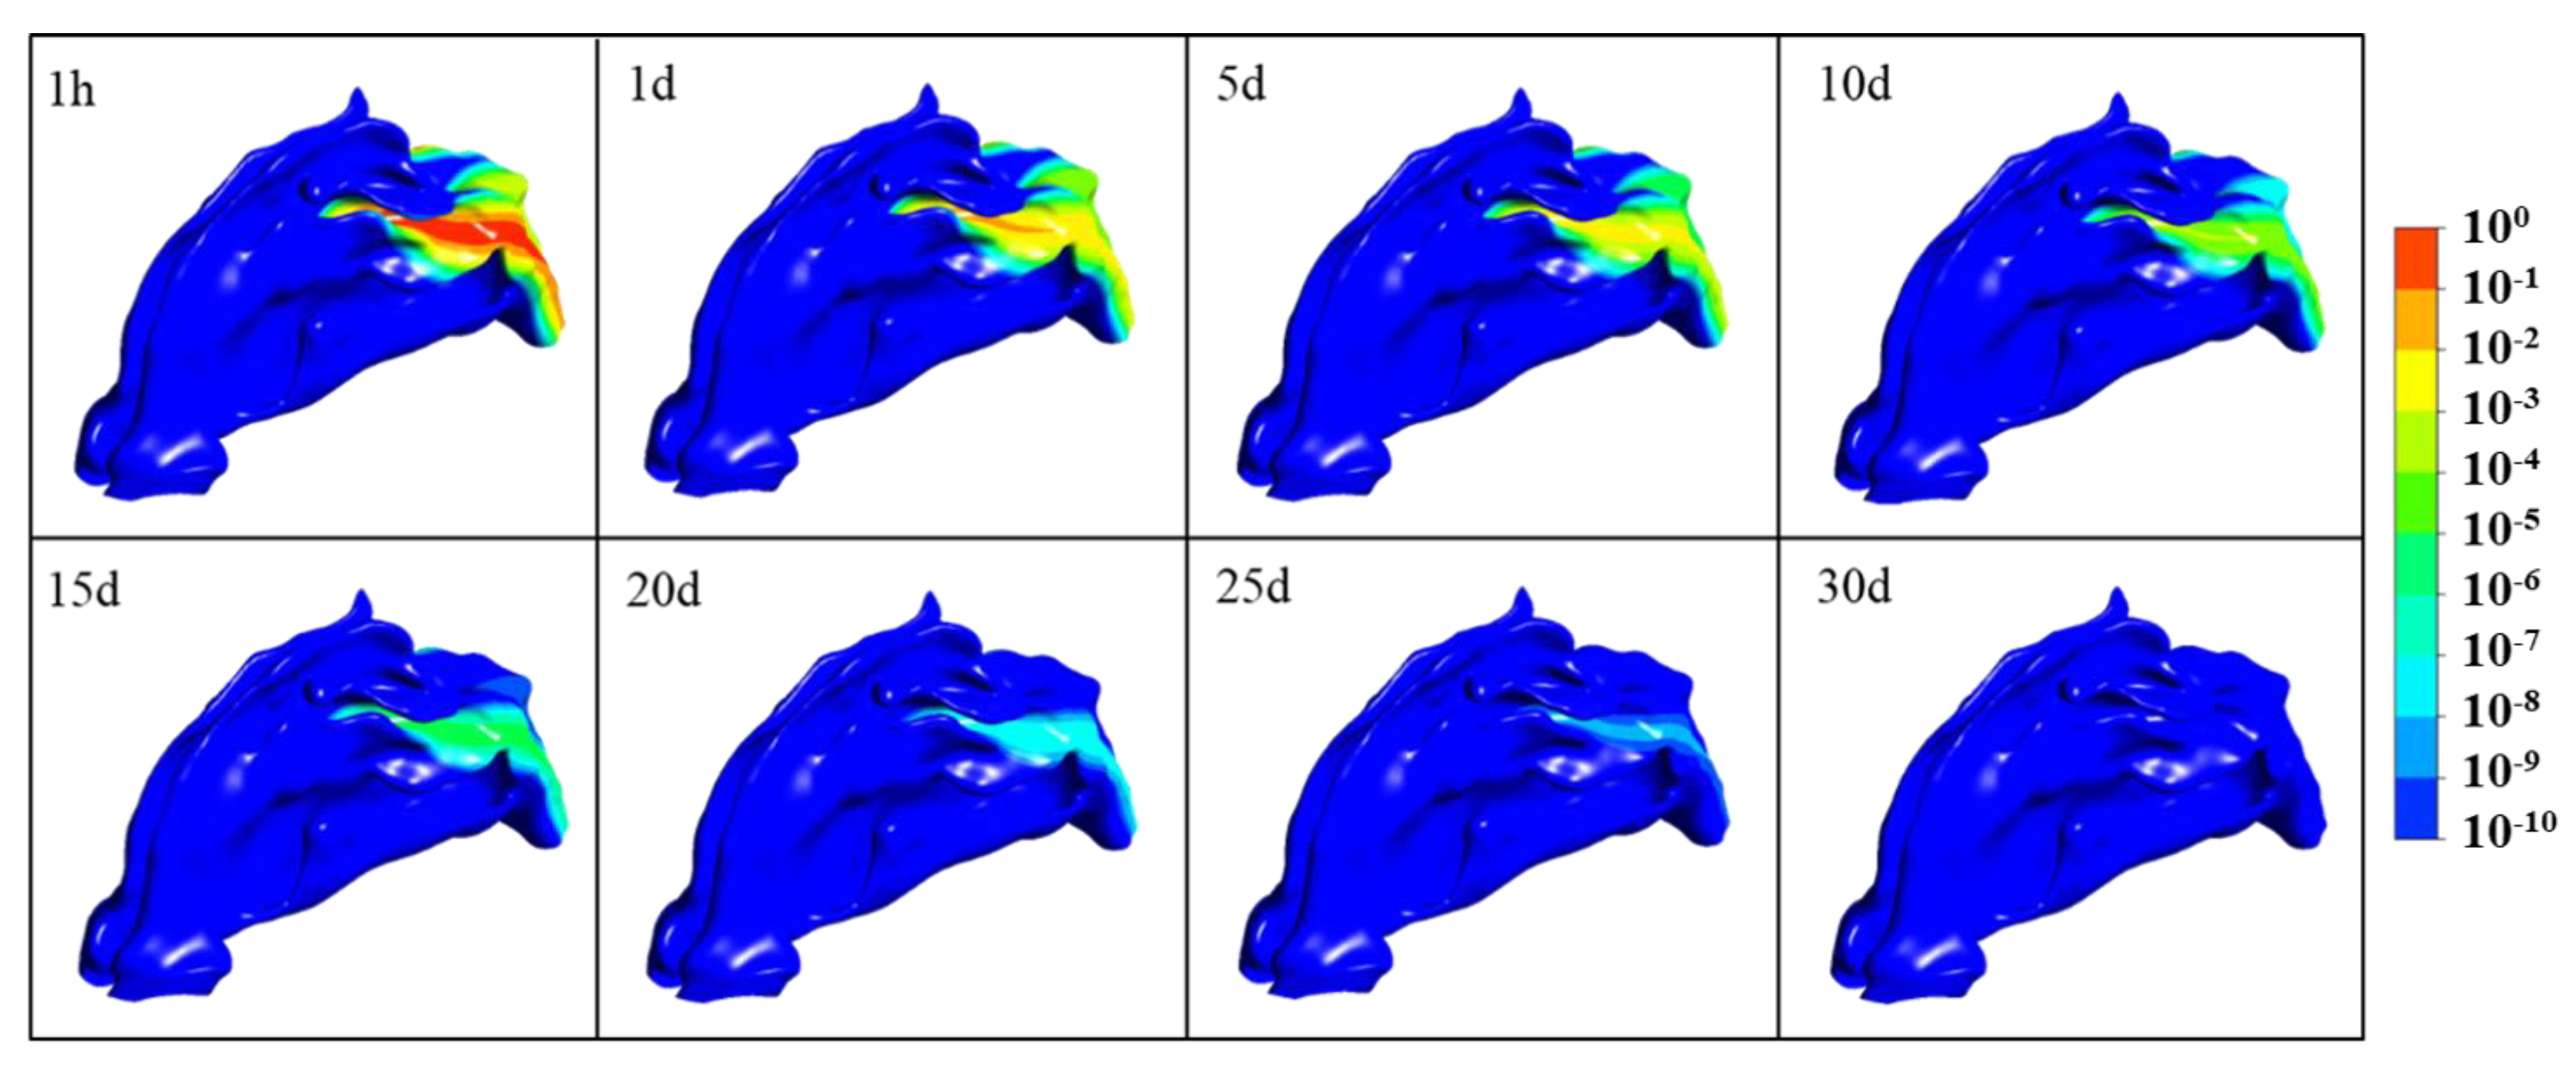
3.2. SARS-CoV-2 Dynamics Prediction of the Nasal Cavity–Nasopharynx with the Mucus Layer

Among the nasal cavity–nasopharynx parts, four sites were selected for subsequent HCD analysis because of the abundance of droplets and the high initial viral concentration, as shown in Figure 8. These four hot spots were the right agger nasi, left agger nasi, left inferior nasal concha, and nasopharynx, respectively. Detailed information, including the center coordinates and initial viral load, is summarized in Table 3.
For Case 1 with virus diffusion in the mucus environment, the change in the viral load and the number of target and infected cells within 50 d of infection (i.e., when the virus-laden droplets were deposited in the mucus layer) are shown in Figure 9 and Figure 10.
Because the actual virus detection limit was 100 copies/mL under existing technology [18], the viral load could begin to be detected 2 d after infection, with the first peak of viral load around 15 d after infection, and it remained for approximately 6 d. It then declined, and it did not fall below the virus limit until about 44 d, which is quite different from the data of clinical cases depicted in Section 3.1. Therefore, certain parameters in the HCD model should also be appropriately altered when considering virus diffusion in the mucus environment. In this study, the influence of the main parameter β on the prediction is considered in Section 3.3.
Meanwhile, the infected cells and the viral load maintained similar trends, while the majority of target cells were infected at a later stage. In addition, Figure 11 was illustrated for a more intuitive view of the SARS-CoV-2 dynamics with diffusion in the nasal cavity–nasopharynx model.
For Case 2 with virus diffusion and convection, Figure 12 is a vector diagram of the stabilized mucus velocity, indicating the mucus flow in the nasal cavity–nasopharynx part. The average flow rate of mucus in the whole model was approximately 3 mm/min, and the velocity around the central nasal passages was slower than that at other sites. However, this was not consistent with the summaries of Rygg et al. [27] and Shang et al. [28], who noted that the mucociliary clearance averaged 5–6 mm/min in a typical healthy adult. Moreover, in addition to the epithelium goblet cells, they found that part of the mucus produced in the maxillary sinus was located in the central nasal passages, which we had ignored. In addition, the goblet cells secreting mucus were unevenly distributed in the nasal cavity–nasopharynx part, especially in the vestibule, and there were few goblet cells. Thus, little mucus generally enters the vestibule and flows out of the nostril due to gravity, but its low flow rate (approximately 12 mm/h) could be neglected. In this study, we assumed that mucus was uniformly secreted by the whole nasal epithelium, and the flow rate of posterior nasal mucus measured in the experiment (8–10 mm/min) was used as the boundary condition for the CFPD simulation, which might be the reason for the differences.
As shown in Figure 13, the viral load dropped from the virus-laden droplet deposition was so rapid that it decreased to close to 0 within 2 h with the mucus flow because the mucus carrying the virus flowed much faster than the virus could spread. This result indicates that the mucus flow in the human respiratory tract has a great influence on the distribution of SARS-CoV-2.
As the convective velocity generated by mucus flow was so fast, the reasonable diffusion coefficient Dm calculated and the infection rate β selected were both small, leading to the virus flowing to the lower part of the upper respiratory tract with mucus before it had time to infect the target cells, as shown in Figure 14. Likewise, Figure 15 shows the entire process of SARS-CoV-2 dynamics with diffusion and convection for 30 d.
Only the diffusion and convection of SARS-CoV-2 in the mucus layer were considered here, so the choice of parameter values was crucial for this case.

3.3. Effects of the Infection Rate β on SARS-CoV-2 Dynamics Prediction

With the different values of β summarized in Table 2, seven cases were calculated and compared with the original case with β0 = 4.71 × 10⁻⁸ ((copies/mL) day−1). For the direct calculation of the HCD model with Equations (1)–(3), excessive values of β1–β3 led to high viral load and errors in calculation, which were unreasonable and not shown in Figure 16. The results showed that β had a great influence on the time when the virus reached its peak value but not on the peak value and duration.
Nevertheless, it seemed that β had a more significant impact on the viral load prediction for the cases that combined HCD with CFD coupled to the mucus environment, as shown in Figure 17. For Case 1, (a) indicated that β not only affected the peak time and duration of the virus peak but also affected the peak value to a certain extent. The larger the β value, the faster the SARS-CoV-2 infection of the target cells, the faster the viral load reached the peak, the higher the peak, and the shorter the duration. When other conditions remain unchanged, among these different magnitudes of β values, β4 was more consistent with the previous clinical data in sputum. To make it more persuasive, the viral load at the nasopharyngeal hotspot was selected as the representative site for comparison with the pharyngeal swab data, as shown in (b), to verify the feasibility of β4 in this case.
Case 2 had a general consequence with Case 1, as shown in (c), whereas the conflict between the infection rate represented by β and the mucus flow rate determined the peak viral load that could be reached in this case, where the diffusion rate was too small to affect the results. In this calculation, the large value of β1 led to the instability of the calculation and an invalid result. The low rates of Β0, β6, and β7 resulted in a rapid outflow of the virus along with the mucus, contrary to clinical data. Therefore, these lines are neglected. The findings revealed that no infection in Case 2 caused the peak viral load to reach the clinical peak. They typically peaked in one day or approximately one day after infection, and then decayed. Interestingly, almost all of these prediction lines showed a slight two-peak character, the two peaks were more than 10 d apart, and the peak values were in the range of 104–107 copies/mL, which were similar to the predictions mentioned in Fatehi’s study [20]. However, they coupled the terms of immune system responses with the HCD model but without mucus flow. Considering peak times and bimodal phenomena alone, β5 was the optimal value for this simulation. Nevertheless, as seen from (d), the variation in viral load that it represents was quite different from the data at the pharyngeal swab sampling site. Hence, when convection was considered, other complex virus–epithelial interactions were not considered, which require further in-depth consideration.

4. Discussion

As mentioned above, some improvements were made on the results of previous studies, such as the adding convective–diffusion term to the target-cell-limited model, and combining CFPD model to analyze the SARS-CoV-2 dynamics in the mucus milieu based on the 3D-shell model. However, owing to ethical problems, the simulation results obtained in this study are difficult to verify experimentally and accurately. Therefore, as much clinical data as possible need to be collected for comparison and verification.
In this study, the distribution of the droplet’s deposition was simulated by the steady CFPD calculation, so there are many possibilities in which the transient CFPD calculation of mixed-laden particles of different sizes should be performed. As for the mucus properties, uneven secretion and distribution of mucus will also cause differences in the mucus flow field, which should also be optimized. In addition, the basic target-cell-limited model was used to calculate SARS-CoV-2 dynamics. Hence, the HCD model should also consider other parameters such as δ, the immune response, and the patient vaccination status, in addition to integration with CFPD analysis and convection–diffusion terms. The clinical data of the specific classification, such as mild, ordinary, and severe patients, should be sorted to select parameters in the HCD model.
In Case 1, considering only diffusion, is essentially similar to the virus culture experiment in a laboratory Petri dish. It is possible that the results can be verified by summarizing the laboratory data, but the initial conditions and parameters still need to be considered according to the differences between individuals. In Case 2 of convection and diffusion, the nonlinear coupling of each parameter needs to be considered in addition to the influence of β.

5. Conclusions

This study attempted to combine CFPD with HCD by coupling to the convection-diffusion term to predict the SARS-CoV-2 dynamics in the mucus milieu under different conditions. The simple simulation of droplet deposition at different parts of the upper respiratory tract, the change in the viral load, the number of cells, and the effects of various infection rates β were calculated and discussed in detail.
In the case of droplet deposition distribution in the upper respiratory tract calculated by CFPD steady-state before, for SARS-CoV-2, the trend in variation of the viral load at different sites was consistent by directly using the target-cell-limited model. Under the numerical conditions in this study, the viral load peaked around day 5, between 1 × 10⁻⁸ and 1 × 10⁻⁹ (copies/mL), which was reasonable compared to the clinical data.
When considering the SARS-CoV-2 dynamics in the mucus environment, it can be seen from the results of Case 1 and Case 2 that when the convection–diffusion term was added to the HCD model, the peak time, the peak value, and its duration were changed accordingly, which was quite different from the clinical data. This difference was particularly pronounced in Case 2 with convection caused by mucus flow. At this time, the corresponding parameters needed to be adjusted.
Then, the influence of infection rate β on the prediction of Case 1 and the original HCD model was analyzed. β had a significant impact on the three types of calculations. However, under the conditions of Case 1, various β values not only affected the peak time but also affected the peak value and duration. In this case, the viral load calculated by the magnitude represented by β4, which was 1 × 10⁻⁵ ((copies/mL) day−1), was more consistent with the trend of clinical data. For Case 2, there was a slight bimodal phenomenon, which is worth investigating in conjunction with immune responses.
Taken together, although these simulation results have not been well verified experimentally, they will be an important application to help the understanding of infection dynamics of SARS-CoV-2 corresponding to more accurate initial conditions and physical parameters of SARS-CoV-2. Additionally, if an inhalable therapeutic drug for SARS-CoV-2 is developed, our application may greatly contribute to the development of a drug delivery system, which is a method for effectively transporting the drug to the infected site.

Author Contributions

Conceptualization, H.L., K.K., and K.I.; data curation, H.L.; formal analysis, H.L., K.K., and K.I.; funding acquisition, K.I.; investigation, H.L. and K.K.; methodology, H.L., K.K., and K.I.; project administration, K.K. and K.I.; resources, K.I.; software, H.L. and K.K.; supervision, K.K. and K.I.; validation, H.L.; visualization, H.L.; writing—original draft, H.L.; writing—review and editing, K.K. and K.I. All authors have read and agreed to the published version of the manuscript.

Funding

This research was partially funded by the Japan Science and Technology (JST), CREST Japan (grant number JP 20356547), and the Japan Society for the Promotion of Science (JSPS) Grants-in-Aid for Scientific Research (KAKENHI) (grant numbers JP 20KK0099 and JP 18H03807).

Data Availability Statement

The confirmed cases data of COVID-19 are from “WHO Coronavirus (COVID-19) Dashboard” at https://covid19.who.int/ (accessed on 8 March 2022). And the clinical data which were published in the Ref. [18] previously were used for this study.

Acknowledgments

The computation was carried out using the computer resources offered under the category of Intensively Promoted Projects by the Research Institute for Information Technology, Kyushu University.

Conflicts of Interest

The authors declare no conflict of interest.

References

  1. WHO Coronavirus (COVID-19) Dashboard. Available online: https://covid19.who.int/ (accessed on 8 March 2022).
  2. Lai, C.C.; Shih, T.P.; Ko, W.C.; Tang, H.J.; Hsueh, P.R. Severe acute respiratory syndrome coronavirus 2 (SARS-CoV-2) and coronavirus disease-2019 (COVID-19): The epidemic and the challenges. Int. J. Antimicrob. Agents 2020, 55, 105924. [Google Scholar] [CrossRef] [PubMed]
  3. Bar-on, Y.M.; Flamholz, A.; Phillips, R.; Milo, R. SARS-CoV-2 ( COVID-19 ) by the Numbers. eLife 2020, 2, e57309. [Google Scholar] [CrossRef] [PubMed]
  4. Lescure, F.-X.; Bouadma, L.; Nguyen, D.; Parisey, M.; Wicky, P.-H.; Behillil, S.; Gaymard, A.; Bouscambert-Duchamp, M.; Donati, F.; Le Hingrat, Q.; et al. Clinical and virological data of the first cases of COVID-19 in Europe: A case series. Lancet Infect. Dis. 2020, 20, 697–706. [Google Scholar] [CrossRef] [Green Version]
  5. Pan, Y.; Zhang, D.; Yang, P.; Poon, L.L.M.; Wang, Q. Viral load of SARS-CoV-2 in clinical samples. Lancet Infect. Dis. 2020, 20, 411–412. [Google Scholar] [CrossRef]
  6. Vetter, P.; Eberhardt, C.S.; Meyer, B.; Martinez Murillo, P.A.; Torriani, G.; Pigny, F.; Lemeille, S.; Cordey, S.; Laubscher, F.; Vu, D.-L.; et al. Daily Viral Kinetics and Innate and Adaptive Immune Response Assessment in COVID-19: A case series. mSphere 2020, 5, e00827-20. [Google Scholar] [CrossRef] [PubMed]
  7. Xu, Y.; Li, X.; Zhu, B.; Liang, H.; Fang, C.; Gong, Y.; Guo, Q.; Sun, X.; Zhao, D.; Shen, J.; et al. Characteristics of pediatric SARS-CoV-2 infection and potential evidence for persistent fecal viral shedding. Nat. Med. 2020, 26, 502–505. [Google Scholar] [CrossRef] [PubMed] [Green Version]
  8. Young, B.E.; Ong, S.W.X.; Kalimuddin, S.; Low, J.G.; Tan, S.Y.; Loh, J.; Ng, O.T.; Marimuthu, K.; Ang, L.W.; Mak, T.M.; et al. Epidemiologic features and clinical course of patients infected with SARS-CoV-2 in Singapore. JAMA—J. Am. Med. Assoc. 2020, 323, 1488–1494. [Google Scholar] [CrossRef] [PubMed] [Green Version]
  9. To, K.K.W.; Tsang, O.T.Y.; Yip, C.C.Y.; Chan, K.H.; Wu, T.C.; Chan, J.M.C.; Leung, W.S.; Chik, T.S.H.; Choi, C.Y.C.; Kandamby, D.H.; et al. Consistent detection of 2019 novel coronavirus in Saliva. Clin. Infect. Dis. 2020, 71, 841–843. [Google Scholar] [CrossRef] [Green Version]
  10. Yoon, J.G.; Yoon, J.; Song, J.Y.; Yoon, S.Y.; Lim, C.S.; Seong, H.; Noh, J.Y.; Cheong, H.J.; Kim, W.J. Clinical significance of a high SARS-CoV-2 viral load in the Saliva. J. Korean Med. Sci. 2020, 35, e195. [Google Scholar] [CrossRef]
  11. Zhu, J.; Guo, J.; Xu, Y.; Chen, X. Viral dynamics of SARS-CoV-2 in Saliva from infected patients. J. Infect. 2020, 81, e48–e50. [Google Scholar] [CrossRef]
  12. Zou, L.; Ruan, F.; Huang, M.; Liang, L.; Huang, H.; Hong, Z.; Yu, J.; Kang, M.; Song, Y.; Xia, J.; et al. SARS-CoV-2 viral load in upper respiratory specimens of infected patients. N. Engl. J. Med. 2020, 382, 1177–1179. [Google Scholar] [CrossRef] [PubMed]
  13. He, X.; Lau, E.H.Y.; Wu, P.; Deng, X.; Wang, J.; Hao, X.; Lau, Y.C.; Wong, J.Y.; Guan, Y.; Tan, X.; et al. Temporal dynamics in viral shedding and transmissibility of COVID-19. Nat. Med. 2020, 26, 672–675. [Google Scholar] [CrossRef] [PubMed] [Green Version]
  14. To, K.K.W.; Tsang, O.T.Y.; Leung, W.S.; Tam, A.R.; Wu, T.C.; Lung, D.C.; Yip, C.C.Y.; Cai, J.P.; Chan, J.M.C.; Chik, T.S.H.; et al. Temporal profiles of viral load in posterior oropharyngeal saliva samples and serum antibody responses during infection by SARS-CoV-2: An observational cohort study. Lancet Infect. Dis. 2020, 20, 565–574. [Google Scholar] [CrossRef] [Green Version]
  15. Kissler, S.M.; Fauver, J.R.; Mack, C.; Olesen, S.W.; Tai, C.; Shiue, K.Y.; Kalinich, C.C.; Jednak, S.; Ott, I.M.; Vogels, C.B.F.; et al. Viral dynamics of acute SARS-CoV-2 infection and applications to diagnostic and public health strategies. PLoS Biol. 2021, 19, e3001333. [Google Scholar] [CrossRef]
  16. Kim, J.Y.; Ko, J.H.; Kim, Y.; Kim, Y.J.; Kim, J.M.; Chung, Y.S.; Kim, H.M.; Han, M.G.; Kim, S.Y.; Chin, B.S. Viral load kinetics of SARS-CoV-2 infection in first two patients in Korea. J. Korean Med. Sci. 2020, 35, e86. [Google Scholar] [CrossRef]
  17. Hernandez-Vargas, E.A.; Velasco-Hernandez, J.X. In-host mathematical modelling of COVID-19 in humans. Annu. Rev. Control. 2020, 50, 448–456. [Google Scholar] [CrossRef]
  18. Wölfel, R.; Corman, V.M.; Guggemos, W.; Seilmaier, M.; Zange, S.; Müller, M.A.; Niemeyer, D.; Jones, T.C.; Vollmar, P.; Rothe, C.; et al. Virological Assessment of Hospitalized Patients with COVID-2019. Nature 2020, 581, 465–469. [Google Scholar] [CrossRef] [Green Version]
  19. Sungnak, W.; Huang, N.; Bécavin, C.; Berg, M.; Queen, R.; Litvinukova, M.; Talavera-López, C.; Maatz, H.; Reichart, D.; Sampaziotis, F.; et al. SARS-CoV-2 entry factors are highly expressed in nasal epithelial cells together with innate immune genes. Nat. Med. 2020, 26, 681–687. [Google Scholar] [CrossRef] [Green Version]
  20. Fatehi, F.; Bingham, R.J.; Dykeman, E.C.; Stockley, P.G.; Twarock, R. Comparing antiviral strategies against COVID-19 via multiscale within-host modelling. R. Soc. Open Sci. 2021, 8, 210082. [Google Scholar] [CrossRef]
  21. Dogra, P.; Ruiz-Ramírez, J.; Sinha, K.; Butner, J.D.; Peláez, M.J.; Rawat, M.; Yellepeddi, V.K.; Pasqualini, R.; Arap, W.; Sostman, H.D.; et al. Innate immunity plays a key role in controlling viral load in COVID-19: Mechanistic insights from a whole-body infection dynamics model. ACS Pharmacol. Transl. Sci. 2021, 4, 248–265. [Google Scholar] [CrossRef]
  22. Sadria, M.; Layton, A.T. Modeling within-host Sars-Cov-2 infection dynamics and potential treatments. Viruses 2021, 13, 1141. [Google Scholar] [CrossRef] [PubMed]
  23. Gonçalves, A.; Bertrand, J.; Ke, R.; Comets, E.; de Lamballerie, X.; Malvy, D.; Pizzorno, A.; Terrier, O.; Rosa Calatrava, M.; Mentré, F.; et al. Timing of antiviral treatment initiation is critical to reduce SARS-CoV-2 viral load. CPT Pharmacomet. Syst. Pharmacol. 2020, 9, 509–514. [Google Scholar] [CrossRef] [PubMed]
  24. Czuppon, P.; Débarre, F.; Gonçalves, A.; Tenaillon, O.; Perelson, A.S.; Guedj, J.; Blanquart, F. Success of prophylactic antiviral therapy for SARS-CoV-2: Predicted critical efficacies and impact of different drug-specific mechanisms of action. PLoS Comput. Biol. 2021, 17, e1008752. [Google Scholar] [CrossRef] [PubMed]
  25. Prentiss, M.; Chu, A.; Berggren, K.K. Superspreading events without superspreaders: Using high attack rate events to estimate N0 for airborne transmission of COVID-19. medRxiv 2020. [Google Scholar] [CrossRef]
  26. Haghnegahdar, A.; Zhao, J.; Feng, Y. Lung aerosol dynamics of airborne influenza a virus-laden droplets and the resultant immune system responses: An in silico study. J. Aerosol Sci. 2019, 134, 34–55. [Google Scholar] [CrossRef]
  27. Rygg, A.; Longest, P.W. Absorption and Clearance of Pharmaceutical Aerosols in the Human Nose: Development of a CFD Model. J. Aerosol Med. Pulm. Drug Deliv. 2016, 29, 416–431. [Google Scholar] [CrossRef]
  28. Shang, Y.; Inthavong, K.; Tu, J. Development of a computational fluid dynamics model for mucociliary clearance in the Nasal Cavity. J. Biomech. 2019, 85, 74–83. [Google Scholar] [CrossRef]
  29. Duguid, J.P. The size and the duration of air-carriage of respiratory droplets and droplet-nuclei. J. Hyg. (Lond.) 1946, 44, 471–479. [Google Scholar] [CrossRef] [Green Version]
  30. Yang, S.; Lee, G.W.M.; Chen, C.M.; Wu, C.C.; Yu, K.P. The size and concentration of droplets generated by coughing in human subjects. J. Aerosol Med. 2007, 20, 484–494. [Google Scholar] [CrossRef]
  31. Phuong, N.L.; Khoa, N.D.; Ito, K. Comparative numerical simulation of inhaled particle dispersion in upper human airway to analyse intersubject differences. Indoor Built Environ. 2020, 29, 793–809. [Google Scholar] [CrossRef]
  32. Fedoseev, G.B.; Geharev, S. Basic defense mechanisms of bronchio-lung system. Gen. Pulmonol. 1989, 1, 112–144. [Google Scholar]
  33. Fahy, J.V.; Dickey, B.F. Airway mucus function and dysfunction. N. Engl. J. Med. 2010, 363, 2233–2247. [Google Scholar] [CrossRef] [PubMed] [Green Version]
  34. Blake, J. Mucus flows. Math. Biosci. 1973, 17, 301–313. [Google Scholar] [CrossRef]
  35. Shang, Y.; Inthavong, K.; Qiu, D.; Singh, N.; He, F.; Tu, J. Prediction of nasal spray drug absorption influenced by mucociliary clearance. PLoS ONE 2021, 16, e0246007. [Google Scholar] [CrossRef]
  36. Gelman, R.A.; Meyer, F.A. Mucociliary transference rate and mucus viscoelasticity dependence on dynamic storage and loss modulus. Am. Rev. Respir. Dis. 1979, 120, 553–557. [Google Scholar]
  37. Du, S.Q.; Yuan, W. Mathematical modeling of interaction between innate and adaptive immune responses in COVID-19 and implications for viral pathogenesis. J. Med. Virol. 2020, 92, 1615–1628. [Google Scholar] [CrossRef]
  38. Pawelek, K.A.; Huynh, G.T.; Quinlivan, M.; Cullinane, A.; Rong, L.; Perelson, A.S. Modeling within-host dynamics of influenza virus infection including immune responses. PLoS Comput. Biol. 2012, 8, e1002588. [Google Scholar] [CrossRef] [Green Version]
Figure 1. A 3D model of the human respiratory tract.
Sustainability 14 03896 g001
Figure 2. Size distribution of droplets when coughing.
Sustainability 14 03896 g002
Figure 3. Deposition distribution of droplets with different sizes.
Sustainability 14 03896 g003
Figure 4. Schematic diagram of viral activity in the mucus layer.
Sustainability 14 03896 g004
Figure 5. Nasal cavity–nasopharynx 3D shell model.
Sustainability 14 03896 g005
Figure 6. Validation of the HCD model feasibility.
Sustainability 14 03896 g006
Figure 7. Variation in viral loads at different sites over time.
Sustainability 14 03896 g007
Figure 8. The four hot spots of virus concentration.
Sustainability 14 03896 g008
Figure 9. Viral load over time in Case 1.
Sustainability 14 03896 g009
Figure 10. Amount of target and infected cells over time in Case 1.
Sustainability 14 03896 g010
Figure 11. Visualization of SARS-CoV-2 diffusion in the nasal cavity–nasopharynx model.
Sustainability 14 03896 g011
Figure 12. Vectors of mucus flow with contour of velocity in Case 2.
Sustainability 14 03896 g012
Figure 13. Viral load over time in Case 2.
Sustainability 14 03896 g013
Figure 14. Amount of target and infected cells over time in Case 2.
Sustainability 14 03896 g014
Figure 15. Visualization of SARS-CoV-2 diffusion and convection in the nasal cavity–nasopharynx model.
Sustainability 14 03896 g015
Figure 16. Effect of β on the viral load in the direct calculation of the HCD model.
Sustainability 14 03896 g016
Figure 17. Effect of β on the viral load in the calculation of the combination of HCD and CFD coupled to the mucus milieu. (a) Viral load of Case 1 with only virus diffusion (no mucus flow); (b) Comparison between the viral load of nasopharyngeal hot spot in Case 1 and pharyngeal swab data; (c) Viral load of Case 2 with both convection and diffusion (with mucus flow); (d) Comparison between the viral load of the nasopharyngeal hot spot in Case 2 and pharyngeal swab data.
Sustainability 14 03896 g017aSustainability 14 03896 g017b
Table 1. Basic initial conditions for the HCD model.
RegionsVestibuleCentral Nasal PassagesNasopharynx-LarynxTracheaTotal
Surface area (m2)3.71 × 10−31.55 × 10−29.88 × 10−34.72 × 10−33.38 × 10⁻²
Vmucus (mL)0.060.230.150.070.51
T(0) [cells]9.27 × 1073.88 × 1082.47 × 1081.18 × 1088.46 × 108
Particles1 μm085114
2.5 μm01610228
5 μm014141846
7.5 μm0424972163
10 μm0887184243
Percentage0.00%1.68%1.49%1.77%4.94%
V(0) (copies/mL)05.64 × 10−34.90 × 10−36.11 × 10−31.66 × 10−2
Table 2. The values of β varied among the cases.
No.1234567
β ((copies/mL) day−1)1 × 10−21 × 10−31 × 10−41 × 10−51 × 10−61 × 10−71 × 10−8
Table 3. Details of the representative deposit sites.
Virus No.0123
SitesRight Agger NasiLeft Agger NasiLeft Inferior Nasal ConchaNasopharynx
Initial Virus Counting (copies)2.71 × 10−41.17 × 10−42.21 × 10−52.95 × 10−5
Publisher’s Note: MDPI stays neutral with regard to jurisdictional claims in published maps and institutional affiliations.

