Article

Early Sowing of Quinoa Cultivars, Benefits from Rainy Season and Enhances Quinoa Development, Growth, and Yield under Arid Condition in Morocco

1
Agricultural Innovation and Technology Transfer Center, Mohammed VI Polytechnic University, Ben Guerir 43150, Morocco
2
Department of Agronomy, National School of Agriculture, Meknes 50001, Morocco
3
Plant Stress Physiology Laboratory, Agrobiosciences, Mohammed VI Polytechnic University, Ben Guerir 43150, Morocco
4
Department of Crop Production, Protection and Biotechnology, Hassan II Institute of Agronomy and Veterinary Medicine, Rabat 10101, Morocco
*
Author to whom correspondence should be addressed.
Sustainability 2022, 14(7), 4010; https://doi.org/10.3390/su14074010
Submission received: 31 January 2022 / Revised: 28 February 2022 / Accepted: 8 March 2022 / Published: 29 March 2022
(This article belongs to the Special Issue Drought and Salinity Tolerance in Crops for Sustainable Agriculture)

Abstract

:
Quinoa is a highly nutritious and gluten-free crop. It is a good alternative crop to cereals in the context of climate change. In the process of introducing quinoa to an arid region of Morocco (Rehamna), late sowing results in stunted plants and low yields due to insufficient precipitations and high temperatures around the flowering stage. Early sowing of short-cycle cultivars constitutes a good strategy to enhance growth and yields. A field experiment was conducted in the Rehamna region in 2020–2021 to investigate the effect of the sowing date on quinoa growth, development, and yield. Two cultivars, ICBA-Q5 and Titicaca, and five sowing dates from 15 November to 15 March were evaluated. Results showed that December sowing enhanced plant height, total leaf area, the number and dry weight of branches, leaves, and panicles, and enhanced quinoa productivity, due to high precipitations, optimal temperatures, and a short photoperiod. The highest grain yield (0.84 t ha−1) was obtained with ICBA-Q5. Late sowing decreased the yield and growth and reduced the number of days to panicle emergence, flowering, and maturity for both cultivars. Early sowing of ICBA-Q5 is recommended to increase quinoa yield in arid regions of Morocco.

1. Introduction

In the process of adapting quinoa as a drought-alternative crop in dryland areas of Morocco, the sowing date is one of the most important agronomic practices, because the optimal date differs according to locations and cannot be managed using standard practices similar to the place of origin [1]. The sowing date depends on rainfall season and events, soil humidity, and the cultivar [2]. The vulnerability to temperature and drought during flowering should be given great attention when sowing [3]. Previous work showed that quinoa cultivars are short-day plants [4] and adapt to diverse environmental conditions such as drought and salinity [5,6]. The optimal temperature for growth for quinoa ranges from 15 to 20 °C [7]. Temperatures above 35 °C resulted in flowering inhibition and pollen sterility [8]. Quinoa grows in the Andean region with rainfall between 200 mm (Salares de Bolivia) to 1000 mm (Concepción-Chile). However, when irrigation is possible, it has been observed that the crop requires between 500 and 1000 mm with surface irrigation and between 350 and 750 mm with drip irrigation [9].
Rehamna is one of the arid regions of Morocco where annual precipitation rarely exceeds 170 mm. In this region, quinoa tolerates the drought better in comparison to cereals (wheat and barley) and has high nutritional and economic value, which makes it a strategic crop to increase farmers’ income and improve food security [10]. Analysis of climatic data obtained from the Provincial Directorate of Agriculture of the Rehamna region over forty years showed that precipitation begins in November. However, farmers sow quinoa in February and early March, to avoid the low temperatures that prevail in November. This late planting of quinoa exhibits accelerated development and low yields that rarely go beyond 0.5 t ha−1, essentially due to low precipitation and high temperatures at the flowering stage. Therefore, early planting of quinoa using supplemental irrigation will alleviate water and heat stress. In addition, the use of supplemental irrigation was reported to be a good strategy to secure and stabilize yield when rainfall is insufficient [11]. Quinoa gave the highest yield when fully irrigated (327 mm) [12]. However, when maintained at low day/night temperatures of 18/8 °C, plant height and shoot dry weight were reduced [13], and when compared to rainfed conditions, the yield of quinoa could be enhanced two-fold using 60% full irrigation (204 mm) [12]. The milky grain is the most sensitive stage to drought stress followed by flowering. Thus, applying 50% of total irrigation at these development stages can stabilize yields up to 2 t ha−1 [14]. Furthermore, early sowing using short-cycle cultivars is another strategy to cope with water scarcity and escape the heat at flowering and seed filling. During recent evaluations, Titicaca and ICBA-Q5, two short-cycle cultivars, showed good adaptation to Moroccan conditions. Titicaca and ICBA-Q5 can be produced in the Rehamna region up to 1.9 and 3.9 t ha−1, respectively, with 200 mm [15].
The period of sowing of quinoa in the Peruvian Altiplano is between November and December. During this period, precipitation begins and the frequency of frost is reduced [3]. This indicates that winter sowings in Morocco should be considered. The only results published in Morocco, so far, are those carried out [16] in Agadir, where quinoa sown in November and early December gave the highest grain yields with an average of 2.8 t ha−1. A considerable reduction of grain yields up to 91% was noticed when the sowing date was delayed by one month (from December to January). Most previous research on quinoa had focused on evaluating the sowing date with full irrigation or under rainfed conditions. In the extreme drought conditions of various arid regions of Morocco, rainfed quinoa failed to accomplish its growing cycle. Therefore, using supplemental irrigation will help address this problem and needs to be more explored. In addition, early sowing of quinoa short-cycle cultivars will help displace the growing cycle in the rainy season and could represent a good strategy to escape high temperatures and drought during flowering and seed filling and increase yields in arid regions of Morocco. Thus, the objective of the present study was to identify the most appropriate sowing date for two commonly used quinoa short-cycle cultivars (ICBA-Q5 and Titicaca) using supplemental irrigation in the Rehamna region, Morocco.

2. Materials and Methods

2.1. Experimental Set-Up

A field experiment was carried out at the experimental farm of Mohammed VI Polytechnic University (UM6P) (Ben Guerir; 32°13.08″ N, 7°53.23′ W). It was conducted during the cropping season of 2020–2021 on sandy clay loam soil with 1.86% organic matter and a pH of 8.28. The soil has a high content of potassium, copper, and manganese, a medium content of phosphorus, and low content of iron and zinc. The chemical characteristics of the soil are presented in Table 1.
Two cultivars, ICBA-Q5 and Titicaca, were sown at five dates with one-month intervals, starting on November 15th. The choice of ICBA-Q5 and Titicaca cultivars for this experiment was based on their short growing cycle, performance, and adaptation under the arid conditions of the Rehamna region. The treatments, sowing date, and cultivar were arranged in a randomized complete block design with four replications. The unit plot of each treatment was 33.6 m2 and consisted of ten rows of 7.5 m and 50 cm apart. Due to differences in the germination rate, the seeding rate was adjusted to 10 kg ha−1 for ICBA-Q5 and 15 kg ha−1 for Titicaca in order to come up with the same stand. Supplemental irrigation was applied during crop establishment, flowering, and seed filling, and all the treatments received around 140 mm (Table 2). During these stages, supplemental irrigation [SI = (Kc*ET0)/e] was estimated based on ET0 obtained from the weather station, the Kc factor for quinoa being 0.5 at plant establishment and 1 during flowering and seed filling [17], and the irrigation system efficiency ‘e’ being equal to 60% [18]. Quantities of water were calculated and applied to rows manually. Air temperature, precipitation, and radiation were also obtained from the weather station within the experimental farm, situated 250 m away from the experiment.
Before sowing, 40 kg N ha−1 (ammonium sulfate) and 26 kg P2O5 ha−1 (diammonium phosphate) were applied in planting rows. A top dressing of 40 kg N ha−1 (ammonium nitrate 33.5%) was applied at the ramification stage. Potassium was not supplied, as its content in the soil was adequate. Seeds were hand sown and covered to a depth not exceeding 2 cm as recommended by previous research [6]. No chemicals were used for weeds or disease control. Plant density was adjusted at the ramification stage to 20–25 plants m−2 [19]. Foliar fertilization of 2 kg ha−1 of micronutrients was applied at the flowering stage (Table 3).

2.2. Measurements

The growth, development, and yield of quinoa are generally affected by both cultivars and climatic conditions. In this study, we excluded two rows of each side of the experimental unit from all measurements and the following growth parameters were assessed.

2.2.1. Length of Plant Development Stages

Days to emergence, dicotyledonous leaves, two, four, and six true leaves, panicle emergence, flowering, and maturity were monitored daily on four central lines one meter in length in the different treatments (n = 16). We considered a development stage being attained when 50% of total plants reached it [20]. Recorded dates are converted to the number of days after sowing (DAS).

2.2.2. Chlorophyll Content Index (CCI)

The chlorophyll content reflects photosynthetic pigments and the yield potential of the plant. Low levels of leaf chlorophyll are associated with environmental stress [21]. For this reason, the chlorophyll content index (CCI) was measured bi-weekly starting from two months after sowing, from the middle part of the two fully developed youngest leaves of ten plants in the center of the experimental plot (n = 80) using a CCM 300 chlorophyll meter (Hansatech instruments).

2.2.3. Leaf Stomatal Conductance

Stomatal conductance is an indicator of water status in the plant. Soil water stress is associated with leaf stomatal closure, a low rate of CO2 entering, and consequently, low photosynthetic activity. In this experiment, leaf stomatal conductance was measured bi-weekly starting from two months after sowing, using a leaf porometer (SC-1 porometer, Decagon) on the five youngest fully expanded leaves in the center of the experimental plot (n = 20) [22]. Measurements were taken between 10 and 12 a.m.

2.2.4. Plant Height and Morphological Parameters

Plant height and vegetative development are positively correlated to yield. Thus, the height of ten plants from the center of the experimental plot (n = 40) was measured bi-weekly starting from two months after sowing. The number of leaves, panicles, and branches per plant as well as their dry matter were also measured bi-weekly on five sampled plants (n = 20). The dry weight was measured after oven drying of biomass 48 h at 60 °C.

2.2.5. Total Leaf Area

Leaf area is directly related to the quantity of intercepted light and has an effect on plant productivity. The total leaves of five sampled plants (n = 20) were scanned bi-weekly starting two months after sowing. The scan images were analyzed using Mesurim Pro (Version 3.3) software in order to determine the total leaf area.

2.2.6. Yield and Its Components

Five square meters were harvested from the center of each experimental plot. Within this harvested area, the main panicle length (n = 400), straw yield (n = 40), grain yield (n = 40), and the weight of 1000 grains (n = 40) were measured. The harvest index (HI) was calculated as the ratio of grain yield over the total aboveground biomass.

2.3. Statistical Analysis

Two-way ANOVA analysis was performed for different development stages, CCI, leaf stomatal conductance, plant height, morphological parameters, total leaf area, and yield and its components. All statistical differences were tested at the 5% probability level or lower (α ≤ 0.05). The Student–Newman–Keuls test was used to reveal differences between means. The stepwise regression analysis was carried out to explain the contribution of the amount of water received, accumulated growing degree-days, and total accumulated radiation in the variation of days to maturity of both cultivars. All statistical analyses were performed using the SPSS program (Version 20, IBM SPSS Inc., Chicago, IL, USA).

3. Results

3.1. Climatic Conditions of the Experiment Growing Season: Air Temperature, Rainfall, Radiation and Photoperiod

The climate of the experiment site is typical of the arid regions of Morocco. The temperature, precipitation, radiation, and photoperiod are the main climatic parameters to consider for making decisions on the sowing date. Temperature decreased from November to early January and then increased afterwards (Figure 1). The absolute minimum air temperature was −1.1 °C recorded on 1 January and the absolute maximum temperature was 39.9 °C recorded in June. November sowing faced the lowest temperatures during the growing cycle. The rainfall season was from November to early March. The maximum amount of rain (56.2 mm) was received in February (Figure 1). The total amount of water received by different treatments decreased with late sowing (Table 2). Quinoa planted in November, December, and January received the highest amount of rainwater with 77, 108, and 76 mm for ICBA-Q5 and 119, 108, and 78 mm for Titicaca, respectively. These differences in the quantity of rain received by cultivars of the same sowing date are due to differences in their growing cycle length. For February and March sowing dates, rainfall secured only plant establishment, and irrigation around flowering and seed filling was necessary.
The lowest radiation was recorded during winter and started to increase from March, and the maximum value was recorded in July (Figure 2). A steady photoperiod with a mean of 10.4 h d−1 was recorded from November to the onset of February (Figure 2). The photoperiod then increased to reach a maximum of 14.4 h d−1 in July.

3.2. Probability Study of 40 Years Climatic Conditions of Rehamna Region

Rehamna’s climate is typical of the arid regions of Morocco. Precipitations are characterized by high interannual variability with an annual average of 189 mm (Table 4). The rainy season spans six months, from November to April. During these months, the probability of having less than 20 mm of precipitation is relatively low. The average temperature decreases from September to January then starts to increase. The absolute minimum temperature was recorded in January (−3.4 °C). After April, the probability of having the maximum temperature exceeding 35 °C is very high (>70%). Thus, the optimal sowing date should position flowering and seed filling before this month in order to avoid pollen sterility and low yields.

3.3. Development Stages Length

3.3.1. Days to Emergence

Germination and emergence are two important development stages that highly affect crop density and final yield. The two cultivars, Titicaca and ICBA-Q5, took the same time to emerge (Table 5). However, the sowing date affected this parameter, essentially due to differences in temperature. Ten days after sowing was the maximum period for emergence observed and was for quinoa sown in January and February. However, the shortest period of 6 days after sowing was observed for quinoa sown in November and March.

3.3.2. Days to Dicotyledonous Leaves

Days to dicotyledonous leaves differed according to the sowing date and cultivar (Table 5). The interaction between these factors was non-significant. Quinoa sown in January and February took more time to reach the dicotyledonous leaf stage than other succeeding months (9.06 and 11.47 DAS, respectively). In comparison to Titicaca, IQBA-Q5 took less time to reach this stage when sown in January and March.

3.3.3. Days to Two True Leaves

The effect of sowing dates and quinoa cultivars on days to two true leaves was significant (Table 5). Similar to dicotyledonous leaves, the combination of both factors was not significant. Quinoa sown in December and January took more time to reach two true leaves than quinoa sown in February and March. ICBA-Q5 reached this stage earlier than Titicaca when sown in January and March (11.19 and 7.13, respectively).

3.3.4. Days to Four True Leaves

The effect of sowing dates and cultivars and their interaction on days to the four-true-leaves stage was significant (Table 5). Titicaca took more time to reach the four-true-leaves stage when sown in December and January (23.63 and 23.56 DAS, respectively). The same time was taken by ICBA-Q5 sown in December. Late sowing, in February and March, shortened this period. Results showed that with late sowing, ICBA-Q5 reached the four-true-leaves stage faster than Titicaca. The shortest period was taken by ICBA-Q5 sown in March (12.44 DAS).

3.3.5. Days to Six True Leaves

The number of days taken by quinoa to reach six true leaves was affected by the sowing date, cultivar, and their interaction (Table 5). The difference between cultivars was significant when quinoa was sown after January. ICBA-Q5 reached six true leaves earlier than Titicaca. The longest period was taken by quinoa sown in December (32.29 DAS), while the shortest period was taken by ICBA-Q5 when sown in March (15.25 DAS).

3.3.6. Days to Panicle Emergence

The mean comparison of sowing dates indicated that Titicaca took more time than ICBA-Q5 to reach the panicle-emergence stage (Table 5). The longest period was taken by Titicaca sown in December (70.38 DAS) and the shortest one by ICBA-Q5 sown in March (34.06 DAS).

3.3.7. Days to Flowering

Days to flowering were significantly different for sowing dates, quinoa cultivars, and their interaction (Table 5). The differences for the sowing date and cultivars were much bigger in this development stage than other ones. Titicaca sown in December took 78 days to flower. This period was reduced to 64 and 57 DAS for February and March sowing, respectively. ICBA-Q5 followed the same trend.

3.3.8. Days to Maturity
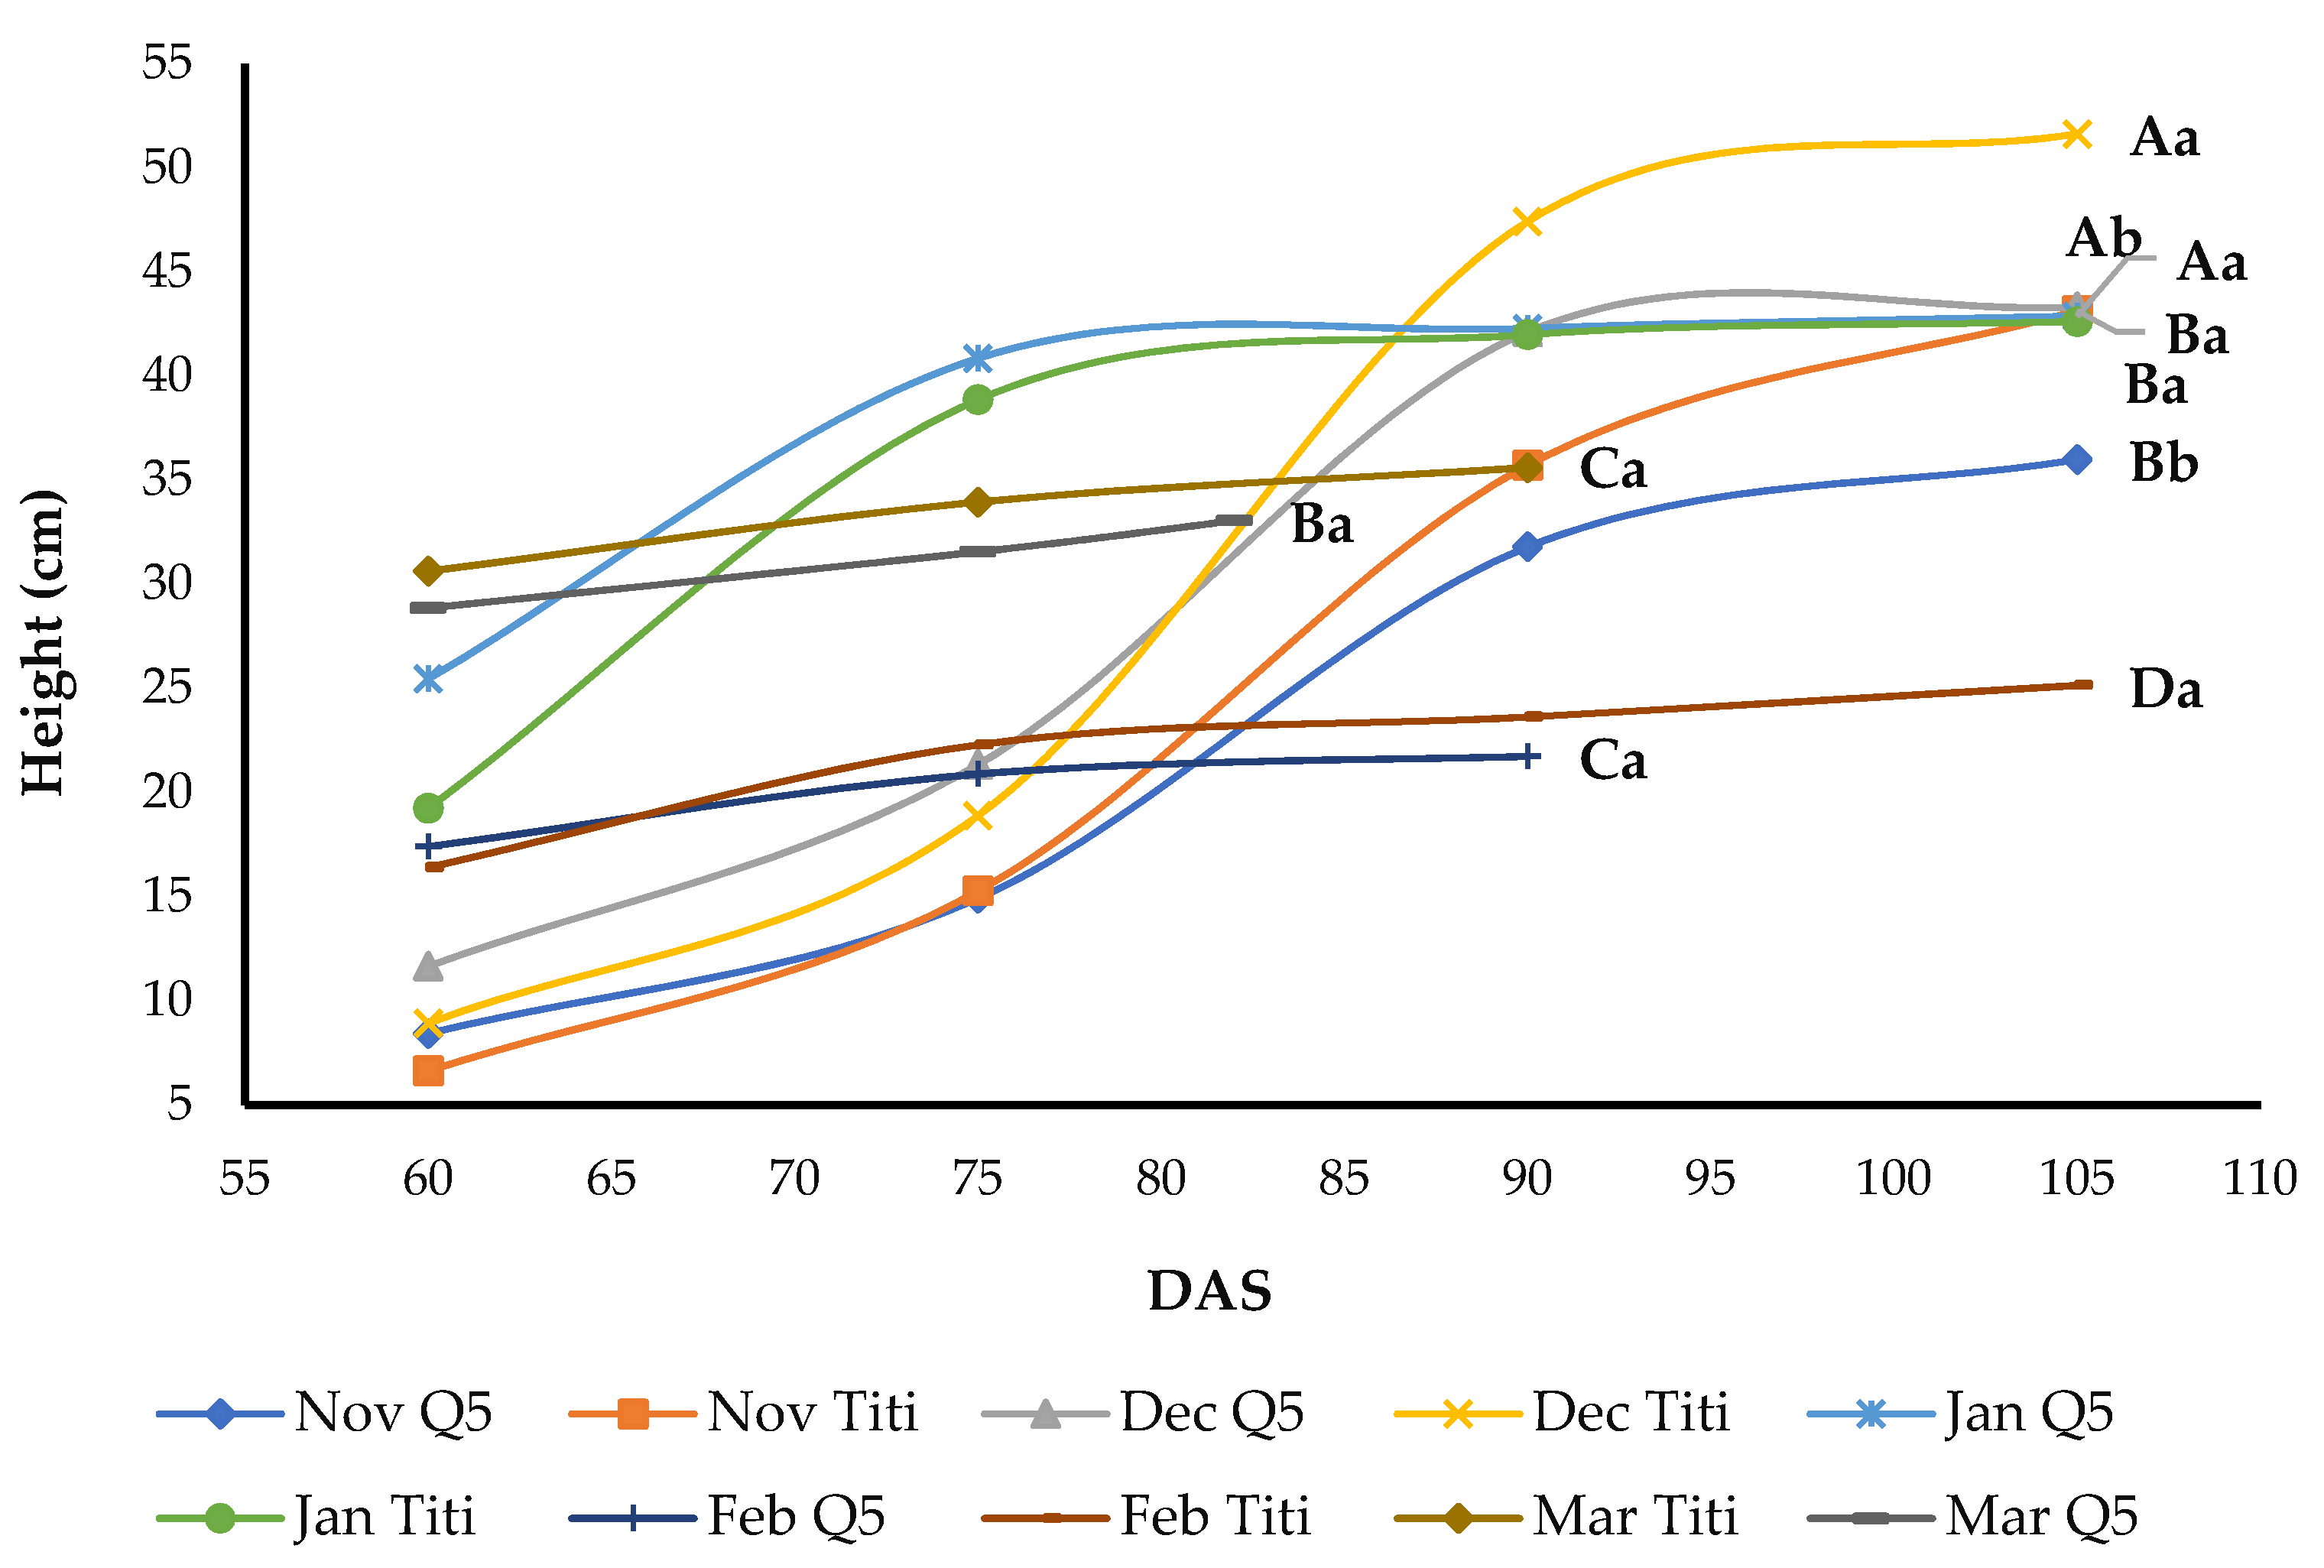
The results showed that ICBA-Q5 is a short-cycle variety. The days to maturity varied between 83 and 101 days depending on the sowing date. More time was required by Titicaca to reach maturity, and the number of days to maturity ranged between 109 and 119. Late sowing shortened the growing season length. The longest period was that of quinoa sown in December and the shortest period was that of quinoa sown in March.
In order to predict the number of days to maturity of both cultivars (DM), a stepwise regression model was developed based on the amount of water received in mm (W), accumulated growing degree-days ((GDD = Tm-Tbase), where Tm is the daily mean temperature and Tbase is equal to 3 °C for quinoa [23]), and total accumulated radiation (Rd) in W m−2.
For the ICBA-Q5 cultivar, the amount of water received was highly and positively correlated to the number of days to maturity, with R2 = 0.93%.
DM = 43.804 + 0.267 * W (R2 = 0.93)
The addition of total accumulated radiation to the regression model was highly significant and added 0.04% to the model precision.
DM = 23.545 + 0.297 * W − 0.01 * Rd (R2 = 0.97)
Similarly, the addition of the accumulated growing degree-days was highly significant and enhanced the R2 value.
DM = 81.499 + 0.189 * W − 0.73 * GDD + 0.03 * Rd (R2 = 0.98)
For the Titicaca cultivar, the amount of water received only explained 46% of the variability of numbers of days to maturity.
DM = 90.666 + 0.128 * W (R2 = 0.46)
The addition of the accumulated growing degree-days to the regression model was highly significant and added 28% to the model precision.
DM = −46.429 + 0.421 * W − 0.048 * GDD (R2 = 0.74)
Similarly, the addition of the total accumulated radiation was highly significant and enhanced the R2 value from 74% to 76%
DM = −118.728 + 0.586 * W − 0.086 * GDD − 0.002 * Rd (R2 = 0.76)

3.4. Plant Height

The final plant height was significantly different for both the sowing date and cultivar (Figure 3). However, no interaction between these two factors was recorded. The highest plant heights, for both cultivars, were recorded when quinoa was planted in December followed by January sowing whereas the lowest height was recorded when quinoa was planted in February (Figure 3). For early planting dates (November and December), plants of the Titicaca cultivar were much taller than those of the ICBA-Q5 cultivar. However, late sowing dates reduced the height of both cultivars, and no significant difference was recorded between cultivars planted on the same date (Figure 3).

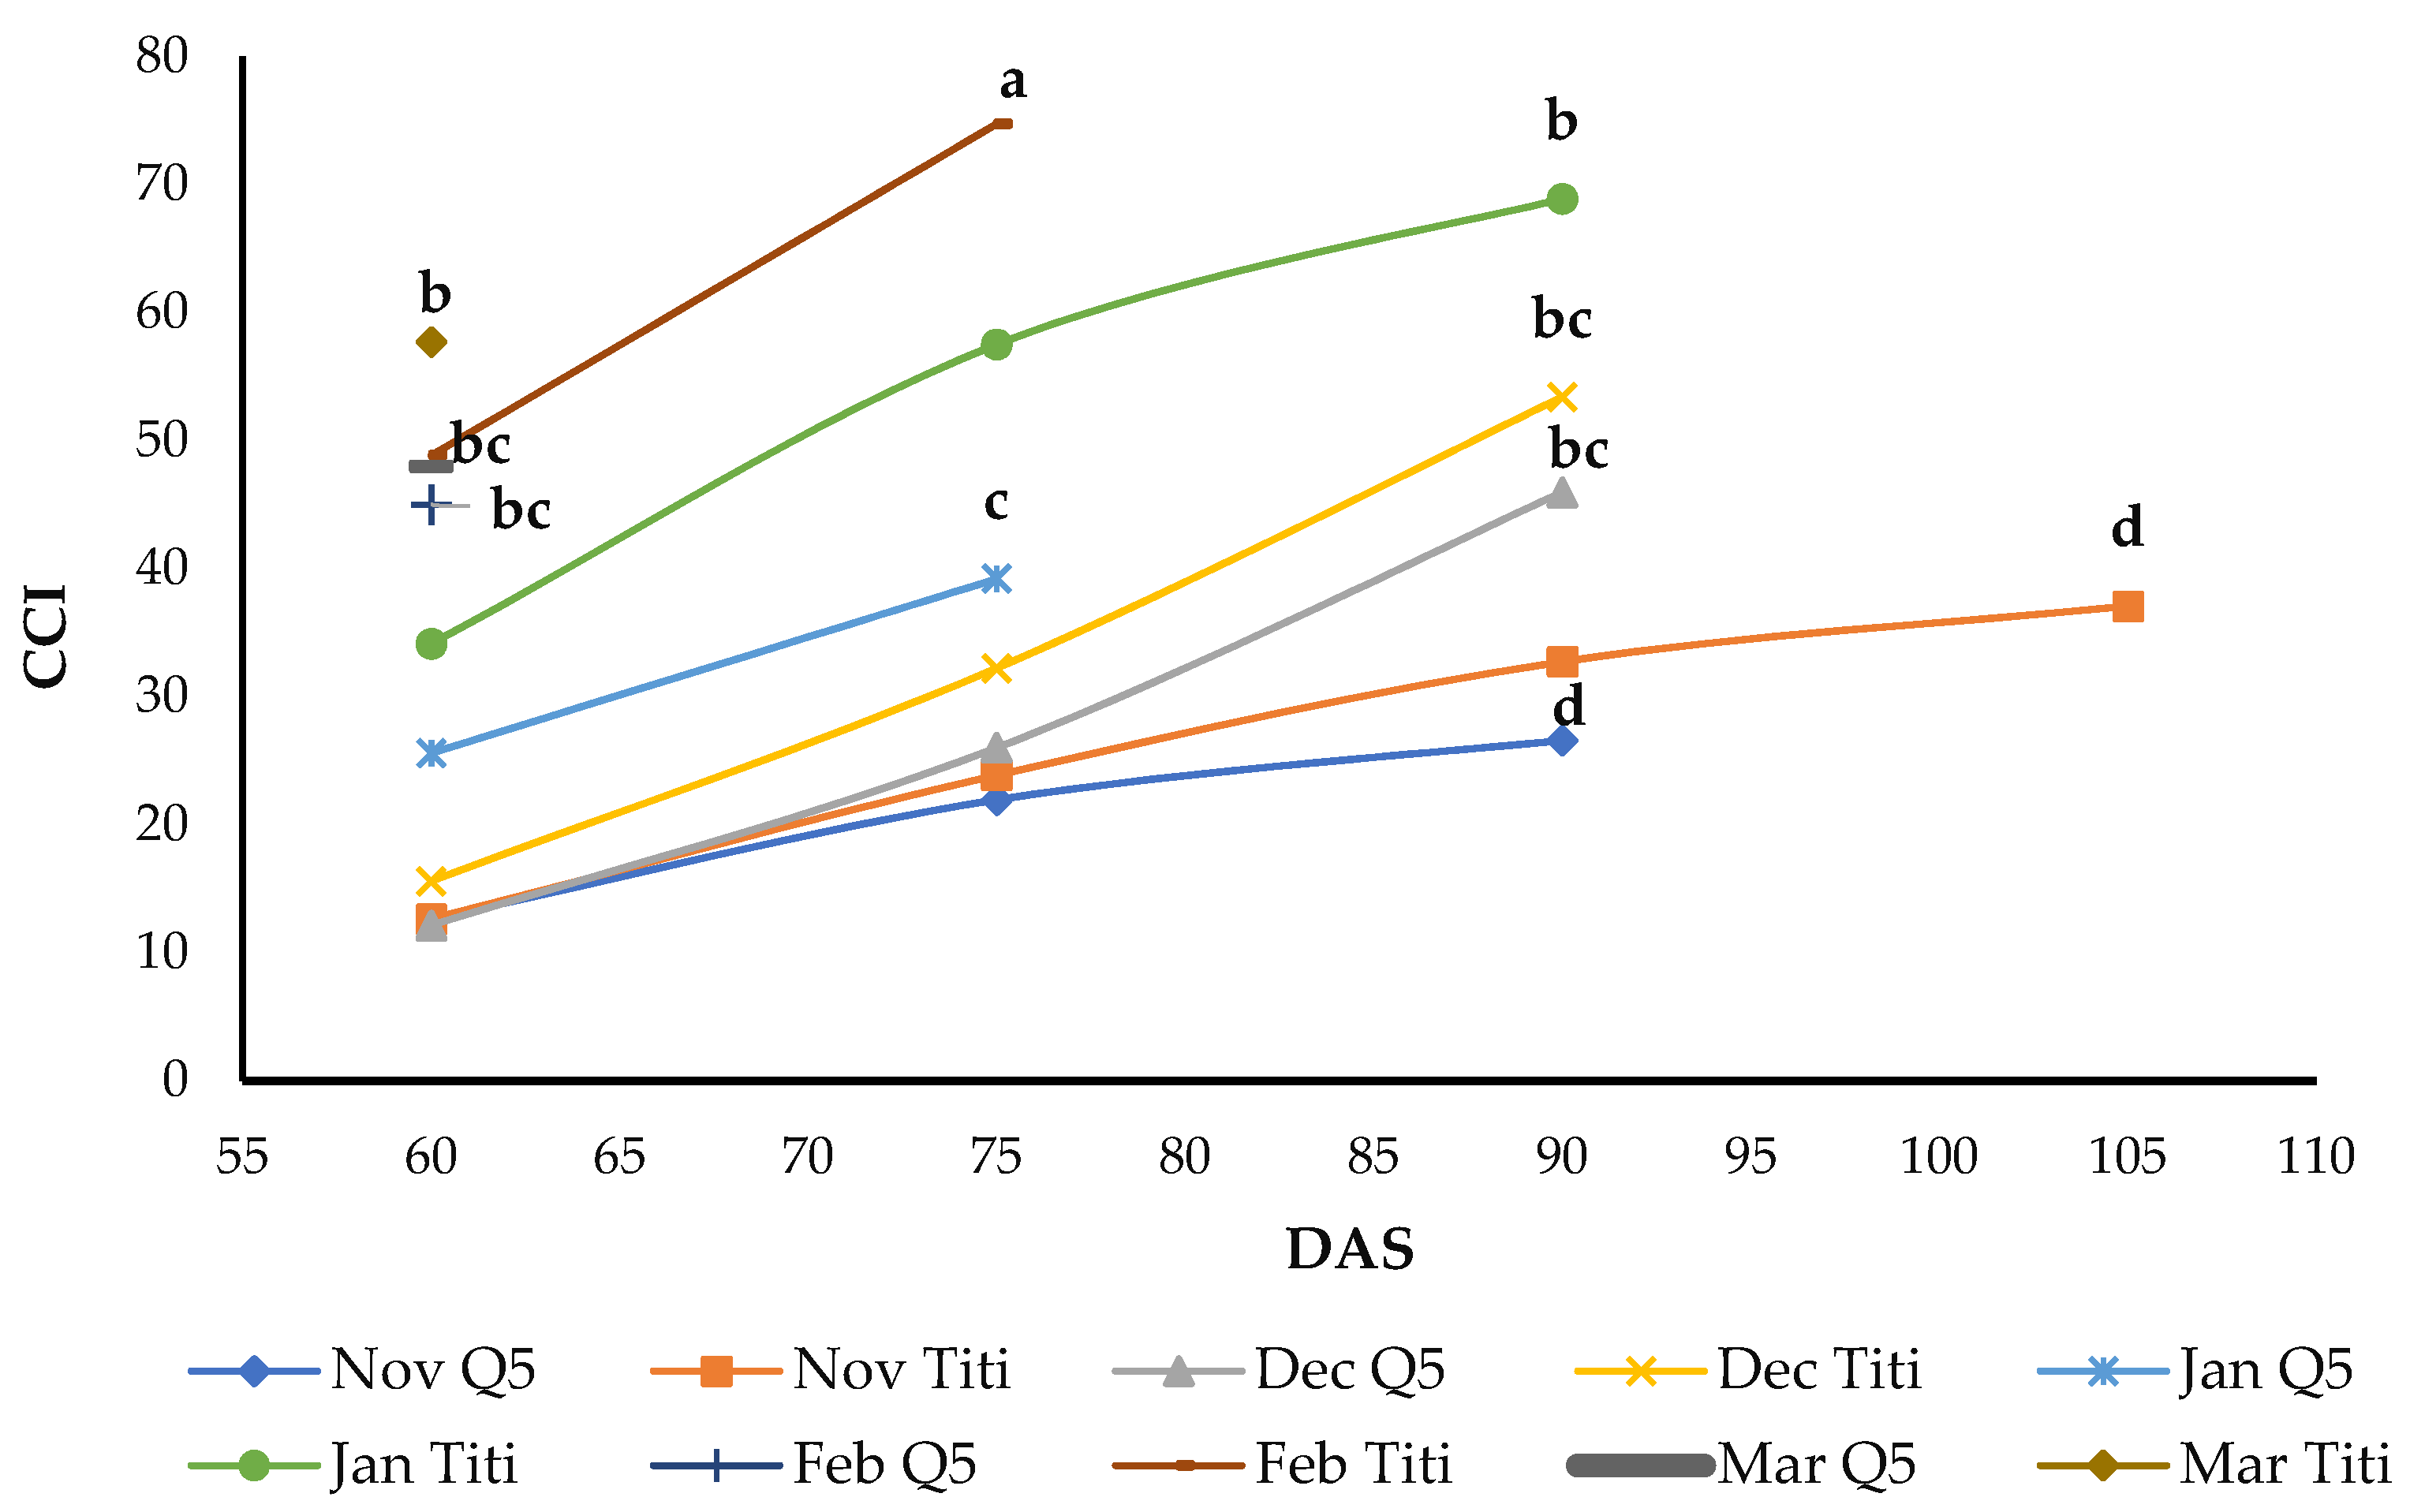
3.5. Chlorophyll Content Index (CCI)

Analysis of CCI showed a significant interaction between the sowing date and quinoa cultivar (Figure 4). A delay in the sowing date increased the CCI. The highest value of CCI was recorded by Titicaca sown in February and the lowest value was recorded by ICBA-Q5 when sown in November. Increasing radiation positively affected the chlorophyll content index, which explains the high values recorded by plants sown in February and March.

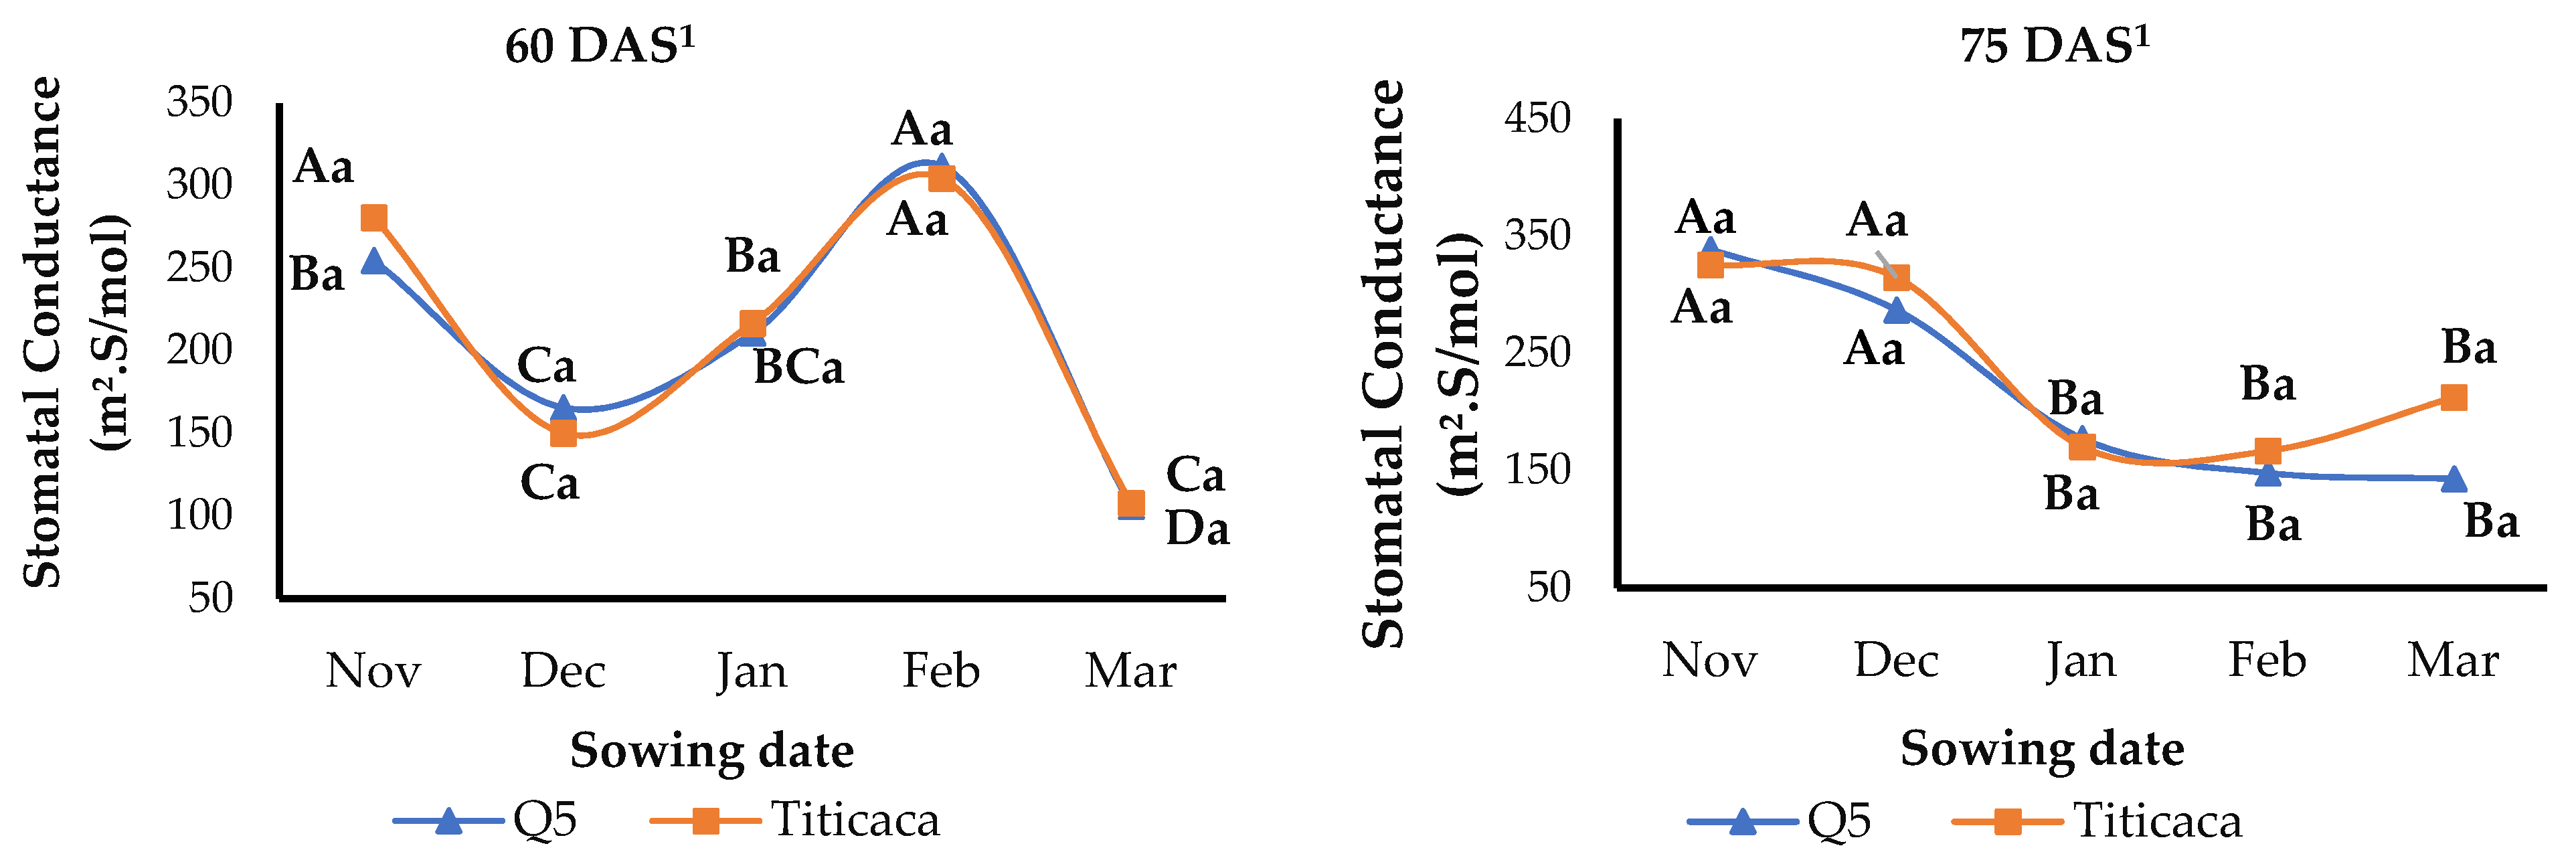
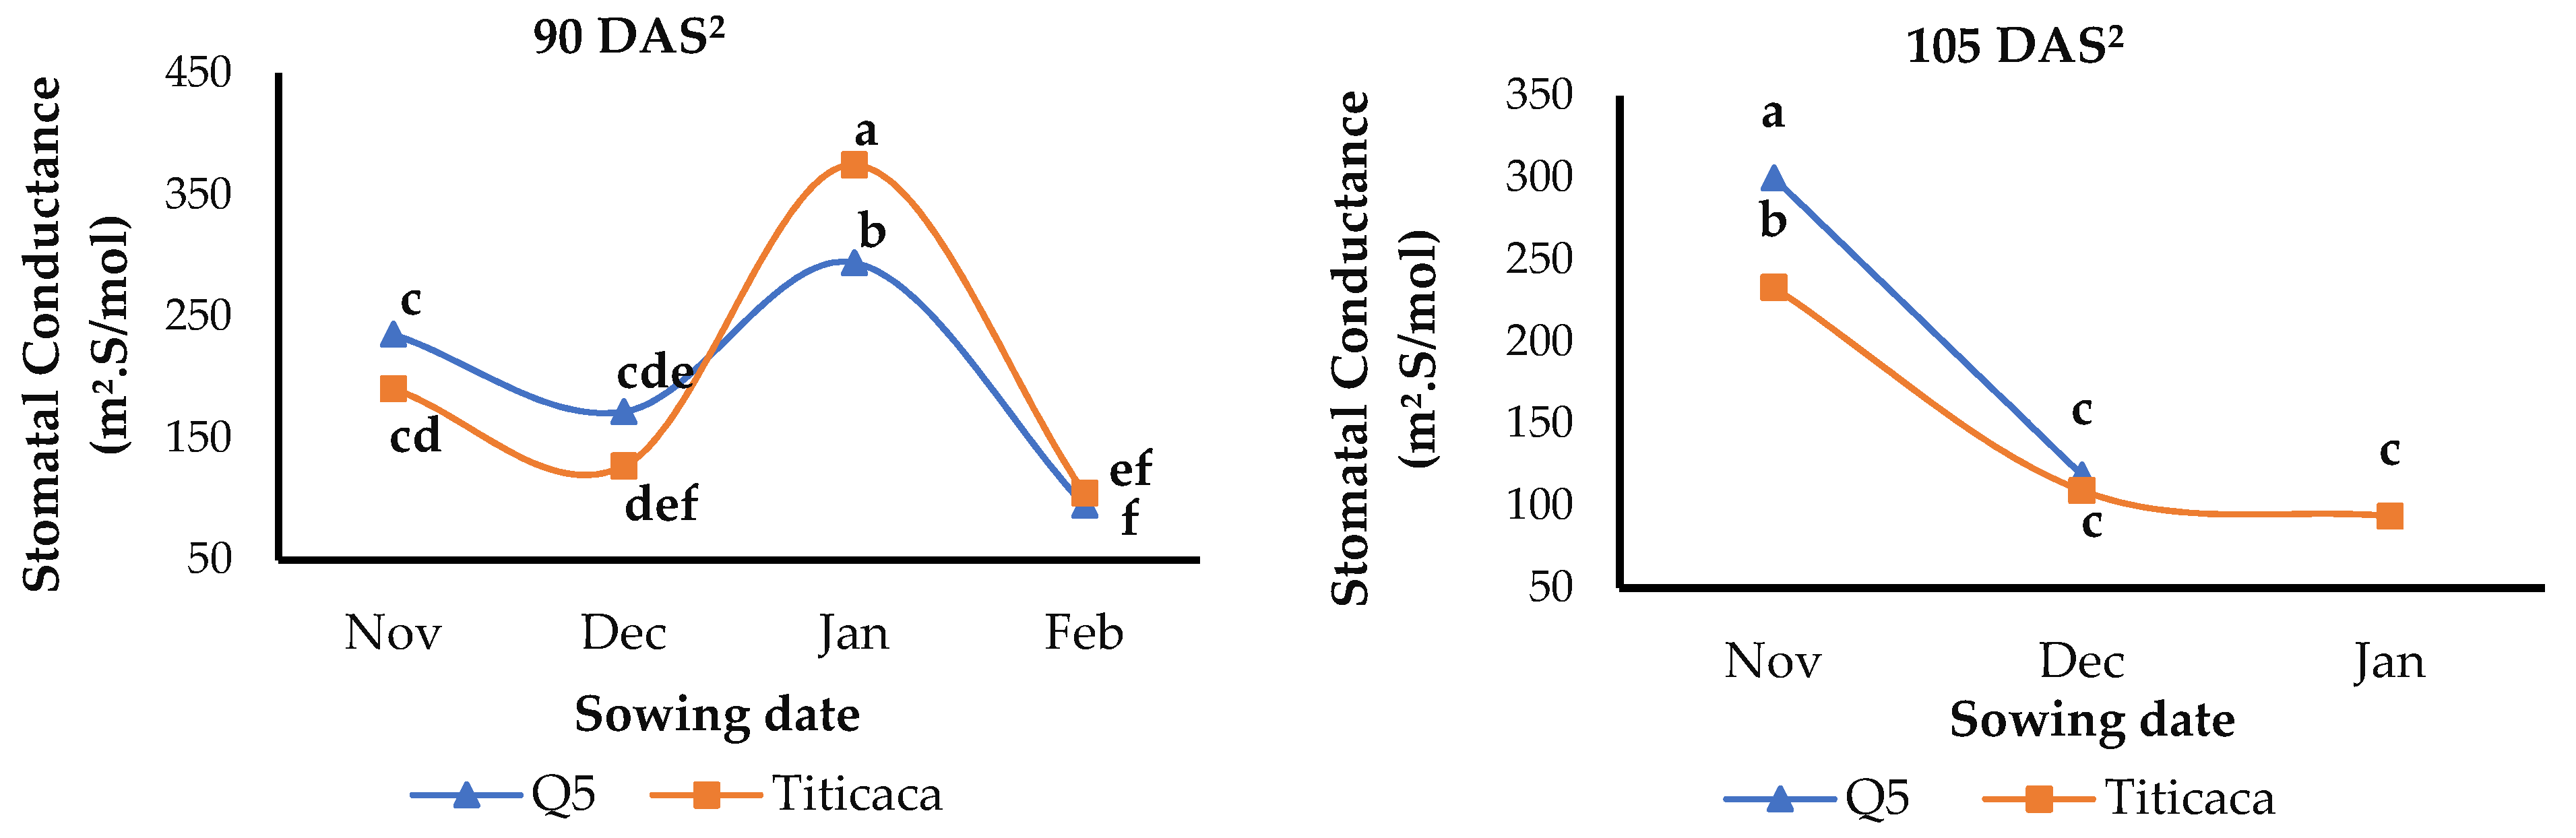
3.6. Stomatal Conductance

After 60 days of sowing, only the sowing date significantly affected the stomatal conductance, and the highest value was obtained for February sowing (Figure 5). This coincides with the panicle emergence stage. The lowest value was recorded by quinoa sown in March, which coincides with the grain filling stage. Similarly, after 75 days of sowing, the stomatal conductance was affected only by the sowing date. The highest value was recorded by November and December sowing. This period was that of flowering for Titicaca and seed filling for ICBA-Q5, where precipitation was abundant. Late sowing depressed the stomatal conductance. This is because the plant was near to maturity and leaves started to wither. After 90 days following sowing, analysis was only conducted for four sowing dates that had different growing season lengths. Sowing dates and quinoa cultivars as well as their interaction had a significant effect on stomatal conductance (Figure 5). Sowing in January recorded the highest value. During this time, the plant was in the grain-filling stage. The plant sown in February was the most stressed after 90 days after sowing, and that coincided with the stage of grain maturity. Moreover, 105 days after sowing, analysis was only conducted for three sowing dates. The highest value of stomatal conductance was that of November sowing. The lowest value was that of December and January, and the plants were near to maturity.

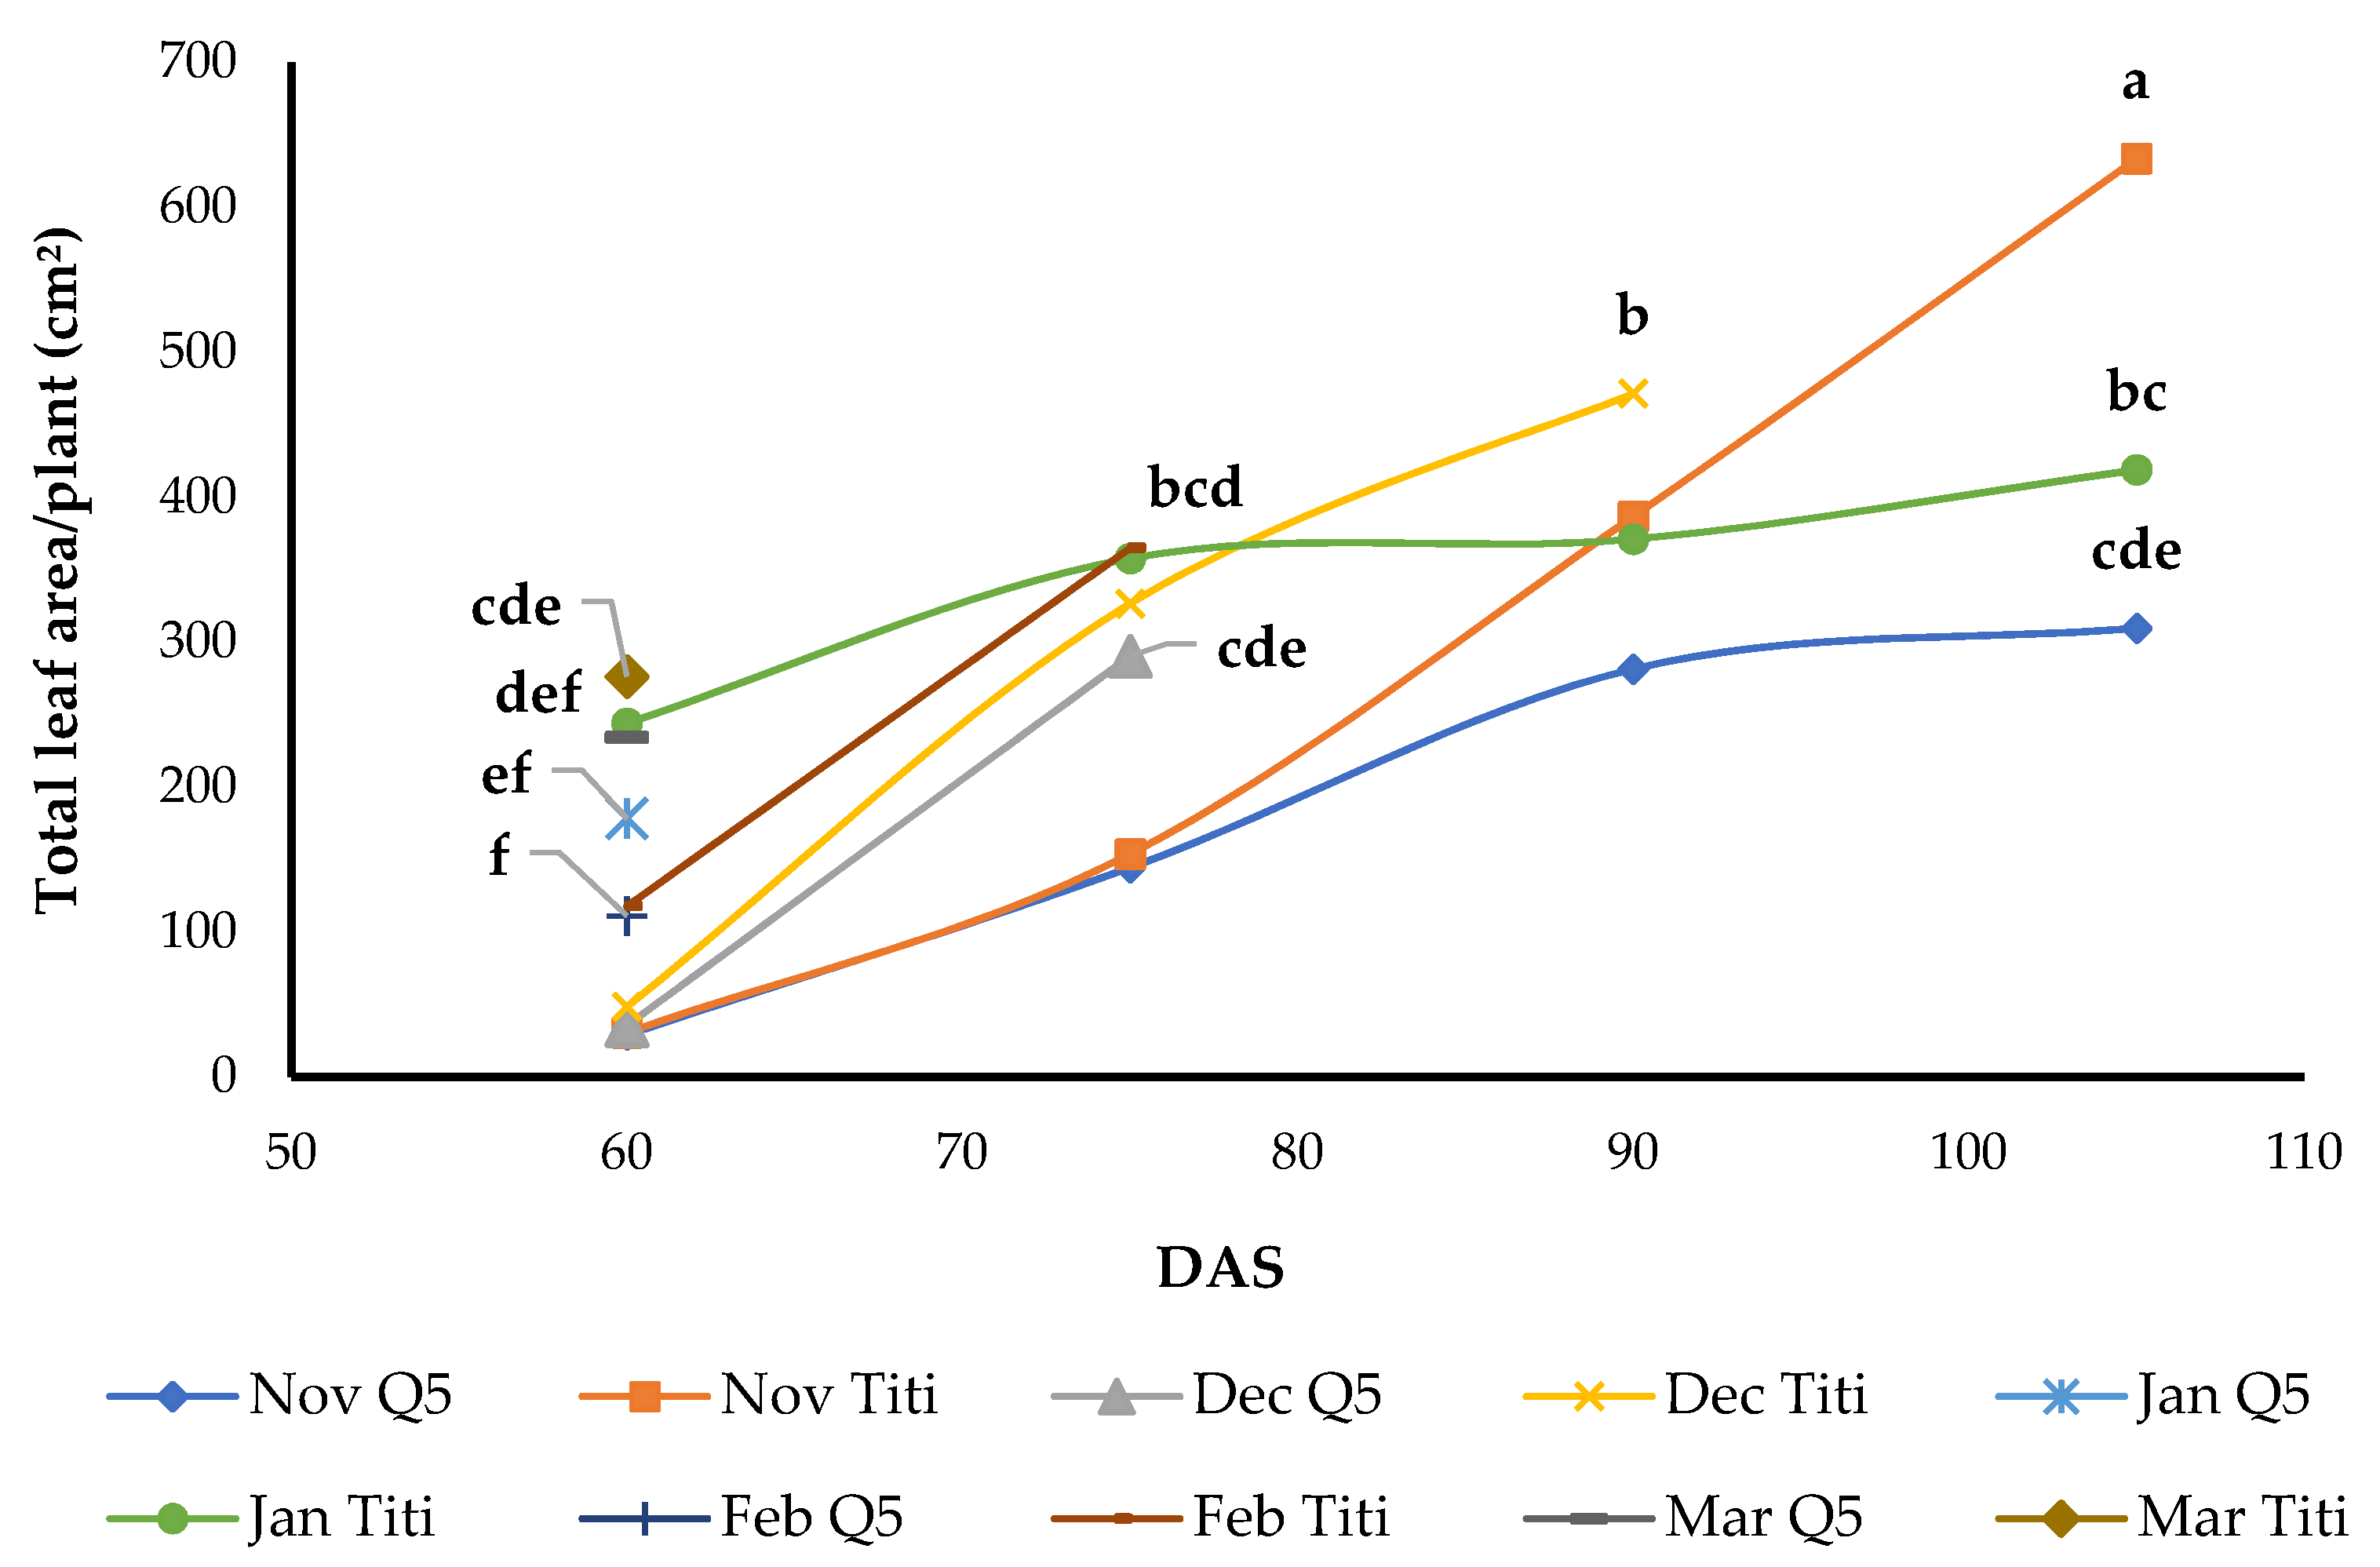
3.7. Total Leaf Area

The combination of sowing date and quinoa cultivar significantly affected the total leaf area of the plant (Figure 6). Titicaca plants developed a higher total leaf area than ICBA-Q5 plants, especially when sown in November and December. The total leaf area was reduced considerably with late sowing, and the lowest value was recorded by ICBA-Q5 sown in February.

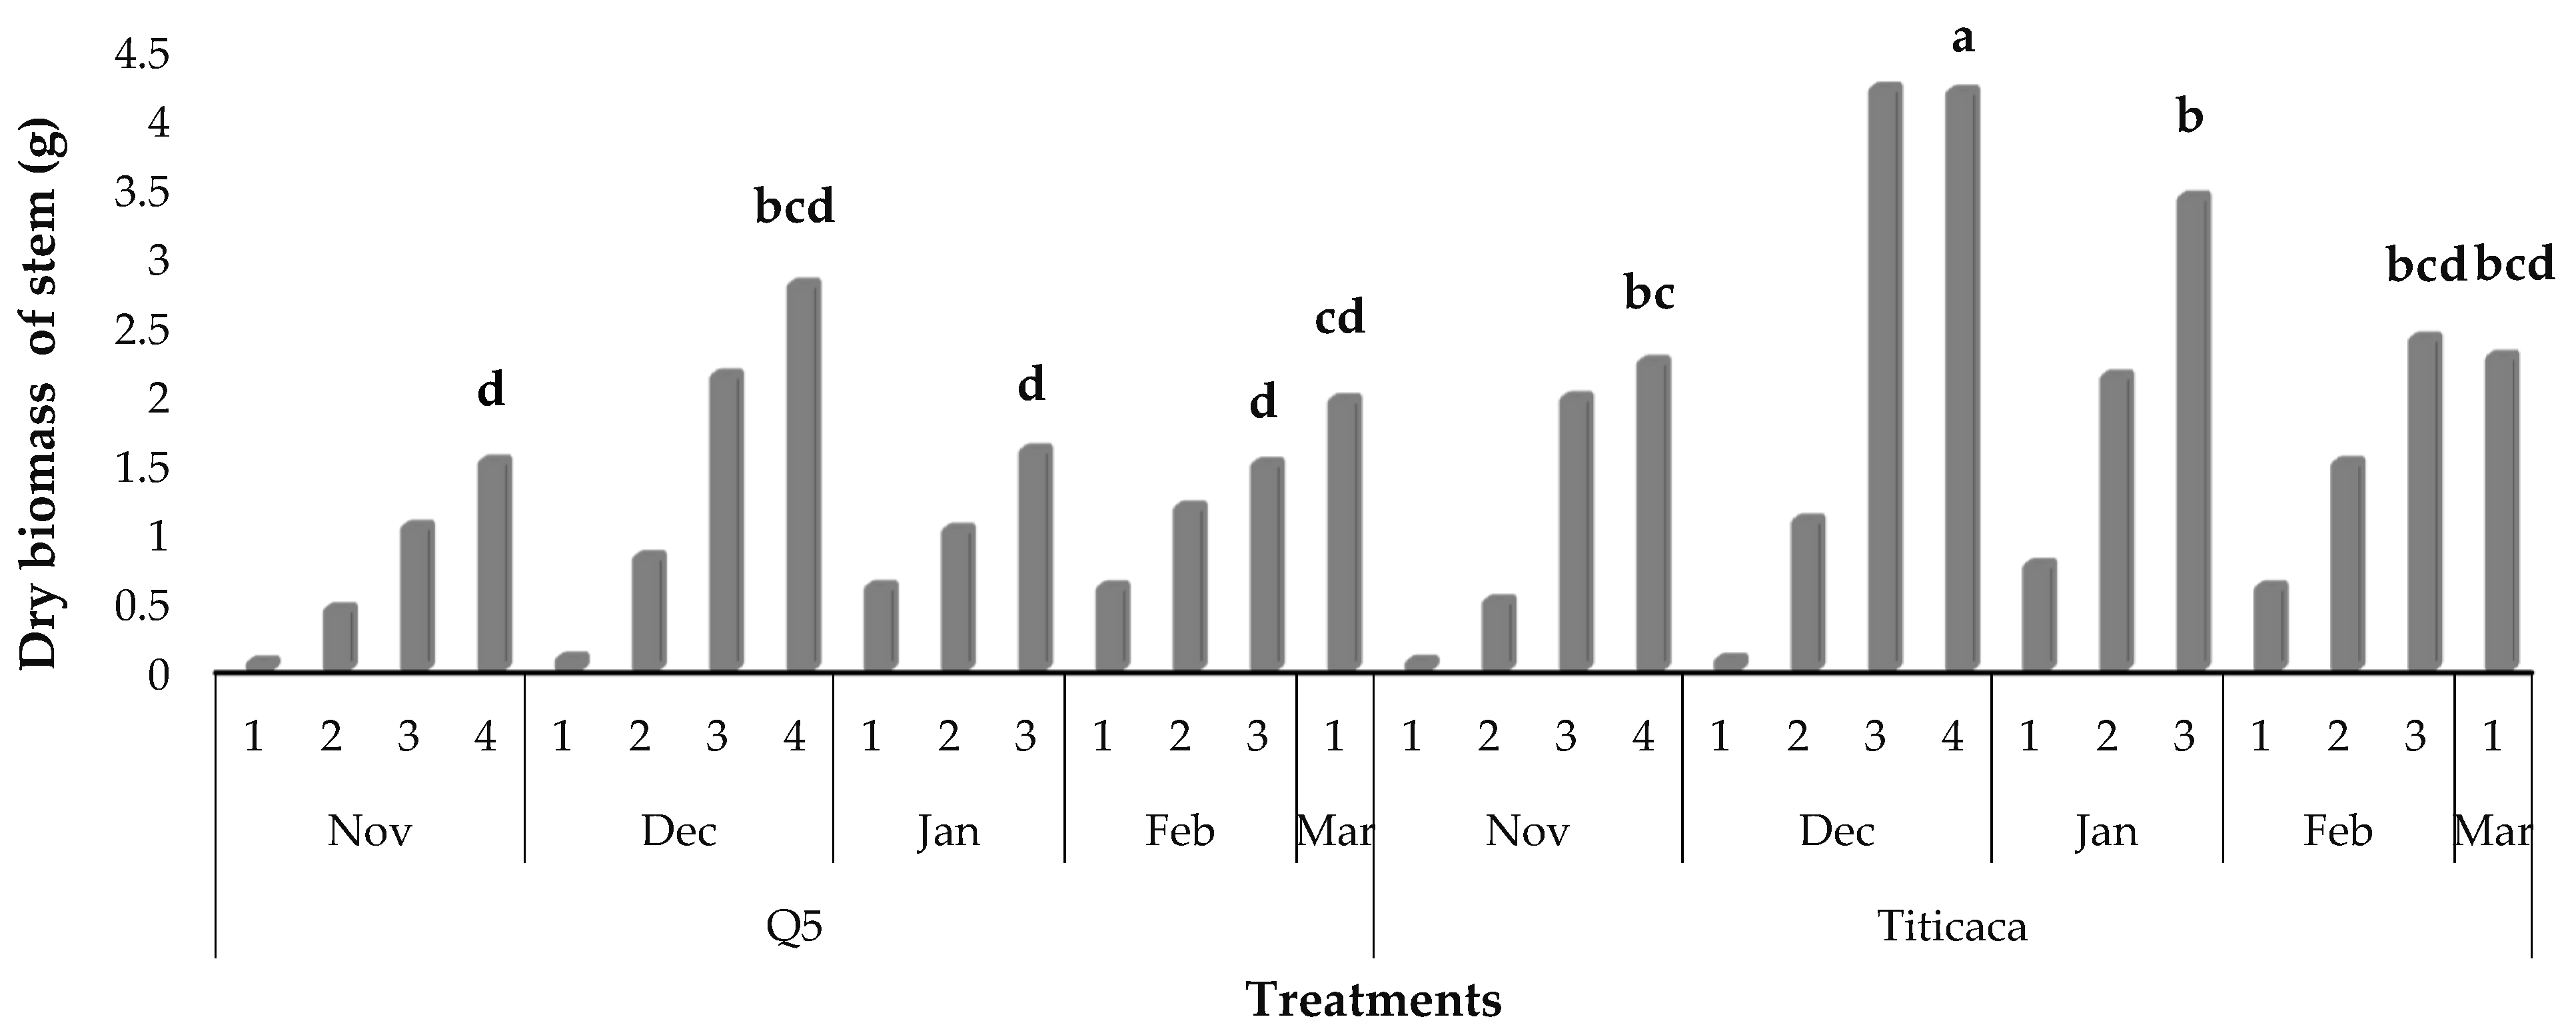
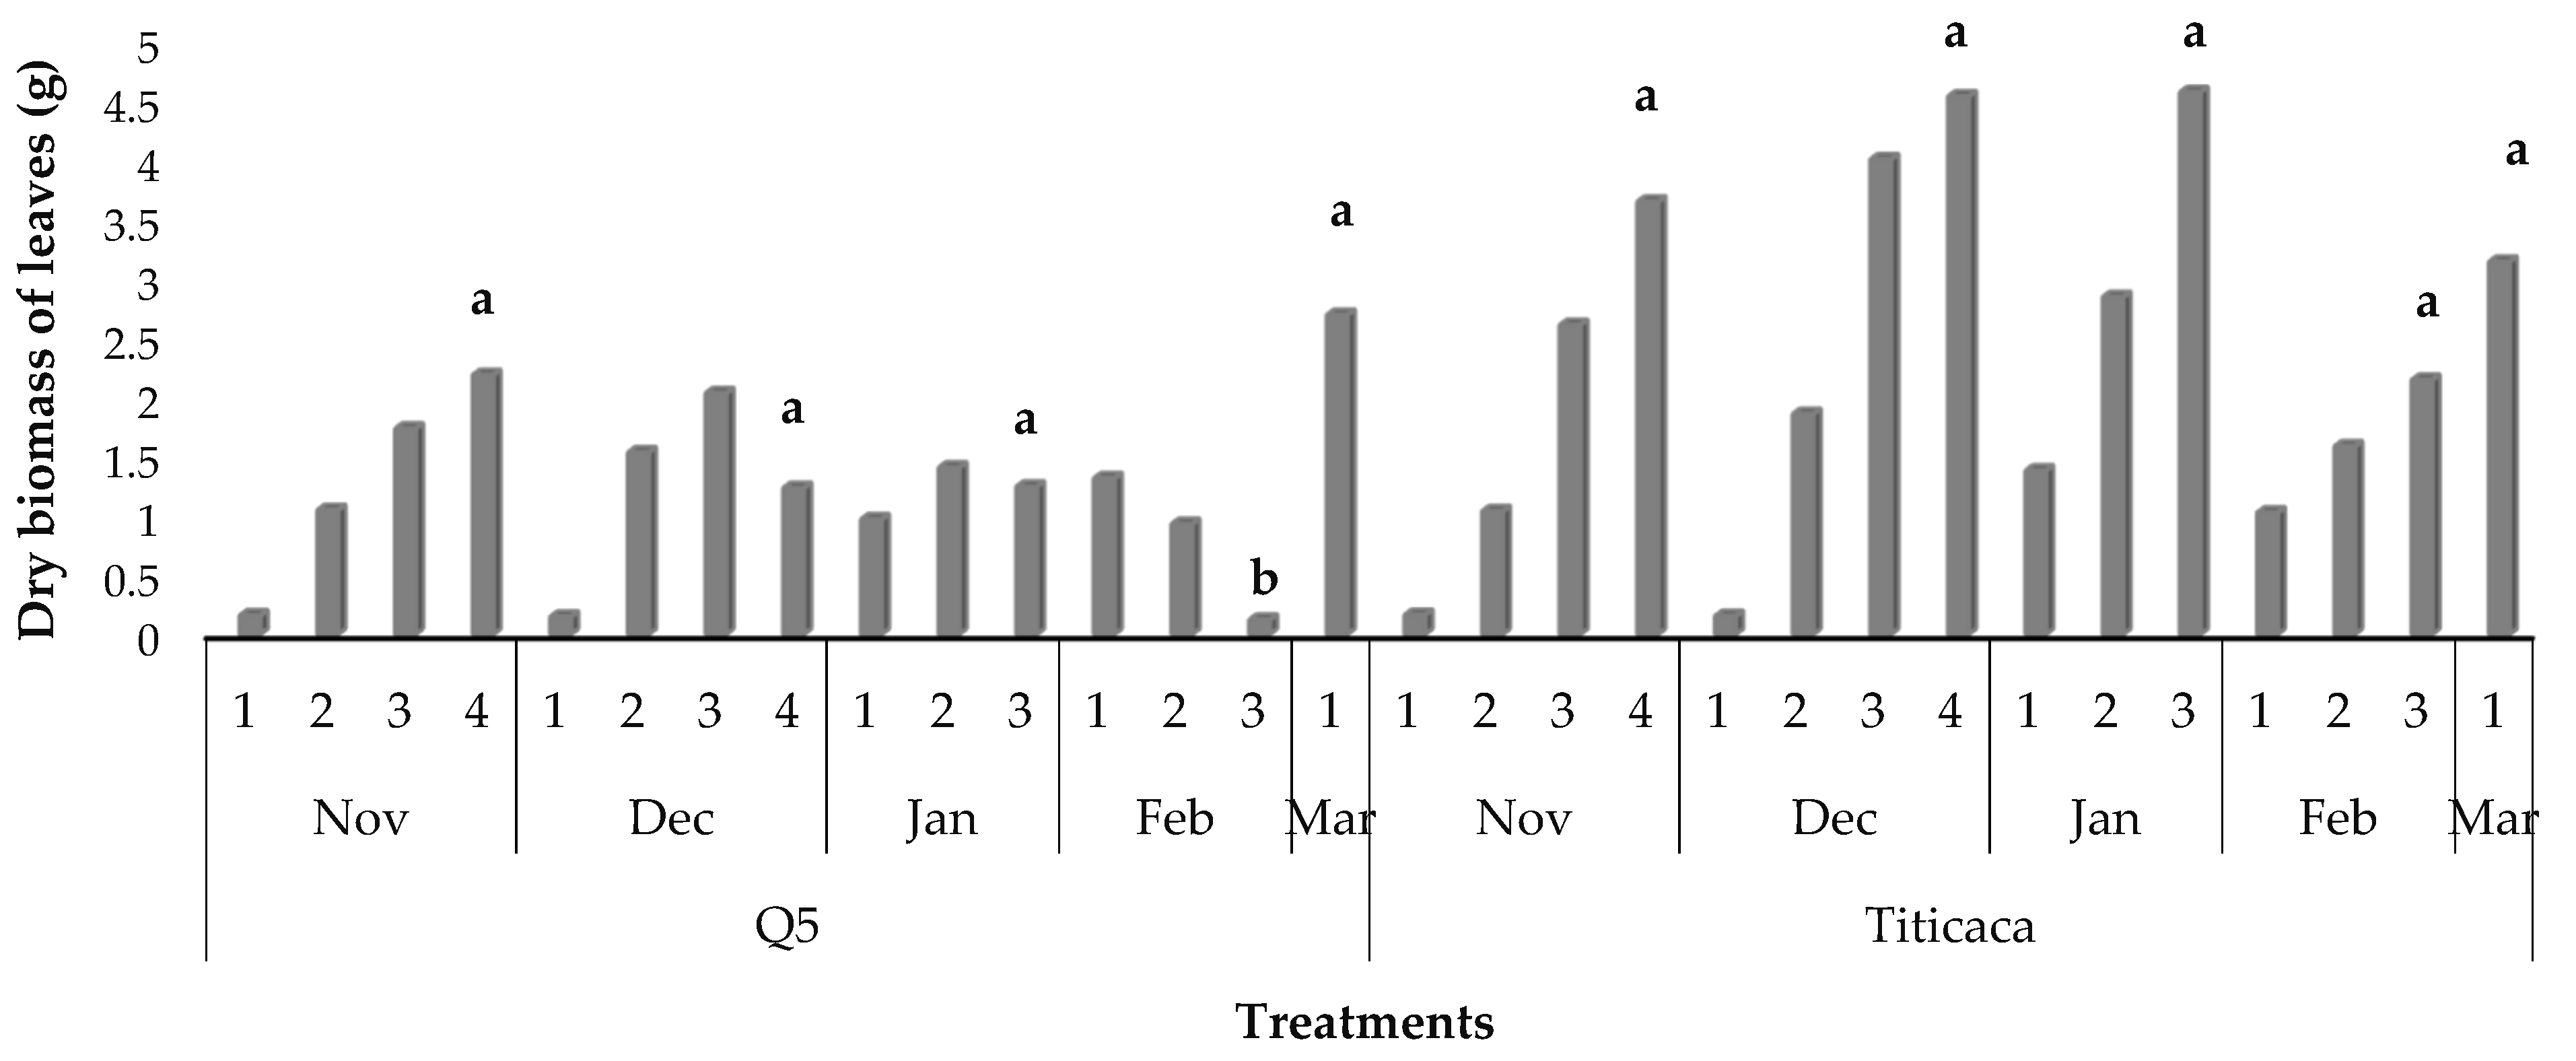
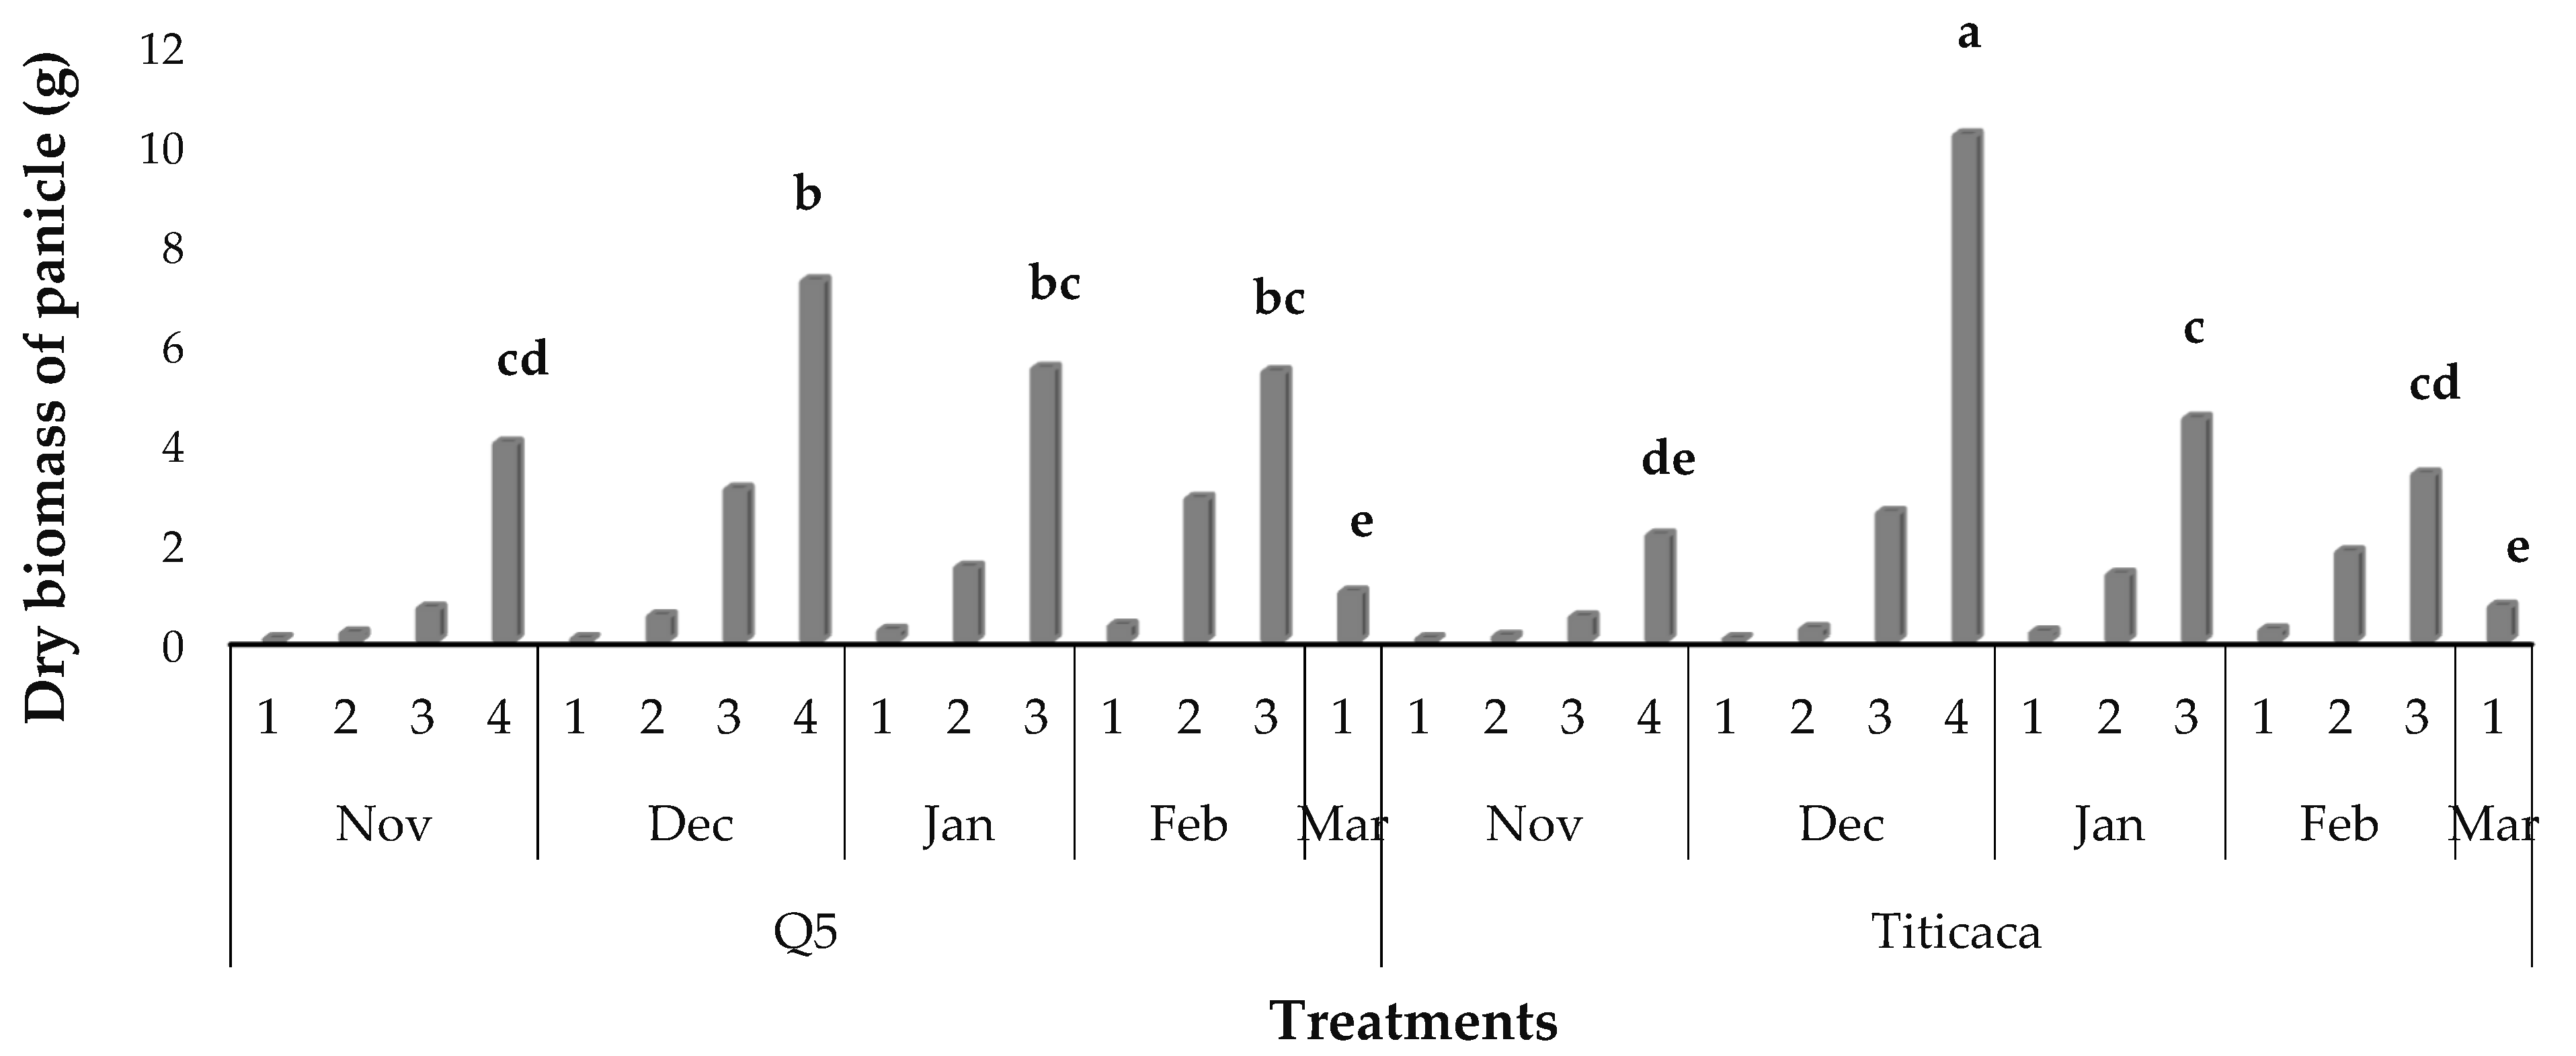
3.8. Dry Biomass Partitioning

There were significant interactions between planting dates and quinoa cultivars for the final dry weight of stems, leaves, and panicles (Figure 7, Figure 8 and Figure 9). Titicaca accumulated more dry biomass than ICBA-Q5. The highest amount of dry biomass was recorded when quinoa was planted in December followed by that of January. Planting in February and March dramatically depressed the biomass accumulation in all organs and resulted in early panicle emergence and stunted plants.

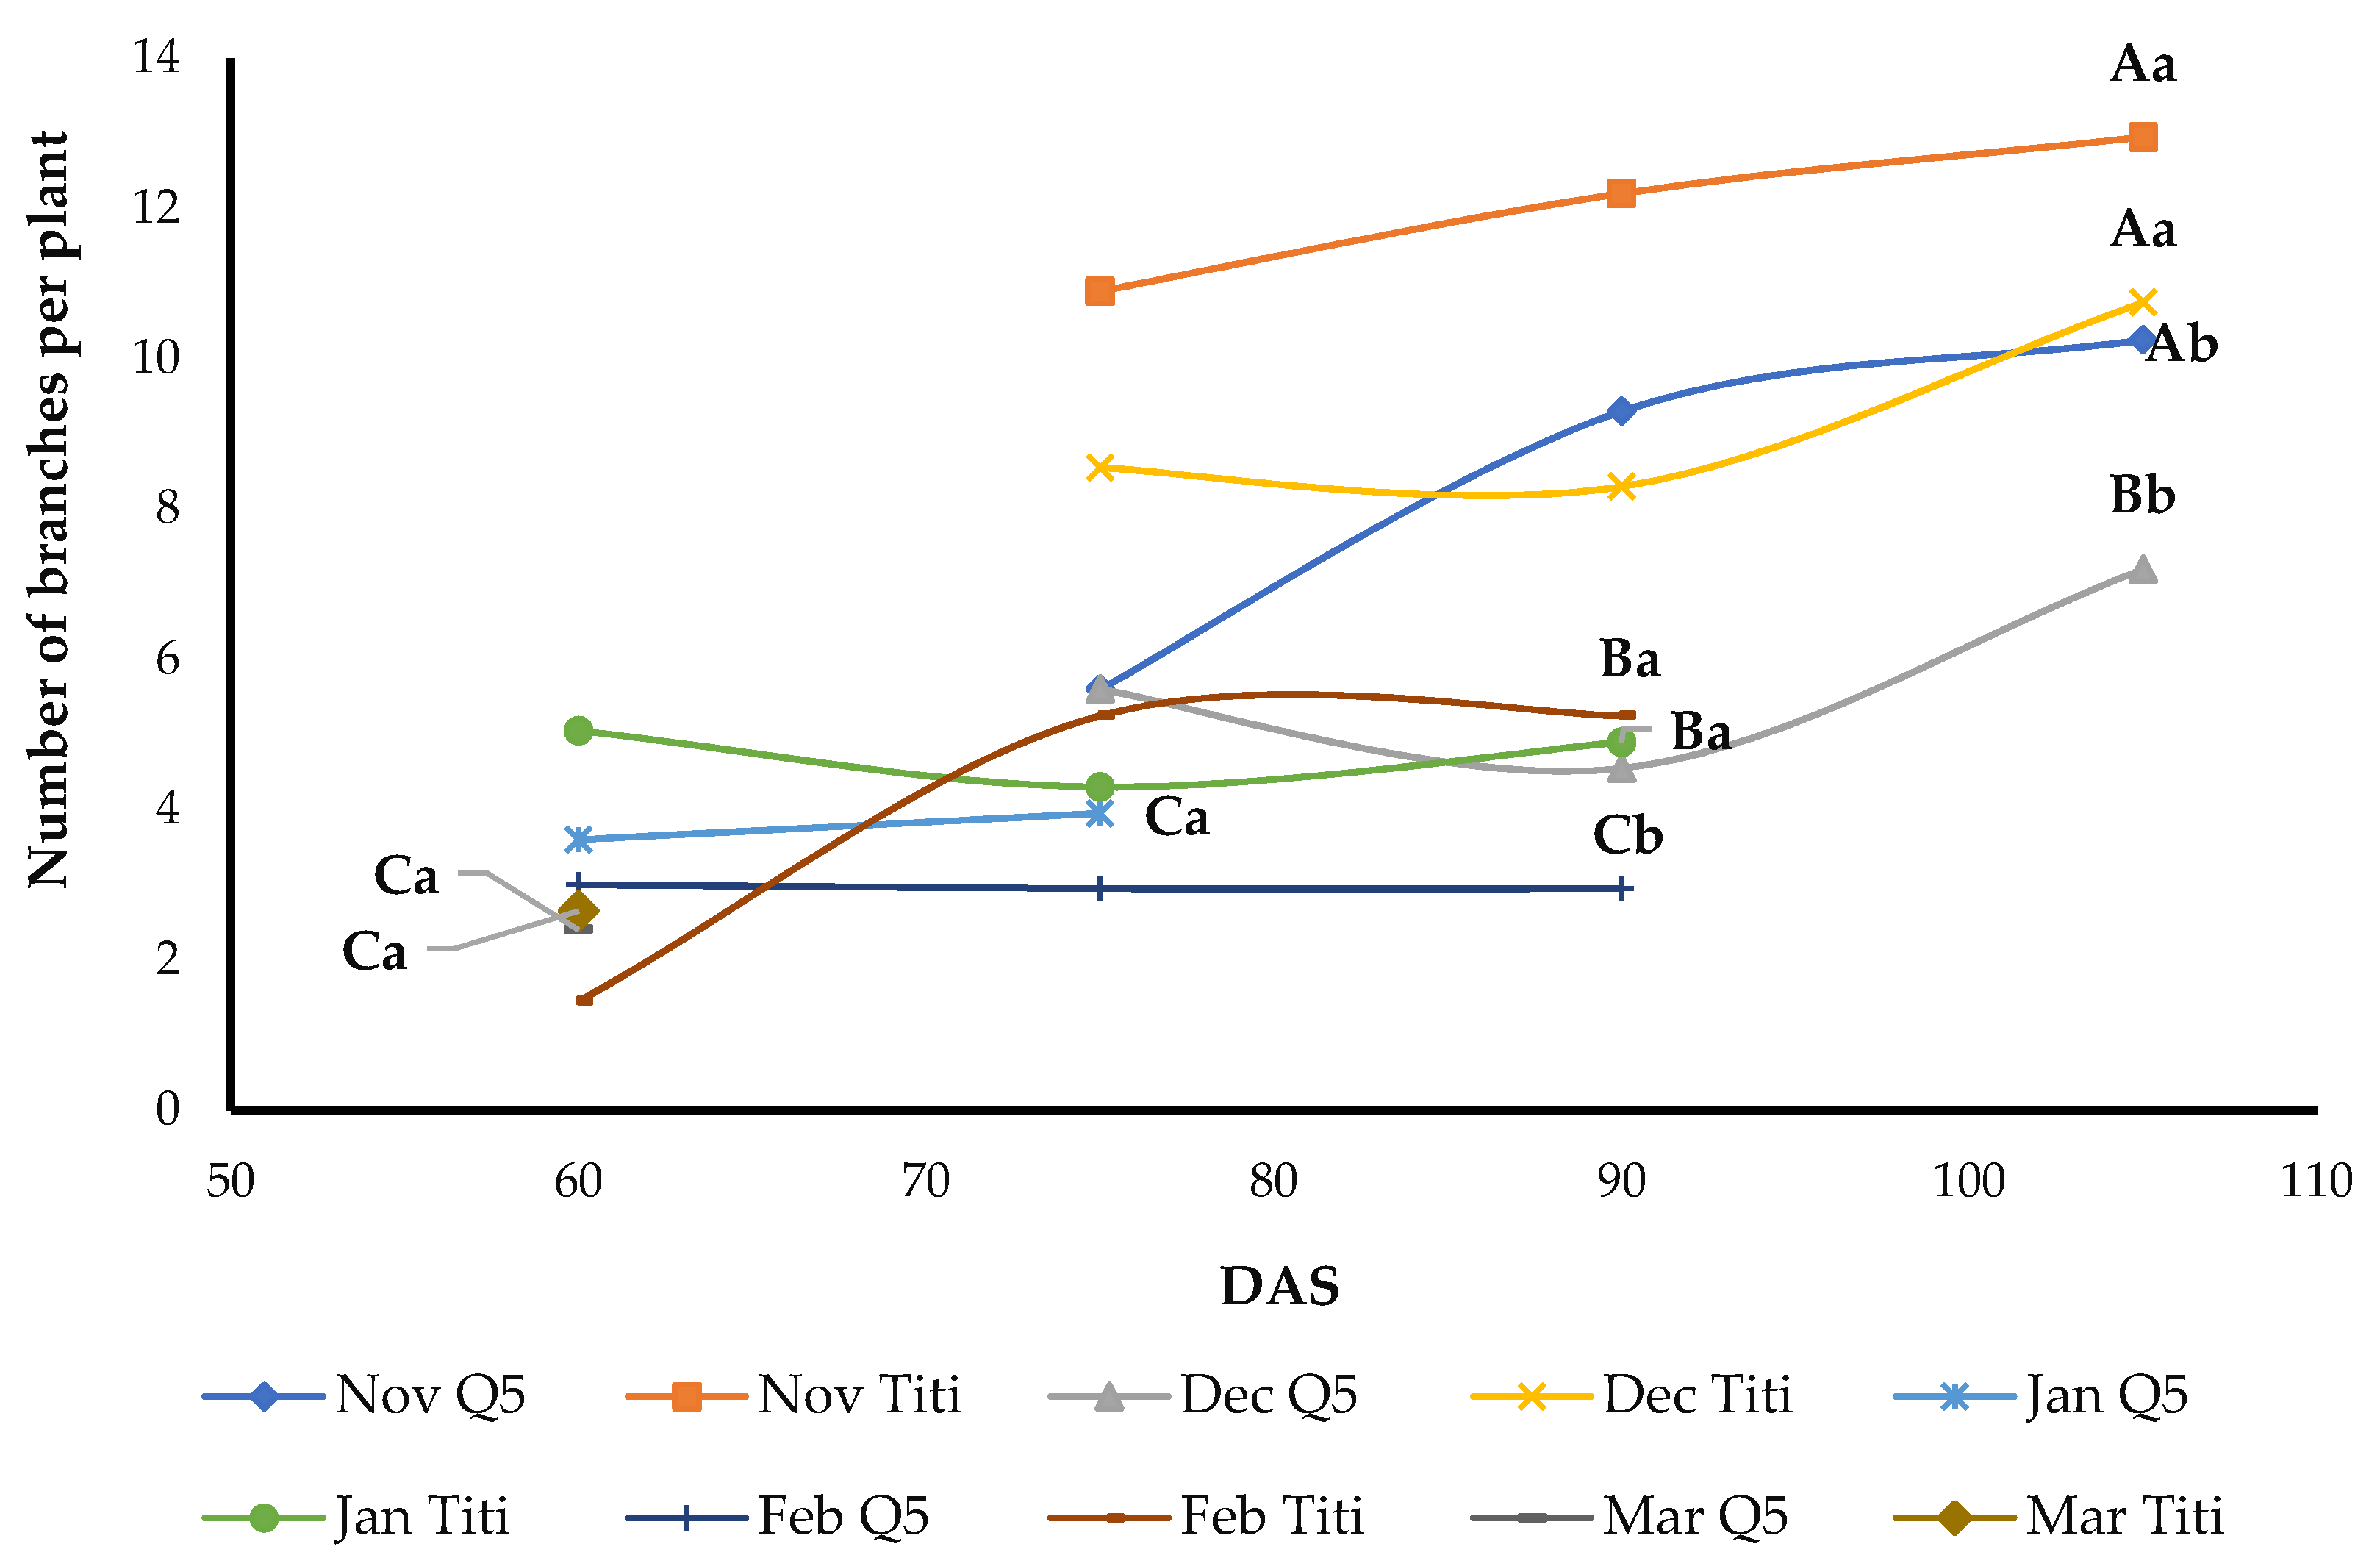
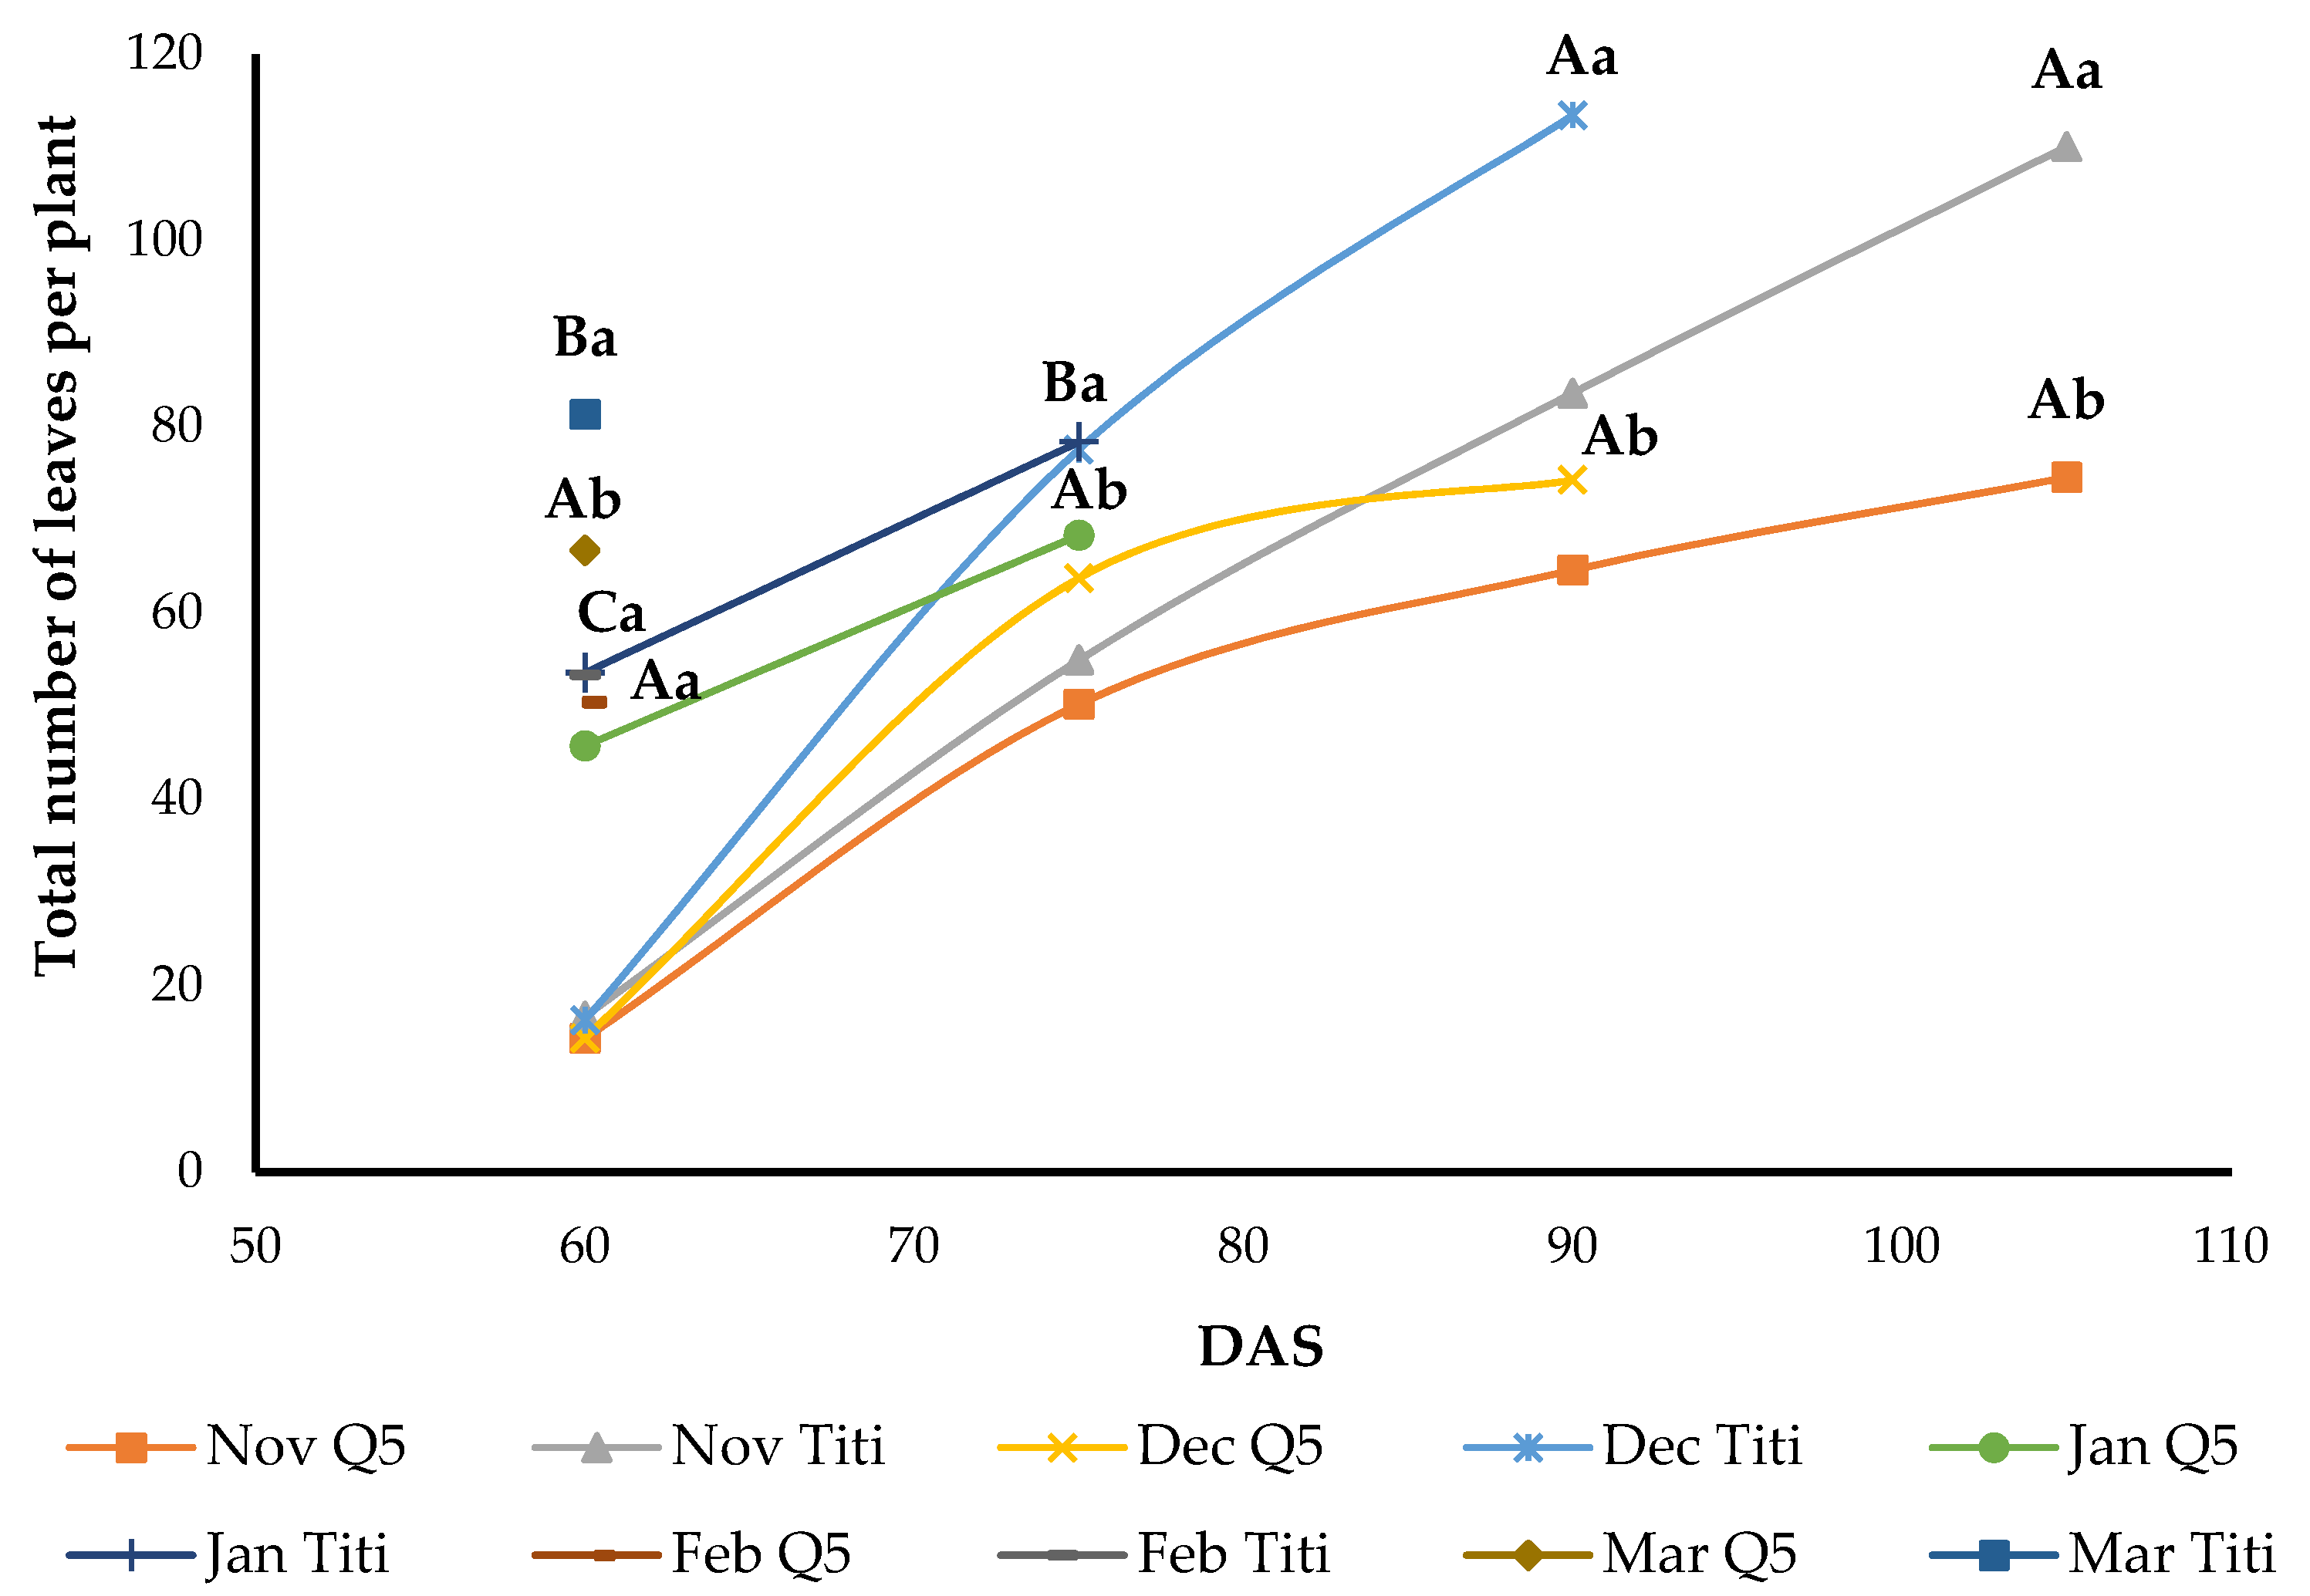
3.9. Number of Branches, Leaves, and Panicles per Plant

The number of branches per plant was significantly affected by the quinoa cultivar and its sowing date (Figure 10). The interaction between these two factors was not significant. The number of branches per plant of Titicaca was higher than ICBA-Q5 and lower in late sowing than early sowing dates. November and December sowing increased the number of branches per plant and enhanced vegetative development. The same trends were noticed for the number of leaves per plant (Figure 11). The Titicaca cultivar developed a higher number of leaves per plant than ICBA-Q5. This parameter decreased with a delay in the sowing date. The highest values were recorded by Titicaca sown in November and December and the lowest number was that of ICBA-Q5 sown in February. The number of panicles per plant was higher in early sowing dates (Figure 12). The highest numbers were that of quinoa sown in November and December, followed by plants sown in January.

3.10. Yield Components and Panicle Length

ICBA-Q5 and Titicaca sown in December produced a substantially higher grain yield than other treatments (Table 6). Sowing in January is still adequate for both cultivars. Titicaca was more sensitive to a delay in sowing dates, and a reduction of 78% and 89% was recorded when sowing in February and March, respectively. Sowing in November, December, and January resulted in large panicles, which were reduced in late sowing.
There were also significant effects of the interaction of the sowing date and cultivar for straw yield (Table 6). December, January, and February gave the highest straw yield. The harvest index varied according to sowing dates and cultivars (Table 6). The highest values were recorded by early sowing dates. ICBA-Q5 has a higher 1000-grain weight than Titicaca. Sowing in December and January enhanced this parameter, and a reduction of 48% was recorded when delaying the sowing date from December to March.

4. Discussion

Temperature, photoperiod, radiation, and water highly affected quinoa cultivars’ development stage lengths. The low temperatures, radiation, and photoperiod of early sowing resulted in slow plant development, and more time was taken to reach days to true leaves, panicle emergence, flowering, and maturity. This helps the crop to secure good vegetative development necessary for high yields. The late sowing of February and March decreased these periods. Similar results were reported for quinoa by previous authors [24] who found that with increasing levels of temperature and photoperiod, the number of days after emergence to panicle appearance and flowering decreased from February to April in Central Italy. In addition, the results obtained by previous researchers [25] when testing the sowing dates of quinoa in Pakistan indicated that late sowing engendered less time to attain maturity (125.33) and hastened the shift to the next development stage as the plant accumulates the heat units needed faster.
Sowing in December and January enhanced the plant height, total leaf area, number of branches, leaves, and panicles, and dry biomass. These two sowing dates benefit from shorts days, optimal temperatures, and more efficient rainfall use. Late sowing decreased these parameters. The present results are in line with those found by [15,24] where late sowing decreased the vegetative development of quinoa and resulted in stunted plants.
In the present study, early planting dates in November, December, and January placed the growing season of quinoa in the rainy season. However, it was observed that November planting treatments underwent continuous low temperatures and radiation from vegetative development to seed filling. This resulted in low panicle dry biomass and low yield. Cool temperature is necessary to achieve good growth and a maximum yield of quinoa [26].
Under the climate conditions of this experiment, the highest yields were obtained with sowing in December followed by January. These treatments were developed with short days, optimal temperatures, and received high and well-distributed amounts of water (rain + supplemental irrigation) during the growing season, with 250 mm for December sowing and 215 mm for January sowing. Higher yields of quinoa from earlier sowing were also reported in the Agadir region of Morocco [16] and in the south of Italy [27]. Yields for both cultivars were similar to those obtained in the area of origin (0.3–1.3 t ha−1; [28]). ICBA-Q5 was less sensitive to a delay in sowing dates in comparison to Titicaca. The origin of ICBA-Q5 is the coast of Chile [15], and genotypes from this area were less sensitive to the photoperiod [29]. However, yields of both cultivars were lower than those typically obtained from other experiments in the Rehamna region [15], and this may be due to differences in water supply and soils fertility. Late sowing reduced the grain and straw yield, harvest index, 1000-grain weight, and panicle length. This is, for the majority, attributed to lack of rain and increasing temperature and photoperiod during the growing season. A substantial loss of yield was recorded when water stress occurred during the filling stage [30]. In addition, the combination of high temperatures and long days resulted in great inhibition of seed growth and reduced their diameter [4].
The probability study of climate data over 40 years enabled an understanding of the distribution of rain and temperature and an estimate of the climatic risks according to sowing dates in the Rehamna region. Optimal flowering and seed-filling dates occurring before April in the Rehamna region help escape high temperatures (>35 °C) and reduce the risk of pollen sterility. Thus, February and March planting are discouraged in this region. Planting at these late dates increases the probability of being exposed to high temperatures and dry spells during flowering and grain filling, which may dramatically affect the final yield. Planting quinoa in November helps in securing good and rapid crop establishment since temperatures and precipitations of this month are adequate for quinoa cultivation. However, plants sown in this month are then exposed to low continuous temperatures that persist along their growing cycle, from December to March. This may negatively affect the performance of quinoa and reduce yield. Therefore, December sowing represents the optimal sowing date for quinoa in the Rehamna region. Planting quinoa in this month expands the growing season length with very slow crop establishment. Based on the result of this experiment, the approximate seed-filling date of December planting is estimated to occur around March. The optimal temperature and precipitation of this month enhance seed filling and produce higher yields in the Rehamna region.
In the context of climate change, the drying trend recorded at the end of quinoa’s growing cycle negatively affects the yield in different arid regions across the world. Early sowing of short-cycle cultivars using supplemental irrigation to secure crop establishment represents a good strategy to enhance yields. This helps in displacing the growing cycle of quinoa in the rainy season and allows it to escape drought and high temperatures occurring around flowering and grain-filling stages. However, this strategy should be further evaluated with other cultivars and in different regions to accurately determine the best sowing date for increasing quinoa yields.

5. Conclusions

Precipitation, temperature, radiation, and photoperiod are the main factors affecting quinoa development and yield. December was the most appropriate date for sowing ICBA-Q5 and Titicaca cultivars in the Rehamna region. Planting at this date allowed for a long crop development cycle, better growth, and produced the highest yield. This could be attributed to adequate temperatures (10–25 °C), a short photoperiod (a mean of 11 h−1), and high and well-distributed precipitation, especially during grain filling, the most drought-sensitive stage. Late sowing in February and March reduced the growth and yield of quinoa cultivars.

Author Contributions

Conceptualization, M.E.G. and K.E.M.; methodology, N.T.; software, N.T.; validation, M.E.G., K.E.M. and R.B.; formal analysis, N.T.; investigation, N.T. and M.M.; resources, M.E.G. and A.O.; data curation, M.E.G.; writing—original draft preparation, N.T.; writing—review and editing, M.E.G., K.E.M., R.B., R.C.-A. and A.O.; visualization, N.T. and M.M.; supervision, M.E.G. and K.E.M.; project administration, M.E.G. All authors have read and agreed to the published version of the manuscript.

Funding

This research received no external funding.

Institutional Review Board Statement

Not applicable.

Informed Consent Statement

Not applicable.

Data Availability Statement

Not applicable.

Conflicts of Interest

The authors declare no conflict of interest.

References

  1. Risi, J.C.; Galwey, N.W. Effects of Sowing Date and Sowing Rate on Plant Development and Grain Yield of Quinoa (Chenopodium Quinoa) in a Temperate Environment. J. Agric. Sci. 1991, 117, 325–332. [Google Scholar] [CrossRef]
  2. FAO. Quinoa: An ancient crop to contribute to world food security. In Regional Office for Latin America and the Caribbean; Bojanic, A., Ed.; Food and Agriculture Organization: Rome, Italy, 2011; p. 63. [Google Scholar]
  3. Aguilar, P.; Jacobsen, S.E. Cultivation of quinoa on the Peruvian Altiplano. Food Rev. Int. 2003, 19, 31–41. [Google Scholar] [CrossRef]
  4. Bertero, H.D.; King, R.W.; Hall, A.J. Photoperiod-sensitive development phases in quinoa (Chenopodium quinoa Willd.). Field Crops Res. 1999, 60, 231–243. [Google Scholar] [CrossRef]
  5. Hirich, A.; Choukr-Allah, R.; Jacobsen, S.-E.; El Yousfi, L.; El Omari, H. Using deficit irrigation with treated wastewater in the production of quinoa (Chenopodium quinoa Willd.) in Morocco. Rev. Cient. UDO Agríc. 2012, 12, 570–583. [Google Scholar]
  6. Hirich, A.; Choukr-Allah, R.; Jacobsen, S.-E.; Benlhabib, O. Could quinoa be an alternative crop of wheat in the Mediterranean region: Case of Morocco? Les Notes D’alerte Du CIHEAM 2012, 86, 1–8. [Google Scholar]
  7. Mujica, A.; Jacobsen, S.; Izquierdo, J.; Marathee, J. Agronomía del Cultivo de la Quinua. In Quinua (Chenopodium Quinoa Willd) Ancestral Cultivo Andino, Alimento del Presente y Futuro; Izquierdo, J., Ed.; Food and Agriculture Organization: Santiago, Chile, 2011. [Google Scholar]
  8. Hirich, A.; Choukr-Allah, R. Phenotyping the Combined Effect of Heat and Water Stress on Quinoa. In Emerging Research in Alternative Crops; Hirich, A., Choukr-Allah, R., Ragab, R., Eds.; Springer: Cham, Switzerland, 2020. [Google Scholar]
  9. Pando, L.G.; Castellanos, E.A. Guía de Cultivo de la Quinua; FAO y Univ.: Lima, Peru, 2016; p. 122. [Google Scholar]
  10. Rafik, S.; Chaoui, M.; Assabban, Y.; Jazi, S.; Choukr-Allah, R.; El Gharouss, M.; Hirich, A. Quinoa value chain, adoption, and market assessment in Morocco. Environ. Sci. Pollut. Res. Int. 2021, 28, 46692–46703. [Google Scholar] [CrossRef] [PubMed]
  11. Fox, P.; Rockström, J. Supplemental irrigation for dry-spell mitigation of rainfed agriculture in the Sahel. Agric. Water Manag. 2003, 61, 29–50. [Google Scholar] [CrossRef]
  12. Sezen, S.M.; Yazar, A.; Tekin, S.; Yildiz, M. Use of drainage water for irrigation of quinoa in a Mediterranean environment. In Proceedings of the 2nd World Irrigation Forum (WIF2), Chiang Mai, Thailand, 6–8 November 2016. [Google Scholar]
  13. Yang, A.; Akhtar, S.S.; Amjad, M.; Iqbal, S.; Jacobsen, S.-E. Growth and Physiological Responses of Quinoa to Drought and Temperature Stress. J. Agron. Crop Sci. 2016, 202, 445–453. [Google Scholar] [CrossRef]
  14. Geerts, S.; Raes, D.; Garcia, M.; Vacher, J.; Mamani, R.; Mendoza, J.; Huanca, R.; Morales, B.; Miranda, R.; Cusicanqui, J.; et al. Introducing deficit irrigation to stabilize yields of quinoa (Chenopodium quinoa Willd.). Eur. J. Agron. 2008, 28, 427–436. [Google Scholar] [CrossRef]
  15. Hirich, A.; Rafik, S.; Rahmani, M.; Fetouab, A.; Azaykou, F.; Filali, K.; Ahmadzai, H.; Jnaoui, Y.; Soulaimani, A.; Moussafir, M.; et al. Development of Quinoa Value Chain to Improve Food and Nutritional Security in Rural Communities in Rehamna, Morocco: Lessons Learned and Perspectives. Plants 2021, 10, 301. [Google Scholar] [CrossRef]
  16. Hirich, A.; Choukr-Allah, R.; Jacobsen, S.-E. Quinoa in Morocco—Effect of Sowing Dates on Development and Yield. J. Agron. Crop Sci. 2014, 200, 371–377. [Google Scholar] [CrossRef]
  17. Garcia, M.; Raes, D.; Jacobsen, S.-E. Evapotransporation analysis and irrigation requirements of quinoa (Chenopodium quinoa) in the Bolivian highlands. Agric. Water Manag. 2003, 60, 119–134. [Google Scholar] [CrossRef]
  18. Brouwer, C.; Prins, K.; Heibloem, M. Irrigation Water Management: Irrigation Scheduling; Training Manual No. 4; FAO: Rome, Italy, 1989; p. 43. [Google Scholar]
  19. Dao, A.; Alvar-Beltrán, J.; Gnanda, A.; Guira, A.; Nebie, L.; Sanou, J. Effect of different planting techniques and sowing density rates on the development of quinoa. Afr. J. Agric. Res. 2020, 16, 1325–1333. [Google Scholar]
  20. Abendroth, L.; Elmore, R.W.; Boyer, M.J.; Marlay, S.K. Corn Growth and Development; Iowa State University Extension and Outreach: Ames, IA, USA, 2011. [Google Scholar]
  21. Barutcular, C.; Yıldırım, M.; Koc, M.; Akıncı, C.; Toptaş, I.; Albayrak, O.; El Sabagh, A. Evaluation of SPAD chlorophyll in spring wheat genotypes under different environments. Fresenius Environ. Bull. 2016, 25, 1258–1266. [Google Scholar]
  22. Xie, S.; Luo, X. Effect of leaf position and age on anatomical structure, photosynthesis, stomatal conductance and transpiration of Asian pear. Bot. Bull. Acad. Sin. 2003, 44, 297–303. [Google Scholar]
  23. Jacobsen, S.; Bach, A. The influence of temperature on seed germination rate in quinoa (Chenopodium quinoa Willd.). Seed Sci. Technol. 1998, 26, 515–523. [Google Scholar]
  24. Casini, P. Seed Yield of Two New Quinoa (Chenopodium quinoa Willd.) Breeding Lines as Affected by Sowing Date in Central Italy. Acta Agric. Slov. 2019, 113, 51–62. [Google Scholar] [CrossRef] [Green Version]
  25. Sajjad, A.; Munir, H.; Anjum, S.A.; Tanveer, M.; Rehman, A. Growth and development of Chenopodium quinoa genotypes at different sowing dates. J. Agric. Res. 2014, 52, 535–546. [Google Scholar]
  26. Galwey, N.W. Exploited plants quinoa, grain amaranth. Crop yield: Physiology and processes. Agron. J. 1989, 85, 120–128. [Google Scholar]
  27. Pulvento, C.; Riccardi, M.; Lavini, A.; D’Andria, R.; Iafelice, G.; Marconi, E. Field Trial Evaluation of Two Chenopodium Quinoa Genotypes Grown Under Rain-Fed Conditions in a Typical Mediterranean Environment in South Italy: Quinoa in the Mediterranean. J. Agron. Crop Sci. 2010, 196, 407–411. [Google Scholar] [CrossRef]
  28. Casini, P. Possibilità di introdurre la Quinoa in ambienti mediterranei. Inf. Agrar. 2002, 27, 29–32. [Google Scholar]
  29. Jacobsen, S.-E. The Worldwide Potential for Quinoa (Chenopodium quinoa Willd.). Food Rev. Int. 2003, 19, 167–177. [Google Scholar] [CrossRef]
  30. Issa, A.O.; Fghire, R.; Anaya, F.; Benlhabib, O.; Wahbi, S. Physiological and Morphological Responses of two Quinoa Cultivars (Chenopodium quinoa Willd.) to Drought Stress. Gesunde Pflanz. 2019, 71, 123–133. [Google Scholar] [CrossRef]
Figure 1. Variation of temperature and rainfall during the growing season.
Sustainability 14 04010 g001
Figure 2. Variation of radiation and photoperiod during the growing season.
Sustainability 14 04010 g002
Figure 3. Variation of plant height during growing season. For each cultivar, means followed by the same capital letters are not significantly different at p ≤ 0.05. For each sowing date, means followed by the same small letters are not significantly different at p ≤ 0.05.
Sustainability 14 04010 g003
Figure 4. Variation of CCI during growing season. For each sowing date and cultivar combination, means followed by the same small letters are not significantly different at p ≤ 0.05.
Sustainability 14 04010 g004
Figure 5. Variation of stomatal conductance for different sowing date and DAS of the two varieties during the growing season. 1 For each date of measurement and each cultivar, means followed by the same capital letters are not significantly different at p ≤ 0.05. For each date of measurement and each sowing date, means followed by the same small letters are not significantly different at p ≤ 0.05. 2 For each sowing date and cultivar combination, means followed by the same small letters are not significantly different at p ≤ 0.05.
Sustainability 14 04010 g005aSustainability 14 04010 g005b
Figure 6. Evolution of total leaf area per plant during growing season. For each sowing date and cultivar combination, means followed by the same small letters are not significantly different at p ≤ 0.05.
Sustainability 14 04010 g006
Figure 7. Evolution of dry biomass of stems per plant during growing season. For each sowing date and cultivar combination, means followed by the same small letters are not significantly different at p ≤ 0.05.
Sustainability 14 04010 g007
Figure 8. Evolution of dry biomass of leaves per plant during growing season. For each sowing date and cultivar combination, means followed by the same small letters are not significantly different at p ≤ 0.05.
Sustainability 14 04010 g008
Figure 9. Evolution of dry biomass of panicles per plant during growing season. For each sowing date and cultivar combination, means followed by the same small letters are not significantly different at p ≤ 0.05.
Sustainability 14 04010 g009
Figure 10. Changes in the number of branches per plant during growing season. For each cultivar, means followed by the same capital letters are not significantly different at p ≤ 0.05. For each sowing date, means followed by the same small letters are not significantly different p ≤ 0.05.
Sustainability 14 04010 g010
Figure 11. Changes in the total number of leaves per plant during growing season. For each cultivar, means followed by the same capital letters are not significantly different at p ≤ 0.05. For each sowing date, means followed by the same small letters are not significantly different at p ≤ 0.05.
Sustainability 14 04010 g011
Figure 12. Changes in the total number of panicles per plant during growing season. For each sowing date and cultivar combination, means followed by the same small letters are not significantly different at p ≤ 0.05.
Sustainability 14 04010 g012
Table 1. Chemical characteristics of the soil under study.
Soil PropertiesContent (mg kg−1)
N-NH4 (SKALAR method)3.74
N-NO3 (SKALAR method)32.54
P2O5 (Olsen)32
Exchangeable K (Ammonium Acetate extr.)431
Exchangeable MgO (Ammonium Acetate extr.)742
Exchangeable CaO (Ammonium Acetate extr.)11,471
DTPA extractable Mn12.45
DTPA extractable Fe9.28
DTPA extractable Cu0.95
DTPA extractable Zn0.41
Table 2. Amount of water received during different development stages of each sowing date and cultivar.
Sowing DateCultivarsGrowing StagesRainfall (mm)Supplemental
Irrigation (mm)
Total Amount of Water per Stage (mm)Total Amount of Water for the Growing Cycle (mm)
NovemberICBA-Q5E 10.01414.0216.6
E-STL 216.42339.4
STL-PE 312.8315.8
PE-F 420.61030.6
F-M 526.890116.8
TiticacaE0.01414.0261
E-STL16.42339.4
STL-PE22.0325.0
PE-F11.6415.6
F-M69.098167.0
DecemberICBA-Q5E9.0716.0250.2
E-STL23.42245.4
STL-PE12.8012.8
PE-F14,4923.4
F-M48.6104152.6
TiticacaE9.0716.0249.2
E-STL23.42245.4
STL-PE26.8026.8
PE-F30.41444.4
F-M18.698116.6
JanuaryICBA-Q5E0.41313.4215.8
E-STL12.22234.2
STL-PE57.0562.0
PE-F4.23034.2
F-M2.07072.0
TiticacaE0.41313.4215.6
E-STL12.42436.4
STL-PE56.8359.8
PE-F6.21824.2
F-M2.08284.0
FebruaryICBA-Q5E14.41630.4209
E-STL42.2951.2
STL-PE4.804.8
PE-F1.64344.6
F-M2.07678.0
TiticacaE14.41630.4206
E-STL42.4951.4
STL-PE6.206.2
PE-F0.02323.0
F-M2.09395.0
MarchICBA-Q5E4.21822.2157.2
E-STL0.42323.4
STL-PE1.601.6
PE-F0.63535.6
F-M1.47374.4
TiticacaE4.21822.2153.8
E-STL2.02325.0
STL-PE0.400.4
PE-F1.61920.6
F-M0.68585.6
1 Emergence; 2 Six true leaves; 3 Panicle emergence; 4 Flowering; 5 Maturity.
Table 3. Chemical composition of foliar fertilizer.
Foliar Fertilizer CompositionPercentage (%)
B0.5
Cu EDTA0.6
Fe EDTA6
Mn EDTA2.5
Mo0.4
Zn1.2
Table 4. Rainfall and air temperature variation from September to August in Rehamna region (1981 to 2020).
MonthsSeptemberOctoberNovemberDecemberJanuaryFebruaryMarchAprilMayJuneJulyAugustTotal
RainAverage (mm)5.115.134.025.725.326.026.721.27.52.10.10.2189.0
CV 1 160.9116.494.3104.4102.096.483.6108.6204.5322.7365.2488.143.2
Prob 2 (p < 20 mm) 0.950.70.430.490.540.460.490.430.93111
TmAverage (°C)25.021.116.212.911.513.015.617.220.524.528.228.419.5
CV 5.67.98.710.210.013.38.58.48.37.25.55.62.8
TminAverage (°C)14.110.76.54.22.63.64.56.28.512.515.316.11.5
CV10.717.926.549.377.165.336.528.918.08.98.66.8122.5
Min (°C)10.25.43.0−0.9−3.4−2.31.42.85.19.711.513.6−3.4
TmaxAverage (°C)40.635.330.125.324.426.931.233.537.141.145.244.445.7
CV 5.76.77.78.88.89.07.37.09.77.43.94.62.8
Max (°C)44.439.834.830.029.230.136.637.643.646.547.547.147.5
Prob (T > 35 °C)10.55000050.250.70.9511
1 coefficient of variation; 2 Probability.
Table 5. Days from sowing to emergence; dicotyledonous leaves; two, four, and six true leaves; panicle emergence; flowering; and maturity, as affected by sowing dates and quinoa cultivars.
Days to Emergence 1Days to Dicotyledonous Leaves 1Days to Two True Leaves 1Days to Four True Leaves 2
ICBA-Q5TiticacaICBA-Q5TiticacaICBA-Q5TiticacaICBA-Q5Titicaca
November6 Ca6 Ca7.56 Ca7.38 Ca16.50 Ca16.44 Ca18.69 c18.69 c
December7 Ba7 Ba8.81 Ba9.31 Ba20.00 Ba19.94 Ba23.94 a23.63 a
January10 Aa10 Aa11.19 Ab11.75 Aa21.19 Ab22.31 Aa22.31 b23.56 a
February10 Aa10 Aa11.5 Aa11.69 Aa14.06 Da14.38 Da16.75e17.50 d
March6 Ca6 Ca7.13 Cb7.69 Ca10.13 Eb10.81 Ea12.44 g13.44 f
Days to six true leaves 2Days to panicle emergence 2Days to flowering 2Days to maturity
ICBA-Q5TiticacaICBA-Q5TiticacaICBA-Q5TiticacaICBA-Q5Titicaca
November21.44 d21.25 d50.63 e52.50 d72.63 c76.56 b101119
December32.19 a32.38 a61.00 b70.38 a71.31 d78.63 a112125
January25.25 c26.63 b52.00 d58.56 c68.44 e78.19 a103127
February19.75 e21.00 d40.69 h49.50 f54.75 h64.50 f98111
March15.25 g16.44 f34.06 i45.69 g47.56 i57.31 g83109
1 For each cultivar, means followed by the same capital letters are not significantly different at p ≤ 0.05. For each development stage and each sowing date, means followed by the same small letters are not significantly different at p ≤ 0.05. 2 For each combination of sowing date and cultivar, means followed by the same small letters are not significantly different at p ≤ 0.05.
Table 6. Yield components and panicle length of Titicaca and ICBA-Q5 for the different sowing dates, Ben Guerir, Morocco.
Grain Yield
(t h−1)
Straw Yield
(t h−1)
HI
(%)
1000 Seed Weight (g)Panicle Length
(cm)
ICBA-Q5TiticacaICBA-Q5TiticacaICBA-Q5TiticacaICBA-Q5TiticacaICBA-Q5Titicaca
November0.39 c0.15 d0.58 d1.76 b0.43 a0.08 d2.25 b1.6 e19.69 bc25.21 a
December0.84 a0.8 a2.19 a2.08 a0.29 b0.33 b2.44 a1.99 c26.22 a21.43 b
January0.74 a0.5 b1.59 b2.25 a0.35 b0.18 c2.36 ab1.76 d16.93 c17.95 c
February0.22 d0.18 d2.14 a2.22 a0.11 d0.08 d1.69 de1.4 f12.79 d10.75 d
March0.08 d0.09 d0.96 c0.77 cd0.09 d0.13 cd1.28 f1.04 g12.3 d13.54 d
For each sowing date and cultivar combination, means followed by the same small letters are not significantly different at p ≤ 0.05.
Publisher’s Note: MDPI stays neutral with regard to jurisdictional claims in published maps and institutional affiliations.

