Abstract
This study employs the two-stage dynamic data envelopment analysis model to examine sustainability and corporate performances of the 29 largest multinational enterprises in the transport manufacturing industry from 2015 to 2019. The results show that, on average, sustainability has a positive relation to corporate performance and sustainability performance is better than corporate performance for all multinational enterprises (MNEs). In addition, we also found that corporate social responsibility (CSR) acts as a moderator in the relationship between sustainability and corporate performances. Overall, the American group leads the others in sustainability performance, followed by Asia and Europe. On the other hand, Europe has the highest score in terms of corporate performance. In terms of size, the results show that it is positively related to corporate performance. In contrast, leverage has a negative relationship with corporate performance. The findings of this research can assist inefficient MNEs in identifying areas for advancement by learning from their peers and provide perspective and insights into the plans for MNEs’ strategies and decisions in the future.
1. Introduction
In the past decades, the expansion of motorization in emerging economies has reached a tipping point because of the increased transport volumes [1]. The transportation sector plays a critical role in the growing economy because it connects manufacturing, interchange, and consuming goods. However, while expanding transportation services will enhance the economy and people’s living standards, it has certain negative societal and environmental effects, including increased resources consumption, contamination, and natural damage resulting from automobiles and transportation facilities [2]. According to the International Energy Agency, transportation accounted for around 29 percent of the global energy demand and 65 percent of overall liquid fuel usage in 2016. In addition, the global transportation industry is the second-largest emitter of greenhouse gases as it accounted for 22 percent of the world’s carbon dioxide emissions [3,4].
In recent years, the rise in societal demand for sustainability has prompted a focus on sustainable manufacturing [5]. The reasons could be because of the growing knowledge of the environmental impact of manufacturing and a desire to preserve the planet [6,7]. Despite being a desirable goal for most, executives confront obstacles in implementing sustainable manufacturing because of the need to equalize the environmental, social, and economic implications of various manufacturing choices and methods. This view is especially true in companies that cater to consumers, such as the transportation manufacturing industry [5]. Sustainability has been studied in the transport manufacturing industry and is considered to be a set of interrelated concerns for the environmental, social, and economic aspects of the product life cycle [8]. However, numerous managers focus only on the economic component, ignoring the environmental and social components [9]. Other manufacturers, such as those that make all-electric vehicles, may place high importance on the environmental aspects of the product life cycle in particular [10].
Previous academics and researchers have used several measures to assess the relationship between sustainability and corporate performance, but findings have failed to reach a consensus [11]. Most sustainability frameworks in the transport manufacturing industry are qualitative, fail to view the three pillars of the triple bottom line holistically [12], and give an inconsistent and contradictory demonstration of the association of sustainability and corporate performances. Hence, to enhance the comprehension of the interdependence of sustainability and corporate performances, we specifically employ a two-stage network dynamic DEA and use 145 firm-year observations from 29 multinational enterprises (MNEs) in transport manufacturing from 2015 to 2019.
Data envelopment analysis (DEA) is a non-parametric method for measuring relative performance of a set of decision-making units (DMUs) that use multiple inputs to produce multiple outputs [13]. In this paper, we evolve the model in the slacks-based measure (SBM) framework, namely dynamic slacks-based measure (DSBM). The SBM is known to be non-radial and non-oriented concerning input and output slacks directly [14], allowing us to acquire non-uniform input or output component efficiencies, as opposed to the radical procedures that assume corresponding modifications in inputs/outputs and offer only one common uniform input/output element performance. The DEA is used in studies not just to examine static performance over a separate period, but also to assess the performance over many terms using cross-period techniques. On the other hand, the DEA approach such as window analysis or Malmquist productivity index ignores the consequence of carry-overs on variation in performance. Although these models consider the influence of time on performance, their goal is to find a separate partially optimal explanation for distinct periods. The dynamic network DEA method applied in this paper has the potential to overcome the aforesaid issue in assessing corporate performance from a resource-based standpoint. In particular, this research applies the dynamic network slacks-based model (DNSBM) to measure corporate performance over longer periods.
Moreover, numerous studies have been more concerned with how enterprises support or hinder societal wellbeing. In other words, corporate social responsibility actions have progressively attracted investors and scholars [15]. Environmental, social, and governance (ESG) or corporate social responsibility (CSR) are terms used often in this paper to address CSR operations. This research also assesses the moderating role of CSR in the relationship between sustainability performance and corporate performance by employing the EGS score. Our hypotheses are generally supported by the findings.
2. Literature Review and Hypothesis Development
2.1. Sustainability Performance and Corporate Performance
Sustainability plays a crucial role as a business and investment strategy that aims to employ the foremost enterprise’s operations to encounter and satisfy the requirements of present and future investors. In this study, we will examine the sustainability performance of 29 enterprises in transport manufacturing from 2015 to 2019. Although previous studies have no universally accepted description for transport sustainability, a consensus has been reached that sustainable transportation encompasses the “Triple Bottom Line” approach, integrating economic development, environment preservation, and social issues in operations [16]. To put it another way, sustainable transportation entails more than just transportation performance and economic development; it also includes resource management and environmental protection. The primary premise for achieving sustainable transportation is to improve transportation sustainability performance. As a result, evaluating and examining the performance of transport sustainability is essential for the successful enhancement of the transportation system’s long-term development [17].
To date, many scholars, policymakers, and stakeholders have included a corporate performance in their studies; however, no standard definition of corporate performance exists, making it a difficult concept to grasp. The absence of agreement may be because corporate performance is linked to a multitude of aspects of a company’s overall wellbeing, from financial performance to output levels and market returns achievement [18]. In this case, corporate performance might be defined as an enterprise’s potential to use its resources reasonably and implement activities more effectively and efficiently than its competitors. Corporate performance is concerned with measuring stakeholders’ satisfaction by evaluating data concerning the actions and records of the company on the management of particular stakeholders’ issues and the level of responsibility that the company has assumed [19]. Although wide debate suggests that no concise definition has been settled on for corporate performance, it can be used as the basis to explain the management of a corporate’s relationships with its stakeholders by incorporating concepts such as corporate social responsibilities and responsiveness. Studies have used either a market-based approach or accounting-based indicators to assess organizational success. Return on asset (ROA), return on equity (ROE), Tobin’s Q, profit margin, sales growth, cash flow, and stock prices are some of the most utilized indicators [20].
Extensive research has provided inconsistent and contradictory evidence for the association of sustainability performance and corporate performance. However, an increasing number of studies have found that an enterprise’s CSR investment has a beneficial effect on its stock price [21]. Because of the aforesaid findings, we developed the following hypothesis:
Hypothesis 1 (H1).
Sustainability performance will positively relate to corporate performance.
2.2. Corporate Social Responsibility
Past studies have examined CSR and researchers have offered numerous definitions of CSR. This paper uses the commonly perceived description of CSR as an enterprise’s voluntarily assessment of stakeholder issues inside and outside its operation activity [22]. This definition underlines the need to maximize stakeholder welfare in addition to maximizing economic profit [23]. Nevertheless, CSR is a multifaceted concept that encompasses a variety of business movements aimed at meeting the needs of different investors [24]. In recent years, CSR activities have increasingly attracted the attention of corporates and academics. An increasing number of companies have considered CSR as a corporate component and management philosophy to embrace. More than 8000 companies from over 160 countries have spent greater than four trillion dollars to implement CSR operations (Social Investment Forum, 2014). The percentage of Standard & Poor’s 500 enterprises that have submitted CSR information has risen from roughly 20 percent in 2011 to greater than 70 percent in 2013 [25]. The motivations of CSR have shifted from ethical to strategic, and the focus of analysis has evolved from the benefit to society to the benefit to the firm. Previous studies have shown that money cannot serve a purpose to become prosperity, as it violates ethical practices and against the rules of nature [26,27]. The CSR strategies of an enterprise are inextricably linked to its long-term growth plans. From this view, a company’s CSR aims to promote long-term profit, while also developing a constructive association with the community and meeting investors’ expectations, thereby allowing enterprises to survive [28].
2.3. Corporate Social Responsibility as Moderator
Although the concept of CSR is relatively new, numerous studies have examined the association between CSR and enterprise worth or operations [29]. In today’s business world, a growing number of investors consider embracing the financial outcomes and ESG issues in their investment decisions rather than just focusing on financial outcomes [30]. This research employs the concept of ESG developed by the United Nations Principles of Responsible Investment (PRI) in 2006 [31]. Throughout the research, we used the abbreviations ESG and CSR interchangeably [32]. To investigate the moderating role of CSR in the relationship of sustainability and corporate performance, we use three elements—environmental, social, and corporate governance (ESG) score.
The environmental performance of an enterprise reflects its efforts to minimize resource utilization and emissions. Climate change and energy crises have had a substantial influence on organizational performance because of environmental sustainability. Enterprises must know how to adapt and manage in areas such as worker behavior, operations, building utilization, and transportation when energy prices grow [33]. Hence, we developed the second hypothesis regarding environmental pillar score as follows:
Hypothesis 2 (H2).
The lower the environmental pillar score, the greater the relationship will be between sustainability performance and corporate performance.
Social performance is another important aspect of CSR because it indicates respect, the quality of labor, civil rights, social relations, and the role of the product. Universally, a trend growing among investors is contemplation of the social issues of the companies they invest in. However, the social costs of automobile accidents remain considerable, despite significant investments in traffic safety programs and technologies [34]. Hence, this study proposes the third hypothesis:
Hypothesis 3 (H3).
The lower the social pillar score, the greater the relationship will be between the sustainability performance and corporate performance.
Investors have special consideration for environmental and social issues and are also concerned about governance issues [35]. Investors who engage in stocks for the long-term goal consider more about ESG investment than those who buy to earn a regular income [36]. A corporate governance performance of an enterprise indicates the authority and responsibilities of the management of a company. In the area of sustainability, transportation development has been observed to be an important governance tool [37], and hence the fourth hypothesis was developed:
Hypothesis 4 (H4).
The lower the governance pillar score, the greater the relationship will be between sustainability performance and corporate performance.
3. Research Method
3.1. Research Framework
Embracing a sustainable transportation system is considered a difficult task without having an adequate framework. In general, a sustainable transport system must offer all inhabitants mobility and accessibility while also being friendly to the surroundings. In other words, the transportation system serves an important social purpose, and should be designed responsibly to preserve the Earth [38]. In this paper, twenty-nine MNEs in the transport manufacturing industry require a framework to examine the interconnection between sustainability and corporate performance and, examine how CSR moderates this association by employing the ESG score. According to the aforesaid literature, we assumed that sustainability performance positively associates with corporate performance. We also proposed that if the environmental pillar score, social pillar score, and governance pillar score are high or low, the association of sustainability and corporate performance will be significantly affected.
3.2. Measurements of Sustainability Performance and Corporate Performance
We collected the data from the Thomson Reuters Eikon database to measure the sustainability and corporate performance of 29 enterprises in the transport manufacturing industry from 2015 to 2019. During the sample period, the list included 48 MNEs in the transport manufacturing industry; however, we eliminated 19 enterprises because of the lack of annual reports and insufficient data. Hence, the final list includes 145 firm-year observations. We employed a two-stage dynamic DEA model [39] that includes sustainability performance (stage 1) and corporate performance (stage 2) with a set of desirable output and undesirable outputs to examine 29 enterprises in the transport manufacturing industry adequately. This measure yields a score between 0 and 1 for efficiency. We also extended the model by using total assets as a carry-over variable as indicated in Table 1.

Table 1.
Summary of factors used in past studies.
In each stage, the variables are selected based on previous research. To measure the sustainability performance, each company uses three inputs: (1) employees, (2) operating expenses, (3) energy use, and one output, CO2 emissions, to evaluate its sustainability performance. In terms of the measurement of corporate performance, we use sales as the input of this stage and two outputs, market value, and net income, to examine the second stage.
3.3. Measurements of Corporate Social Responsibility
This study collected the ESG scores from the Thomson Reuters Eikon database to measure CSR performance [48]. The Thomson Reuters ESG scores are computed automatically and truly implement a logic that defines the importance of each category. Each category includes various measurements. The number of measurements per level defines the importance of the related level. Numbers and weights are fully presented in the following Table 2 and Table 3:
Table 2.
Measurement indicators of CSR.
Table 3.
Definitions of the categories of CSR.
This study assesses the functioning of three ESG elements independently to distinguish between them. Firstly, the environmental pillar score reflects the company’s engagement toward and effectiveness in decreasing emissions, entire waste, and energy demand. Secondly, the social pillar score estimates the enterprise’s good citizenship practices, including superior quality commodities and services that consider customer satisfaction, secrecy, and security, and foster employment gratification, work environment variance, and equal opportunity, among other. Finally, the governance pillar score determines the enterprise’s commitment to good company governance procedures, including equality of treatment of shareholders and clarity in decision-making proceedings [49].
3.4. Technical Specification: The DNSBM Model
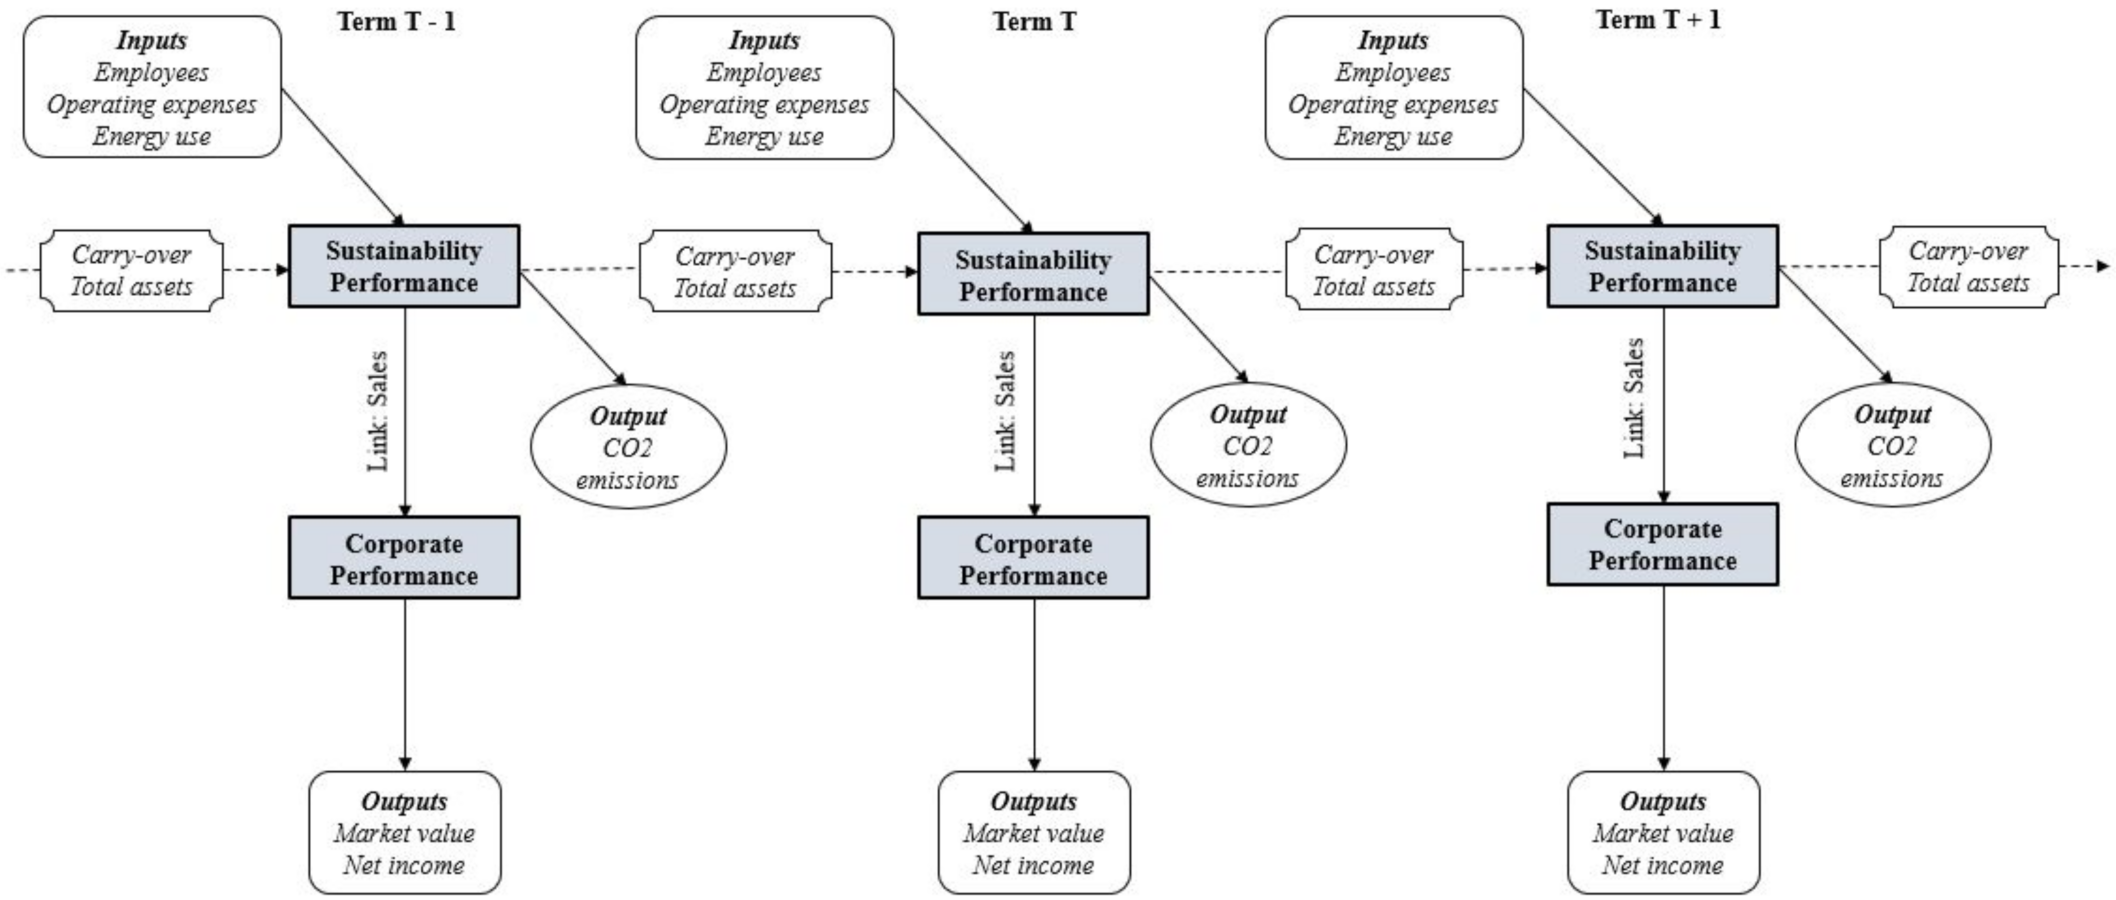
Figure 1 shows how we divide the performance of enterprises into sustainability and corporate performances. We examine the main resources that contribute to performance and evaluate the mechanism of the inner network production structure of enterprises. Studies not only use the data envelopment analysis (DEA) to analyze static performance over a single period but also use cross-period methods to evaluate performance over multiple periods. There are numerous addresses for assessing performance changes over time in DEA, such as the window analysis or Malmquist index. Nevertheless, they often ignore carry-over activities between two successive periods and only focus on the distinct period separately with the aim of local optimization in a single period, even if these models can account for the effect of change in time. The dynamic network DEA method employed in the present study can overcome the aforementioned problem in evaluating company performance from the resource-based perspective. In particular, this study uses the DNSBM model [50] to investigate enterprise performance over long-term periods.
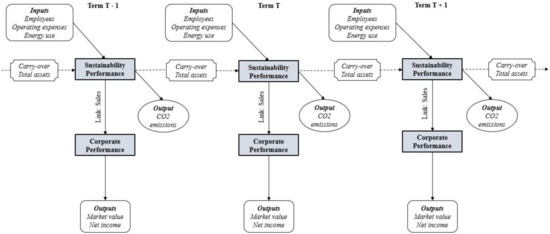
Figure 1.
Two-stage dynamic production process of MNEs in the transport manufacturing industry.
SBM is a non-radial performance measurement approach that adheres to the “unit invariant” assumption and can examine the performance value by incorporating distinct variables from over-input and under-output. When the input and output cannot be adjusted by their ratios, SBM is a more suitable method. Performance is measured using three categories of orientation: input-oriented performance, output-oriented performance, and non-oriented performance. The non-oriented performance of businesses is measured in this study by including input and output slacks at the same time.
Regarding the formulation of the dynamic network DEA method, consider the dynamic network production processes presented in Figure 1 that deal with n DMUs consisting of divisions over T terms (). At each term, DMUs have common inputs () consisting of divisions and outputs consisting of divisions. Let and denote the observed input and output values of DMU consisting of divisions at term t, respectively. Let denote the observed external input value of DMU consisting of divisions at term . is the number of external input items of divisions at term t. () links the intermediate products of DMU from division to division in the period , where is the number of items in links from to (e.g., deposits and investments). is the carry-over of the firm at division from period to period , where is the number of items in the free carry-over from division (e.g., premises and capital). To identify them by term (t), DMU, divisions , and item , this study employs, for instance, the notion for denoting undesirable variables, where is the number of undesirable variables (e.g., CO2). These are all observed values up to term T. Using these expressions for production, this study expresses .
Let denote the overall performance during term T, denote input excess, denote undesirable input excess, denote external input excess, denote output shortfall, and and denote the slacks and free in sign. This objective function is an extension of the non-oriented SBM model [39] and deals with excesses in both input resources, outputs, and undesirable links. The numerator is the average input efficiency, and the denominator is the inverse of the average output performance. This study defines the non-oriented overall performance as a ratio, ranging between 0 and 1 and becomes 1 when all slacks are zero. This objective function value is also units-invariant.
Subject to:
is the weight to period and is the weight to division . This study adopts equal weight. Equations (2), (3), (9) and (10) are the input, output, undesirable output, and external input constraints, respectively. Equation (4) suggests the assumption of VRS, and (5) and (6) suggest that the linking activities are freely determined while maintaining continuity between inputs and outputs. This case can serve to determine whether the current link flow is appropriate in the light of other DMUs, i.e., the link flow may increase or decrease in the optimal solution of the linear programs. The deviation from the current value is not reflected directly in the performance evaluation, but the continuity condition between the two stages explained below exerts an indirect effect on the performance score.
Equations (7) and (8) indicate that the current link flow corresponds to carry-overs that the DMUs can handle freely, which corresponds to the carry-over that DMU can handle freely. Its value can be increased or decreased from the observed one. The deviation from the current value is not reflected directly in the performance evaluation, but the continuity condition between the two periods explained below exerts an indirect effect on the performance score. Its value can be increased or decreased from the observed one. Equations (2)–(10) designate the production possibility set for the objective . Accounting for (2)–(10) in an optimum solution of (1):
If the optimal solution for (1) satisfies , the target is called non-oriented overall efficient. In (13), if all optimal solutions of satisfying , is called non-oriented term efficient for term T, which implies that the optimal slacks for the term in (13) are all zero.
Division performance () is defined by
Finally, term-divisional performance () is defined by
In Equation (15), if all optimal solutions satisfy , the target is called non-oriented term efficient with the divisions at the term T, which implies that the optimal slacks with the divisions at term in (15) are all zero.
3.5. Research Object
The purpose of this research is to analyze the link between sustainability and corporate performance of 29 MNEs in the transport manufacturing industry during the period 2015–2019 and the moderating effect of CSR on this association. In this paper, dynamic DEA, appertaining to a set of 29 MNEs as the research object, calculates the comprehensive performance to provide improvement direction for these enterprises, simplifying the algorithm and reducing error. Hence, companies can learn from their peers and foster their prospective insights for further agenda strategies and decisions.
4. Empirical Results
4.1. Analysis of Corporate Social Responsibility by Region
The intended level of CSR practice needed for each enterprise may fluctuate depending on the change of the company and economic conditions [51]. As a result, it is critical to see if the CSR—estimation link differs across specific types of company groups or industries. Table 4 shows the correlations between ESG scores.
Table 4.
Correlation analysis of ESG scores.
In this study, we considered the CSR—valuation relationship in different regional groups. Therefore, we grouped 29 enterprises into three regions, namely, Europe, Asia, and America. Table 5 shows that the list comprises 12 companies in the Europe group, 12 enterprises from the Asia group, and five American enterprises in the final group. Table 5 also shows the estimation outcomes on the important value of CSR practice of 29 MNEs in transport manufacturing. Overall, Europe leads the other two groups with its environmental pillar score (EPS), social pillar score (SPS), and governance pillar score (GPS), which are 81.70, 81.90, and 71.92, respectively. In terms of environmental pillar score and governance score, Asia has a higher score than America because the Asia group scores 76.54 in environmental pillar score and 60.83 in governance pillar score. In addition, America has the lowest score in terms of environmental and governance pillar score because its scores are 69.60 and 53.59, respectively. The social pillar score of America, in contrast, is greater than Asia because its score reached 72.84 but the score of the Asia group is only 57.90. In particular, the results of the Kruskal–Wallis test demonstrate that the overall ESG scores, and the scores of the three components, varied among the three regions. The discoveries of this study suggest that the differences in corporate social responsibility outcomes across the regions may affect the sustainable growth of these three regions in particular and the whole world in general.
Table 5.
ESG Score in terms of regions.
4.2. Analysis of Sustainability and Corporate Efficiencies
We utilized the sample of 29 MNEs in the transport manufacturing industry for a period of five years (2015–2019) by the approach stated in the foregoing subsection. Table 6 and Table 7 show the descriptive statistics and correlation matrix for the variables used in this study respectively.
Table 6.
Descriptive statistic of independent and dependent variables.
Table 7.
Correlation analysis.
Table 7 shows the summary statistics that reveal interesting findings by the behavior of the variables. The inputs and outputs employed in this paper are significant and positively relate, as demonstrated by the correlation matrix as shown in Table 7. In other words, when we raise a proportion of inputs, the proportion of outputs will also grow, thereby suggesting the presence of isotonicity for the alternatives of input, carry-over, link, and output variables in the research. However, our attention is drawn to energy use (stage 1), which relatively has a negative correlation with the outputs (stage 2), market value, and net income. We avoided examining all score variables promptly in our assessment to prevent any multicollinearity obstacles in the estimations.
Considering the quick transformations that have occurred in the transport manufacturing industry, where long-run strategy and investment are a general event, we developed the dynamic production process to assess the long-term operation of automobile MNEs. Previously, performance results were derived by applying the traditional DEA model, namely the Malmquist index [52] and Window analysis [53], and ignored the carry-over operations between two continuous periods. The construct of carry-over, whose value conveys or persists from one stage of action to the next, was the first to formally deal with inter-period activities [54]. In other words, carry-over makes a crucial contribution in assessing the performance of DMUs in each term, as well as the entire term based on a long-term perspective. Thereafter, other studies have examined the performance in inter-connecting operations in a range of industries practicing dynamic DEA performance analysis. In this study, we employed the dynamic DEA model to examine the long-term sustainability performance and corporate performance of enterprises in the transport manufacturing industry. Table 8 summarizes the sustainability and corporate performance of 29 MNEs in transport manufacturing from 2015 to 2019.
Table 8.
Performance scores of DSBM model.
In Table 8, the efficiencies are shown for each enterprise in the two-stage model. The average performance of each stage, namely, sustainability performance (stage 1) and corporate performance (stage 2), and their overall efficiencies of the three regions, are also reported. Among all the companies, Volkswagen AG from Europe, and Oshkosh from America are efficient in both stages.
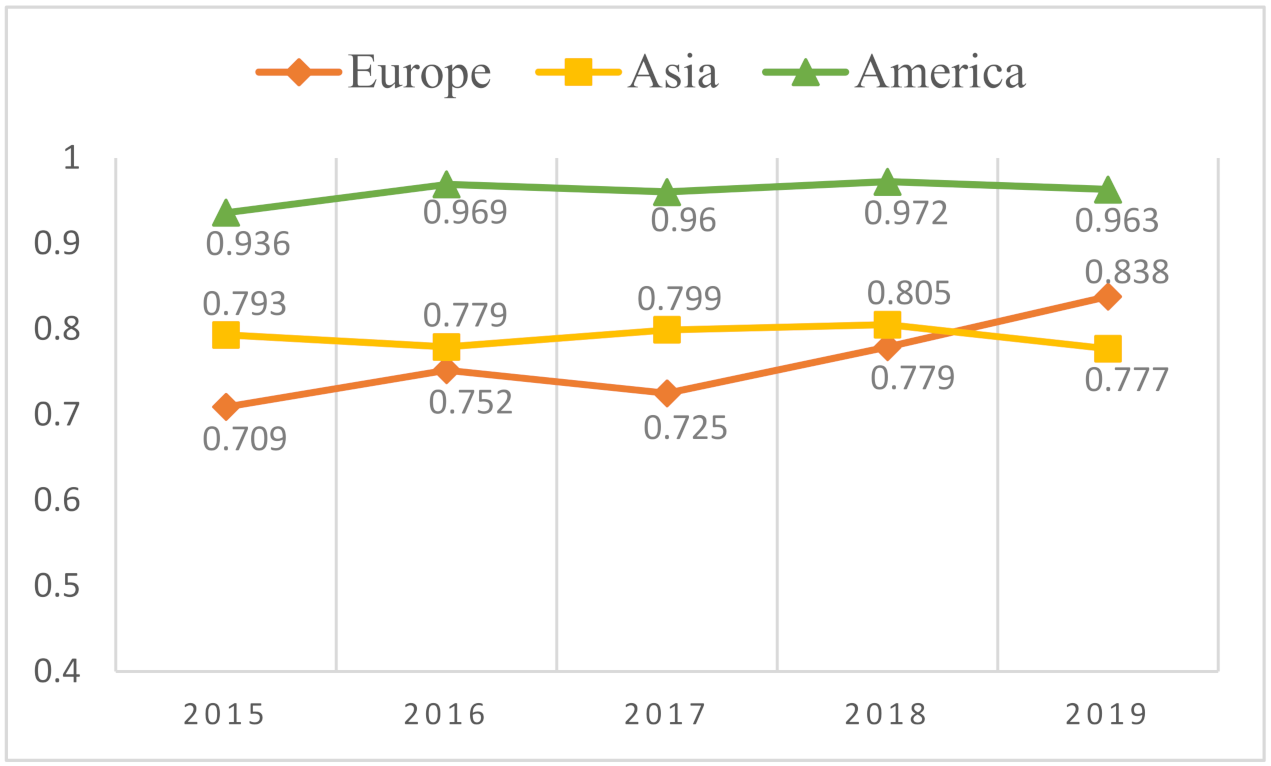
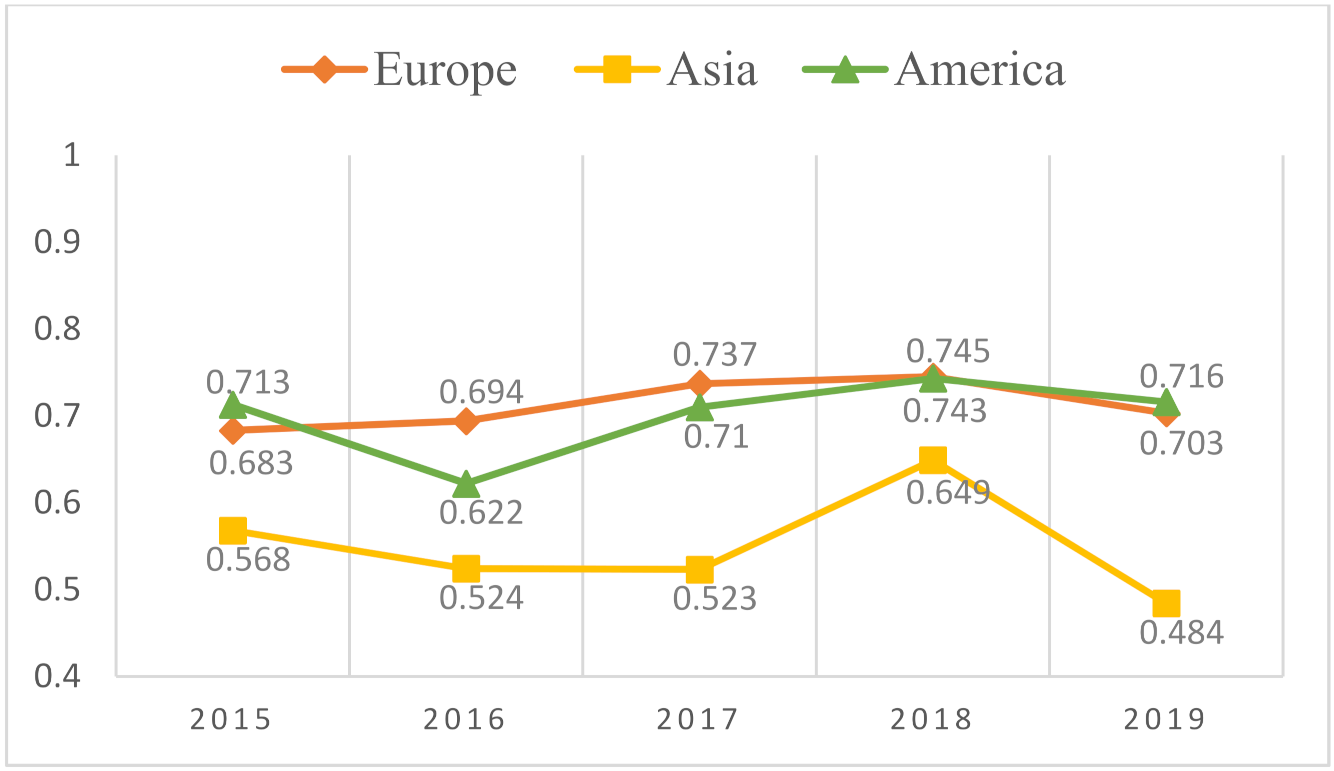
Figure 2 and Figure 3 present the sustainability performance and corporate performance of MNEs in three regions: Europe, Asia, and America during the period 2015–2019. Regarding Figure 2 and Figure 3, we find that the sustainability efficiencies of enterprises in Europe were gradually increasing from 2015 to 2019. The average efficiency score of the sustainability performance of the Europe group was 0.709 in 2015, then gradually increased to 0.752 in 2016. However, it showed that the performance decreased slightly to 0.725 in 2017 and then increased significantly to 0.779 and 0.838 in the last two years, respectively. On the same trend, the corporate performance of the companies in this region increased from 0.683 to 0.745 during the period from 2015 to 2018, then decreased slightly to 0.703 in 2019. In terms of Asian enterprises, the sustainability performance fluctuated between 2015 to 2019. It was 0.793 in 2015, then dropped slightly to 0.779 in 2016. We found that the performance score increased to 0.805 in the following two years but fell by 0.777 in 2019. Meanwhile, the corporate performance of the Asian group was 0.568 in 2015, then decreased significantly to 0.523 in 2017. Although the corporate performance increased in 2018 it fell again in 2019 with a score of 0.484. In America, we can see that the sustainability performance score of this region is more stable, although a small change could be observed over the period of five years. The highest score of this region in terms of sustainability was 0.972 in 2018 and the lowest score is 0.960 in 2017. In terms of corporate performance, the American group had lowest efficiencies in 2016 and 2017 with scores of 0.622 and 0.710 respectively while the scores in 2015, 2018, and 2019 were considered high at 0.713, 0.743, and 0.716, respectively.
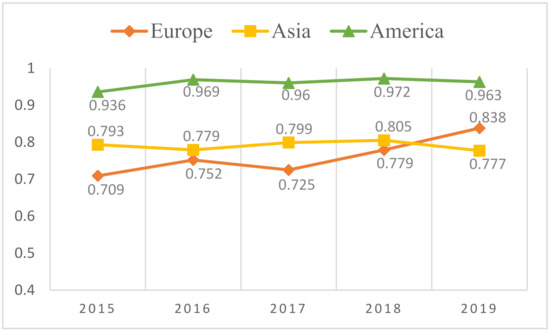
Figure 2.
The sustainability performance of MNEs in three regions from 2015 to 2019.
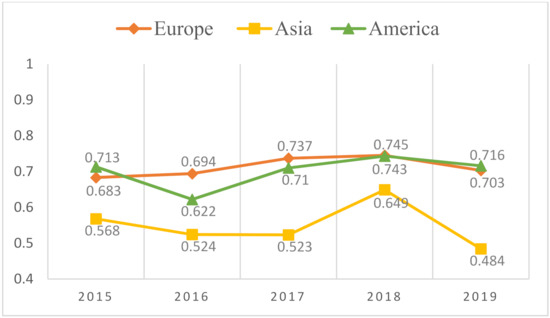
Figure 3.
The corporate performance of MNEs in three regions from 2015 to 2019.
Overall, the American group led the others in sustainability performance with a score of 0.960, followed by Asia and Europe at 0.791 and 0.761 respectively. Meanwhile, Europe had the highest score in terms of corporate performance with its score of 0.713 while America had a score of 0.701 and Asia had a score of 0.550. In particular, the Kruskal-Wallis test results illustrate that overall SP score and CP score varied among Europe, Asia, and America. The findings of this study show that the K-W test of enterprises in every single year was not significant, but the overall results were significant when we combined the data of enterprises in three regions from 2015 to 2019 simultaneously (p < 0.01).
4.3. Prediction Analysis of Moderating Effects
We employed two control variables in our regression models, namely size and leverage. Firm size and leverage play an imperative role in assessing sustainability and corporate performance. In terms of size, big enterprises are more visible politically, attracting more concerns from the public, government, and other stakeholders. An increase in firm size may lead to high corporate performance because of the economies of scale. Big enterprises are more likely to have an advantage from economies of scale in their sustainability efforts. Hence, the scale of a corporation is linked strongly and continuously with high levels of corporate sustainability [55]. The natural logarithm of an enterprise’s total assets has been used as a proxy for size.
In terms of leverage, the amount to which the company relies on debt funding determines the influence of creditors as a stakeholder [56]. The more debt funding a corporation uses, the more likely it is to address debtholders’ interests above those of less powerful stakeholders. The emphasis placed on the claims of a company’s debtholders over those of less powerful stakeholders will increase as its leverage increases. Firms are vulnerable to financial burden, and firms with a high financial burden are more likely to lose market share and experience a negative effect on profitability exists. To control for financial risk, leverage is calculated by total debt divided by total assets [57]. The relative variables are illustrated in the following Table 9:
Table 9.
Dependent and independent variables.
Table 10 shows that we added two control variables, namely, size and leverage, into the regression. In terms of the size, the result shows it is positively associated with corporate performance (β = 0.472, p < 0.01). In contrast, leverage has negative connection with the corporate performance (β = −0.359, p < 0.01).
Table 10.
Prediction analysis of the moderating effect.
To examine the hypotheses, a series of hierarchical regression analyses are shown in Table 10 to investigate whether the environmental pillar score, social pillar score, and governance pillar score moderate the relationship between sustainability and corporate performances. In Model 1, we included two control variables, size and leverage, into the regression. As a result, size and leverage were significantly related to corporate (β = 0.472 and −0.359, respectively, p < 0.01).
In Model 2, sustainability performance (SP) was entered into the regression as the explanatory variable. Table 10 demonstrated that the variable explained a significant amount of variability in corporate performance beyond that of the control variables (ΔR2 = 0.092, p < 0.01). The standardized regression weight was significant for sustainability (β = 0.322, p < 0.01). Therefore, Hypothesis 1 was supported.
In Model 3, we added three moderating variables into the regression, including environmental pillar score (EPS), social pillar score (SPS), and governance pillar score (GPS). As illustrated in Table 10, the three variables explained a marginally significant amount of variability in corporate performance beyond that of the control and independent variable (ΔR2 = 0.061, p < 0.01). The standardized regression weight was significant only for the social pillar score (β = 0.278, p < 0.01), confirming Hypothesis 3.
In Model 4, the three potential two-way interaction terms pertaining to the environmental pillar score (i.e., SP × EPS), social pillar score (i.e., SP × SPS), and governance pillar score (i.e., SP × GPS) were added to the predictors, resulting in a moderated regression. The interaction terms accounted for a considerable percentage of distinctive variability in corporate performance (ΔR2 = 0.037, p < 0.01).
Table 10 shows that the SP × EPS was not substantially associated with corporate performance (β = −0.115, p > 0.10), thereby disconfirming Hypothesis 2.
SP and GPS have a significant two-way interaction (β = −884, p < 0.10). The shape of this SP × GPS interaction was investigated in Figure 4. As to the governance pillar score, Figure 4 indicates that when the governance pillar score was relatively low, sustainability performance was positively related to corporate performance. Similarly, when the governance pillar score was relatively high, sustainable performance was also positively related to corporate performance. The finding shows that corporate governance affects the relationship between sustainability and corporate performance. Therefore, the results show that Hypothesis 4 was supported.
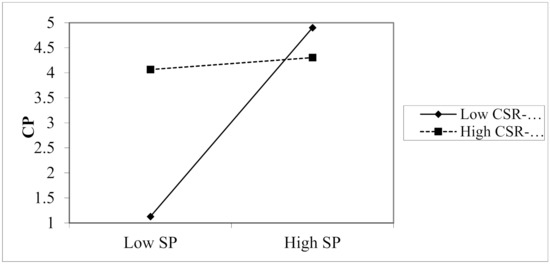
Figure 4.
Moderating effect of governance pillar score on the association of sustainability and corporate performance.
5. Discussion
Implementing sustainable practices for transport industries is a topic that has driven constant debates between stakeholders for many years. In terms of the transport manufacturing industry, it has become increasingly important in the global economy because it can influence the global economy development and international politics. Numerous researchers have investigated the relationship between sustainability and corporate performances; however, findings have been inconsistent and contradictory. Consequently, this paper aims to establish a two-stage DEA to measure performance and evaluate the benchmarks, to investigate whether sustainability performance influences corporate performance, and the moderator role of CSR in this association. Moreover, the results of this study can provide the holistic insights into resource allocation and competitive advantage, and help MNEs to improve strategic decision-making, especially regarding operational styles, under fierce competition in the transport manufacturing industry. In this study, we employ the two-stage network DEA to examine 29 MNEs in the transport manufacturing industry from 2015 to 2019. Over a five-year period (2015–2019), the American group leads the others in terms of sustainability performance, followed by Asia and Europe. On the other hand, Europe has the highest score in terms of corporate performance. The findings also show that sustainability has a positive relation to corporate performance and sustainability performance is better than corporate performance on average for all MNEs. From this view, we recognize that corporations finance sustainable business activities because the benefits of adoption are long run. We can suppose that companies would incur significant expenses in the short term for investments, but the long-term advantages will outweigh any short-term expenses. Additionally, we expanded the research by investigating CSR as a moderator in the relationship between sustainability and corporate performances. As a result, Hypothesis 3 and Hypothesis 4 were supported. In terms of size, the result shows it is positively related to corporate performance. In other words, large firms have enough financial and human resources for sustainability practices and can afford to procure and implement environmental systems and this in turn positively improves their corporate performance outcomes. In contrast, leverage has a negative relationship with corporate performance. Financial loan can reduce financial performance, especially during the economic downturn, and it could be offset by the improvement of corporate governance quality. Accordingly, corporations should begin adopting sustainable practices into their management processes and reporting on them to prevent credibility costs and achieve a long-run competitive advantage.
6. Conclusions
This research can be summarized as follows. First, we examine the efficiency of 29 MNEs in the transport manufacturing industry to evaluate the benchmarks, and to assess the relationship of sustainability and corporate performances. This suggests that managers should focus first on improving inefficient allocation of resources in production. We mark variables that are continuously held from one term to another as carry-over variables. These variables provide enterprises with new perceptions of the two-stage network DEA model because they consider dynamic elements critical to the survival and growth of MNEs. We prove the appropriateness of the expected model by examining 29 MNEs in the transport manufacturing industry during the period 2015–2019. Second, this paper proposed this model to answer the question of whether the performance of sustainability influences the performance of a corporation, and how CSR moderates this association. The empirical results show that sustainability positively relates to corporate performance. Third, we also added CSR as a moderator to analyze its effect on the relationship between sustainability and corporate performances. In the transport manufacturing industry, the potential to confront high-risk environments and use resources dexterously is vital for enterprises’ success. The results show that corporate governance will significantly affect the relationship between sustainability performance and corporate performance. In other words, our study can provide guidelines for dealing with corporate governance issues in the transport manufacturing industry. Although we have employed a variety of variables, we acknowledge that the study could be imperfect. For future studies, authors may consider the possibility of constructing different variables or conducting a systematic review to present the analysis of the relationship between sustainability and corporate performances, as well as providing a more concise result.
Author Contributions
Conceptualization, K.-C.K.; Formal analysis, K.-C.K. and T.-T.L.; methodology, W.-M.L.; data curation, H.-Y.Y. All authors have read and agreed to the published version of the manuscript.
Funding
This research received no external funding.
Institutional Review Board Statement
Not applicable.
Informed Consent Statement
Not applicable.
Data Availability Statement
Data are contained within the article.
Conflicts of Interest
The authors declare no conflict of interest.
References
- Liu, H.; Yang, R.; Wu, D.; Zhou, Z. Green productivity growth and competition analysis of road transportation at the provincial level employing Global Malmquist-Luenberger Index approach. J. Clean. Prod. 2021, 279, 123677. [Google Scholar] [CrossRef]
- Wang, G.; Bai, S.; Ogden, J.M. Identifying contributions of on-road motor vehicles to urban air pollution using travel demand model data. Transp. Res. Part D Transp. Environ. 2009, 14, 168–179. [Google Scholar] [CrossRef] [Green Version]
- Wu, J.; Zhu, Q.; Chu, J.; Liu, H.; Liang, L. Measuring energy and environmental efficiency of transportation systems in China based on a parallel DEA approach. Transp. Res. Part D Transp. Environ. 2016, 48, 460–472. [Google Scholar] [CrossRef]
- Lu, W.-M.; Kweh, Q.L.; Nourani, M.; Lin, C.-Y. Political governance, corruption perceptions index, and national dynamic energy efficiency. J. Clean. Prod. 2021, 295, 126505. [Google Scholar] [CrossRef]
- Stoycheva, S.; Marchese, D.; Paul, C.; Padoan, S.; Juhmani, A.-S.; Linkov, I. Multi-criteria decision analysis framework for sustainable manufacturing in automotive industry. J. Clean. Prod. 2018, 187, 257–272. [Google Scholar] [CrossRef]
- Chithambo, L.; Tingbani, I.; Agyapong, G.A.; Gyapong, E.; Damoah, I.S. Corporate voluntary greenhouse gas reporting: Stakeholder pressure and the mediating role of the chief executive officer. Bus. Strat. Environ. 2020, 29, 1666–1683. [Google Scholar] [CrossRef]
- Sharma, S. Determinants of carbon dioxide emissions: Empirical evidence from 69 countries. Appl. Energy 2011, 88, 376–382. [Google Scholar] [CrossRef]
- Ali, B.A.; Sapuan, M.S.; Zainudin, E.S.; Othman, M. Implementation of the expert decision system for environmental assessment in composite materials selection for automotive components. J. Clean. Prod. 2015, 107, 557–567. [Google Scholar] [CrossRef]
- Bergenwall, A.L.; Chen, C.; White, R.E. TPS’s process design in American automotive plants and its effects on the triple bottom line and sustainability. Int. J. Prod. Econ. 2012, 140, 374–384. [Google Scholar] [CrossRef]
- Figge, F.; Hahn, T. Is green and profitable sustainable? Assessing the trade-off between economic and environmental aspects. Int. J. Prod. Econ. 2012, 140, 92–102. [Google Scholar] [CrossRef]
- Buallay, A. Is sustainability reporting (ESG) associated with performance? Evidence from the European banking sector. Manag. Environ. Qual. Int. J. 2019, 30, 98–115. [Google Scholar] [CrossRef]
- Jasiński, D.; Meredith, J.; Kirwan, K. A comprehensive framework for automotive sustainability assessment. J. Clean. Prod. 2016, 135, 1034–1044. [Google Scholar] [CrossRef] [Green Version]
- Izadikhah, M.; Saen, R.F. Evaluating sustainability of supply chains by two-stage range directional measure in the presence of negative data. Transp. Res. Part D Transp. Environ. 2016, 49, 110–126. [Google Scholar] [CrossRef]
- Tone, K.; Kweh, Q.L.; Lu, W.-M.; Ting, I.W.K. Modeling investments in the dynamic network performance of insurance companies. Omega 2019, 88, 237–247. [Google Scholar] [CrossRef]
- Jia, X. Corporate social responsibility activities and firm performance: The moderating role of strategic emphasis and industry competition. Corp. Soc. Responsib. Environ. Manag. 2020, 27, 65–73. [Google Scholar] [CrossRef]
- Jeon, C.M.; Amekudzi, A. Addressing Sustainability in Transportation Systems: Definitions, Indicators, and Metrics. J. Infrastruct. Syst. 2005, 11, 31–50. [Google Scholar] [CrossRef]
- Tian, N.; Tang, S.; Che, A.; Wu, P. Measuring regional transport sustainability using super-efficiency SBM-DEA with weighting preference. J. Clean. Prod. 2020, 242, 118474. [Google Scholar] [CrossRef]
- Firer, S.; Williams, S.M. Intellectual capital and traditional measures of corporate performance. J. Intellect. Cap. 2003, 4, 348–360. [Google Scholar] [CrossRef]
- Clarkson, M.B.E. A Stakeholder Framework for Analysing and Evaluating Corporate Social Performance. Acad. Manag. Rev. 1995, 20, 92–117. [Google Scholar] [CrossRef]
- Gold, N.O.; Taib, F.M. Impact of corporate sustainability reporting practice on corporate performance: A review of literature. Int. J. Ind. Manag. 2020, 8, 19–34. [Google Scholar] [CrossRef]
- Yoon, B.; Lee, J.H.; Byun, R. Does ESG Performance Enhance Firm Value? Evidence from Korea. Sustainability 2018, 10, 3635. [Google Scholar] [CrossRef] [Green Version]
- Homburg, C.; Stierl, M.; Bornemann, T. Corporate Social Responsibility in Business-to-Business Markets: How Organizational Customers Account for Supplier Corporate Social Responsibility Engagement. J. Mark. 2013, 77, 54–72. [Google Scholar] [CrossRef] [Green Version]
- Barnett, M.L. Stakeholder influence capacity and the variability of financial returns to corporate social responsibility. Acad. Manag. Rev. 2007, 32, 794–816. [Google Scholar] [CrossRef]
- Farooq, O.; Rupp, D.E.; Farooq, M. The Multiple Pathways through which Internal and External Corporate Social Responsibility Influence Organizational Identification and Multifoci Outcomes: The Moderating Role of Cultural and Social Orientations. Acad. Manag. J. 2017, 60, 954–985. [Google Scholar] [CrossRef]
- Wang, Z.; Hsieh, T.-S.; Sarkis, J. CSR Performance and the Readability of CSR Reports: Too Good to be True? Corp. Soc. Responsib. Environ. Manag. 2018, 25, 66–79. [Google Scholar] [CrossRef]
- Mura, L.; Zsigmond, T.; Machová, R. The effects of emotional intelligence and ethics of SME employees on knowledge sharing in Central-European countries. Oeconomia Copernic. 2021, 12, 907–934. [Google Scholar] [CrossRef]
- Zsigmond, T.; Machová, R.; Korcsmáros, E. The Ethics and Factors Influencing Employees Working in the Slovak SME Sector. Acta Polytech. Hung. 2021, 18, 171–190. [Google Scholar] [CrossRef]
- Malik, M. Value-Enhancing Capabilities of CSR: A Brief Review of Contemporary Literature. J. Bus. Ethics 2015, 127, 419–438. [Google Scholar] [CrossRef]
- Miralles-Quirós, M.M.; Miralles-Quirós, J.L.; Gonçalves, L.M.V. The Value Relevance of Environmental, Social, and Governance Performance: The Brazilian Case. Sustainability 2018, 10, 574. [Google Scholar] [CrossRef] [Green Version]
- Von Wallis, M.; Klein, C. Ethical requirement and financial interest: A literature review on socially responsible investing. Bus. Res. 2014, 8, 61–98. [Google Scholar] [CrossRef] [Green Version]
- Sultana, S.; Zulkifli, N.; Zainal, D. Environmental, Social and Governance (ESG) and Investment Decision in Bangladesh. Sustainability 2018, 10, 1831. [Google Scholar] [CrossRef] [Green Version]
- Gillan, S.L.; Koch, A.; Starks, L.T. Firms and social responsibility: A review of ESG and CSR research in corporate finance. J. Corp. Finance 2021, 66, 101889. [Google Scholar] [CrossRef]
- Iqbal, Q.; Hassan, S.H.; Akhtar, S.; Khan, S. Employee’s green behavior for environmental sustainability: A case of banking sector in Pakistan. World J. Sci. Technol. Sustain. Dev. 2018, 15, 118–130. [Google Scholar] [CrossRef] [Green Version]
- Litman, T. Toward more comprehensive evaluation of traffic risks and safety strategies. Res. Transp. Bus. Manag. 2018, 29, 127–135. [Google Scholar] [CrossRef]
- Rakotomavo, M.T.J. Preferences of retail investors and institutions for corporate social performance. J. Sustain. Financ. Invest. 2011, 1, 93–102. [Google Scholar] [CrossRef]
- De Giorgi, E. Loss aversion with multiple investment goals. Math. Financ. Econ. 2011, 5, 203–227. [Google Scholar] [CrossRef]
- Veeneman, W. Developments in public transport governance in the Netherlands; the maturing of tendering. Res. Transp. Econ. 2018, 69, 227–234. [Google Scholar] [CrossRef]
- Haase, D.; Nuissl, H. Does urban sprawl drive changes in the water balance and policy? The case of Leipzig (Germany) 1870–2003. Landsc. Urban Plan. 2007, 80, 1–13. [Google Scholar] [CrossRef]
- Tone, K. A slacks-based measure of efficiency in data envelopment analysis. Eur. J. Oper. Res. 2001, 130, 498–509. [Google Scholar] [CrossRef] [Green Version]
- Li, L.; He, W.; Xu, L.; Ash, I.; Anwar, M.; Yuan, X. Investigating the impact of cybersecurity policy awareness on employees’ cybersecurity behavior. Int. J. Inf. Manag. 2019, 45, 13–24. [Google Scholar] [CrossRef]
- Liu, D.; Gong, Y.; Zhou, J.; Huang, J.-C. Human Resource Systems, Employee Creativity, and Firm Innovation: The Moderating Role of Firm Ownership. Acad. Manag. J. 2017, 60, 1164–1188. [Google Scholar] [CrossRef]
- Sefeedpari, P.; Shokoohi, Z.; Behzadifar, Y. Energy use and carbon dioxide emission analysis in sugarcane farms: A survey on Haft-Tappeh Sugarcane Agro-Industrial Company in Iran. J. Clean. Prod. 2014, 83, 212–219. [Google Scholar] [CrossRef]
- Sircar, S.; Turnbow, J.L.; Bordoloi, B. A Framework for Assessing the Relationship between Information Technology Investments and Firm Performance. J. Manag. Inf. Syst. 2000, 16, 69–97. [Google Scholar] [CrossRef]
- Tone, K.; Tsutsui, M. Dynamic DEA: A slacks-based measure approach. Omega 2010, 38, 145–156. [Google Scholar] [CrossRef] [Green Version]
- Wang, W.-K.; Lu, W.-M.; Kweh, Q.L.; Lai, H.-W. Does corporate social responsibility influence the corporate performance of the U.S. telecommunications industry? Telecommun. Policy 2014, 38, 580–591. [Google Scholar] [CrossRef]
- Sitompul, S.; Khadijah, S. Analysis Net Profit, Dividend, Debt, Cash Flow, and Capital Net Working That Influence Investment Decisions on Manufacturing Companies. Int. J. Res. Rev. 2020, 7, 56–63. [Google Scholar]
- Halkos, G.E.; Paizanos, E.A. The effects of fiscal policy on CO2 emissions: Evidence from the U.S.A. Energy Policy 2016, 88, 317–328. [Google Scholar] [CrossRef]
- Rajesh, R. Exploring the sustainability performances of firms using environmental, social, and governance scores. J. Clean. Prod. 2020, 247, 119600. [Google Scholar] [CrossRef]
- Han, J.-J.; Kim, H.J.; Yu, J. Empirical study on relationship between corporate social responsibility and financial performance in Korea. Asian J. Sustain. Soc. Responsib. 2016, 1, 61–76. [Google Scholar] [CrossRef] [Green Version]
- Tone, K.; Tsutsui, M. Dynamic DEA with network structure: A slacks-based measure approach. Omega 2014, 42, 124–131. [Google Scholar] [CrossRef] [Green Version]
- Bassen, A.; Kovács, A.M. Environmental, Social and Governance Key Performance Indicators from a Capital Market Perspective. In Wirtschafts-und Unternehmensethik; Springer Science and Business Media LLC: Berlin/Heidelberg, Germany, 2020; pp. 809–820. [Google Scholar]
- Kortelainen, M. Dynamic environmental performance analysis: A Malmquist index approach. Ecol. Econ. 2008, 64, 701–715. [Google Scholar] [CrossRef]
- Klopp, G.A. The analysis of the efficiency of productive systems with multiple inputs and outputs. University of Illinois at Chicago. Ph.D. Thesis, University of Illinois, Chicago, IL, USA, 1985. [Google Scholar]
- Färe, R.; Grosskopf, S. Intertemporal Production Frontiers: With Dynamic DEA. J. Oper. Res. Soc. 1997, 48, 656. [Google Scholar] [CrossRef]
- Artiach, T.; Lee, D.; Nelson, D.R.; Walker, J. The determinants of corporate sustainability performance. Account. Financ. 2010, 50, 31–51. [Google Scholar] [CrossRef]
- Roberts, R.W. Determinants of corporate social responsibility disclosure: An application of stakeholder theory. Account. Organ. Soc. 1992, 17, 595–612. [Google Scholar] [CrossRef] [Green Version]
- Zhao, X.; Ke, Y.; Zuo, J.; Xiong, W.; Wu, P. Evaluation of sustainable transport research in 2000–2019. J. Clean. Prod. 2020, 256, 120404. [Google Scholar] [CrossRef]
- Waddock, S.A.; Graves, S.B. The Corporate Social Performance–Financial Performance Link. Strateg. Manag. J. 1997, 18, 303–319. [Google Scholar] [CrossRef]
- Escrig-Olmedo, E.; Fernández-Izquierdo, M.Á.; Ferrero-Ferrero, I.; Rivera-Lirio, J.M.; Muñoz-Torres, M.J. Rating the Raters: Evaluating how ESG Rating Agencies Integrate Sustainability Principles. Sustainability 2019, 11, 915. [Google Scholar] [CrossRef] [Green Version]

Publisher’s Note: MDPI stays neutral with regard to jurisdictional claims in published maps and institutional affiliations. |
© 2022 by the authors. Licensee MDPI, Basel, Switzerland. This article is an open access article distributed under the terms and conditions of the Creative Commons Attribution (CC BY) license (https://creativecommons.org/licenses/by/4.0/).