1. Introduction
The German government’s climate protection goals for 2030 call for a reduction in greenhouse gas emissions from road transport [
1]. However, modern cities are still highly dependent on motorized private transport, leading to higher emissions, urban automobile congestion, and reduced quality of life [
2]. Even though German metropolises usually have a good range of local public transport, an average of 59% of passenger kilometers are covered by motorized private transport [
3]. To meet the defined goals in the transport sector regarding climate protection, air pollutants, energy consumption, and land use, it is necessary to reduce the use of private motorized transport significantly—especially in urban areas. Studies indicate that emission factors of public transport are much lower compared to car travel [
4]. Taking advantage of these potential emission reductions requires people to change their travel behavior towards more sustainable mobility solutions such as public transport.
The literature suggests that travel behavior and travel mode choices are strongly influenced by routines and habits [
5,
6,
7]. Many studies have investigated how such habits can be broken and how people can be persuaded to develop more sustainable travel behavior. These studies include several kinds of incentives such as free tickets [
8], gamification applications [
9,
10,
11,
12], and motivational features such as self-monitoring feedback and rewards [
13,
14]. Furthermore, several measures were suggested to discourage private motorized transport while encouraging public transport [
15]. Other studies include persuasive technologies in the form of mobility or transit apps for multimodal travel and Mobility-as-a-Service schemes [
16,
17,
18]. These are just a few examples of an extensive and rapidly growing body of literature (for relevant literature reviews see, e.g., [
2,
19,
20]).
In general, an essential building block in the development of sustainable travel behavior is reliable and attractive local public transport. This also entails that barriers preventing people from using public transport need to be reduced. Such barriers include drawbacks due to costs, comfort, and convenience, as well as restrictions regarding flexibility and punctuality [
21]. In addition, unreliable or limited information available to passengers may lead to barriers. For example, Lopez-Carreiro et al. [
17] report that passengers expect real-time information regarding passenger crowding, vehicle conditions, and route planning, among others. However, the occupancy rates of local public transport vehicles are commonly not communicated to passengers. Moreover, insecurities about transfer connections, the inflexibility of public transport for shopping trips, and inconveniences of transporting luggage affect which transport mode people choose [
22,
23,
24,
25]. These are barriers that can be overcome. Digitalization and the spread of smartphones among passengers offer a wide range of opportunities to increase the convenience of using public transport by providing more real-time information and additional options. Digital technologies have the potential to significantly impact travel behavior [
26,
27].
In this context, a concept for a public transport assistance system is presented here, which tackles three main aspects of the aforementioned barriers—occupancy, transfer connections, and luggage transportation. More precisely, the assistance system is being developed within the scope of the project U3 (full project title in German: U-hoch-3—Unbeschwert urban unterwegs) with a project consortium composed of partners from industry, local public transport companies, and academia. It has the objective to improve the travel experience for passengers of the Nordhessischer Verkehrsverbund (NVV) in Kassel and its surrounding area in Germany. Kassel is a city and regional center in northern Hesse with around 200,000 inhabitants. The local public transport network spans across urban and rural areas with buses and trams.
The assistance system comprises three services. The first one is an occupancy rate service for predicting the occupancy levels of vehicles in general and of multipurpose areas for wheelchairs, bicycles, etc., in particular. As mentioned previously, passengers would prefer to receive information regarding the occupancy of vehicles, but this is commonly not communicated in local public transport. Only recently, interest in this topic has grown due to the COVID-19 pandemic, which had a considerable impact on public transport passengers. The intentions to use public transport were affected and people preferred to choose solo modes of travel [
28,
29]. Therefore, it seems necessary to think of new public transport planning methods in the context of the pandemic, e.g., to meet the distancing requirements [
30]. Providing passengers with information on occupancy levels would be a possible solution in this regard. Additionally, the novelty of this service stems especially from the occupancy prediction for the multipurpose areas via new sensors allowing for object recognition. This may improve the accessibility for people traveling with bicycles, baby carriages, etc., and particularly for disabled people with the potential of improving their life satisfaction [
31]. The second service of the assistance system is a transfer connection monitor and secure (TCMS) system for real-time information regarding connections. The service additionally includes the option for passengers to communicate a transfer connection request, which is also a novel service in local public transport giving the passengers a more active role in the connection planning process. The third service is a delivery service for convenient use of public transport while shopping without the need to transport shopping bags. This service aims to persuade people to use public transport for shopping trips instead of their cars.
After a user requirement analysis, these services will first be implemented prototypically and evaluated in laboratory studies. Afterwards, the services will be implemented for selected NVV lines and evaluated in a one-year field study to derive recommendations. In conclusion, the objective of the concept is to make public transport more attractive by reducing the aforementioned barriers and thus supporting people in the development towards more sustainable travel behavior.
In the following, the assistance system concept and the three services are described in more detail in
Section 2. To implement the assistance system, additional information must be integrated into existing user interfaces. Thus,
Section 3 gives an overview of user interfaces included in the concept. Furthermore, for the assistance system to be successful, it is imperative to know user needs. Therefore, a comprehensive user requirement analysis was conducted and is outlined in
Section 4.
Section 5 delineates the prototypical implementation and evaluation in laboratory studies of components of the assistance system.
Section 6 provides an outlook on the holistic evaluation of the assistance system in a one-year field study before conclusions are derived in
Section 7.
2. Assistance System for Public Transport Passengers
The developed assistance system intends to make local public transport more attractive, thereby contributing to the achievement of the Sustainable Development Goals (SDGs) of the United Nations Agenda 2030 [
32]. The implementation of the assistance system is particularly intended to positively contribute to the achievement of the SDGs described in
Table 1.
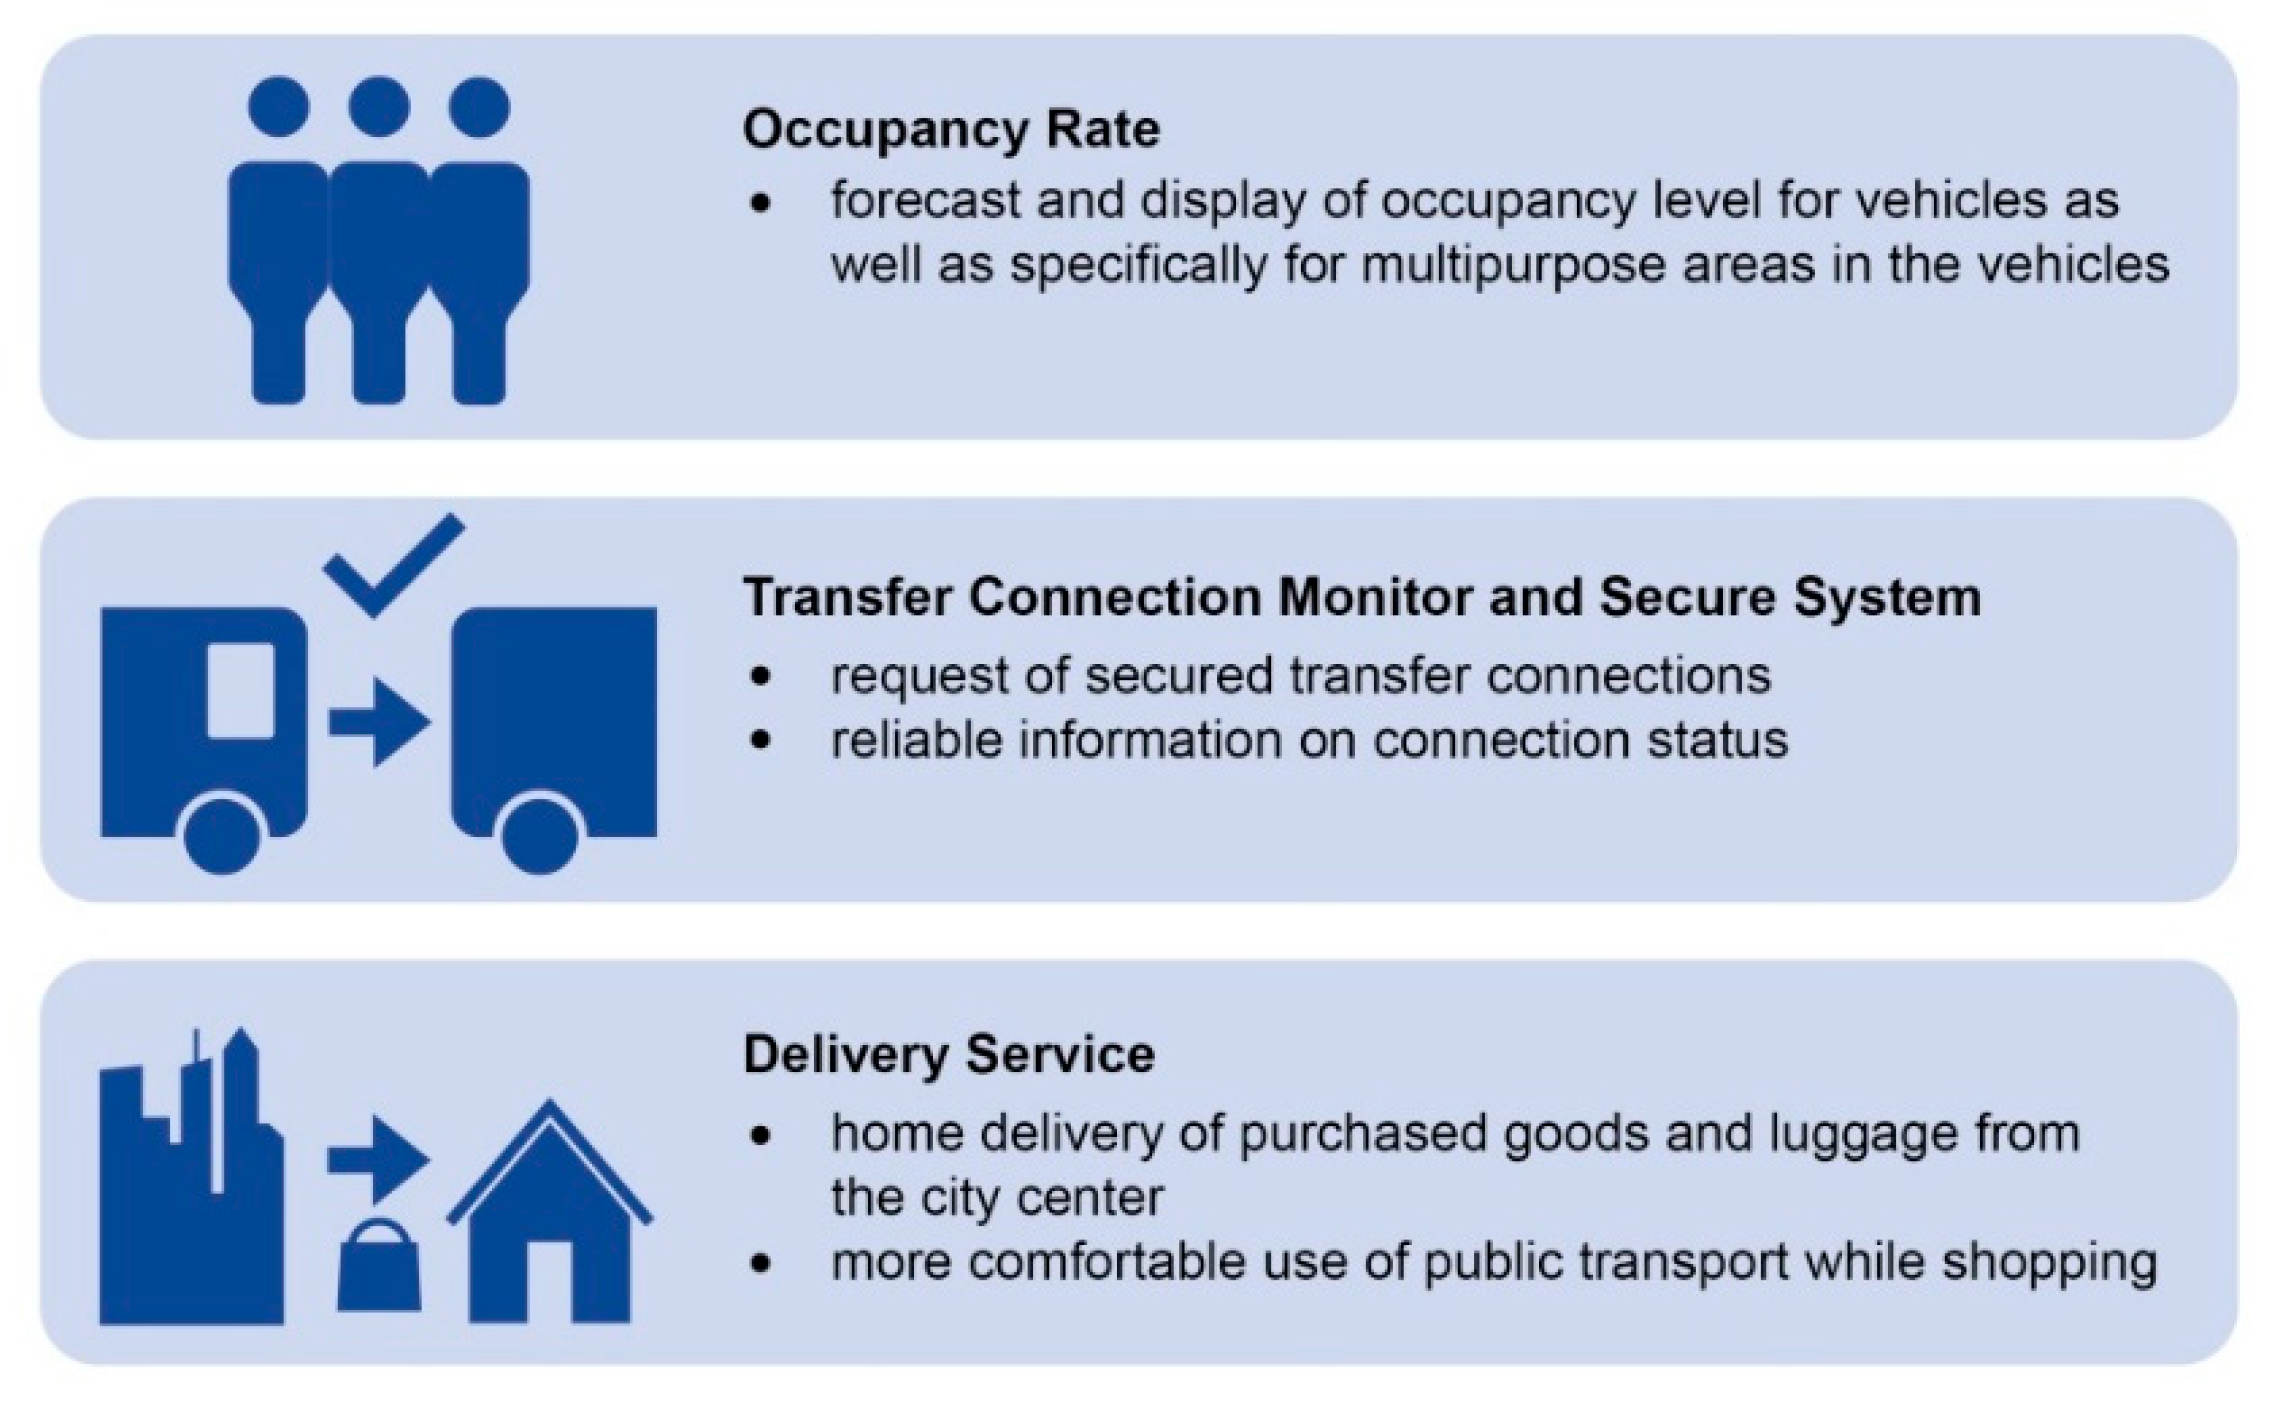
As mentioned previously, the assistance system is composed of three services (
Figure 1). In a preliminary study, passengers, experts from the public transport sector as well as from courier, express, and parcel (CEP) service providers, and retail sectors were systematically surveyed. Passengers found it inconvenient to transport luggage on buses and trams and were particularly interested in information about their desired connections and occupancy levels of vehicles. The public transport experts also saw the issue of connection security as a significant quality criterion in public transport. According to them, the lack or disuse of real-time data has been the main obstacle to the effective use of connection information. A representation of the occupancy rate has failed so far primarily because of the lack of area-wide use of automatic passenger counting data due mainly to economic reasons [
37]. Based on these insights combined with the literature review, the three services were conceptualized as described in more detail in the following.
2.1. Occupancy Rate
The first service of the assistance system tackles the issues concerning the lack of information on occupancy rates in local public transport. In the U3 project, different forecasting models are being designed, technically implemented, and tested in the one-year field study. The aim is, on the one hand, to forecast the passenger load of vehicles in local public transport and, on the other hand, to predict the occupancy of the multipurpose areas of these vehicles. Multipurpose areas are special areas in the vehicles where wheelchairs, baby carriages, bikes, and other larger objects can be placed.
From the passengers’ point of view, a reliable forecast serves to increase comfort and reduce barriers to use [
38]. Passengers can decide for or against certain connections based on knowledge about the occupancy rate. Mobility-impaired passengers can assess whether capacities are available in the desired vehicle. From the transport companies’ point of view, forecasting models offer the possibility of supporting deployment planning and of being able to deploy the available vehicles in a more targeted manner [
39]. In addition, passenger flows can be managed so that peak loads can be avoided and a more even utilization can be achieved [
40].
There are several possible data types and data sources available for designing forecasting models in public transport. In other projects, for example, automatic vehicle location (AVL) data and automated fare collection (AFC) data were used [
41]. Another approach is to use data collected by query logs [
42]. These sources often have gaps in their data. AFC data, for example, exclude a lot of passengers who do not buy their tickets via the respective app from which the data are available or via an app at all [
43]. Query log data are, in many cases, not reliable since people tend to search for more than one connection, and it is not known which vehicle they actually chose.
The forecasting models in the U
3 project are mainly based on the analysis and processing of automatic passenger counting (APC) data. Since almost all vehicles of the NVV are supplied with counting systems, this is a reliable database. Although several sources of error exist (e.g., misuse by operators, defective devices, or wrong data preparation), the advantages outweigh the disadvantages for this use case [
44]. The main advantage of APC data is that every person entering the vehicle is counted, so there is no need for projections, which eliminates an additional possible source of error. Several other data sources are used to further enrich the APC data: timetable, weather, capacity, and calendar data. Depending on the particular model, different or additional data are used. The forecasting models in the U
3 project can be divided into two groups depending on the subject of the forecast: forecasting the occupancy level of the vehicle or forecasting the occupancy level of the multipurpose areas. Both concepts are briefly introduced in the following.
The goal of vehicle occupancy forecasting is to predict how many passengers will be in the vehicle at a given time in the future. In this project, this always involves forecasting passenger demand on an edge, i.e., a section of a scheduled trip between two stops. A key aspect of this service is the point in time of the forecast calculation. Depending on the lead time, different models are used. If the vehicle has not yet started the trip, the so-called long-term forecast is calculated. If the vehicle has already departed, the so-called short-term forecast is used. The models differ in the data used for the calculation. While long-term forecasting can only rely on historical counting data, short-term forecasting includes real-time data.
Since the short-term forecasting model builds on the long-term forecasting model, the long-term forecasting will be explained first. The long-term forecast model enables the system to calculate a forecast for any edge in the NVV network for any time in the future. For this purpose, the edge, for which a forecast is to be calculated, is categorized based on certain stratification features. These stratification features are edge (edge to be forecast), line (ID of the line), hour (hour in which the edge will be served), school day (is there school operation on this day?), day type (categorization of the day into one of five categories), and temperature class (categorization of the temperature into one of four temperature classes). These stratification characteristics are used to search for comparable data points in the historical trip data set. After removing outliers, a mean value is assumed to be the forecast value. This forecast value is assigned to an occupancy rate after a comparison with the vehicle capacity. In U3, there are four occupancy levels:
Less than 50% of the seats are occupied.
Less than 100% and more than 50% of the seats are occupied.
All seats are occupied, but less than 85% of the total capacity is occupied.
At least 85% of the total capacity is occupied.
The short-term forecast extends the model of the long-term forecast with real-time data and consequently ensures a higher forecast quality. In simple terms, the difference between the current occupancy (measured in real time) and the previously predicted long-term forecast is calculated at each edge of a line trip. The resulting error is projected onto the remaining edges of this particular line trip. Thus, the short-term forecast updates after each stop of a line trip. The short-term forecast model can therefore map unexpected deviations in occupancy patterns.
The second goal in U3 regarding forecasting models is to predict the occupancy of the multipurpose areas. To this end, all vehicles of a pilot line will be equipped with new sensor technology capable of distinguishing between different object types. The model should be able to display the current real-time occupancy but also to calculate forecasts for future occupancy rates for multipurpose areas. A particular challenge here is that the occupancy of a multipurpose area is a less frequent and potentially more irregular event compared to the general vehicle occupancy. Data analysis will show whether certain patterns can be identified to calculate reliable forecasts. Forecasting multipurpose area occupancy is a clear added value for mobility-impaired individuals and is, therefore, targeted in the U3 project.
So far, the models for short-term and long-term forecasting have been designed and tested based on real counting data and are being developed for real operation. In the next step, the counting data of the new sensor technology, which is able to distinguish different object types, are analyzed. Subsequently, a model is developed to forecast the occupancy of the multipurpose areas. The information regarding occupancy rates is finally integrated into several user interfaces for the field study, as explained further below.
2.2. Transfer Connection Monitor and Secure System
The second service of the assistance system targets local public transport transfer connections. Missed transfer connections constitute one of the main obstacles for passengers using public transport [
45,
46]. Additional waiting time on the transfer stop depending on the frequency of service results in a lack of comfort for the passengers. Public transport companies try to reduce the problem of these broken links by securing some of the transfers manually or automatically. These so-called planned transfers are chosen depending on the transfer connection importance in the public transportation network. Planned transfers are often located at stations where buses can wait for trains with a higher passenger load to distribute the demand further on. Another common application for planned transfers is the last connection of a day. If the connection cannot be secured for the passengers to transfer, there would not be an appropriate way to continue their trip with public transport. Therefore, the connection has to be secured, if possible.
Securing a planned transfer is often realized by radio communication between drivers and their operations control center. This solution is not efficient because of the manual workload in the control center and its limited personal resources. Transfers between lines operated by different public transport companies are another problem. They have different control centers, and if they are coordinated at all, the communication effort increases. The key advantage of a manually secured transfer is the possibility to solve problems individually. Furthermore, passengers in the feeder line can ask their driver to request a secured transfer at a certain station via radio communication. Besides manually secured transfers, an intermodal transport control system (ITCS) can monitor planned transfers automatically. The ITCS takes into account the delay of all vehicles involved and instructs drivers via an on-board computer to wait if necessary. Above a certain size of the public transport network, this solution is necessary because of the much higher efficiency. The main problem of this approach is the unknown passenger demand at the transfer. The system may secure a connection where no passengers transfer at all. In addition, public transportation networks are often complex, with various dependencies and competing demands, so that a waiting command at one station results in a delay and a chain reaction leading to more necessary waiting commands for following transfer connections. For these reasons, it is not practicable to secure every transfer automatically [
47].
Within the project U
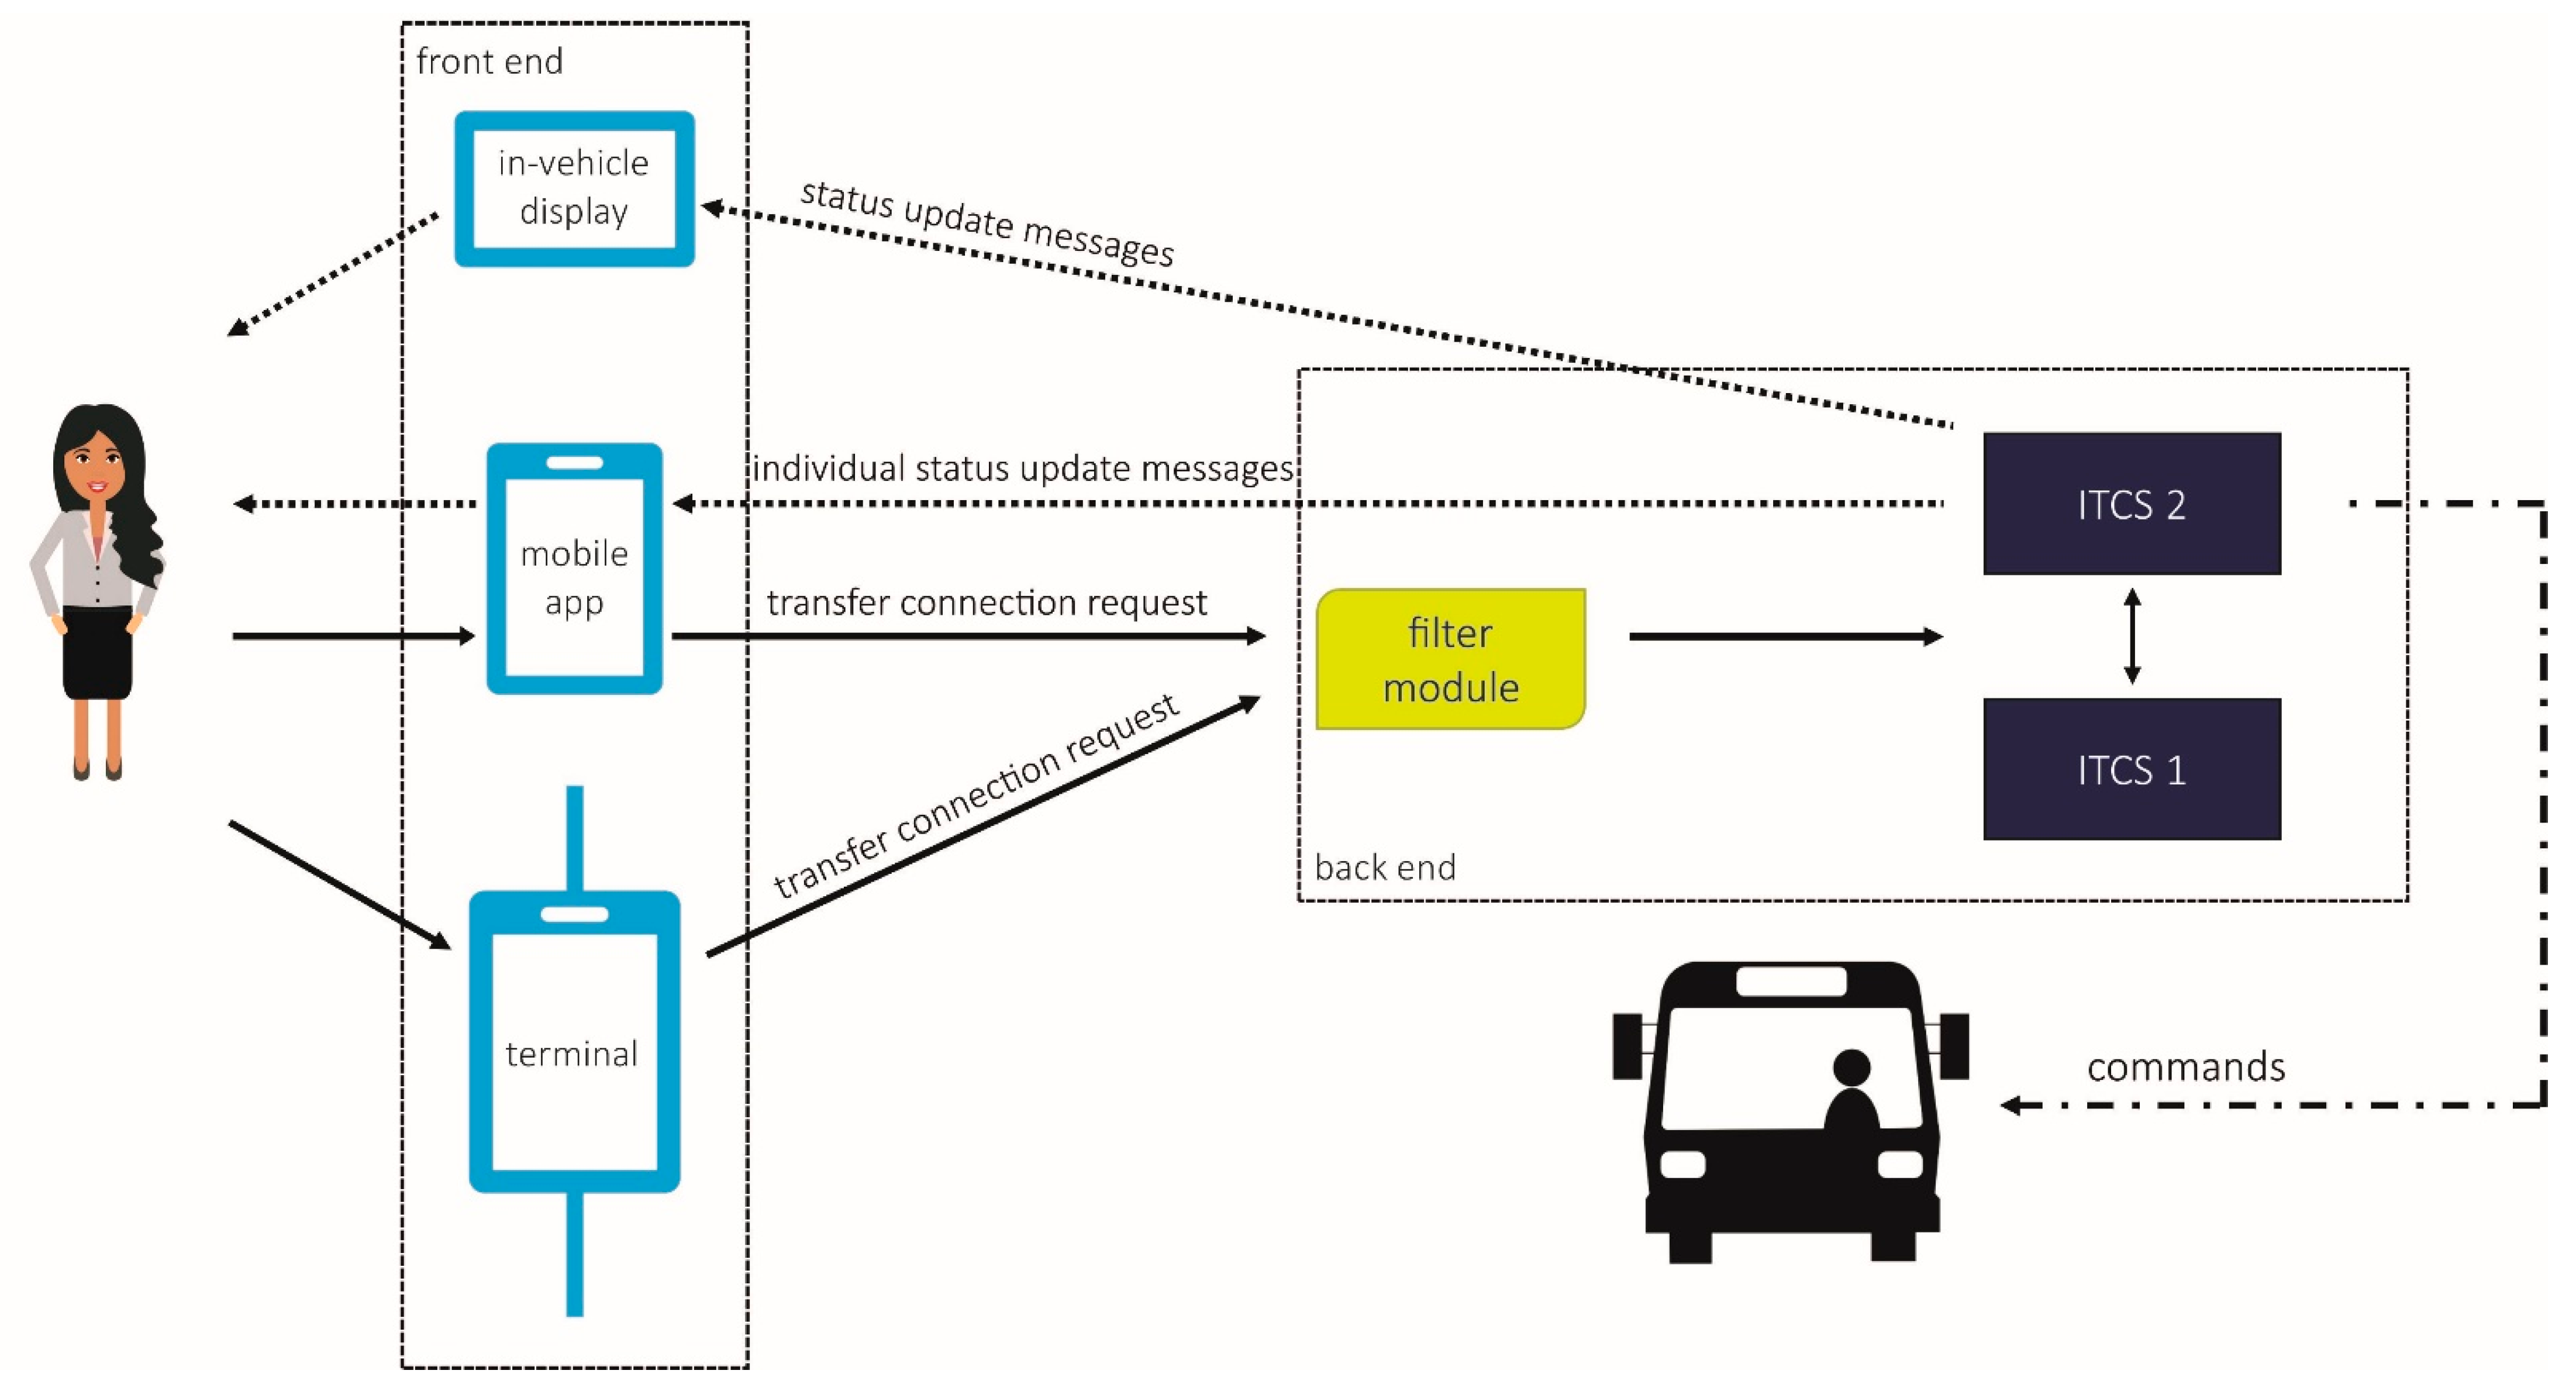
3, a new approach of a TCMS system is developed and tested in the NVV. The main advantage of this new solution is the option for the passengers to request a certain transfer connection via a mobile app or an in-vehicle terminal. The NVV’s ITCS, or another ITCS if involved knowing the demand for transfers, can then secure the relevant transfer connections. This system can operate almost automatically, and the control center operators can concentrate on individual problems in the operation processes. The new system is realized by an update of the existing mobile app (NVV app) and a similar interface on in-vehicle terminals (see also
Section 3), representing the front end. The ITCS as part of the back end receives an update too, to receive the messages generated and processed by preceding system components and generate monitored transfer connections. If vehicle A arrives with a delay at a monitored transfer connection and a delayed departure for vehicle B is possible without intolerable negative operational consequences, the driver of vehicle B receives the order to wait from the responsible ITCS via the on-board computer (secured transfer). The passengers receive updated information about their requested transfer connection via in-vehicle displays or the mobile app (
Figure 2). This is a major increase in comfort because the status of the transfer is communicated clearly to the passengers so that they do not need to fear missing their connection due to delays. If the connection cannot be secured because of too much delay or other circumstances, the new system will suggest alternative connections instead of leaving the passengers alone with the problem.
2.3. Delivery Service
The third assistance system service refers to inconveniences of transporting shopping bags or luggage in local public transport. As this is a major barrier to the use of public transport [
48], cars are often used for shopping trips instead. Car drivers use their vehicles not only to transport their purchases but also to store them temporarily. To enable public transport users to have a comparably comfortable shopping experience in the city center, a delivery service is planned in cooperation with retailers and public transport providers. This service will deliver goods purchased in the city center to the customers’ homes at a chosen time. Furthermore, parcel stations are to be installed in the city center, which can be used by public transport users both for handover to the delivery service and for temporary storage.
The two services occupancy rate and TCMS system described above aim directly at making public transport more attractive. The associated reduction in motorized private transport can increase the attractiveness of living in the city. To avoid counteracting this effect with the new delivery service and to include the problem of delivery traffic, which is increasing anyway due to online retailing, aspects of city logistics are to be considered for both the first and the last mile. To this end, the approach of centralizing flows of goods needs to be considered. In a hybrid approach, the parcel stations installed in the city center will also function as micro depots. CEP service providers deliver to them once by means of a motorized vehicle. Customers can then either pick up the goods themselves or have them delivered over the last mile using small electric vehicles, e.g., cargo bikes. Goods deposited by retailers or customers can be taken by the CEP service providers accordingly. Suitable small electric vehicles can also improve the accessibility of retailers in city centers, who are often not accessible at all with motorized vehicles or only for a limited time frame. This also reduces parking pressure in the city center.
If the parcel stations in the city center are opened up to other CEP service providers, online retail customers may frequent them and nearby stores occasionally. This can help to strengthen local retail. Outside the city center, parcel stations open to all or most CEP service providers should be set up at larger public transport stations to support delivery to end customers on the last mile. This approach is already successfully tested, e.g., in Hamburg [
49]. In addition to collection by the customer, the use of small electric vehicles for delivery is also planned. Large public transport stops offer the necessary space and facilitate use, especially for public transport passengers.
With parcel stations in the city center and at public transport stops in outlying districts, goods can be transported via public transport. This approach can also be used to transport goods from logistics centers into the city. A concept for this was developed as part of the U3 project, but it cannot be implemented as part of the field study due to hurdles such as labor laws.
An alternative to delivery by employees with small electric vehicles is robot-assisted delivery [
50,
51]. This will also be considered as part of the delivery service in U
3. Since a trial in a public space would generate greater legal, technical, and organizational expenses, the approach is to be tested in a shopping center. The shopping center, with its aisles lined with retail stores, is an analogy to pedestrian zones in the city center. Legal aspects are easier to solve in a semi-public space and the technology does not have to be designed to be, e.g., weatherproof. In the shopping center, customers can drop off their purchases for delivery at the checkout. Robots should collect these deliveries and make them available for a CEP service provider at a central pickup location. The first studies regarding the application of this robot-assisted delivery are currently being conducted in the laboratory and will be expanded to the shopping center.
3. User Interfaces
The previous sections have described the three assistance system services. Implementing these services for passengers of public transport means that further information needs to be integrated into existing user interfaces. The complexity of the concept suggests a need for further research concerning the user-friendly presentation of information and interface design. Thus, in the project, prototypes of the interfaces are designed and evaluated before they are tested in the field study. The user interfaces considered in the U3 project can be grouped into two categories—interfaces for passengers and interfaces for public transport operators such as drivers and control center operators.
The interfaces for passengers considered are, on the one hand, personal mobile devices such as smartphones constituting the preferred interface, particularly for younger public transport users [
37]. This includes the NVV app as well as the website, which can be accessed via smartphones. Additionally, more novel and innovative mobile devices such as smartwatches and smart glasses are considered. Mobile devices are intended to provide information about occupancy rates and the status of connections as well as the option to request a transfer connection. On the other hand, publicly accessible user interfaces are also considered. These refer to dynamic passenger information displays (DPI displays), in-vehicle displays, in-vehicle terminals, and public displays. The DPI displays are located at bus stops and tram stations and provide information on the scheduled arrival times of incoming vehicles as well as their occupancy rates in general and in relation to the multipurpose areas. The in-vehicle display provides information about connections and their status. The in-vehicle terminal additionally provides the option to communicate a connection request. Public displays provide information about occupancy rates of vehicles at nearby stations and offer the option of having goods purchased in retail stores delivered to the passengers’ homes.
The interfaces for public transport operators refer to on-board computers and control center software. Via the on-board computer, drivers receive both information about connections to be held and connections that have been held, as well as information about the recorded occupancy of their vehicle. They can give their own feedback on the latter if requested to do so by the control center. Since the control center coordinates the connections, the corresponding functions also need be displayed in the control center software. It must also be possible to transmit the information about the occupancy rate to the control center and visualize it there. To implement the assistance system concept and integrate the three services adequately into the described user interfaces, a user requirement analysis was conducted as outlined in the following section.
4. User Requirement Analysis
The literature suggests that to develop systems or products, one first needs to understand the users and their needs [
52]. Thus, a user requirement analysis was conducted combining different methods to gain a thorough understanding of user needs [
53]. This resulted in a user requirement analysis composed of several phases, as we explain in the following.
In the initial phase of the project, the objective was to reach as many passengers as possible to gather information regarding user requirements in the context of the assistance system concept. Therefore, an online survey was designed and completed by 385 participants. To reach elderly passengers and people with disabilities, an offline version of the survey was conducted with 41 elderly or disabled participants. The user survey was complemented with interviews with five public transport experts. The results indicated that passengers thought the concept could make public transport more attractive. Particularly, the connection request feature was important to passengers as well as experts (for more detailed results, see [
37]).
Following up on the results from the surveys, focus groups were conducted for each of the three assistance system services. By using the focus group technique, a more open, qualitative method was applied, aiming at an in-depth exploration of user needs for each one of the services [
54]. The focus groups were conducted online with small groups of two to five participants. The procedure always started with a short introduction to the respective topic. Afterward, participants brainstormed and wrote down their ideas regarding current issues and ideas for improvement in the context of the respective assistance system service on an online whiteboard. Then, a moderated discussion started where the participants presented their ideas and engaged in conversations with each other. Finally, participants prioritized both the issues and the ideas for improvement according to how important they were to them personally. Eleven online focus groups were completed this way with 30 participants. Additionally, eight phone interviews were carried out with participants who could not or did not want to participate in the online focus groups. This led to a total sample of 38 participants (19 female and 19 male) with ages ranging between 19 and 75 years (M = 37.9 years, SD = 18.7 years). The data were analyzed by consolidating and counting aspects mentioned by the participants.
The results of the focus groups showed that participants saw merit in information regarding the occupancy level. It was mentioned most frequently that occupancy information could be used to better distribute passengers across vehicles. Moreover, it was important to participants that information regarding occupancy rates is available on various user interfaces such as the NVV app, the website, and the DPI displays. In the context of the TCMS system, the aspect mentioned most frequently was that information regarding connections needs to be accurate and reliable, and should be presented on in-vehicle displays. For the delivery service, participants were mostly concerned about the associated costs for the users. Moreover, the sustainability of the delivery service, using, e.g., cargo bikes or electric vehicles, was an important aspect. Based on these results and including further less frequently mentioned aspects, a list of user requirements was derived for each service ordered by priority depending on how many times certain aspects were mentioned and how the participants prioritized them.
To complement the list of user requirements with a further perspective, requirements were additionally collected systematically within the project consortium. Everybody was asked to brainstorm user requirements for given contexts of use and the relevant user interfaces. All the responses were collected and consolidated to create a composite list of user requirements, including those from the focus groups. Then, all user requirements were prioritized based on several aspects, such as priority in the focus groups and feasibility of implementation. This resulted in a categorization of all user requirements into one of three categories: high, medium, and low priority. User requirements of high priority were considered as obligatory for the implementation of the assistance system, while those of medium priority were not must-haves but should be implemented if feasible. The user requirements of low priority were only seen as optional add-ons.
In the final phase of the user requirement analysis, personas and scenarios [
55] were created based on the focus groups and the complete list of user requirements. More precisely, six personas were created representing relevant public transport user groups with their specific needs as identified in the previous phases of the user requirement analysis. The six personas are presented in
Table 2. Moreover, personas for the driver and the control center operator were created. For each persona, two scenarios were derived describing exemplary use cases and user requirements in context as well as how the persona uses the system successfully. The objective of using the persona and scenario approach was, thus, to make the user requirements more usable and easily applicable throughout the process of prototype development and implementation and avoid them being forgotten throughout the process [
56].
5. Prototypical Implementation and Laboratory Studies
As mentioned previously, the services occupancy rate, TCMS system, and delivery service presented in
Section 2 will first be implemented as prototypes on the user interfaces presented in
Section 3 and evaluated in laboratory studies. The prototypes designed are based on the personas and scenarios described above.
Table 3 summarizes which services are to be implemented as prototypes for each user interface and shows what the evaluation of the respective user interface in the laboratory studies should cover. This evaluation should also ensure that all the user requirements are met.
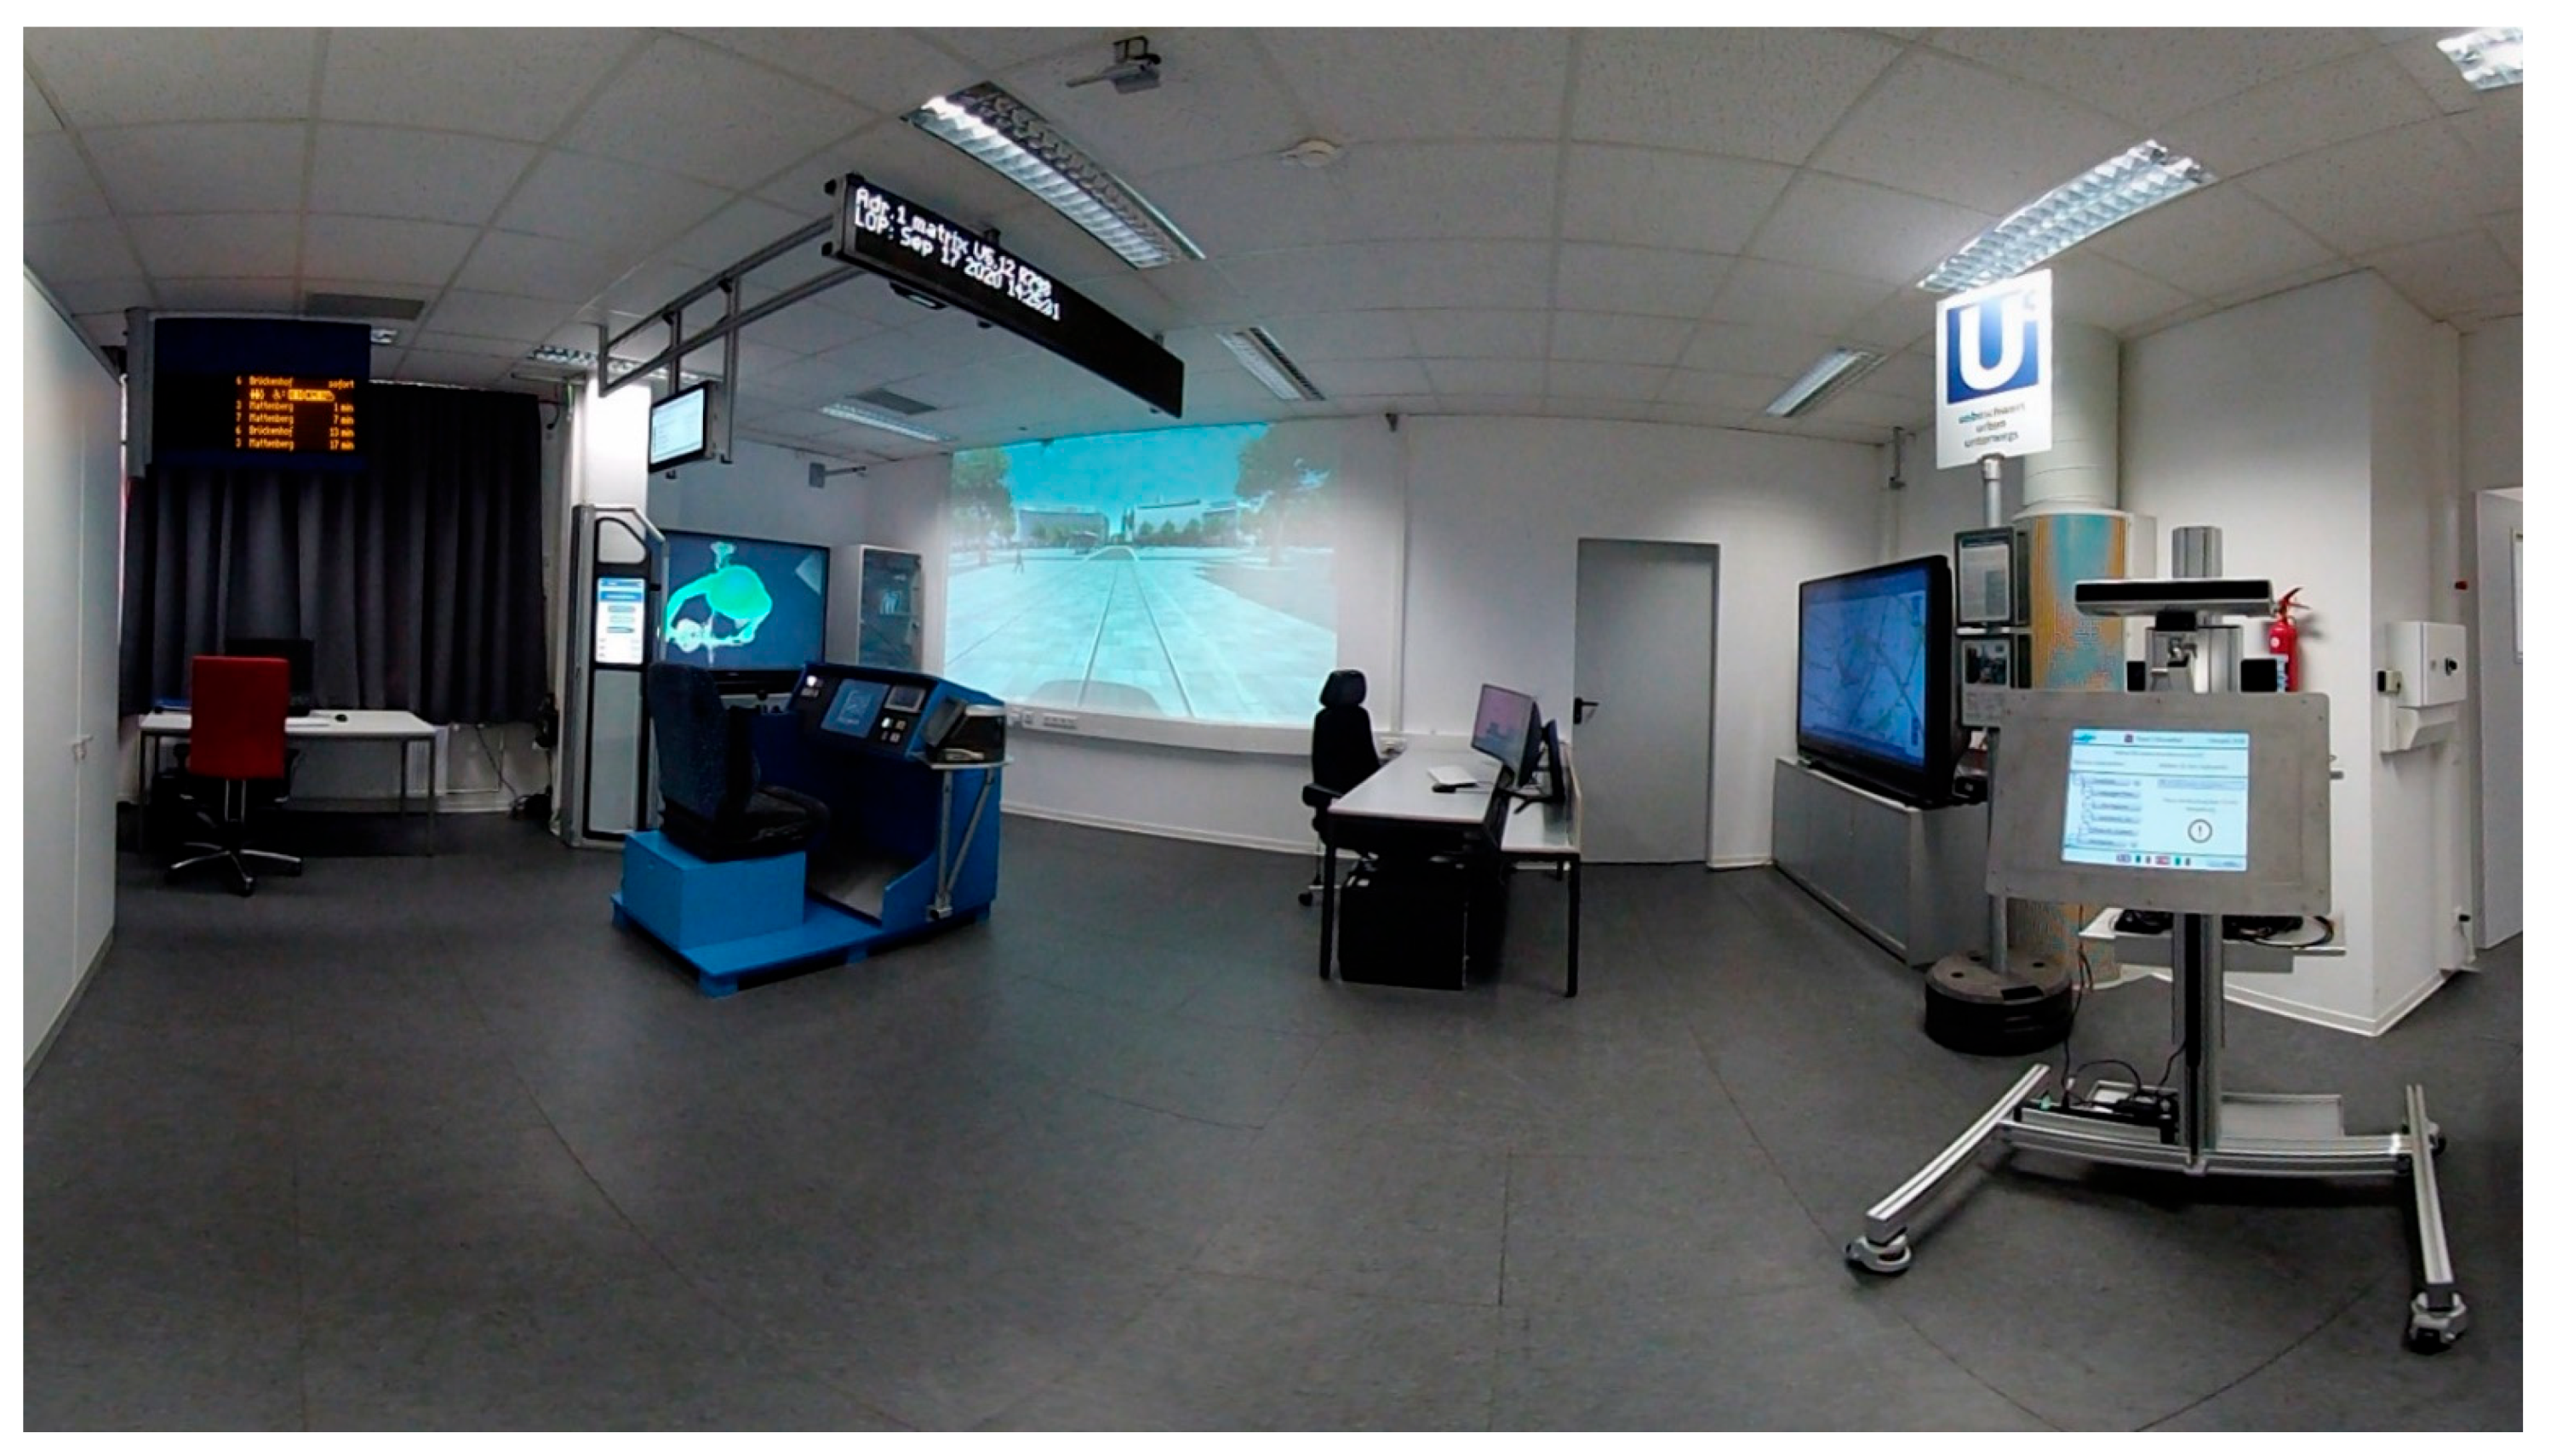
For the prototype evaluation in laboratory studies, the user interfaces were first integrated into a laboratory environment, the mobility laboratory, as shown in
Figure 3. This includes exterior and interior vehicle displays, an in-vehicle terminal, a DPI display, a tram simulator including two types of on-board computers, a mobile touch screen used both as a terminal and as a public display, and a control center workstation. Furthermore, smartphone, smartwatch, and smart glasses can be used in the laboratory. In addition to the mobility laboratory, a cave automatic virtual environment (CAVE) and a robotic laboratory are used for further evaluations.
The digital prototypes will be implemented as click prototypes for user interfaces allowing interaction, such as smartphones, in-vehicle terminals, and public displays. Prototypes for non-interactive interfaces such as the DPI and the in-vehicle display will be implemented as a sequence of images. Questionnaires are created according to the characteristics to be evaluated, such as usability, technology acceptance, or recognizability and interpretation. User interfaces for passengers will be evaluated by test persons in the role of passengers with a scenario-based approach simulated in the laboratory. User interfaces for public transport operators will be evaluated via expert interviews.
Several laboratory evaluations of assistance system components have already been completed. In a study, the display of the occupancy of multipurpose areas on the DPI display was examined concerning speed and reliability of interpretation [
57]. The study also investigated the intent of prospective use. Furthermore, a sign-production method based on Howell and Fuchs [
58] was applied to create symbols for occupancy level and transfer connection request. The results will be used in the various user interfaces after further evaluation. Prototype evaluations for the smartwatch and for the in-vehicle terminal also took place, and a concept for displaying information on smart glasses was evaluated [
59]. Moreover, a study was conducted in the CAVE to investigate trust in the assistance system with a scenario-based approach [
60].
Further studies and evaluations will follow as the project progresses. According to the results from the laboratory studies, the prototypes will be adjusted if necessary. Recommendations will be derived and applied to existing real systems according to the technical framework conditions and evaluated in a one-year field study.
6. Evaluation in One-Year Field Study
In the final phase of the project, the assistance system will be evaluated more holistically by means of a one-year field study on selected lines of the NVV in Kassel. Aspects such as traffic effects, acceptance, and usability will be investigated. In addition to the actual purpose of evaluating the developed services, the field study aims to derive basic scientific findings to ultimately translate into recommended actions.
The one-year field study has the advantage of testing and evaluating the reliability, practicality, and usability as well as acceptance and behavioral changes as a result of the assistance system on real passengers. An evaluation going beyond a sample of test persons requires a high degree of awareness and a high frequency of use. For this reason, the introduction of each of the three services will be publicly communicated and advertised. Subsequently, the usage frequencies of the three services will be analyzed over the entire period of the field study. In addition, the quality of the occupancy rate will be specifically tested based on actual occupancy. For the connection request and the delivery service, usage data will serve to determine specifically where, for which lines, in which situations, and how frequently the services are used.
As already mentioned, the analysis of traffic effects of the three services represents a focal point in the evaluation. For this purpose, a multi-layered survey design is developed, characterized by a mix of methods. This allows determining the travel behavior concerning the frequency of choosing public transport in the NVV area, and in particular, with regard to the connection choice before and after the introduction of the three services. Based on the mix of methods, different groups of people are addressed, and various characteristics can be validly surveyed. In the following, further details on the field study are provided for each assistance system service.
6.1. Occupancy Rate
Firstly, an annual online panel survey of 3000 randomly selected citizens of Kassel is used to gain representative information on public transport users’ and non-users’ assessment of the passenger load of vehicles. By conducting the survey three times with the same sample, it is possible to analyze developments in the respondents’ assessment before, during, and after completion of the field study.
Secondly, a passenger survey will be conducted to obtain data on awareness, use of the service, and adjustments in travel behavior (including choice of connections) as a result of available information on expected occupancy levels. The quantitative survey aims to find representative answers to the following research questions with a sample of about 1000 passengers:
How often do passengers pay attention to the occupancy rate when querying connections?
For what reasons is the occupancy rate (not) of interest to passengers?
Do passengers choose alternative connections based on the information about the expected occupancy rate?
What are passengers most likely to accept in exchange for a low occupancy rate: a longer wait for the next connection, a longer trip duration, or more transfers?
Based on the occupancy rate, do passengers use public transport more frequently, equally frequently, or less frequently?
How useful, reliable, and understandable do passengers find the service?
Do people with wheelchairs, walkers, strollers, bicycles, or similar use public transport more frequently, equally frequently, or less frequently based on the occupancy rate for the multipurpose areas?
The surveys will take place at the earliest six months after the implementation of the services. For this purpose, questionnaires will be designed and applied depending on the remaining travel time of the respondent. The survey will be carried out by survey staff interviewing passengers orally in buses and trams of the NVV after a random selection and recording the answers digitally on tablet computers. To consider the users of the multipurpose areas, specifically passengers with wheelchairs, walkers, baby carriages, bicycles, pedal scooters, etc., will be surveyed. In addition to the passenger survey, an online survey with similar content will be distributed via the NVV app in order to increase the willingness to participate across the various survey formats and to increase the sample size.
When evaluating the results of the occupancy rate, the influence of the COVID 19 pandemic must be taken into account. Contact reductions, distance regulations between people, and a lack of necessities of ways have temporarily led to a strongly reduced passenger demand [
61].
6.2. TCMS System
Observation and survey data will be collected to evaluate the TCMS system. The success rate of planned connections before the field phase is compared with the success rate of requested connections during the field phase. This way, the effects of the TCMS system on the planning reliability for passengers and the reliability of public transport in the NVV area can be assessed. Furthermore, a standardized online survey via the NVV app will be used to determine whether and to what extent the TCMS system has an impact on the passengers’ travel behavior. The survey will be linked to transfer connection requests to be able to relate the answers to the requested transfer between two lines and to generate differentiated findings. The survey will be conducted throughout the entire field study. In parallel, operational effects of the TCMS system will be evaluated through an analysis of logged data on delays, shortened breaks, and turning times as well as on interventions in ongoing operations.
Based on the selected evaluation methods, the following research questions will be answered:
Does the TCMS system generate additional passenger demand?
In which situations do passengers use the TCMS system?
What is the average time interval between the connection request and the transfer?
To what extent does the TCMS system increase the reliability of public transport from the passengers’ perspective? What role does information about alternative connections play?
How useful and understandable do passengers find the TCMS system?
6.3. Delivery Service
The evaluation of the delivery service in terms of traffic effects will be based on user surveys during the field study to determine whether the service makes the use of public transport for shopping more attractive. Customers will be asked to voluntarily participate in an online survey based on a standardized procedure at the cash registers of the participating stores in Kassel after submitting their delivery requests. Another aspect to be evaluated is the use of small electric vehicles for the delivery of goods to the users of the delivery service and for the distribution of goods to the stores as part of the city logistics. A before-and-after analysis of the mode of transport choices of customers and CEP service providers will be used. This will provide information on whether the developed combination of services and infrastructure—the delivery service and the parcel stations distributed at several locations in Kassel (see
Section 2.3)—leads to an overall more environmentally friendly mobility for the bundled delivery and pick-up of goods, especially in the city center.
The following research questions will be assessed as part of the evaluation of the delivery service from a traffic and usability perspective:
Does the delivery service lead to an increased use of public transport for shopping?
What is the modal split of delivery service users?
How would customers have transported the goods without the delivery service?
Does the combination of environmentally friendly transport and delivery service generate less traffic overall and is it more sustainable than car trips?
How useful, reliable, and understandable do users find the delivery service and parcel stations?
7. Conclusions
In this paper, we presented a concept for a passenger assistance system aiming to increase the attractiveness of local public transport and promote sustainable travel behavior. The concept has its limitations that need to be discussed. One limiting factor is the local limitation of the assistance system to the city and region of Kassel, Germany. Whether and how the system can be implemented in other cities or countries must be investigated further. The results of the upcoming field study will provide further implications regarding the implementation of the concept in Kassel and other cities. However, the ongoing pandemic with changing regulations for public transport may have an impact on the study results. The constantly changing pandemic situation also poses a challenge to the concepts of the forecasting models because demand was and still is subject to strong variability. Historical data, therefore, offer only limited explanatory power for future demand. In the course of the forecast conception, the integration of further possible data sources was examined but eventually dropped. These data sources included, for example, query log data, event data, and data from weight sensors and rain sensors of the vehicles. The integration of these (or other additional) data sources might improve the accuracy of the forecasting models. Hurdles and limitations concerning data sources encountered in this project include data access and ownership, data maintenance, and safety concerns (in the case of brake sensor data).
Nevertheless, the assistance system with its novel services has the potential to make local public transport more attractive. Based on the literature review and a preliminary survey, a high demand for such a system was revealed. Particularly crowded vehicles, missed connections, and inconveniences of transporting shopping bags or luggage were identified as barriers to the use of public transport. The presented assistance system concept tackles these issues with the services occupancy rate, TCMS system, and delivery service.
The three services were presented in more detail and their conceptual implementation into the respective user interfaces was described. For the actual prototypical implementation, a user requirement analysis was conducted. This analysis supported that public transport passengers want, above all, secure connections and reliable information about whether they will reach their connection and what alternative connection would otherwise be available. Therefore, the connection request function is particularly important for users. For mobility-impaired people, it is also important to know whether they can find a free seat in the vehicle or whether the multipurpose areas are occupied.
Due to the complexity of the assistance system and the different interfaces involved, it is necessary to evaluate the system thoroughly before its implementation. Thus, prototypes are first evaluated in a laboratory setting and based on the results implemented for a one-year field study. This has the advantage of testing and evaluating the reliability, practicability, and usability as well as the acceptance and behavioral changes caused by the assistance system on real passengers. For the occupancy rate, this will take the form of a panel survey. Observation and survey data will be collected during the entire field study to evaluate the TCMS system. To evaluate the delivery service in terms of traffic impacts, user surveys will be conducted during the field study to determine whether the service makes it more attractive to use public transport for shopping. These evaluations will provide insights into the success of the passenger assistance system and conclusions regarding recommended actions.


 ,
, 


