
Observed Changes in the Frequency, Intensity, and Spatial Patterns of Nine Natural Hazards in the United States from 2000 to 2019


Abstract
:1. Introduction
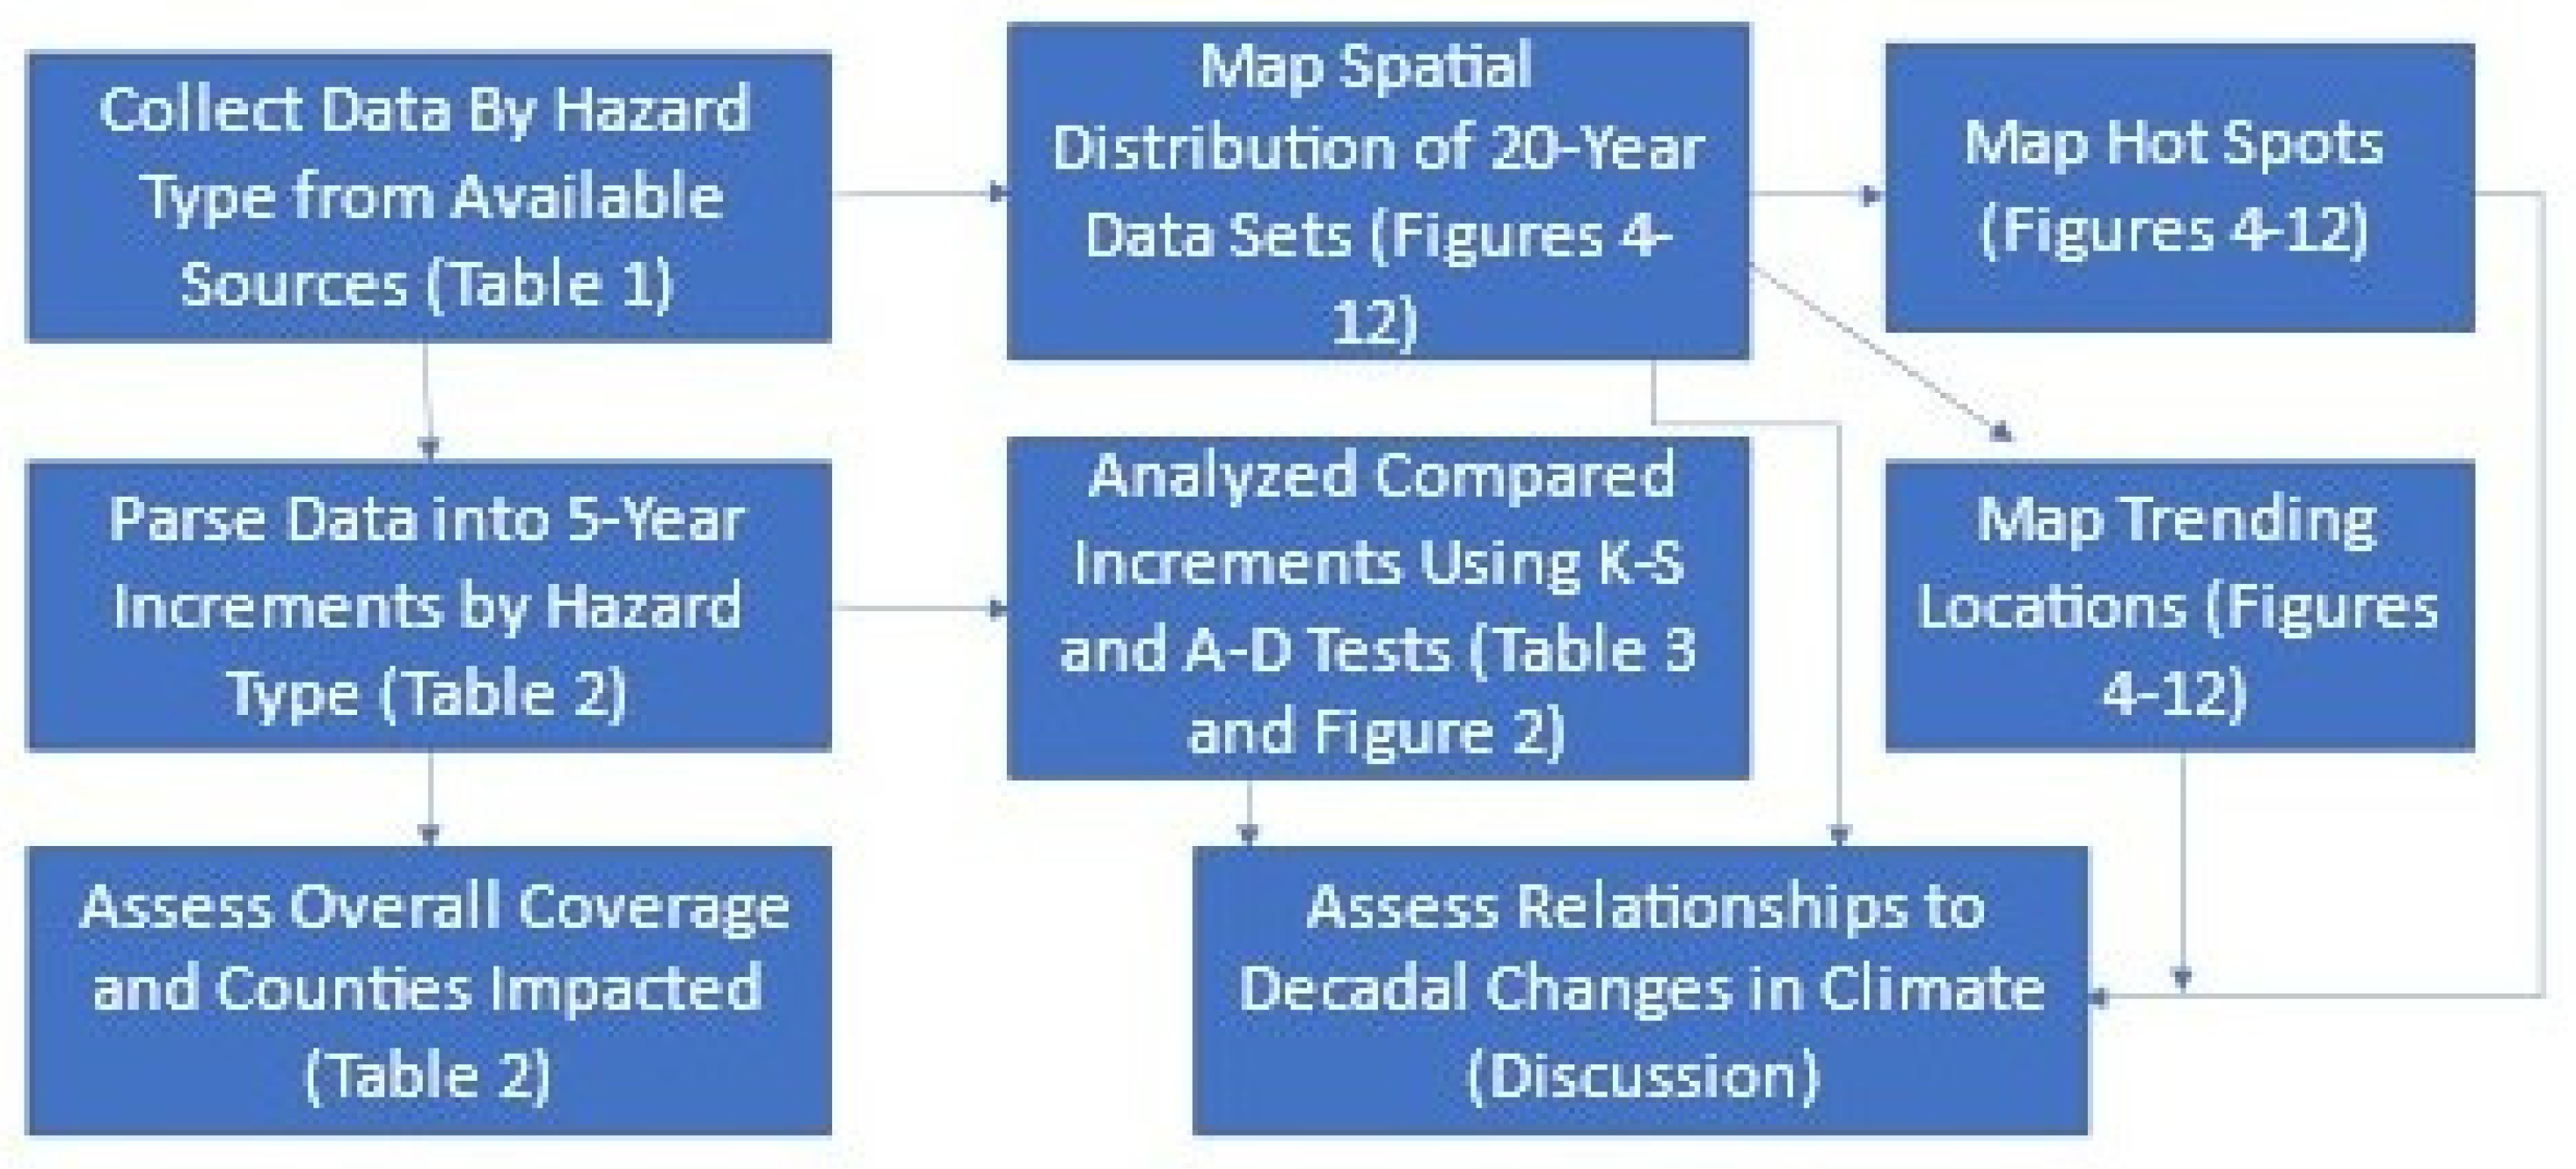
2. Methods
- Cumulative frequency analysis is the analysis of the frequency of occurrence of values of a phenomenon less than a reference value. In these cases, data for cumulative distribution functions were estimated based on sample data weighted by county area and the number of occurrences of the natural hazard in that county in a given 5-year period.
- The empirical distribution function is a formal direct estimate of the cumulative distribution function for which simple statistical properties (e.g., quartiles, median) can be derived and form the basis of various statistical hypothesis tests.
- Spatial data were downloaded, an ArcGIS Pro.aprx project file was created;
- One map extent containing the most appropriate version of the Albers projection per each region (CONUS, AK, HI, and PR) was added to the project;
- Hazard-specific shapefiles and the US Census Bureau’s 2018 county boundaries shapefile (https://www.census.gov/geographies/mapping-files/time-series/geo/carto-boundary-file.html, accessed on 15 January 2022) (were added to each map extent);
- A definition query was written to limit data to only those events of interest and was then exported as a new shapefile;
- The Buffer tool was run to mimic possible extent (if applicable);
- Events were dissolved by year via the dissolve tool;
- The Summarize-Within tool was then run (with group field parameter equal to “year”) for each map extent where events occurred, and,
- Finally, output shapefiles and join tables from the Summarize-Within tool were exported as .csv files and brought into Microsoft Excel version 2102 to create the final dataset.
3. Results and Discussion
4. Conclusions
Supplementary Materials
Author Contributions
Funding
Institutional Review Board Statement
Informed Consent Statement
Data Availability Statement
Acknowledgments
Conflicts of Interest
References
- Callaghan, M.; Schleussner, C.-F.; Nath, S.; Lejeune, Q.; Knutson, T.R.; Reichstein, M.; Hansen, G.; Theokritoff, E.; Andrijevic, M.; Brecha, R.J.; et al. Ma-chine-learning-based evidence and attribution mapping of 100,000 climate impact studies. Nat. Clim. Chang. 2021, 11, 966–972. [Google Scholar] [CrossRef]
- Timsit, A.; Kaplan, S. At Least 85 Percent of the World’s Population Has Been Affected by Climate Change; Washington Post: Washington, DC, USA, 2021; Available online: https://www.washingtonpost.com/climate-environment/2021/10/11/85-percent-population-climate-impacts/ (accessed on 15 January 2022).
- Bernstein, L.; Bosch, P.; Canziani, O.; Chen, Z.; Christ, R.; Davidson, O.; Hare, W.; Huq, S.; Karoly, D.J.; Kattsov, V.; et al. Climate Change 2007 Synthesis Report; In-tergovernmental Panel on Climate Change: Geneva, Switzerland, 2008; p. 103. [Google Scholar]
- Field, C.B.; Barros, V.; Stocker, T.F.; Dahe, Q. Managing the Risks of Extreme Events and Disasters to Advance Climate Change Adaptation: Special Report of the Intergovernmental Panel on Climate Change; Cambridge University Press: Cambridge, UK, 2012. [Google Scholar]
- Intergovernmental Panel on Climate Change (IPCC). Climate Change 2014: Synthesis Report. Contribution of Working Groups I, II and III to the Fifth Assessment Report of the Intergovernmental Panel on Climate Change; Pachauri, R.K., Meyer, L.A., Eds.; IPCC: Geneva, Switzerland, 2014; p. 151. Available online: https://www.ipcc.ch/report/ar5/syr/ (accessed on 15 January 2022).
- Intergovernmental Panel on Climate Change (IPCC). Climate Change and Land: An IPCC Special Report on Climate Change, Desertification, Land Degradation, Sustainable Land Management, Food Security, and Greenhouse Gas Fluxes in Terrestrial Ecosystems; Shukla, P.R., Skea, J., Buendia, C.E., Masson-Delmotte, V., Pörtner, H.O., Roberts, D.C., Zhai, P., Slade, R., Connors, S., van Diemen, R., et al., Eds.; IPCC: Geneva, Switzerland, 2019. Available online: https://www.ipcc.ch/site/assets/uploads/2019/11/SRCCL-Full-Report-Compiled-191128.pdf (accessed on 15 January 2022).
- Knutson, T.R.; McBride, J.L.; Chan, J.; Emanuel, K.; Holland, G.J.; Landsea, C.W.; Held, C.I.; Kossin, J.P.; Srivastava, A.K.; Sugi, M. Tropical cyclones and climate change. Nat. Geosci. 2010, 3, 157–163. [Google Scholar] [CrossRef] [Green Version]
- Intergovernmental Panel on Climate Change (IPCC). Managing the Risks of Extreme Events and Disasters to Advance Climate Change Adaptation; IPCC: Geneva, Swit-zerland, 2012; p. 582. Available online: http://ipcc-wg2.gov/SREX/ (accessed on 15 January 2022).
- Bender, M.A.; Knutson, T.R.; Tuleya, R.E.; Sirutis, J.J.; Vecchi, G.A.; Garner, S.T.; Held, I.M. Modeled impact of anthropogenic warming on the frequency of intense Atlantic hurricanes. Science 2010, 327, 54–458. [Google Scholar] [CrossRef] [PubMed] [Green Version]
- Done, J.; Holland, G.; Bruyere, C.; Leung, L.; Suzuki-Parker, A. Modeling high-impact weather and climate: Lessons from a tropical cyclone perspective. Clim. Change 2013, 129, 381–395. [Google Scholar] [CrossRef] [Green Version]
- Lin, N.; Emanuel, K.; Oppenheimer, M.; Vanmarcke, E. Physically based assessment of hurricane surge threat under climate change. Nat. Clim. Change 2012, 2, 462–467. [Google Scholar] [CrossRef] [Green Version]
- Mudd, L.; Wang, Y.; Letchford, C.; Rosowsky, D.V. Assessing Climate Change Im-pact on the U.S. East Coast Hurricane Hazard: Temperature, Frequency, and Track. Nat. Hazards Rev. 2014, 15, 04014001. [Google Scholar] [CrossRef]
- Estrada, F.; Botzen, W.J.W.; Tol, R. Economic losses from US hurricanes consistent with an influence from climate change. Nat. Geosci. 2015, 8, 880–884. [Google Scholar] [CrossRef]
- Brooks, H. Severe thunderstorms and climate change. Atmos. Res. 2013, 123, 129–138. [Google Scholar] [CrossRef]
- Huber, D.G.; Gulledge, J. Extreme Weather and Climate Change: Understanding the Link, Managing the Risk; Pew Center on Global Climate Change: Arlington, TX, USA, 2011. Available online: https://www.c2es.org/document/extreme-weather-and-climate-change-understanding-the-link-and-managing-the-risk/ (accessed on 15 January 2022).
- Lee, C.C. Utilizing synoptic climatological methods to assess the impacts of cli-mate change on future tornado-favorable environments. Nat. Hazards 2012, 62, 325–343. [Google Scholar] [CrossRef]
- Suarez, P.; Anderson, W.; Mahal, V.; Lakshmanan, T.R. Impacts of flooding and climate change on urban transportation: A systemwide performance assessment of the Boston Metro Area. Trans. Res. Part D Trans. Environ. 2005, 10, 231–244. [Google Scholar] [CrossRef]
- Evans, E.P.; Ashley, R.M.; Hall, J.; Penning-Rowsell, E.; Saul, A.; Sayers, P.; Thorne, C.; Watkinson, A. Foresight; Future Flooding. Scientific Summary. Volume I: Future Risks and Their Drivers; Office of Science and Technology: London, UK, 2004. [Google Scholar]
- Evans, E.P.; Ashley, R.M.; Hall, J.; Penning-Rowsell, E.; Sayers, P.; Thorne, C.; Watkinson, A. Foresight; Future Flooding. Scientific Summary. Volume II: Managing Future Risks; Office of Science and Technology: London, UK, 2004. [Google Scholar]
- Ashley, R.M.; Balmforth, D.J.; Saul, A.J.; Blanskby, J.D. Flooding in the future-predicting climate change, risks and responses in urban areas. Water Sci. Technol. 2005, 52, 265–273. [Google Scholar] [CrossRef]
- Centers for Disease Control and Prevention (CDCP). Wildfire Smoke: A Guide for Public Health Officials. 2019. Available online: https://www.cdc.gov/air/wildfire-smoke/default.htm (accessed on 15 January 2022).
- Masson-Delmotte, V.; Zhai, P.; Pörtner, H.-O.; Roberts, D.; Skea, J.; Shukla, P.R.; Pirani, A.; Moufouma-Okia, W.; Péan, C.; Pidcock, R.; et al. Global Warming of 1.5 °C: Special Report; Intergovernmental Panel on Climate Change: Geneva, Switzerland, 2018; Available online: https://www.ipcc.ch/sr15/ (accessed on 15 January 2022).
- Bowman, D.M.J.S.; Kolden, C.A.; Abatzoglou, J.T.; Johnston, F.H.; van der Werf, G.R.; Flannigan, M. Vegetation fires in the Anthropocene. Nat. Rev. Earth Environ. 2020, 1, 500–515. [Google Scholar] [CrossRef]
- Swain, D.L.; Langenbrunner, B.; Neelin, J.D.; Hall, A. Increasing precipitation volatility in twenty-first-century California. Nat. Clim. Change 2018, 8, 427–433. [Google Scholar] [CrossRef]
- Karnauskas, K.B.; Lundquist, J.K.; Zhang, L. Southward shift of the global wind energy resource under high carbon dioxide emissions. Nat. Geosci. 2017, 11, 38–43. [Google Scholar] [CrossRef]
- Xu, R.; Yu, P.; Abramson, M.J.; Johnston, F.H.; Samet, J.M.; Bell, M.L.; Haines, A.; Ebi, K.L.; Liu, S.; Guo, Y. Wildfires, global climate change, and human health. N. Engl. J. Med. 2020, 383, 2173–2181. [Google Scholar] [CrossRef]
- Summers, J.K.; Smith, L.M.; Harwell, L.C.; Buck, K.D. Conceptualizing holistic community resilience to climate events: Foundation for a climate resilience screening index. GeoHealth 2017, 1, 151–164. [Google Scholar] [CrossRef] [Green Version]
- Summers, J.K.; Harwell, L.C.; Buck, K.D.; Smith, L.M.; Vivian, D.N.; Bousquin, J.J.; Harvey, J.E.; Hafner, S.F.; McLaughlin, M.D. Resilience Screening Index (CRSI): An Assessment of Resilience to Acute Meteorological Events and Selected Natural Hazards. 2017; EPA/600/R-17/238. Available online: https://nepis.epa.gov/Exe/ZyNET.exe/P100SSN6.TXT?ZyActionD=ZyDocument&Client=EPA&Index=2016+Thru+2020&Docs=&Query=&Time=&EndTime=&SearchMeth-od=1&TocRestrict=n&Toc=&TocEntry=&QField=&QFieldYear=&QFieldMonth=&QFieldDay=&IntQFieldOp=0&ExtQFieldOp=0&XmlQuery=&File=D%3A%5Czyfiles%5CIndex%20Data%5C16thru20%5CTxt%5C00000005%5CP100SSN6.txt&User=ANONYMOUS&Password=anonymous&SortMethod=h%7C-&MaximumDocuments=1&FuzzyDegree=0&ImageQuality=r75g8/r75g8/x150y150g16/i425&Display=hpfr&DefSeekPage=x&SearchBack=ZyActionL&Back=ZyActionS&BackDesc=Results%20page&MaximumPages=1&ZyEntry=1&SeekPage=x&ZyPURL (accessed on 15 January 2022).
- Summers, J.K.; Harwell, L.C.; Buck, K.D.; Smith, L.M.; Vivian, D.N.; Bousquin, J.J.; Harvey, J.E.; Hafner, S.F.; McLaughlin, M.D.; McMillion, C.A. Development of a Cumulative Resilience Screening Index (CRSI) for Natural Hazards: An Assessment of Resilience to Acute Meteorological Events and Selected Natural Hazards. 2020; EPA/600/R-20/274. Available online: https://cfpub.epa.gov/si/si_public_record_Report.cfm?dirEntryId=350154&Lab=CEMM (accessed on 15 January 2022).
- Summers, J.K.; Harwell, L.C.; Smith, L.M.; Buck, K.D. Measuring community resil-ience to natural hazards—The natural hazard resilience screening index (NaHR-SI): Development and application to the US. GeoHealth 2018, 2, 372–394. [Google Scholar] [CrossRef]
- Huang, Q.; Cervone, G.; Zhang, G. A cloud-enabled automatic disaster analysis system of multi-sourced data streams: An example synthesizing social media, re-mote sensing and Wikipedia data. Comput. Environ. Urban Syst. 2017, 66, 23–37. [Google Scholar] [CrossRef]
- Kawamura, Y.; Dewan, A.; Veenendaal, B.; Hayashi, M.; Shibuya, T.; Kitahara, I.; Nobuhara, H.; Ishii, K. Using GIS to develop a mobile communications network for disaster-damaged areas. Int. J. Digit. Earth 2013, 7, 279–293. [Google Scholar] [CrossRef]
- Li, Z.; Wang, C.; Emrich, C.T.; Guo, D. A novel approach to leveraging social media for rapid flood mapping: A case study of the 2015 South Carolina floods. Cartogr. Geogr. Inf. Sci. 2017, 45, 97–110. [Google Scholar] [CrossRef]
- Massey, F.J., Jr. The Kolmogorov-Smirnov test for goodness of fit. J. Am. Stat. Assoc. 1951, 46, 68–78. [Google Scholar] [CrossRef]
- Fasano, G.; Franceschini, A. A multidimensional version of the Kolmogo-rov-Smirnov test. Mon. Not. R. Astron. Soc. 1987, 225, 155–170. [Google Scholar] [CrossRef]
- Engmann, S.; Cousineau, D. Comparing distributions: The two-sample Ander-son-Darling test as an alternative to the Kolmogorov-Smirnoff test. J. Appl. Quant. Methods 2011, 6, 1–17. [Google Scholar]
- Michener, W.K.; Blood, E.R.; Bildstein, K.L.; Brinson, M.M.; Gardner, L.R. Climate change, hurricanes and tropical storms, and rising sea level in coastal wetlands. Ecol. Appl. 1997, 7, 770–801. [Google Scholar] [CrossRef]
- Raper, S.C.B. Observational data on the relationships between climatic change and the frequency and magnitude of severe tropical storms. In Climate and Sea Level Change: Observations, Projections and Implications; Warrick, R.A., Barrow, E.M., Wigley, T.M.L., Eds.; Cambridge University Press: Cambridge, UK, 1993; pp. 192–212. [Google Scholar]
- Walsh, K.J.; McBride, J.L.; Klotzbach, P.J.; Balachandran, S.; Camargo, S.J.; Hol-land, G.; Knutson, T.R.; Kossin, J.; Lee, T.; Sobel, A.; et al. Tropical cyclones and climate change. Wiley Interdiscip. Rev.: Clim. Change 2016, 7, 65–89. [Google Scholar] [CrossRef]
- McDonald, R.E.; Bleaken, D.G.; Cresswell, D.R.; Pope, V.D.; Senior, C.A. Tropical storms: Representation and diagnosis in climate models and the impacts of cli-mate change. Clim. Dyn. 2005, 25, 19–36. [Google Scholar] [CrossRef]
- Luo, X.; Cruz, A.M.; Tzioutzios, D. Climate change and temporal-spatial variation of tropical storm-related Natechs in the United States from 1990 to 2017: Is there a link? Int. J. Disaster Risk Reduct. 2021, 62, 102366. [Google Scholar] [CrossRef]
- Brooks, H.E.; Carbin, G.W.; Marsh, P.T. Increased variability of tornado occur-rence in the United States. Science 2014, 346, 349–352. [Google Scholar] [CrossRef]
- Gensini, V.A.; Brooks, H.E. Spatial trends in United States tornado frequency. NPJ Clim. Atmospheric Sci. 2018, 1, 38. [Google Scholar] [CrossRef] [Green Version]
- Abatzoglou, J.T.; Williams, A.P. Impact of anthropogenic climate change on wildfire across western US forests. Proc. Natl. Acad. Sci. USA 2016, 113, 11770–11775. [Google Scholar] [CrossRef] [Green Version]
- Halofsky, J.E.; Peterson, D.L.; Harvey, B.J. Changing wildfire, changing forests: The effects of climate change on fire regimes and vegetation in the Pacific Northwest, USA. Fire Ecol. 2020, 16, 1–26. [Google Scholar] [CrossRef] [Green Version]
- Knox, J.C. Sensitivity of modern and Holocene floods to climate change. Quat. Sci. Rev. 2000, 19, 439–457. [Google Scholar] [CrossRef]
- Kirshen, P.; Knee, K.; Ruth, M. Climate change and coastal flooding in Metro Boston: Impacts and adaptation strategies. Clim. Change 2008, 90, 453–473. [Google Scholar] [CrossRef]
- Gavin, N.T.; Leonard-Milsom, L.; Montgomery, J. Climate change, flooding and the media in Britain. Public Underst. Sci. 2011, 20, 422–438. [Google Scholar] [CrossRef] [PubMed]
- Kundzewicz, Z.; Kanae, S.; Seneviratne, S.; Handmer, J.; Nicholls, N.; Peduzzi, P.; Mechler, R.; Bouwer, L.M.; Arnell, N.; Mach, K.; et al. Flood risk and climate change: Global and regional perspectives. Hydrol. Sci. J. 2013, 59, 1–28. [Google Scholar] [CrossRef] [Green Version]
- Oliver-Smith, A.; Hoffman, S.M. The Angry Earth: Disaster in Anthropological Perspective; Routledge: Milton Park, UK, 2019; p. 418. [Google Scholar]
- Gray, B.J.; Long, M.; Gill, D.A.; Dunlap, R.E.; Straub, A.M. Politics, climate change, and earthquakes: Public perceptions of oil and gas impacts in Oklahoma. Energy Res. Soc. Sci. 2019, 58, 101251. [Google Scholar] [CrossRef]
- McInnes, R.; Jakeways, J.; Fairbank, H.; Mathie, E. Landslides and Climate Change: Challenges and Solutions. In Proceedings of the International Conference on Landslides and Climate Change, Ventnor, UK, 21–24 May 2007. [Google Scholar]
- Jakob, M. Landslides in a changing climate. In Landslide Hazards, Risks, and Disasters; Schroder, J., Davies, T., Eds.; Elsevier: Amsterdam, The Netherlands, 2022; pp. 505–579. [Google Scholar]
- Loukas, A.; Vasiliades, L.; Tzabiras, J. Climate change effects on drought severity. Adv. Geosci. 2008, 17, 23–29. [Google Scholar] [CrossRef] [Green Version]
- Craig, C.; Feng, S.; Gilbertz, S. Water crisis, drought, and climate change in the southeast United States. Land Use Policy 2019, 88, 104110. [Google Scholar] [CrossRef]
- Kim, T.-W.; Jehanzaib, M. Drought Risk Analysis, Forecasting and Assessment under Climate Change. Water 2020, 12, 1862. [Google Scholar] [CrossRef]
- Littell, J.S.; Peterson, D.L.; Riley, K.L.; Liu, Y.; Luce, C. A review of the relationships between drought and forest fire in the United States. Glob. Chang. Biol. 2016, 22, 2353–2369. [Google Scholar] [CrossRef]


| Natural Hazard Type | Secondary Data Source | Temporal Extent (Target Years: 2000–2019) | Spatial Extent (Target Regions: CONUS, AK, HI, and PR) |
|---|---|---|---|
| Hurricanes and Tropical Storms | International Best Track Archive for Climate Stewardship (IBTrACS) https://www.ncdc.noaa.gov/ibtracs/index.php?name=ib-v4-access | 1980–2021 | CONUS, AK, HI, and PR |
| Tornadoes | NOAA’s Storm Prediction Center (SPC) https://www.spc.noaa.gov/gis/svrgis/ | 1950–2018 | |
| Landslides | USGS’s Landslide Inventories across the United States https://www.sciencebase.gov/catalog/item/5c7065b4e4b0fe48cb43fbd7 | 1900–2018 | |
| Wildfires | National Interagency Fire Center, Interagency Fire Perimeter History —All Years https://data-nifc.opendata.arcgis.com/datasets/interagency-fire-perimeter-history-all-years/explore?location=43.578757%2C63.134208%2C3.57 | 1835–2019 | |
| Drought | US Drought Monitor https://droughtmonitor.unl.edu/DmData/DataDownload.aspx | 2000–2020 | CONUS, Most of AK, HI, and PR |
| Coastal Flooding | Coastal Flood Exposure Mapper, Coastal Flood Hazard Composite Layer https://coast.noaa.gov/floodexposure/#-10575352,4439107,5z | 2019 | CONUS, HI, and PR |
| Inland Flooding | National Flood Hazard Layer (NFHL), Seamless Nationwide NFHL GIS data https://catalog.data.gov/dataset/national-flood-hazard-layer-nfhl | 2019 | CONUS, HI, AK, and PR |
| Earthquakes | Short-term Induced Seismicity Models https://www.usgs.gov/natural-hazards/earthquake-hazards/science/short-term-induced-seismicity-models?qt-science_center_objects=0#qt-science_center_objects | 2016–2018 | CONUS |
| Natural Hazard | Year Increment | Number of County-Year Combinations | Counties Not Impacted | Counties Impacted | Percent Counties Impacted |
|---|---|---|---|---|---|
| Coastal Flooding | 2015–2019 | 3220 | 2875 | 345 | 10.71 |
| Inland Flooding | 2015–2019 | 3220 | 222 | 2998 | 93.11 |
| Earthquakes | 2015–2019 | 9324 | 8643 | 681 | 7.30 |
| Drought | 2000–2004 | 16,040 | 8845 | 7195 | 44.86 |
| 2005–2009 | 16,040 | 9684 | 6356 | 39.63 | |
| 2010–2014 | 16,040 | 9110 | 6930 | 43.20 | |
| 2015–2019 | 16,040 | 10,598 | 5442 | 33.93 | |
| Hurricanes | 2000–2004 | 16,100 | 15,268 | 832 | 5.17 |
| 2005–2009 | 16,100 | 15,389 | 711 | 4.42 | |
| 2010–2014 | 16,100 | 15,503 | 597 | 3.71 | |
| 2015–2019 | 16,100 | 15,006 | 1094 | 6.80 | |
| Tropical Storms | 2000–2004 | 16,100 | 14,547 | 1553 | 9.65 |
| 2005–2009 | 16,100 | 14,596 | 1504 | 9.34 | |
| 2010–2014 | 16,100 | 15,314 | 786 | 4.88 | |
| 2015–2019 | 16,100 | 14,767 | 1333 | 8.28 | |
| Tornadoes | 2000–2004 | 16,100 | 14,082 | 2018 | 12.53 |
| 2005–2009 | 16,100 | 13,698 | 2402 | 14.92 | |
| 2010–2014 | 16,100 | 13,451 | 2649 | 16.45 | |
| 2015–2019 | 16,100 | 10,751 | 2129 | 13.22 | |
| Landslides | 2000–2004 | 16,100 | 16,029 | 71 | 0.44 |
| 2005–2009 | 16,100 | 16,052 | 48 | 0.30 | |
| 2010–2014 | 16,100 | 16,086 | 14 | 0.09 | |
| 2015–2019 | 12,880 | 12,861 | 19 | 0.12 | |
| Wildfires | 2000–2004 | 16,100 | 14,673 | 1427 | 8.86 |
| 2005–2009 | 16,100 | 14,533 | 1567 | 9.73 | |
| 2010–2014 | 16,100 | 14,433 | 1667 | 10.35 | |
| 2015–2019 | 16,100 | 14,595 | 1505 | 9.35 |
| Natural Hazard | Time Interval | KS Test Interval | 0% | 20% | 40% | 60% | 80% | 100% | KS | AD |
|---|---|---|---|---|---|---|---|---|---|---|
| Coastal Flooding | 4 | n.a. | 0.01 | 3.49 | 11.18 | 23.45 | 44.61 | 100 | n.a. | n.a. |
| Inland Flooding | 4 | n.a. | 0.01 | 25.86 | 99.95 | 99.98 | 100 | 100 | n.a. | n.a. |
| Earthquakes | 4 | n.a. | 0.01 | 15.88 | 56.43 | 98.78 | 100 | 100 | n.a. | n.a. |
| Drought | 1 | 1 to 2 | 0.01 | 3.77 | 11.80 | 30.63 | 60.55 | 100 | *** | *** |
| 2 | 2 to 3 | 0.01 | 3.60 | 12.91 | 25.17 | 44.23 | 100 | *** | *** | |
| 3 | 3 to 4 | 0.01 | 6.42 | 18.28 | 37.09 | 61.65 | 100 | *** | *** | |
| 4 | 1 to 4 | 0.01 | 1.70 | 5.17 | 11.21 | 25.13 | 100 | *** | *** | |
| Hurricanes | 1 | 1 to 2 | 0.01 | 81.51 | 100 | 100 | 100 | 100 | ** | *** |
| 2 | 2 to 3 | 0.08 | 66.38 | 100 | 100 | 100 | 100 | *** | *** | |
| 3 | 3 to 4 | 0.01 | 79.12 | 100 | 100 | 100 | 100 | *** | *** | |
| 4 | 1 to 4 | 0.02 | 84.69 | 100 | 100 | 100 | 100 | *** | *** | |
| Tropical Storms | 1 | 1 to 2 | 0.01 | 61.02 | 100 | 100 | 100 | 100 | * | *** |
| 2 | 2 to 3 | 0.01 | 49.95 | 100 | 100 | 100 | 100 | * | *** | |
| 3 | 3 to 4 | 0.01 | 56.40 | 100 | 100 | 100 | 100 | *** | *** | |
| 4 | 1 to 4 | 0.01 | 60.77 | 100 | 100 | 100 | 100 | * | *** | |
| Tornadoes | 1 | 1 to 2 | 0.01 | 0.01 | 0.03 | 0.08 | 0.22 | 9.08 | n.s. | *** |
| 2 | 2 to 3 | 0.01 | 0.01 | 0.03 | 0.09 | 0.28 | 7.91 | n.s. | *** | |
| 3 | 3 to 4 | 0.01 | 0.02 | 0.04 | 0.11 | 0.38 | 8.80 | n.s. | *** | |
| 4 | 1 to 4 | 0.01 | 0.01 | 0.04 | 0.09 | 0.29 | 9.05 | n.s. | *** | |
| Landslides | 1 | 1 to 2 | 0.01 | 0.01 | 0.07 | 0.18 | 0.65 | 6.07 | n.s. | ** |
| 2 | 2 to 3 | 0.01 | 0.04 | 0.11 | 0.52 | 1.31 | 6.26 | n.s. | * | |
| 3 | 3 to 4 | 0.01 | 0.01 | 0.01 | 0.01 | 0.02 | 0.94 | n.s. | n.a. | |
| 4 | 1 to 4 | 0.01 | 0.01 | 0.03 | 0.46 | 1.26 | 7.11 | n.s. | n.s. | |
| Wildfires | 1 | 1 to 2 | 0.01 | 0.02 | 0.05 | 0.15 | 0.57 | 49.27 | n.s. | *** |
| 2 | 2 to 3 | 0.01 | 0.02 | 0.07 | 0.18 | 0.64 | 40.58 | n.s. | *** | |
| 3 | 3 to 4 | 0.01 | 0.02 | 00.06 | 0.17 | 0.66 | 33.01 | n.s. | *** | |
| 4 | 1 to 4 | 0.01 | 0.02 | 0.05 | 0.17 | 0.75 | 64.05 | n.s. | *** |
Publisher’s Note: MDPI stays neutral with regard to jurisdictional claims in published maps and institutional affiliations. |
© 2022 by the authors. Licensee MDPI, Basel, Switzerland. This article is an open access article distributed under the terms and conditions of the Creative Commons Attribution (CC BY) license (https://creativecommons.org/licenses/by/4.0/).
Share and Cite
Summers, J.K.; Lamper, A.; McMillion, C.; Harwell, L.C. Observed Changes in the Frequency, Intensity, and Spatial Patterns of Nine Natural Hazards in the United States from 2000 to 2019. Sustainability 2022, 14, 4158. https://doi.org/10.3390/su14074158
Summers JK, Lamper A, McMillion C, Harwell LC. Observed Changes in the Frequency, Intensity, and Spatial Patterns of Nine Natural Hazards in the United States from 2000 to 2019. Sustainability. 2022; 14(7):4158. https://doi.org/10.3390/su14074158
Chicago/Turabian StyleSummers, J. K., A. Lamper, C. McMillion, and L. C. Harwell. 2022. "Observed Changes in the Frequency, Intensity, and Spatial Patterns of Nine Natural Hazards in the United States from 2000 to 2019" Sustainability 14, no. 7: 4158. https://doi.org/10.3390/su14074158
APA StyleSummers, J. K., Lamper, A., McMillion, C., & Harwell, L. C. (2022). Observed Changes in the Frequency, Intensity, and Spatial Patterns of Nine Natural Hazards in the United States from 2000 to 2019. Sustainability, 14(7), 4158. https://doi.org/10.3390/su14074158