Abstract
The expected increase in renewable energy sources (RESs) and electric vehicles (EVs) connected to distribution systems will result in many technical constraints. A meshed network is a promising solution; however, some remarkable challenges must be overcome. Among these, this paper mainly focuses on the line overload and short circuit current of a networked distribution system (NDS) in Korea, an advanced form of meshed network. An NDS refers to a system in which there exists permanent linkages between four feeders and N × N communication-based protection. We propose a method, which employs the tap changing control algorithm of the series reactor to control line overload and short circuit current. MATLAB/Simulink was used to evaluate the proposed method. Three different types of distribution system were employed. First, the utilization rate and feeder imbalance were analyzed in steady-state condition. Subsequently, the short circuit current was analyzed in short circuit condition. The results revealed that the proposed method can effectively prevent line overload in up to 82.7% of cases, enhance the utilization rate by up to 79.9%, and relieve the short circuit current; that is, it can contribute to system stability and the economic operation of an NDS.
1. Introduction
1.1. Motivation and Aims
As global climate change and energy-related concerns are growing, reducing dependence on fossil fuels and the emission of CO2 is becoming a major part of the global agenda [1]. This will eventually create a future scenario that is characterized by a large number of renewable energy sources (RESs) and electric vehicles (EVs) integrated into medium-voltage (MV) distribution systems [2,3,4]. The behaviors of RESs and EVs are highly uncertain and can affect the energy consumption and power-flow profiles of the system [2]. Therefore, design and operation strategies must be reconsidered to enhance the flexibility of the system to accommodate additional RESs and EVs [5].
Various strategies have been proposed to increase the hosting capacity for RESs and EVs without traditional utility infrastructure upgrades (i.e., line or transformer upgrades) [5,6,7,8,9,10,11]. Among these, several studies referred to meshed networks as a promising solution for integrating significant numbers of RESs and EVs. A meshed network is a new paradigm that is distinct from conventional radial networks [5,9,10,11]. It is an economical alternative to grid expansion when the installation of RESs and EVs is restricted owing to operational constraints, such as thermal limits or voltage rise [12,13]. In addition, the transition to meshed networks can provide various benefits, such as improvement of reliability, power quality, and voltage profile and reduction of loss [14,15,16,17].
Owing to its significant advantages, the meshed network is increasingly becoming a preferred alternative, especially for distribution systems. Hence, in this study, we focused on the prospects of an operating distribution system with a meshed manner. The benefits were quantified in terms of the additional flexibility of the system under load fluctuations and the limitation of the short circuit current. Through this, operating the meshed network in a stable, efficient, and permissible state was our final goal.
1.2. Literature Survey
The concept of meshed networks has been addressed over the course of many years. However, it has a low application rate owing to some remarkable challenges. The author of [3] argued that meshing can increase the short circuit current to intolerable values owing to the lowered impedance. This can cause tremendous damage to apparatus, such as mechanical stress and overheating due to faults, and even the replacement of existing breakers. Other authors of [11,18,19] focused on a fast delooper, which was based on using a superconducting fault current limiter to limit the short circuit current. In the case of a fault, the fast delooper rapidly increased the resistance and sent an open signal to the normally closed switches to return the network to a radial manner. This efficiently relieved the short circuit current.
Moreover, the existing protection scheme in a radial network also needs to be revised. The author of [20] proposed a transient-based protection algorithm for the earth fault protection of a meshed, unearthed MV network. This algorithm determined the directionality of the fault based on the angle between the zero-sequence voltage and the current phasors. The author of [21] proposed a dual-setting, directional, overcurrent relay for multisource, meshed distribution networks with distributed generations (DGs). The author of [22] proposed plug-and-play protection schemes that do not require relay settings independent of grid conditions. The author of [23] proposed an adaptive protection scheme in which the parameters (i.e., pickup current, time dial setting) are obtained from the whale optimization algorithm (WOA). The author of [24] aimed to develop an advanced, adaptive protection scheme that can provide protection for both medium- and low-voltage networks when DGs are penetrated. The recloser–fuse coordination was also proposed in [25] with a dual-setting, directional recloser.
Because of the different line lengths and loads on both sides of the circuit, the amplitude and phase of the voltages at both ends can be different [26]. This can cause a large loop current, which can lead to a load imbalance between the feeders and line overload [27,28]. The author of [29] proposed an optimal switching algorithm for a dynamically meshed network to prevent line overloading. Switches could be closed or opened dynamically and flexibly based on continuous monitoring of the grid state. Furthermore, circulating currents could also appear due to the mutual coupling between the positive and negative sequences. This is ignored in radial distribution systems (RDSs) but can negatively influence the protection devices in meshed networks [30].
From the above-mentioned studies, it can be observed that short circuit currents, protection, and line overload are major issues in meshed networks, which require significant attention. Hence, the focus of this study is to prevent line overload and relieve the short circuit current simultaneously. We employ a statically meshed network with permanently closed switches. Existing studies do not address line overload and the short circuit current simultaneously without changing grid topologies.
1.3. Contributions and Organization of the Paper
In Korea, the concept of an NDS, an advanced form of meshed network, has been proposed in recent years. This refers to a system with permanent linkages between the four MV feeders and N × N communication-based protection. NDSs are expected to not only satisfy the increasing demand for power reliability, but also maximize the hosting capacity for RESs and EVs. For the efficient and stable operation of NDSs, this study proposes a novel methodology to control the line overload and short circuit current of the NDS.
The contributions of this paper are summarized as follows:
- The key contribution of this study is to present an operating strategy for preventing line overload and relieving the short circuit current to ensure system stability;
- This paper provides an assessment of the proposed method based on the standards of the Korea Electric Power Corporation (KEPCO) with practical indicators. A review from a practical point of view can facilitate the understanding of NDS operations;
- This study also contributes to the economic operation of NDSs by enhancing the line utilization rate and preventing line extension.
The remainder of this paper is organized as follows: In Section 2, the theoretical backgrounds of the RDS, NDS, and current limiting reactor (CLR) are explained. Practical indicators are also described. Subsequently, a method for preventing line overload and reducing the short circuit current is presented. In Section 3, the simulation setup for the case studies is explained. In Section 4, case studies of the proposed method are performed using MATLAB/Simulink software. Finally, we discuss and conclude the paper in Section 5.
2. Proposed Method
2.1. Theoretical Background
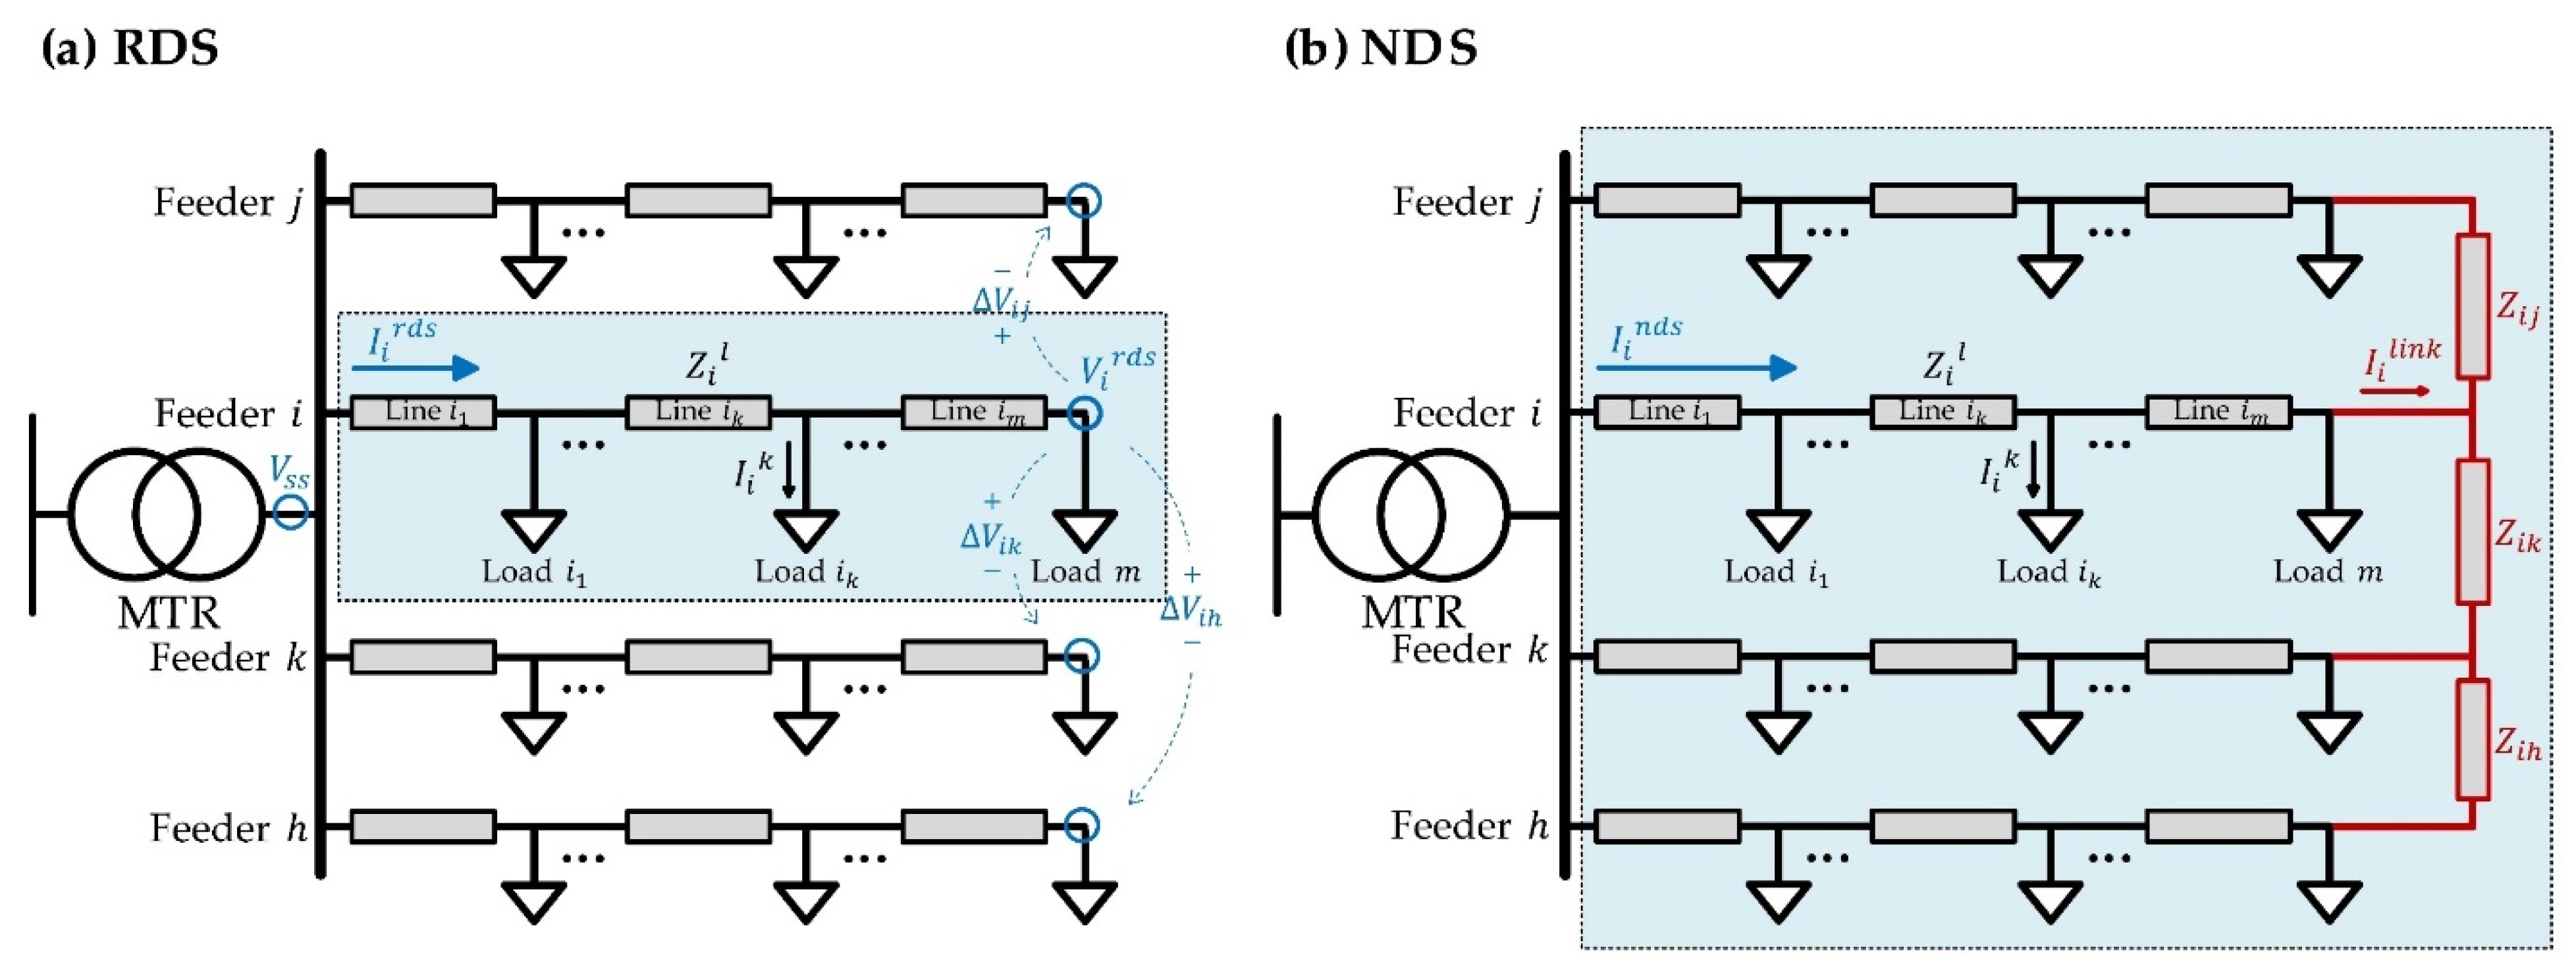
Figure 1 illustrates the schematic diagram of (a) an RDS and (b) an NDS. Each system has four feeders withdrawn from the same main transformer (MTR) in which the distribution lines and loads are connected. The nomenclature used in Figure 1 is presented in Table 1. The main difference between the two systems is the existence of permanent linkages between the four feeders, which markedly change the system operations.
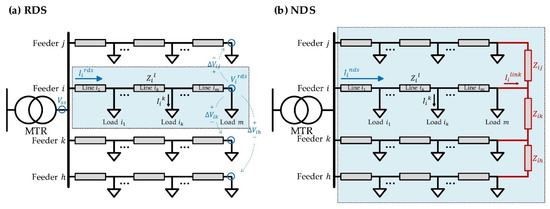
Figure 1.
The schematic diagram of distribution system, including (a) RDS and (b) NDS.

Table 1.
The nomenclature in Figure 1.
2.1.1. RDS
In the RDS, the flow of current is relatively simple to analyze because there are no linkages between feeders. The feeder current is determined by the grid conditions of the corresponding feeder, especially the extent to which the loads are connected. This is because the line impedance is diminutive compared to the load impedance, which has little impact on the feeder current. Therefore, the calculation of the feeder current can be expressed by Equation (1), which indicates that the feeder current can be managed by load control.
Consequently, the distribution system operators (DSOs) restrict the load connection per feeder to a certain level (10 MVA in Korea). This is because the feeder current must be maintained under the line rated current for a stable distribution operation. In practice, DSOs perform seasonal load rearrangement, load shedding, and increased capacity reconstruction [31].
In addition, the terminal voltage of the feeder is determined by the line and load conditions of the corresponding feeder, as described in Equation (2). Generally, the line impedance and load configuration of each feeder are different, and the load current fluctuates with high uncertainty [32]. Therefore, it is likely that the terminal voltages of each feeder may vary with a high probability.
2.1.2. NDS
In the NDS, the flow of current is relatively complex to analyze owing to the existence of permanent linkages between the four feeders. As mentioned in Section 2.1.1, the terminal voltages of each feeder may vary with high probability. This creates current flow through the linkage lines between each feeder, as determined by Ohm’s law. Accordingly, the linkage line current flowing into/from the feeder can be calculated using Equation (3), which is the sum of the currents flowing between the feeder and the other three feeders. In addition, the feeder current in the NDS can be obtained as the sum of the feeder current in the RDS and the linkage line current, which is expressed by Equation (4).
Based on the above equations, the feeder current in the NDS is determined by the grid conditions of the corresponding feeder, as well as the grid conditions of the other feeders. This indicates that the operation of the NDS is completely different from the operation of the RDS, which limits the load connection of the corresponding feeder. Therefore, the integrated operation of four feeders is required for the stable operation of the NDS, which has high complexity.
2.1.3. CLR
A CLR is a device that can reduce the short circuit current to protect the apparatus from mechanical stress and overheating due to faults, thereby, protecting the entire system. It can also be used as an economical alternative to breaker replacement if the short circuit current exceeds the interrupting ratings. Figure 2 shows the application of a CLR in a simple distribution system. The principle of the CLR is explained by Equation (5), which limits the short circuit current to the desired level by adjusting the reactance of the CLR. The nomenclatures used in Equation (5) are presented in Table 2.
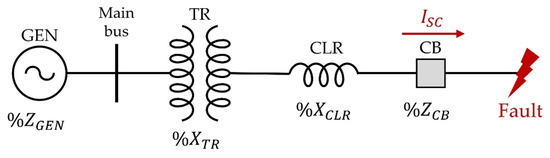
Figure 2.
The application of a CLR in a simple distribution system.
Table 2.
The nomenclature in Equation (5).
2.2. Indicator
2.2.1. Utilization Rate
As mentioned in Section 2.1.1, the feeder current must be maintained within a line rated current to prevent thermal damage to the lines, which can adversely affect system stability. To evaluate this, the line overload can be defined as the degree of the feeder current compared to the line rated current, as shown below. This indicator also serves as a criterion for judging the load capacity of the feeder, as follows: overloading (U.R > 1), appropriate loading (0.5 < U.R < 1), and underloading (U.R < 0.5).
2.2.2. Feeder Imbalance
Feeder imbalance refers to the imbalance of the load distribution among the four feeders in the NDS, which causes the imbalance of load currents between the four feeders. In the NDS, a high feeder imbalance can cause load concentration in a feeder, resulting in line overload. The feeder imbalance can be calculated from the maximum and average feeder currents of each feeder, as follows:
2.2.3. Short Circuit Current
The short circuit current refers to the largest amount of current capable of being delivered to a point on the system during a short circuit condition. The short circuit current reaches its maximum value and then decreases to its steady-state value. This is primarily used to estimate the breaker capacity and necessity of replacing an existing breaker compared to interrupting ratings. Furthermore, it is used to evaluate system stability because the mechanical damage to the power equipment in the system may vary depending on the short circuit current level.
2.3. Proposed Method
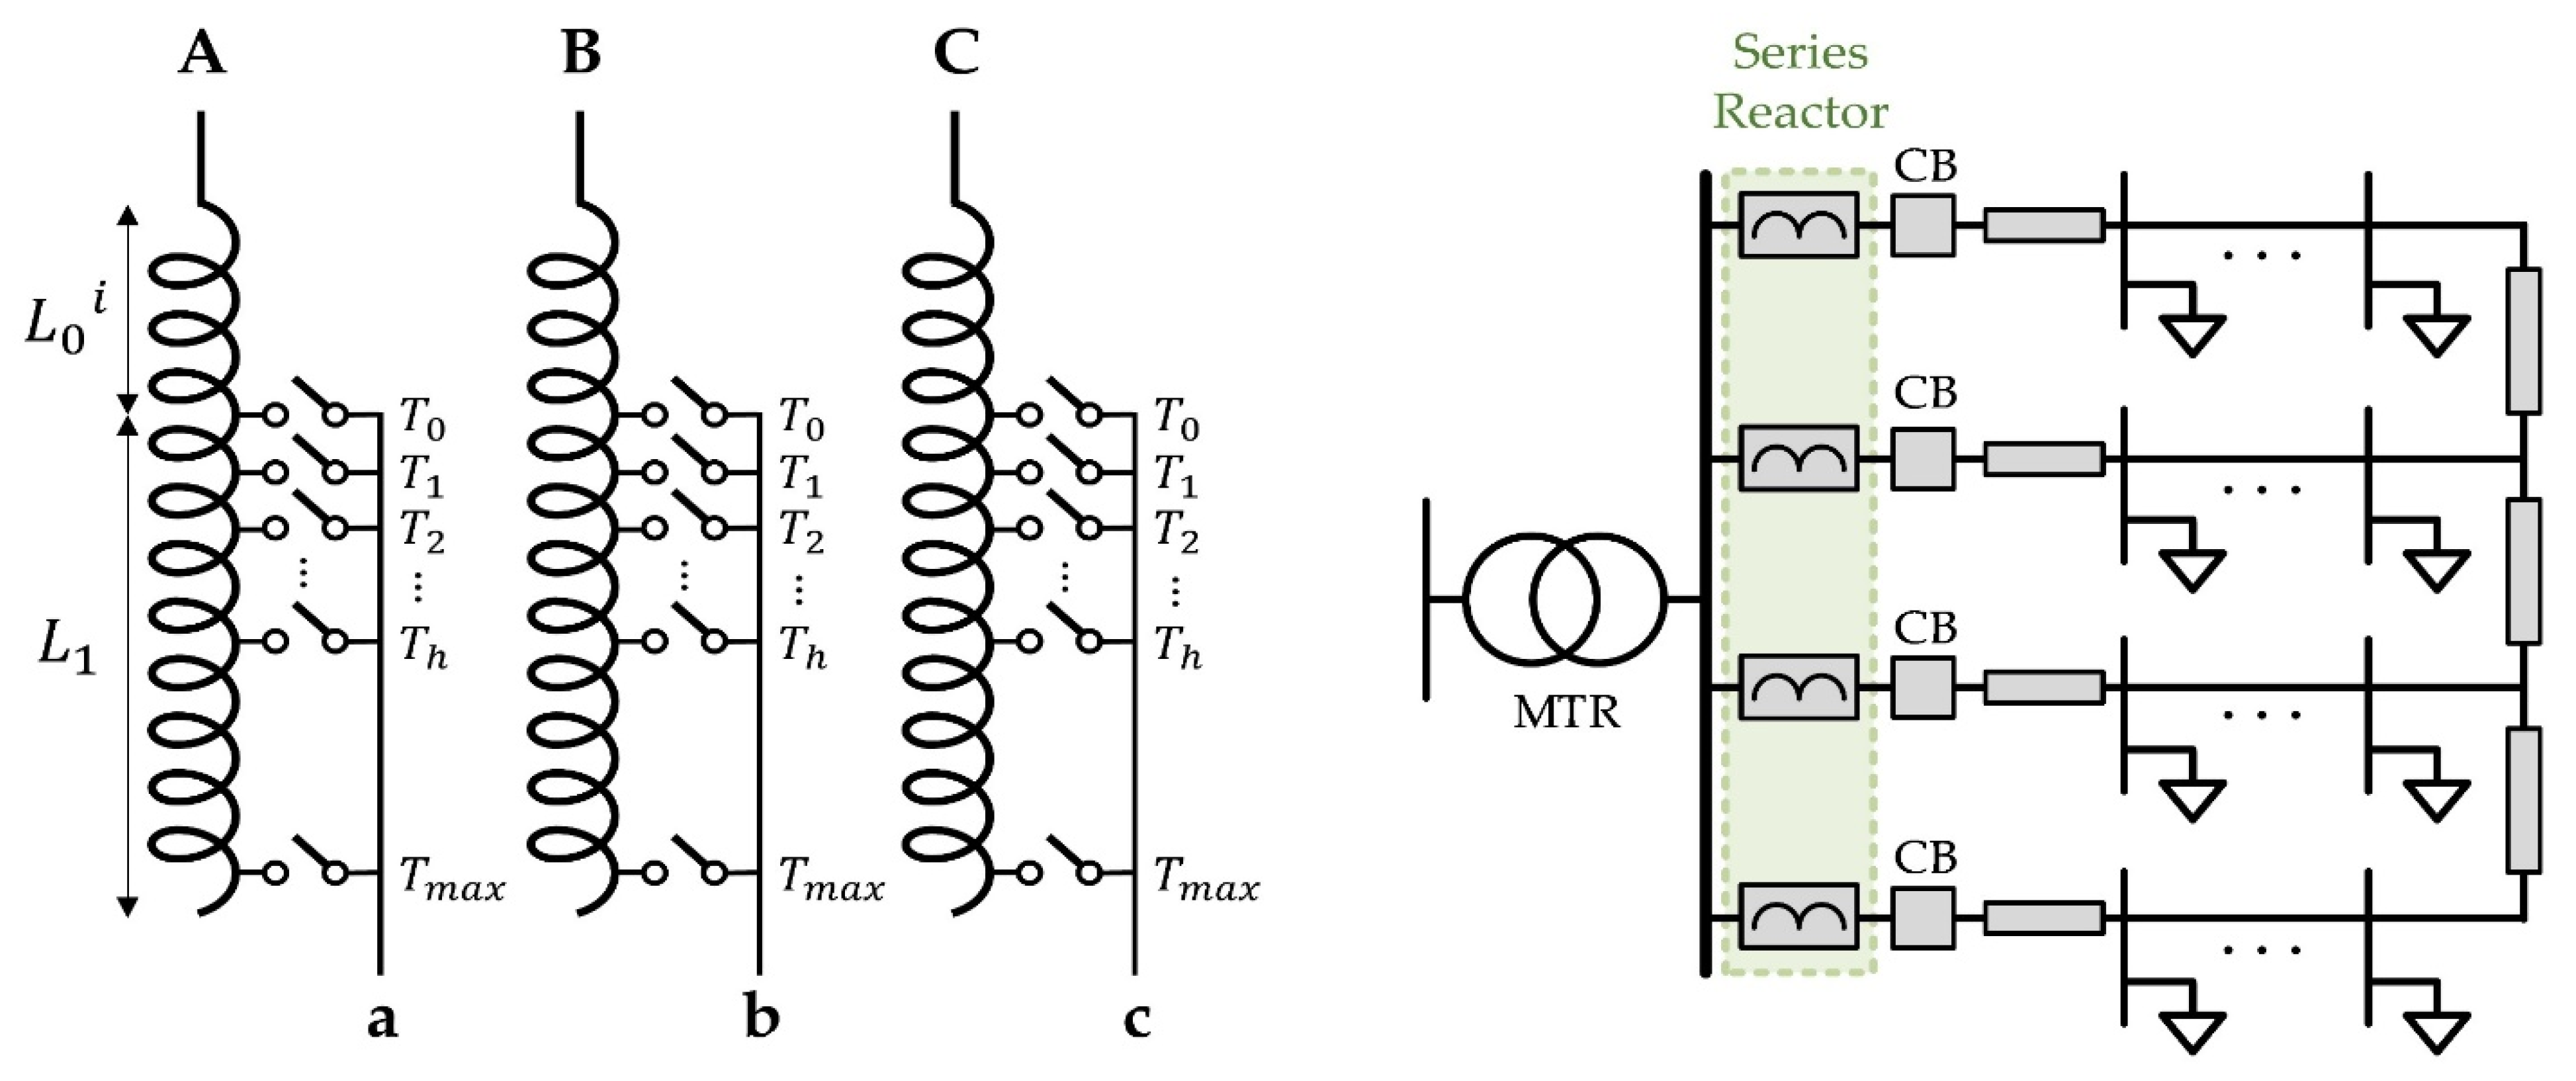
Figure 3 illustrates the structure of the series reactor used in this method and its installation sites in the NDS. The series reactor has h + 2 taps in each phase, and the tap positions of each phase operate in the same way. Table 3 shows the inductance and usage of the series reactor according to the tap positions. The nomenclatures in Table 3 are presented in Table 4. In this method, four series reactors are installed at the entrance of each of the four feeders.
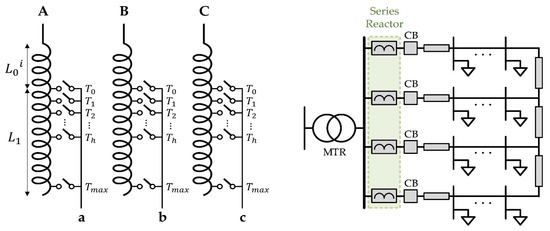
Figure 3.
The structure of series reactor (left) and its installation sites in the NDS (right).
Table 3.
The inductance and usage of the series reactor according to the tap position.
Table 4.
The nomenclature in Table 3.
The proposed method proceeds with the following two steps: First, the line impedances among the four feeders are equalized by setting the initial inductance of each feeder () differently. Subsequently, the tap changer of the series reactor operates based on the proposed algorithm according to the utilization rate and tap position. In this step, the common inductance () is also determined based on the degree of short circuit current limitation.
2.3.1. Step 1: Line Equalization
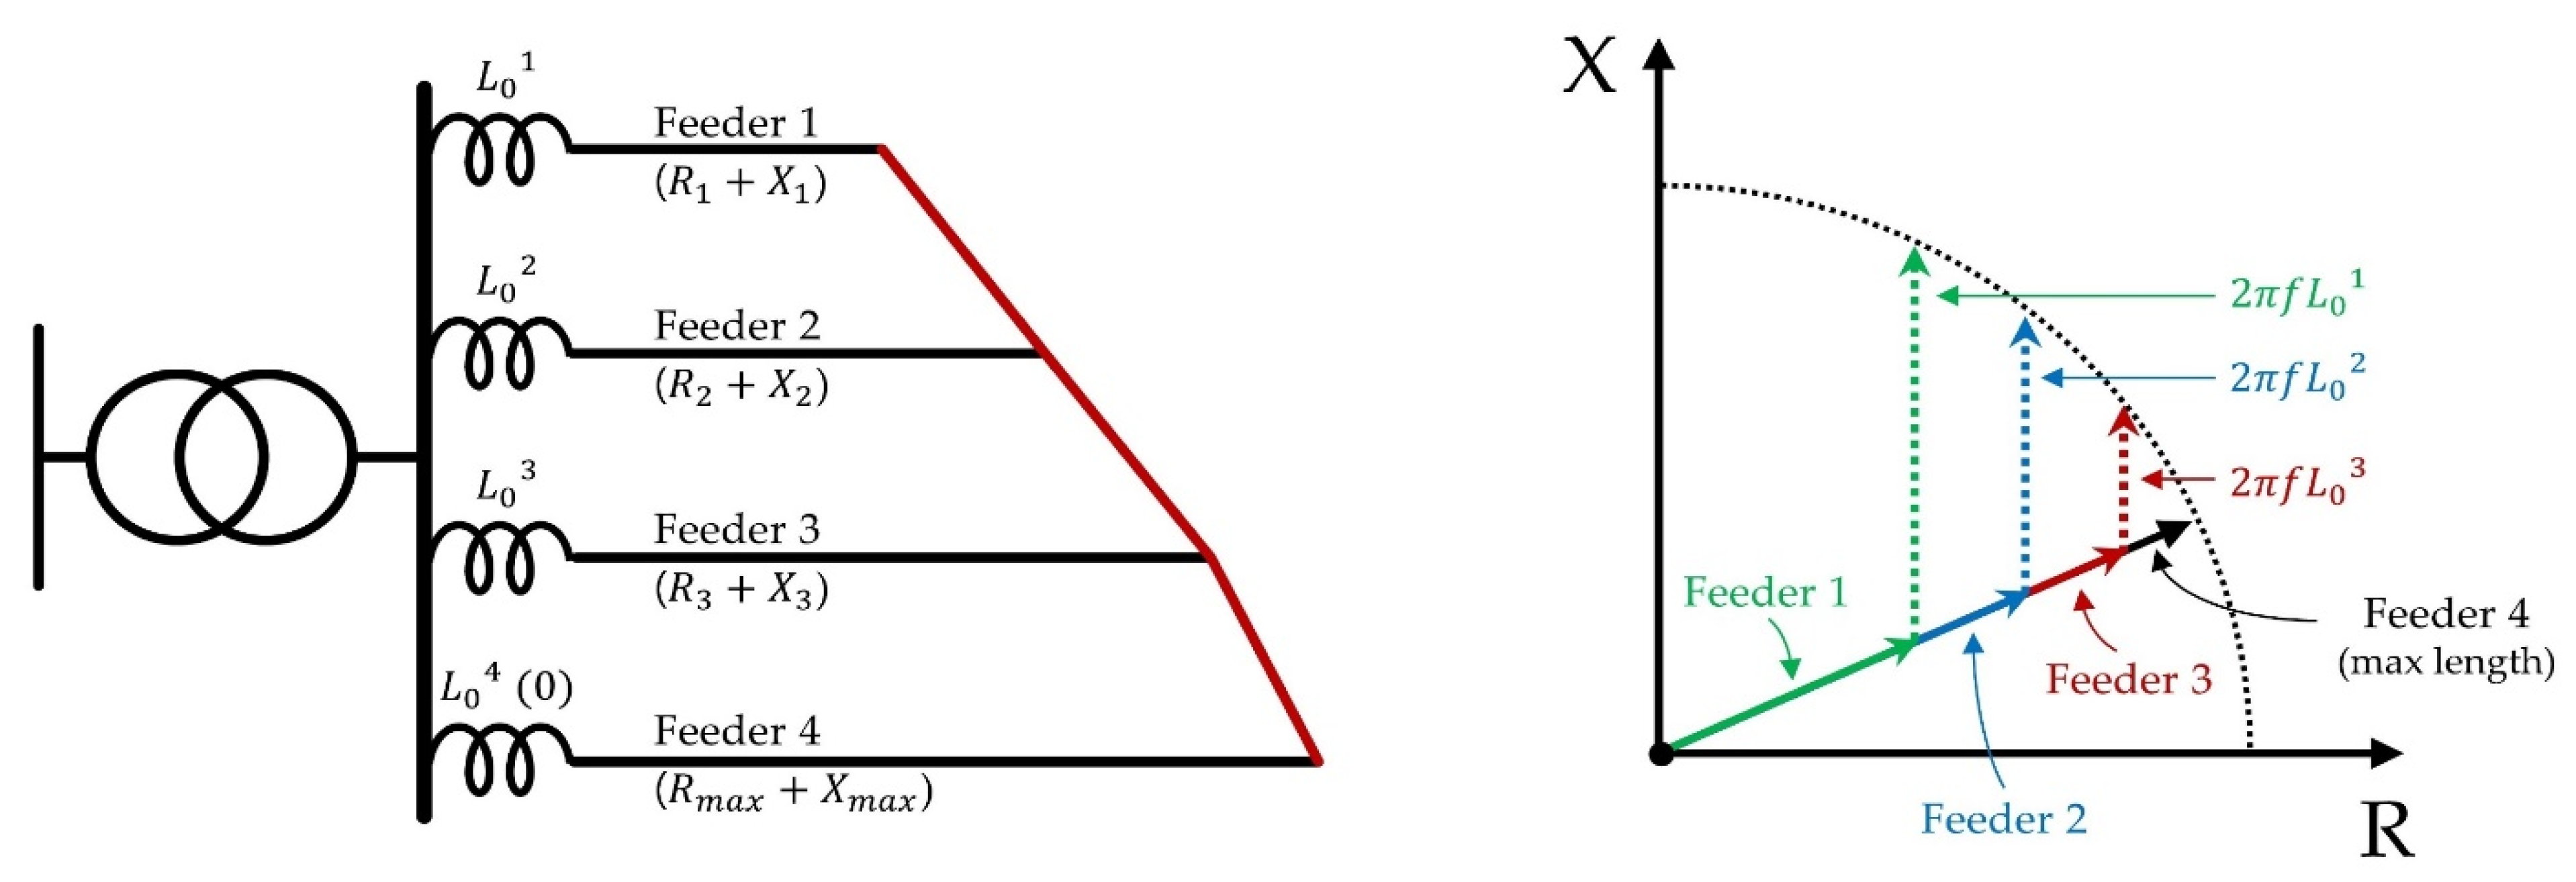
The purpose of equalizing the line impedance among the four feeders is to reduce the difference of terminal voltages, which prevents excessive current flow between feeders and simplifies the current flow of the NDS. Figure 4 shows a schematic diagram of the NDS and the principle of equalizing the line impedance. In the quadrant on the right side, the solid lines indicate the line impedance, and the dotted lines represent the reactance of the series reactor. The initial inductance () of each feeder can be determined based on the maximum line impedance among the four feeders, using Equation (8).
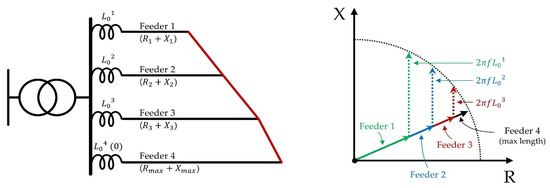
Figure 4.
The schematic diagram of the NDS (left) and the principle of line equalization (right).
2.3.2. Step 2: Tap Changing Control
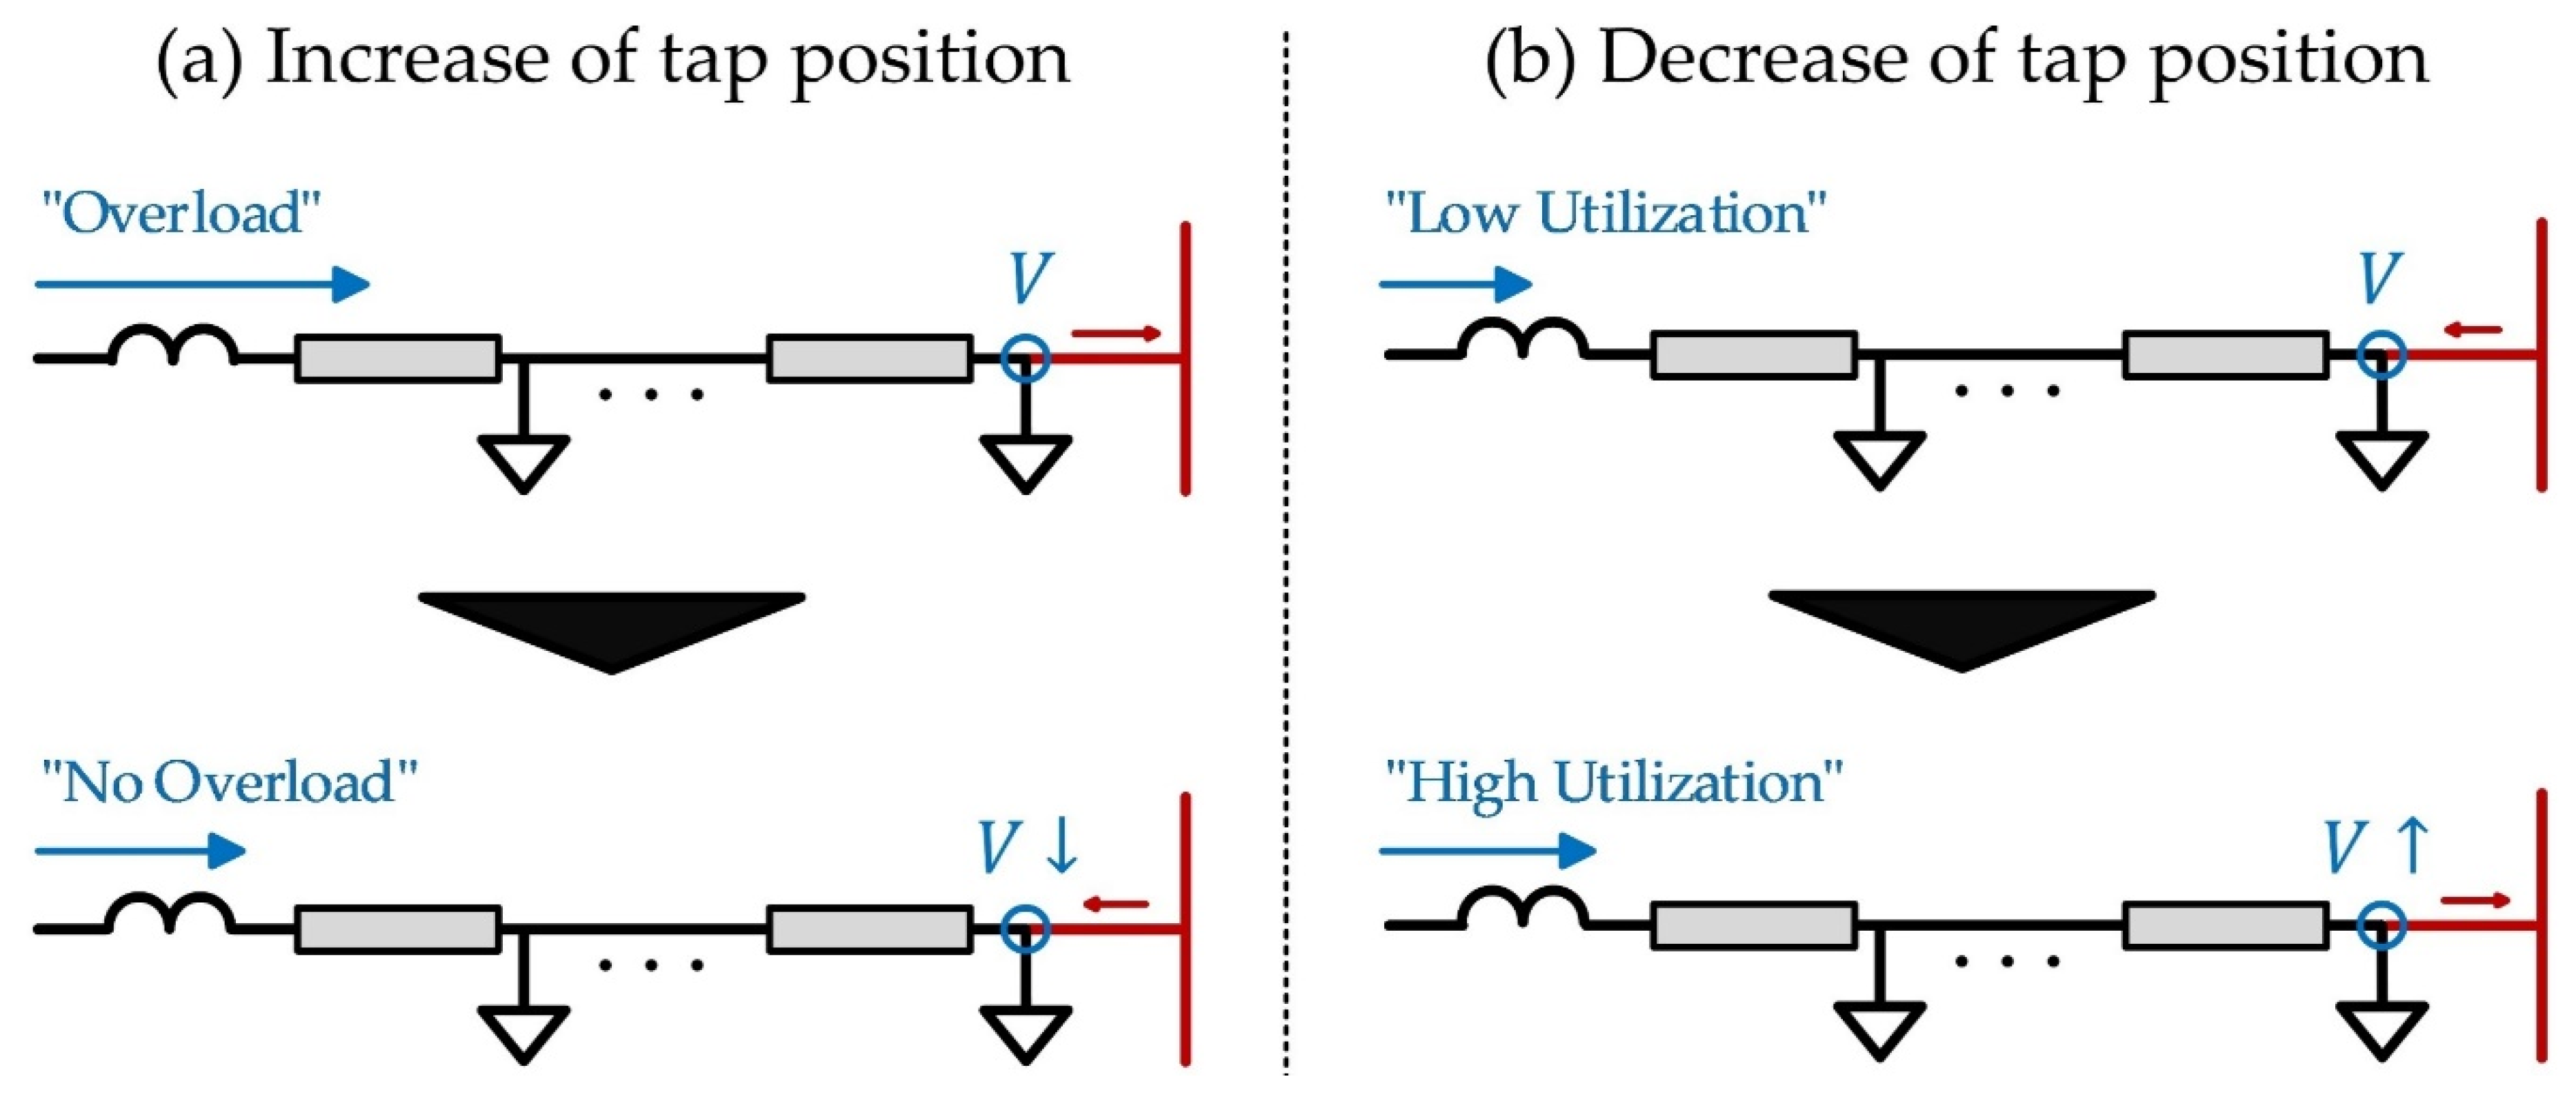
Figure 5 describes the basic principle of the tap changing control of the series reactors. This figure consists of two opposite cases: (a) an increase of tap position and (b) a decrease of tap position. This is based on the adjustment of the terminal voltage of the feeder, which is achieved by changing the inductance of the series reactor (), as shown in Equation (9).
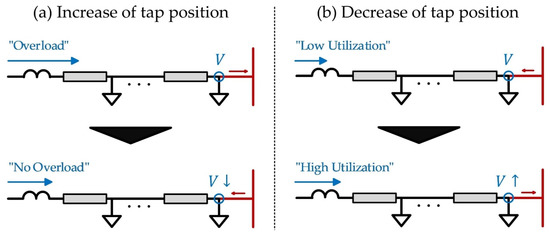
Figure 5.
The effect of changing tap positions of the series reactor.
Increasing the tap position lowers the terminal voltage of the corresponding feeder. This can lead to an increase of the linkage line current flowing into the feeder or a decrease of the linkage line current flowing from the feeder, consequently reducing the feeder current. In contrast, decreasing the tap position increases the terminal voltage of the corresponding feeder. This can increase the linkage line current flowing from the feeder or decrease the linkage line current flowing from the feeder, thereby, increasing the feeder current. Using these principles, the load distribution among the four feeders can be equalized to prevent line overload and enhance the utilization rate.
In addition to the above principle, the series reactor can also be employed to limit the short circuit current to a certain level, such as the CLR, as mentioned in Section 2.1.3. This can be achieved by adjusting the common inductance among the four feeders (). Limiting the short circuit current is not only a way to prevent circuit breaker replacement but is also meaningful in that it reduces tremendous damage to apparatus such as mechanical stress and overheating due to faults. This is especially important in the NDS, where a fault in a single feeder can spread to all four feeders, causing the device to suffer damage more frequently.
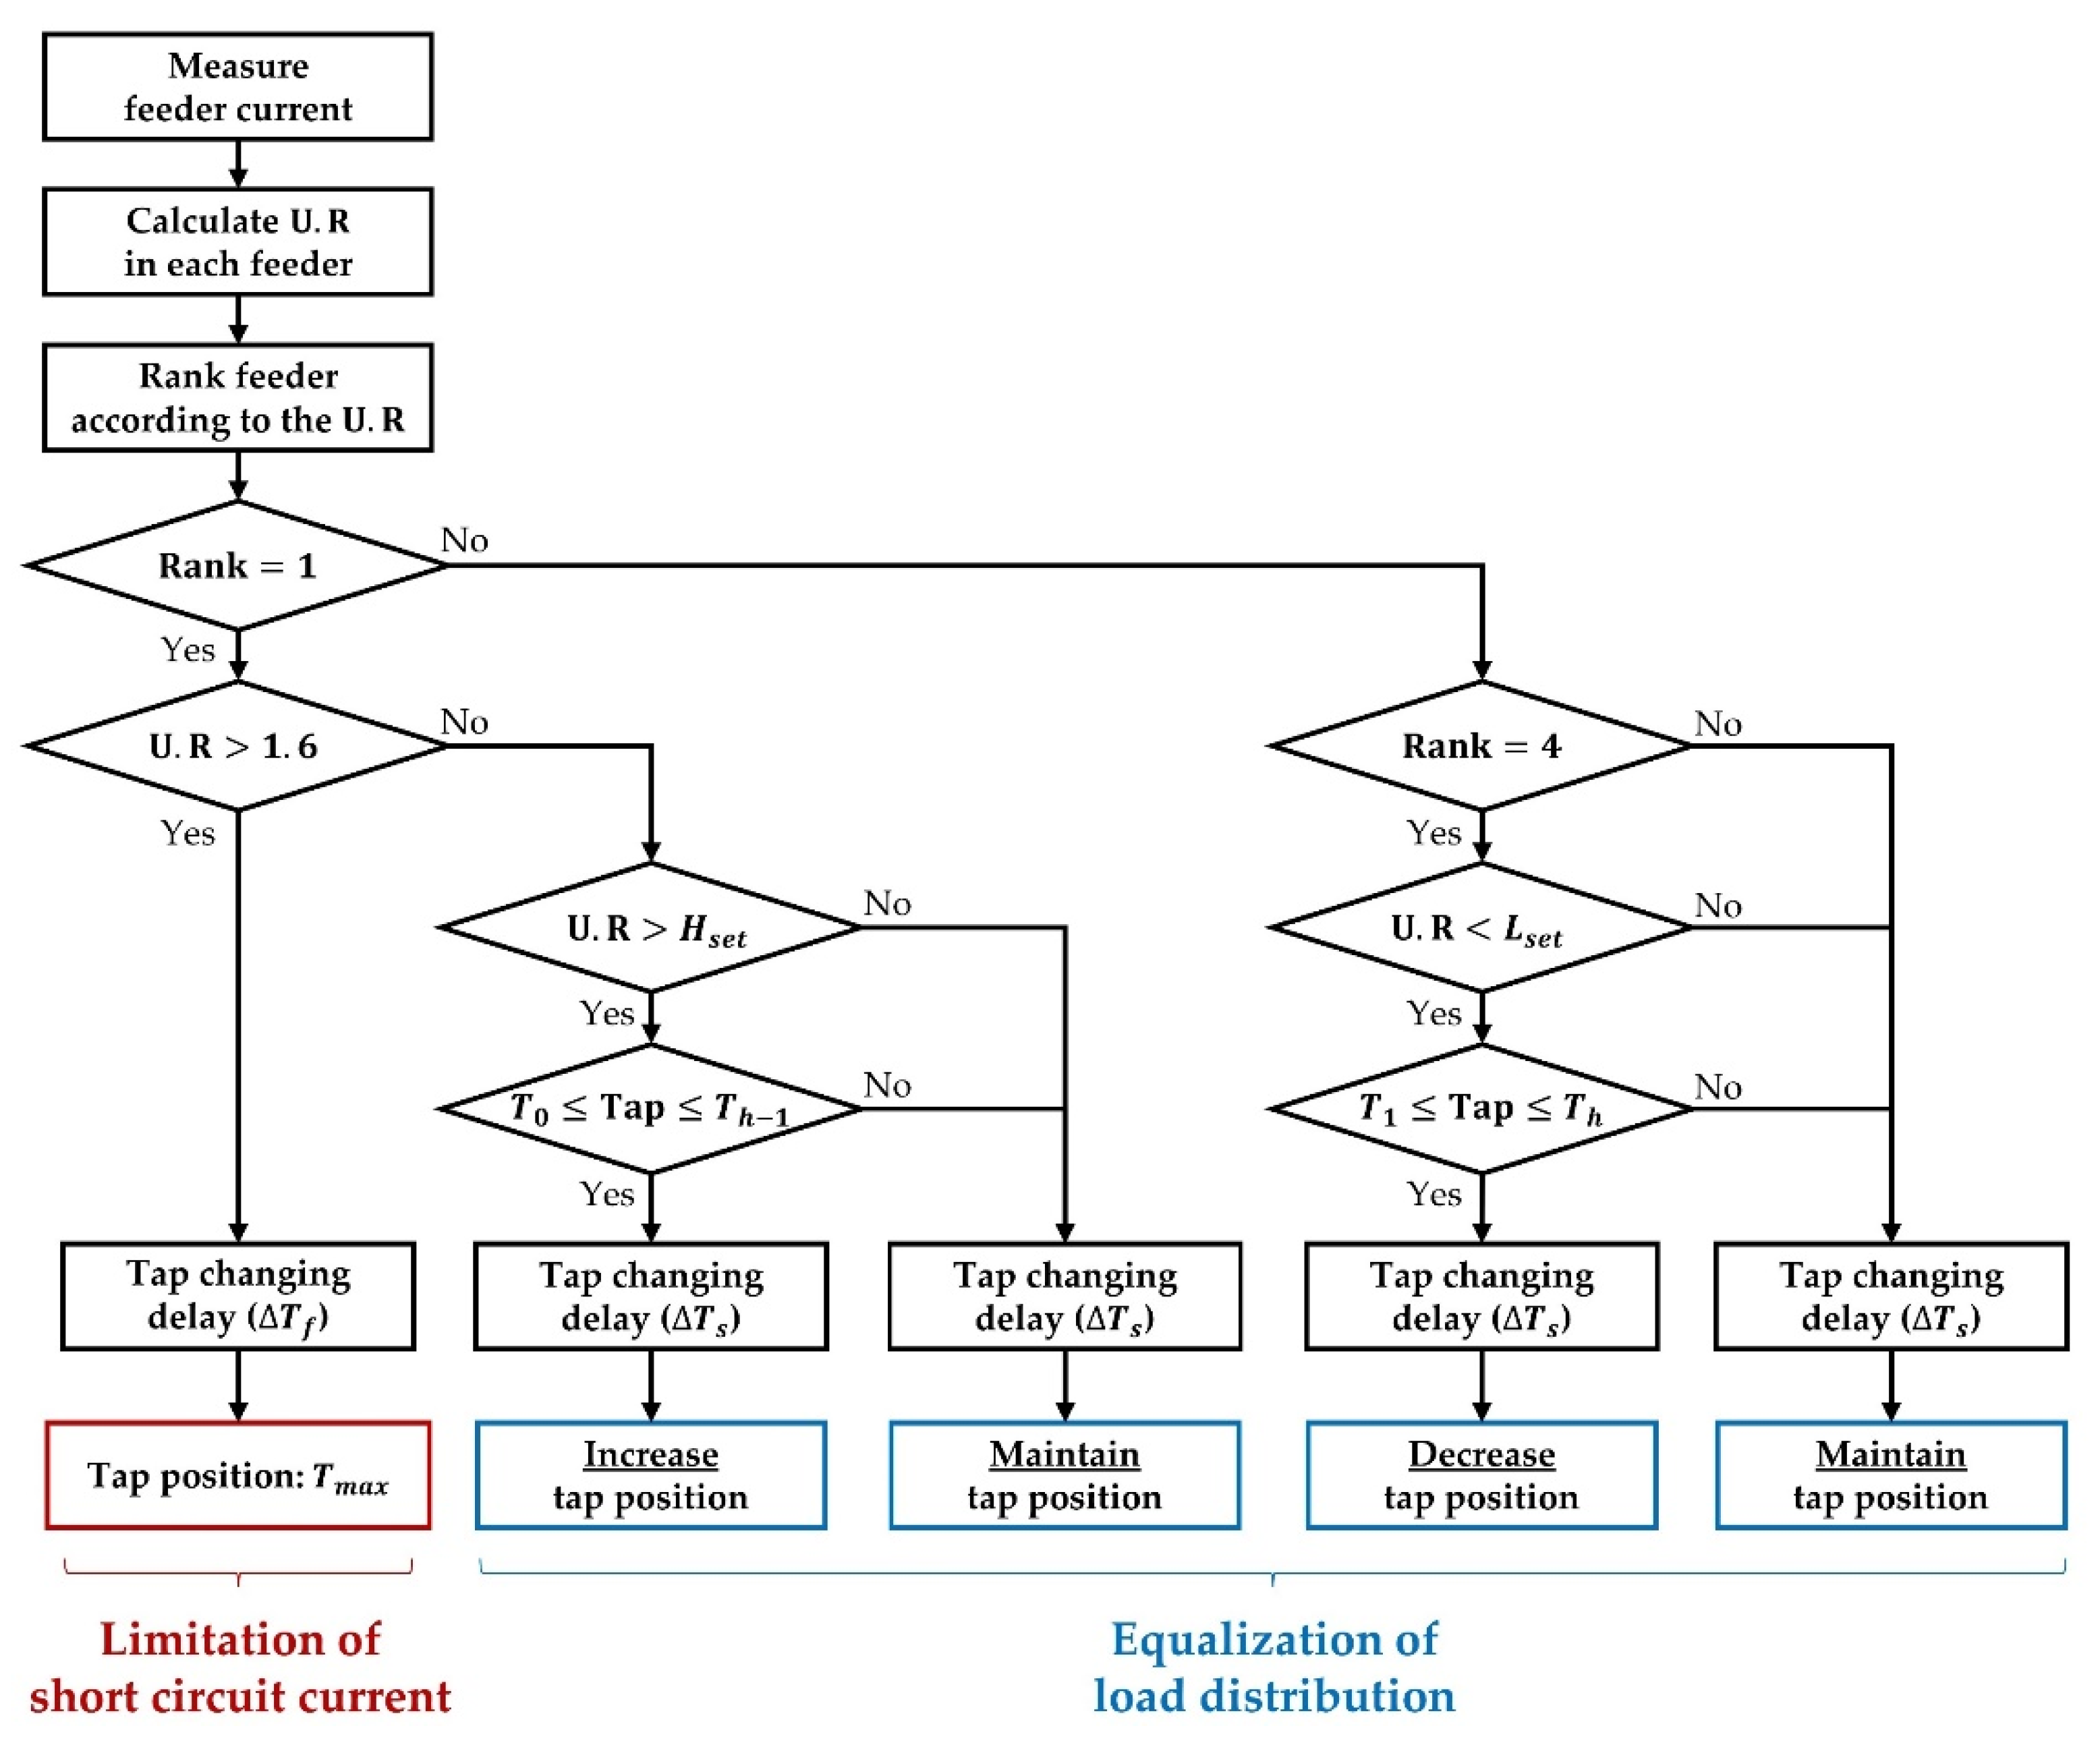
Combining the above principles, the proposed tap changing algorithm of the series reactors is represented in Figure 6. The nomenclatures in Figure 6 are represented in Table 5. In this method, the tap changer of the feeder with the highest or lowest utilization rate operates according to the current utilization rate level and tap positions. The tap changing delay time is set to and in the fault conditions and the steady-state conditions, respectively. In addition, a comparison between the utilization rate and 1.6 represents the fault detection part based on the existing overcurrent relay settings (400 A).
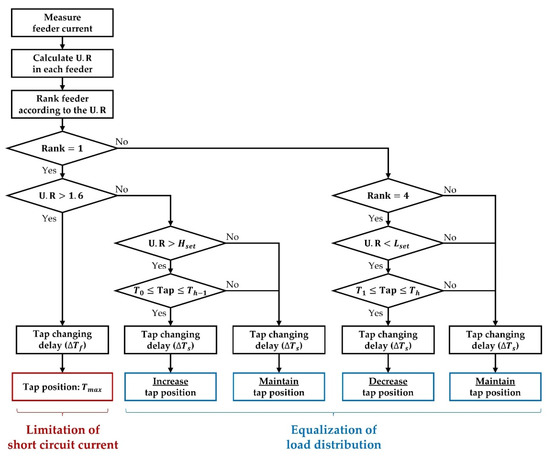
Figure 6.
Tap changing algorithm of the proposed method.
Table 5.
The nomenclature in Figure 6.
3. Numerical Experiment Setup
3.1. Test System
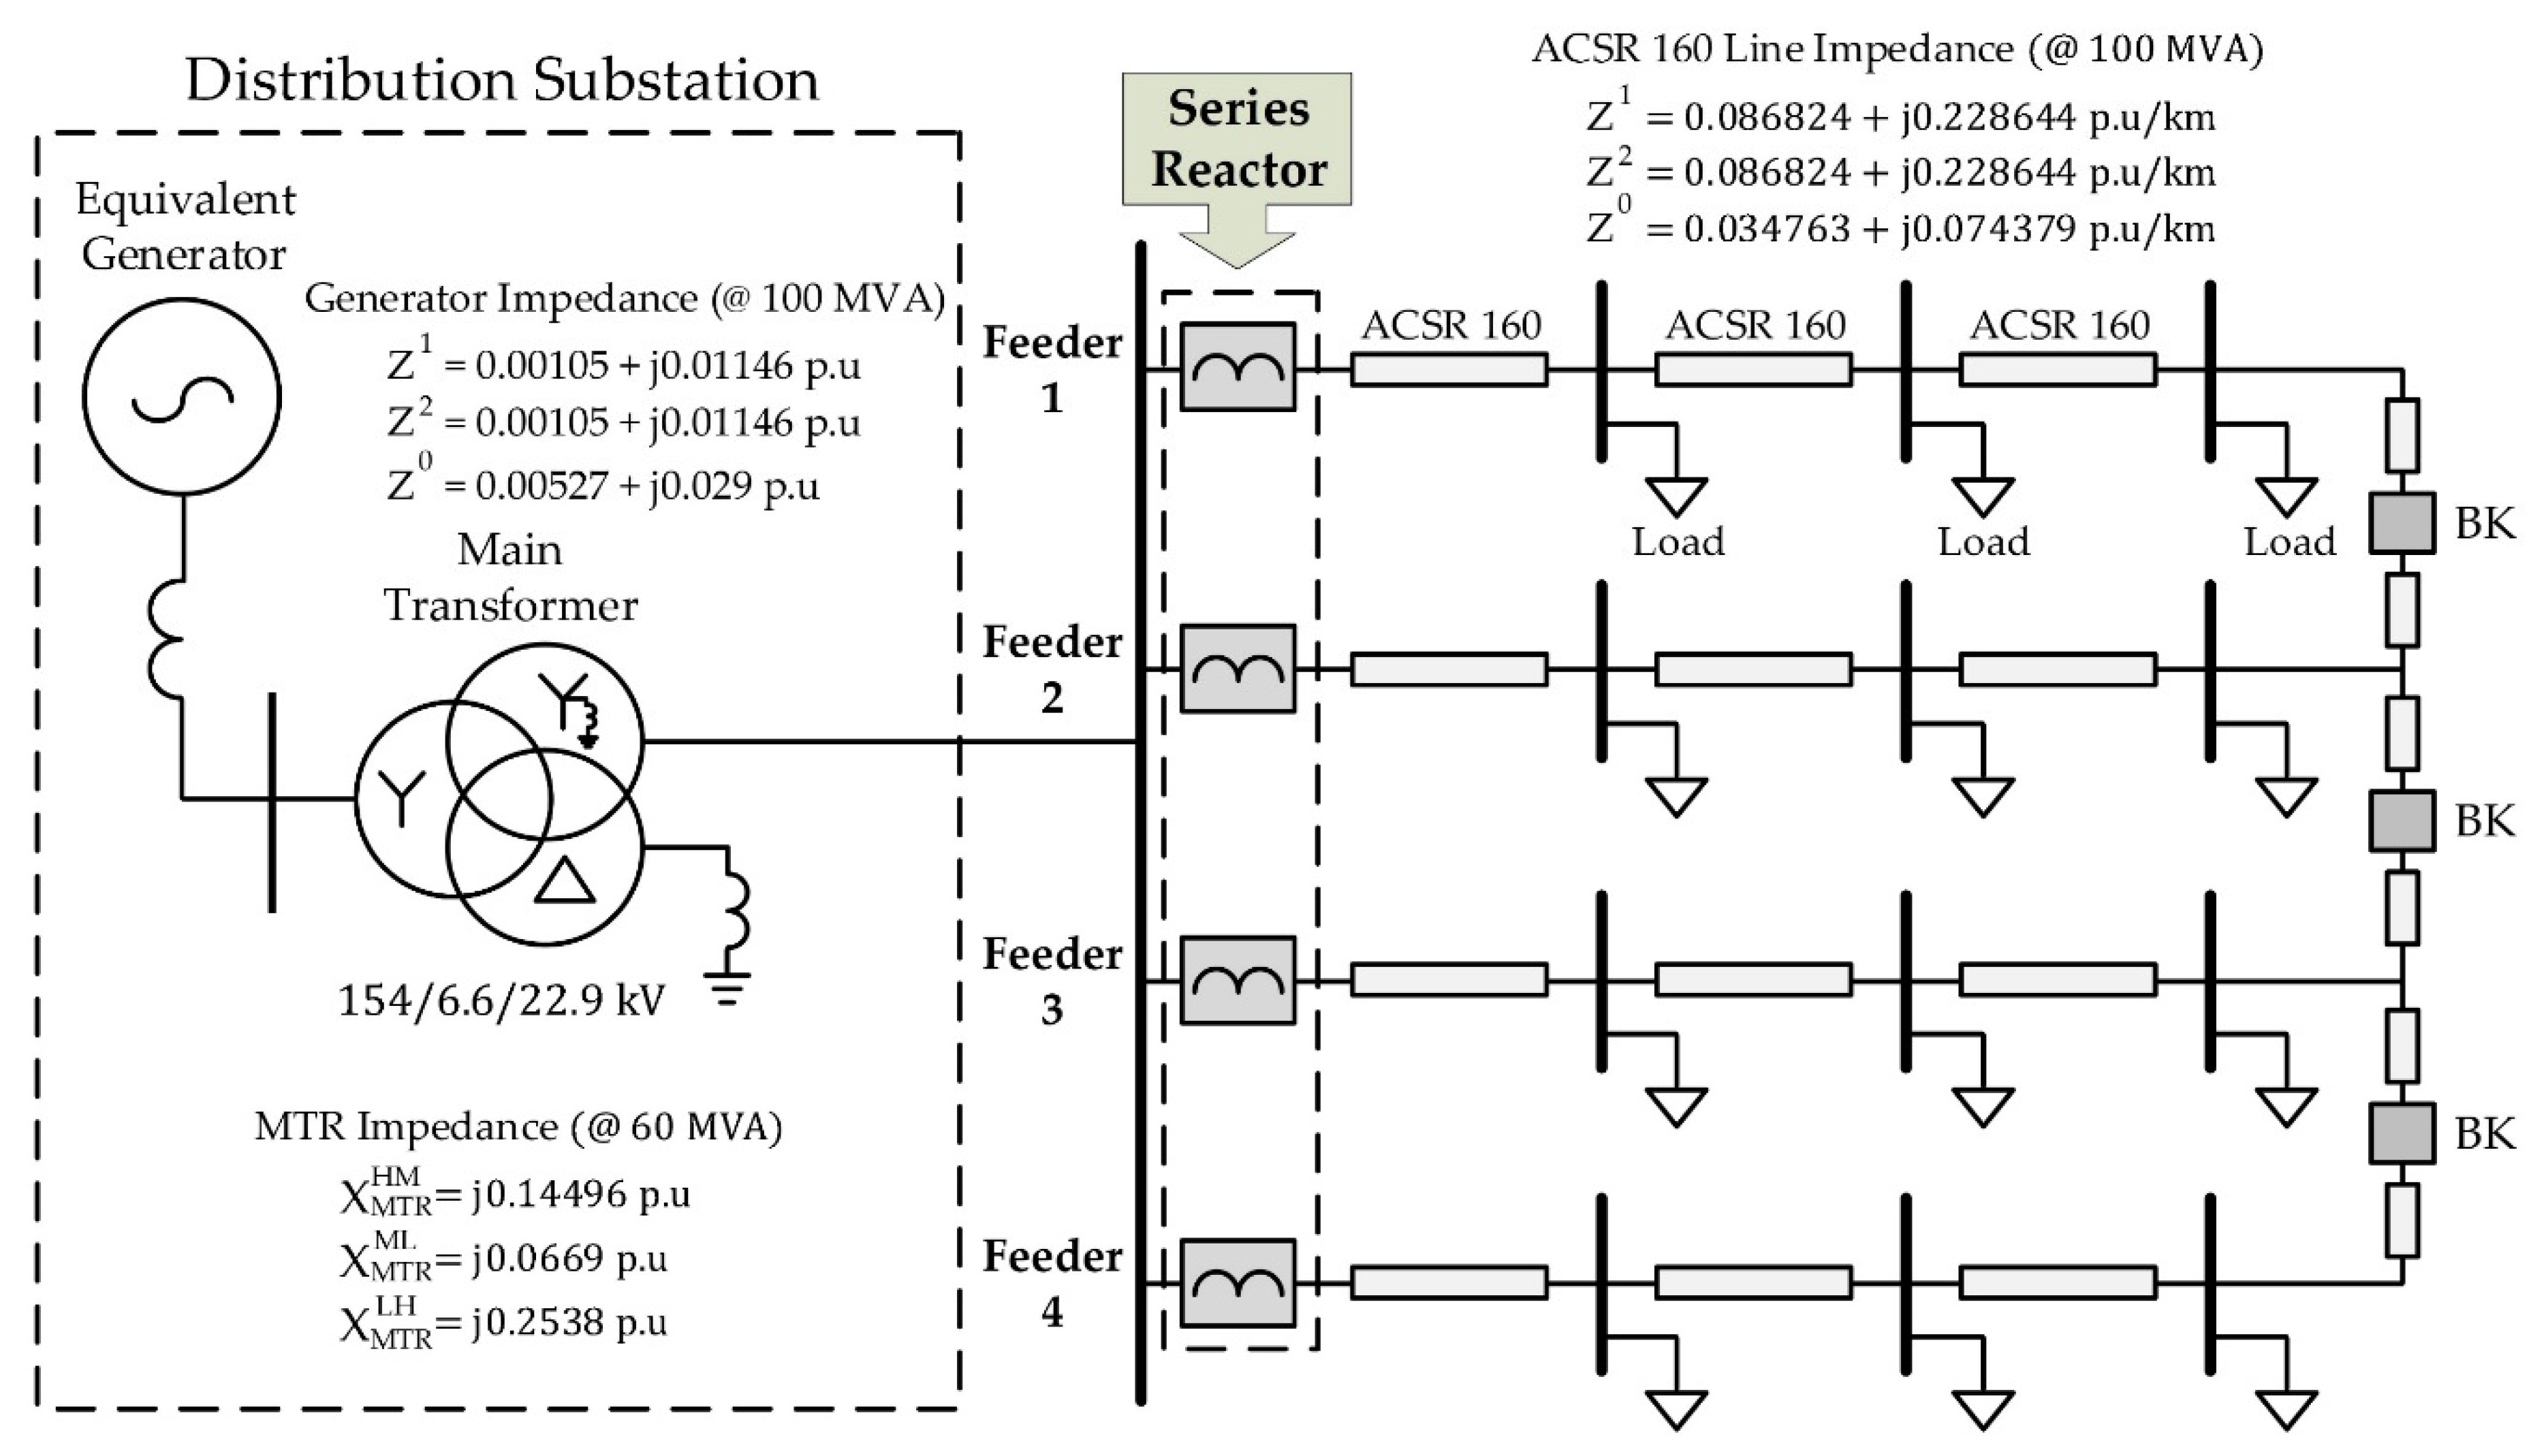
Figure 7 represents the 22.9 kV NDS with permanent linkages between the four feeders withdrawn from the same MTR. This system is composed of a generator, MTR, overhead feeders (ACSR 160), and loads that are based on the actual parameters of the KEPCO distribution system. The MTR has three windings, and its connection type is . A neutral grounding reactor (NGR, j0.6 Ω) is also connected to the connections to limit the ground fault current. In addition, the distribution lines and loads are divided equally into three sections in each of the four feeders. The distribution lines are modeled with a -equivalent circuit, and the loads are characterized by a constant impedance type. In addition, series reactors are installed at the entrance of each feeder to equalize the load distribution and reduce the short circuit current.

Figure 7.
Detailed description of NDS test system to which the proposed method is applied.
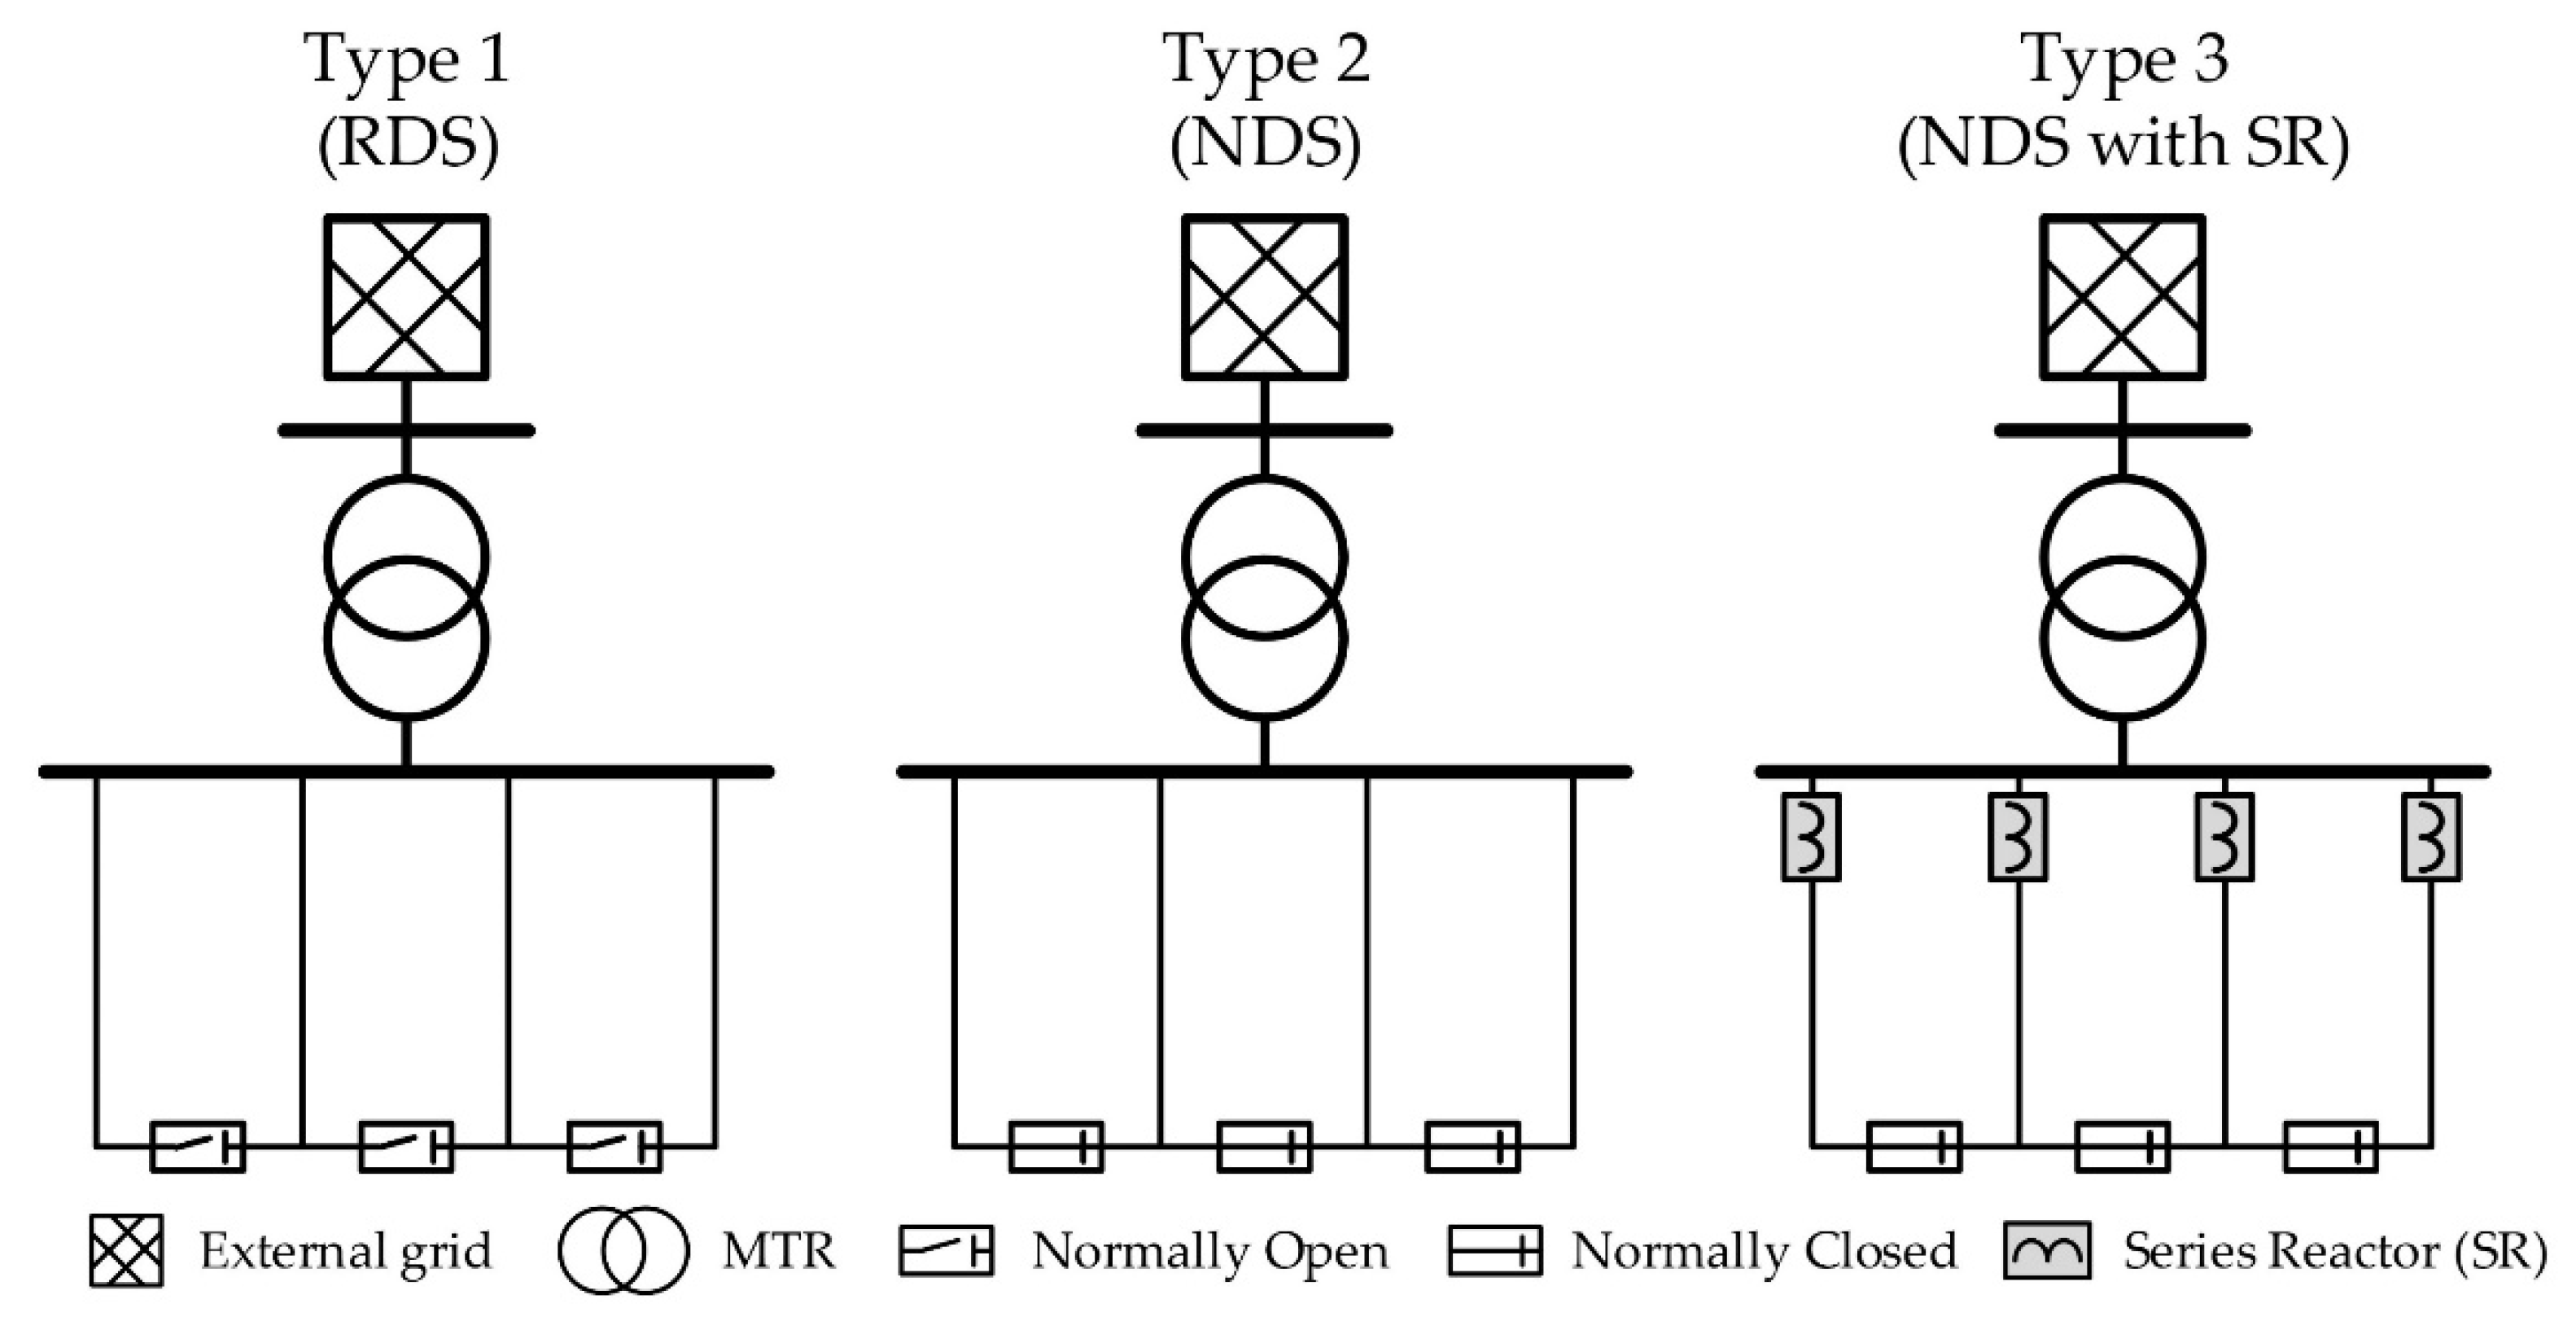
Figure 8 shows the test systems used to evaluate the proposed method. The distribution system described in Figure 7 is defined as Type 3. This indicates the NDS to which the method proposed in this paper was applied. In addition, Type 1 represents the RDS that is widely used in current distribution operations, and Type 2 represents the NDS to which the proposed method was not applied.
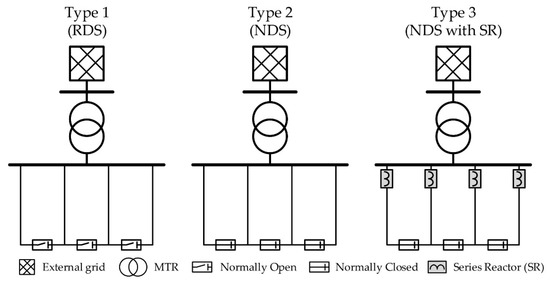
Figure 8.
Three different types of test system.
3.2. Simulation Setup
In this section, a detailed simulation setup for evaluating the proposed method is described. The three different types of test system described in Figure 8 are evaluated by comparing the indicators mentioned in Section 2.2.
3.2.1. Steady-State Analysis
In steady-state operation, the tap positions of the series reactor in this method are operated from 0 to 3 to equalize the load distribution among the four feeders, thereby, preventing line overload and enhancing the low utilization rate. To evaluate this, 5000 load profiles (MW) were randomly generated for each feeder using the rand function in MATLAB. This profile was generated by satisfying the following two conditions: (1) random selection of 4–13 MW per feeder and (2) total loads among four feeders less than 40 MW. Figure 9 shows the generated load profiles of each feeder as a box plot (left) and a table (right). In the box plot, the bottom and top edges of the box represent 10% and 90%, respectively, when all the load profiles of each feeder are arranged in order of magnitude. Additionally, the red line in the box indicates the median value. The power factors of the load were fixed to 0.912.
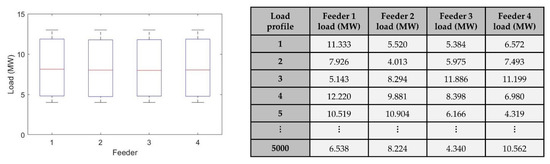
Figure 9.
Generated load profiles represented in box plot (left) and table (right).
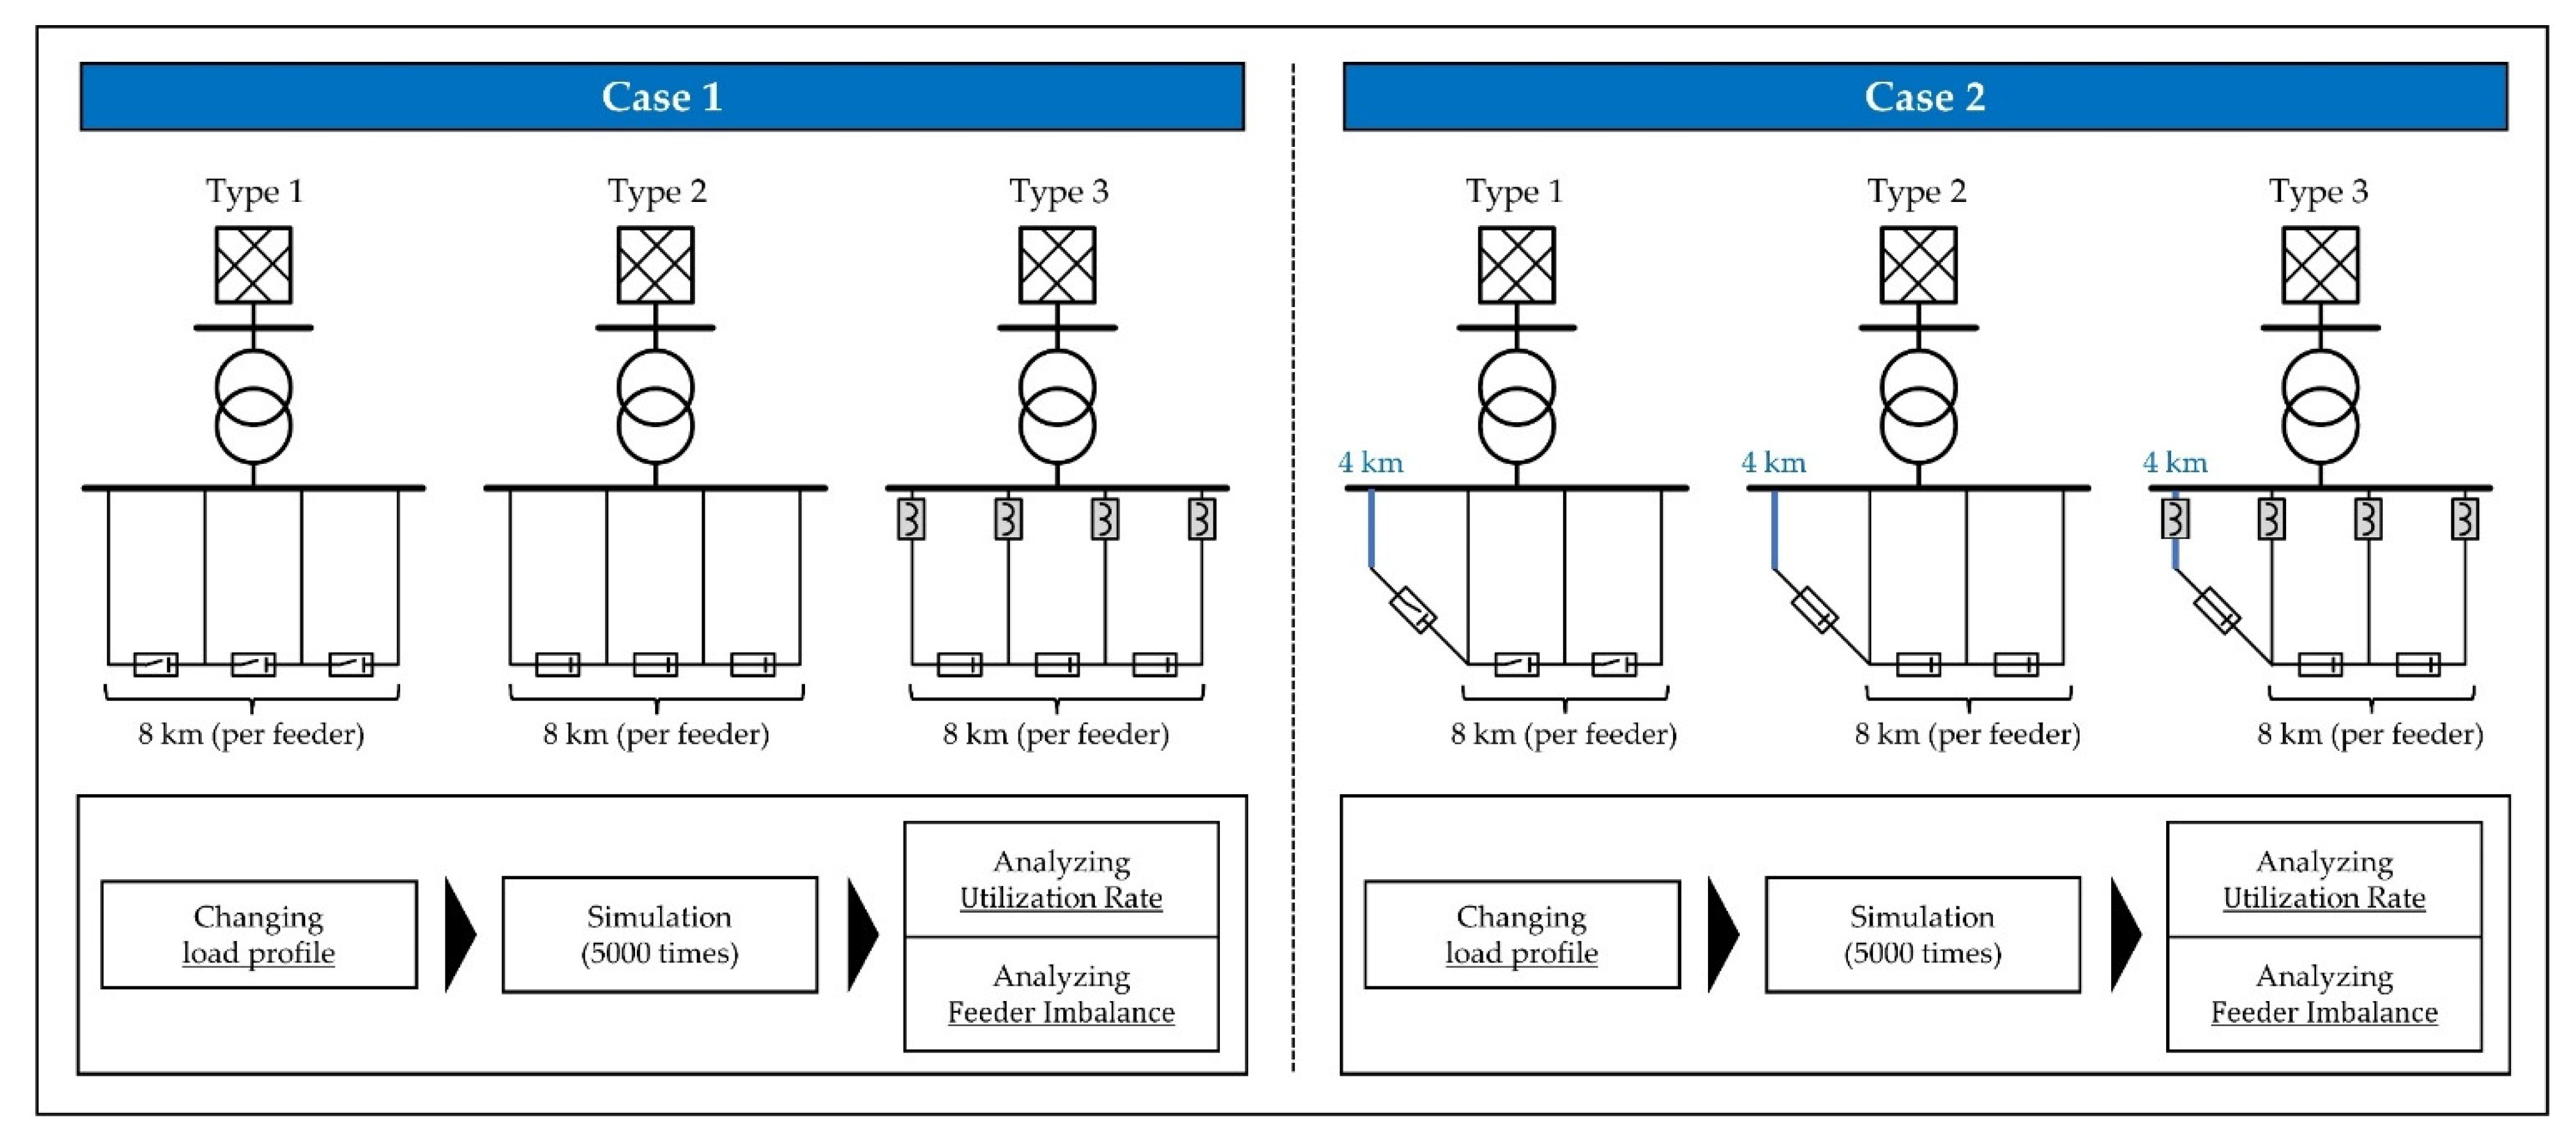
Based on these profiles, 5000 simulations were conducted, as shown in Figure 10. The steady-state analysis consisted of two cases (Cases 1 and 2). Case 1 indicates Types 1, 2, and 3 when the line lengths of the four feeders are all 8 km, and Case 2 indicates Types 1, 2, and 3 when the line length of one of the four feeders is 4 km, which is half that of the other feeders (8 km). In each case, the utilization rate and feeder imbalance indicators of Types 1, 2, and 3 were compared.

Figure 10.
Simulation setups for Cases 1 and 2 (steady-state analysis).
3.2.2. Short Circuit Analysis
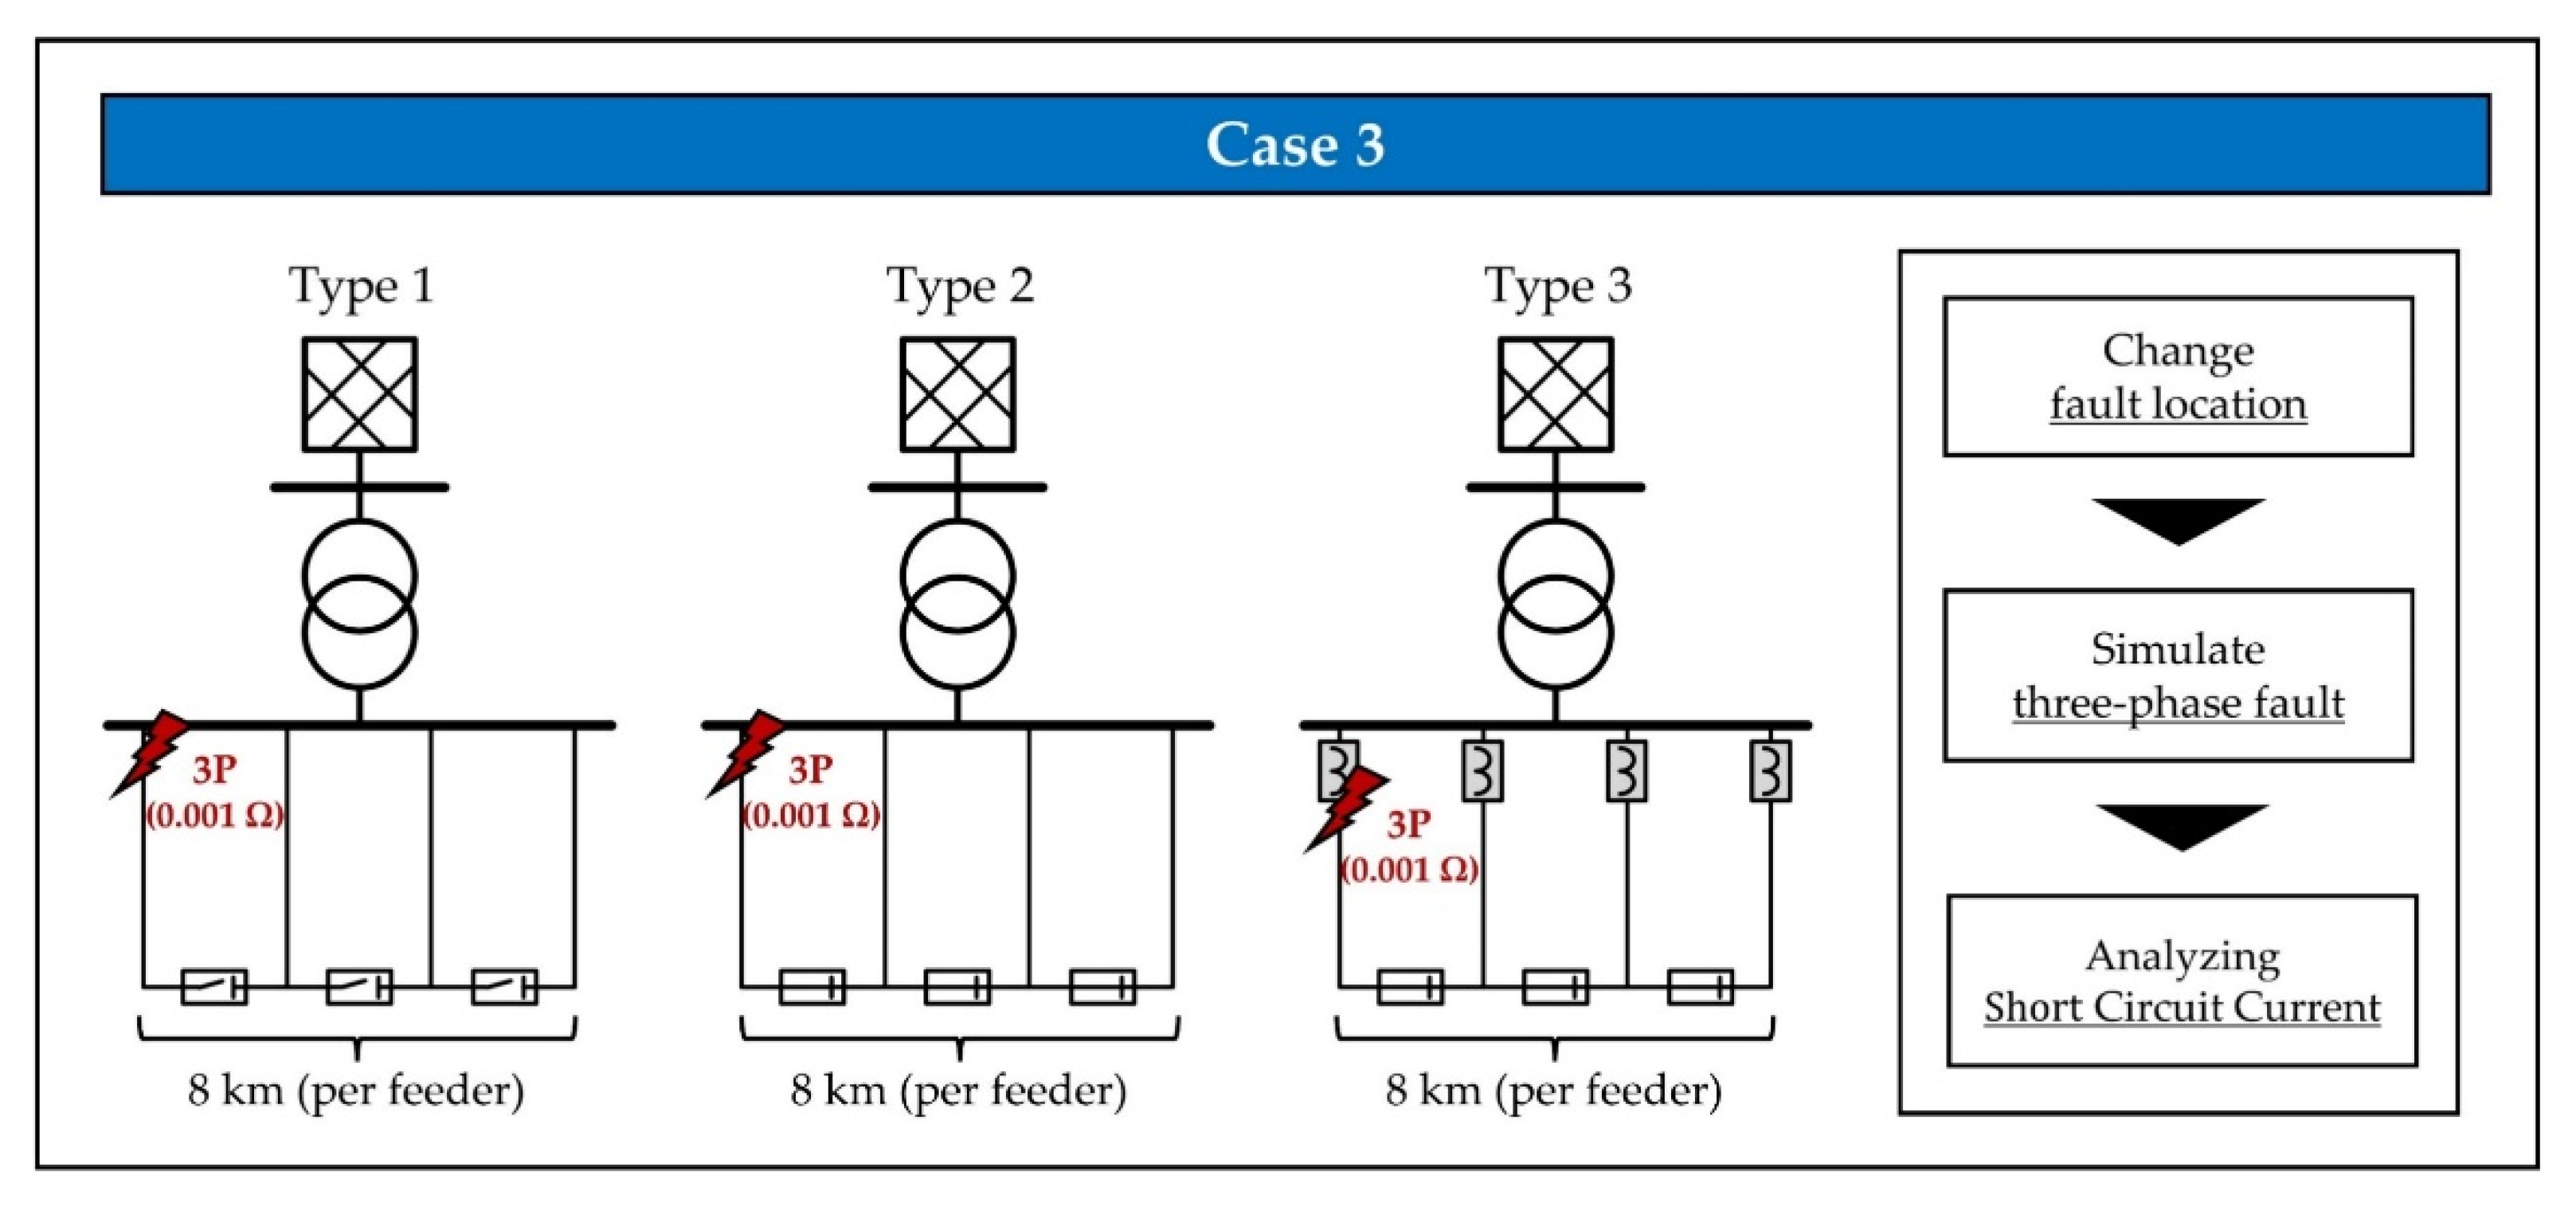
In the short circuit condition, the tap positions of the series reactor in the faulty feeder were set to 4 to reduce the short circuit current. To evaluate this, a three-phase fault was simulated at the entrance of each of the four feeders, as shown in Figure 11. The fault was applied at 2 s, and the fault impedance was set to 0.001 Ω. Subsequently, the short circuit currents of Types 1, 2, and 3 were analyzed.
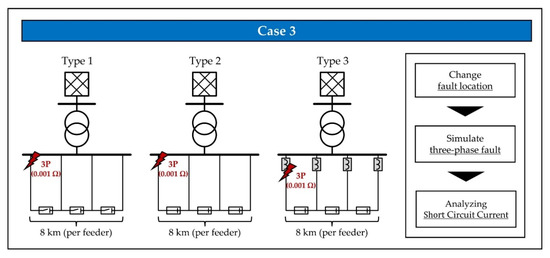
Figure 11.
Simulation setups for Case 3 (short circuit analysis).
4. Case Study
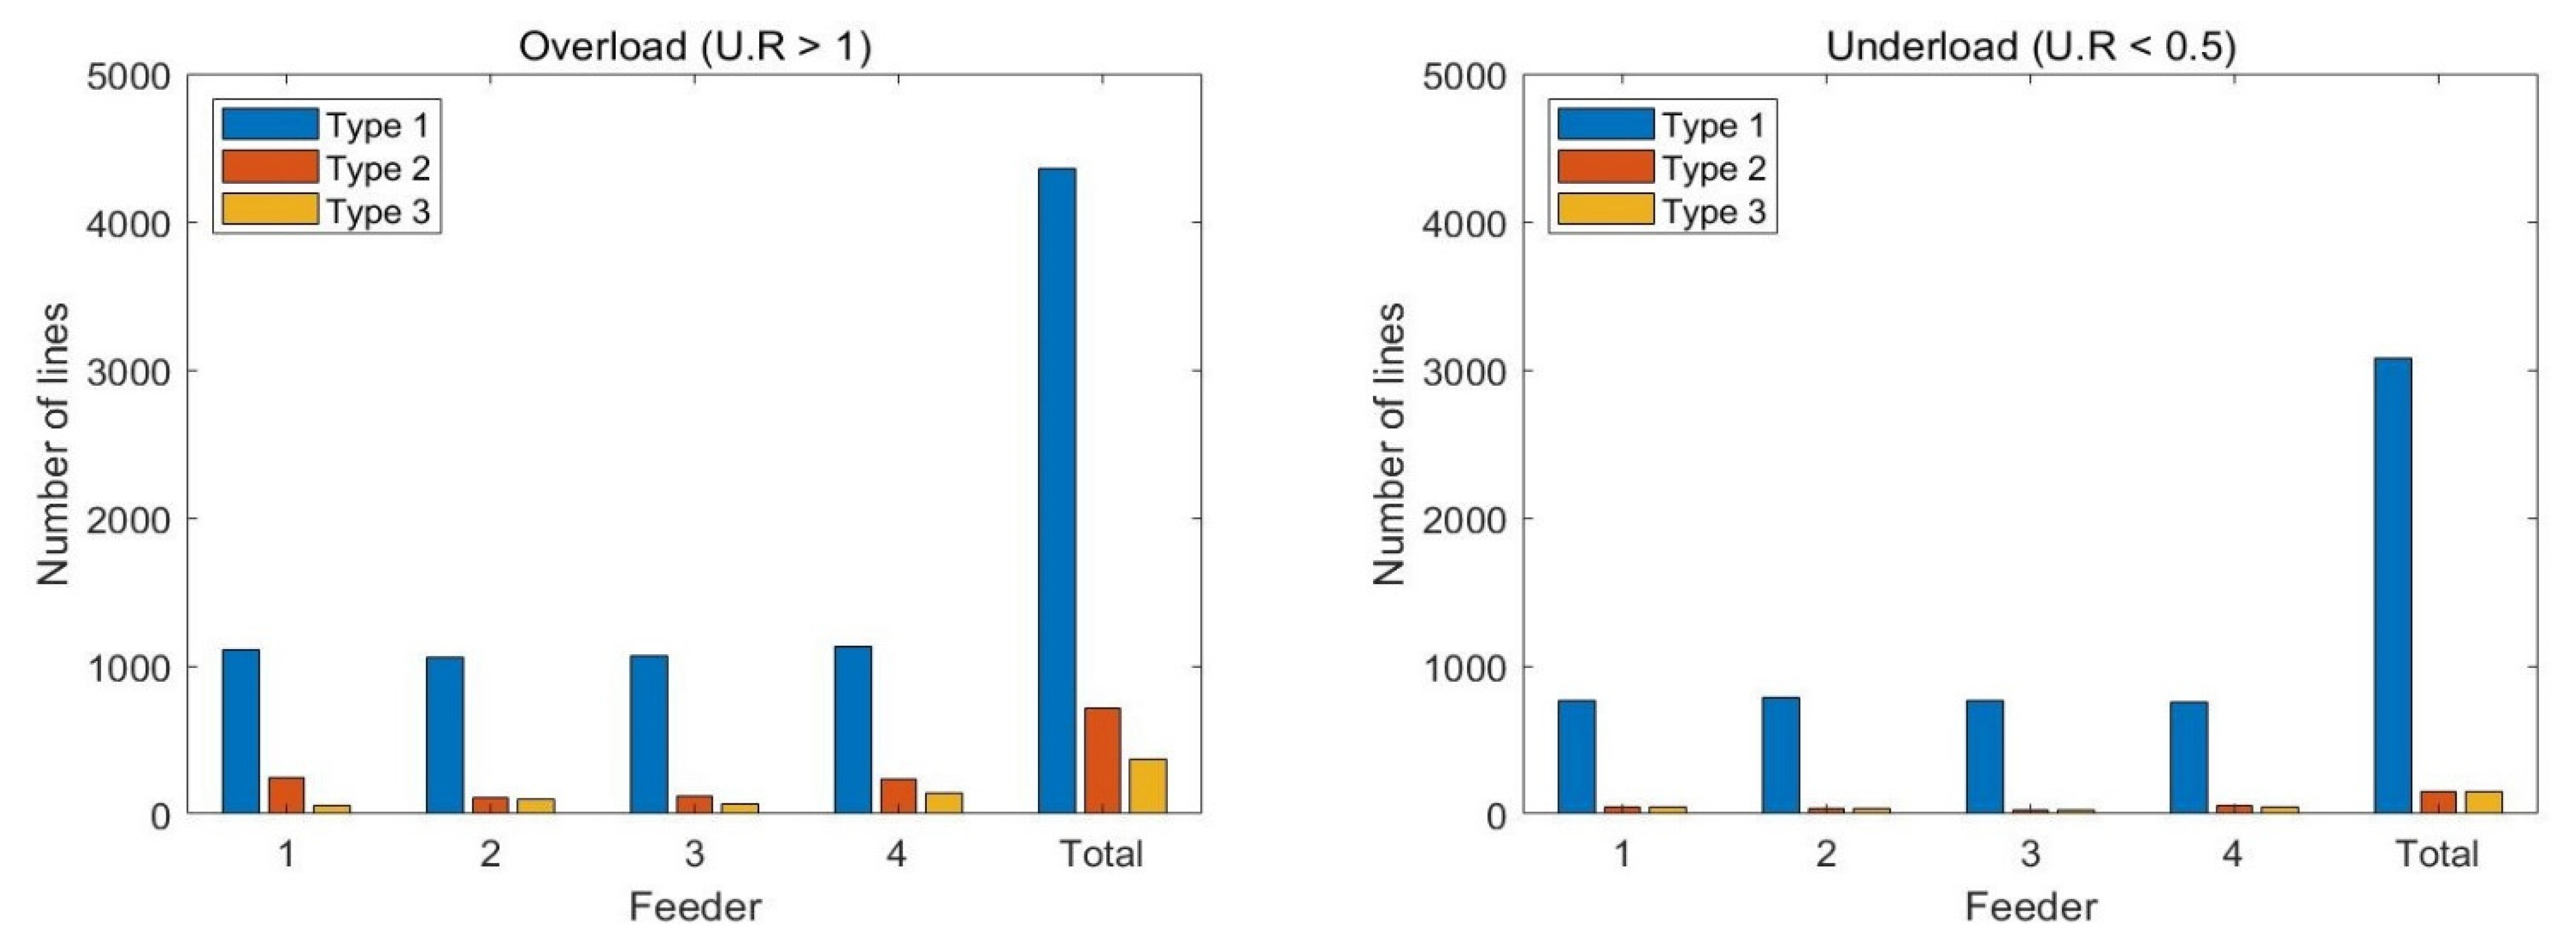
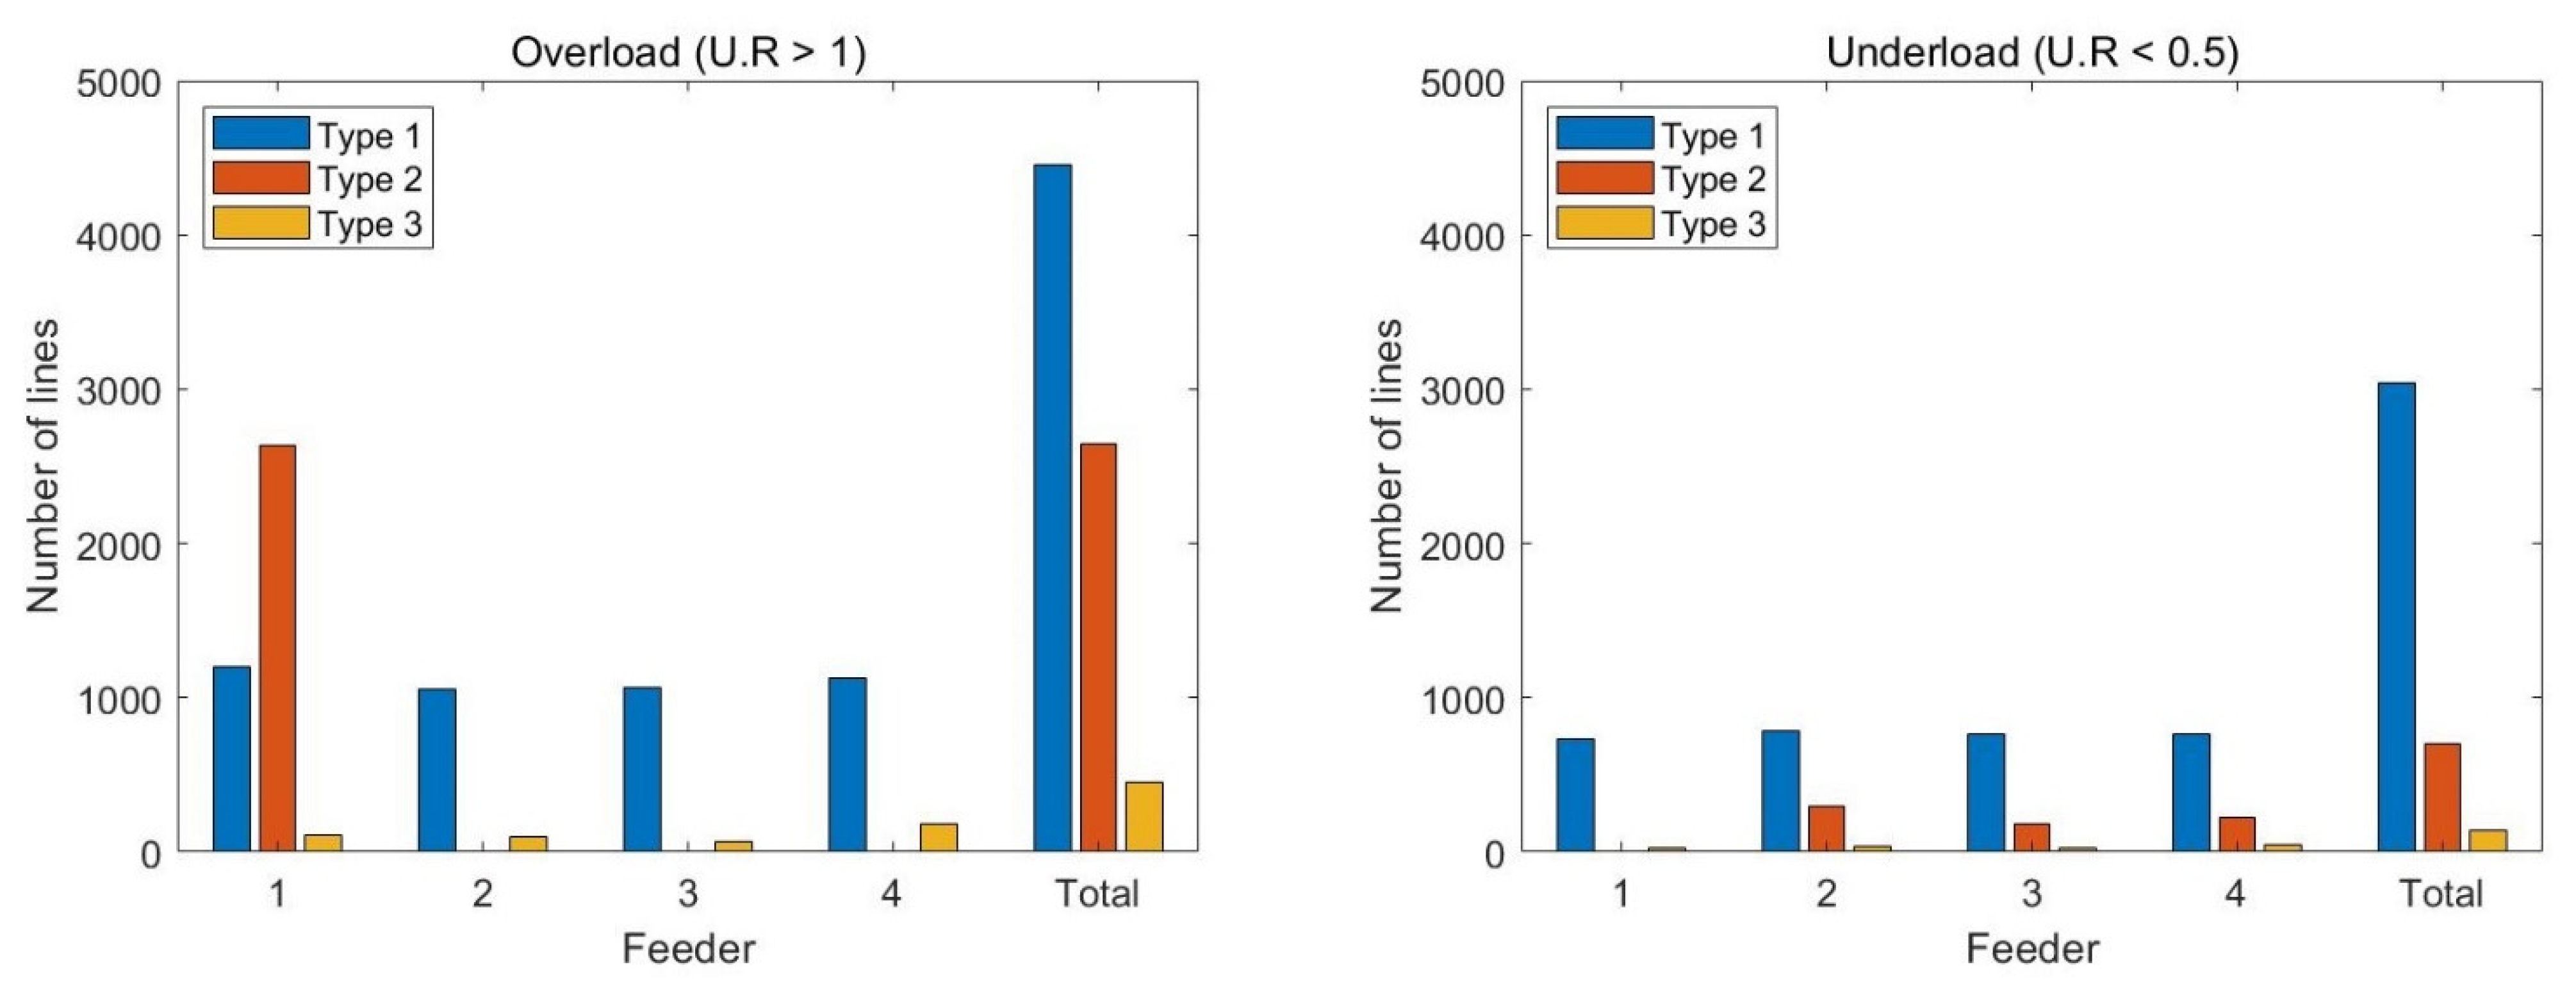
Figure 12 shows the utilization rate analysis results of Case 1. In this graph, the number of overloaded lines and underloaded lines of Type 1 are significantly larger than that of Types 2 and 3 in all feeders. This indicates that it was difficult for the RDS to operate stably and efficiently against load fluctuations. Contrastingly, the number of overloaded lines and underloaded lines of Type 2 was 83.7% and 95.1%, respectively, less than that of Type 1. This shows that introducing an NDS was very effective when the line impedances of the four feeders were the same. In addition, Type 3 further reduced these values by 48.5% and 0.7%, respectively, compared with Type 2. This denotes that the proposed method can effectively enhance the flexibility of the NDS against load fluctuations.
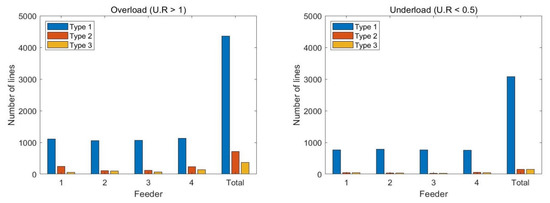
Figure 12.
Case 1 results: the number of overloaded lines (left) and underloaded lines (right).
Figure 13 shows the feeder imbalance analysis results of Case 1. In this graph, the feeder imbalances of Type 1 range from 5% to 95%, denoting that load distribution among the four feeders was highly unbalanced. This implies the existence of many constraints in the context of an additional load connection. Contrarily, the feeder imbalances of Type 2 are distributed from 2.5% to 42.5%, indicating that the introduction of an NDS can contribute to the equalization of load distribution. This was further equalized in Type 3, which shows that the proposed method can enable an additional load connection without capacity extension and enhance the system flexibility of the NDS.
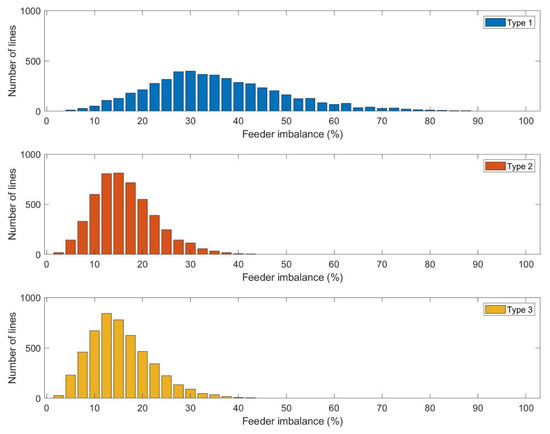
Figure 13.
Case 1 results: feeder imbalance of Types 1, 2, and 3 in order from top to bottom.
Figure 14 shows the utilization rate analysis results of Case 2. Compared to Figure 12, the number of overloaded lines of Type 2 increased significantly in the feeder with short line impedance. This indicates that the loads are highly concentrated into the shorter feeder when one feeder is shorter than the other feeders, which can be the main concern when introducing an NDS. However, the numbers of overloaded lines and underloaded lines of Type 1 were similar, which shows that the line impedance had almost no effect on the feeder current and load distribution of the RDS. Likewise, Type 3 also showed similar results as that of Figure 12; however, the improvement effect was even higher. In Type 3, the numbers of overloaded lines and underloaded lines were reduced by 82.7% and 79.9%, respectively, compared to Type 2. This indicates that the proposed method shows superior performance in the enhancement of system flexibility in a more realistic case where the line impedances of the four feeders are dissimilar.
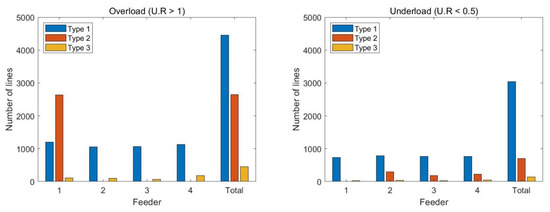
Figure 14.
Case 2 results: the number of overloaded lines (left) and underloaded lines (right).
Figure 15 shows the feeder imbalance analysis results of Case 2. Compared to Figure 13, the feeder imbalances of Type 2 were distributed over a larger range. This indicates that the feeder imbalances increase to a high level under the conditions of different line impedances among the feeders. However, the feeder imbalances of Type 1 were similar to that of Figure 13, which shows that the line impedance had almost no effect on the feeder current and load distribution of the RDS. Likewise, the feeder imbalance of Type 3 was also similar to that of Figure 13, which indicates that the proposed method is effective in equalizing the load distribution and enhancing the system flexibility, regardless of the grid conditions.
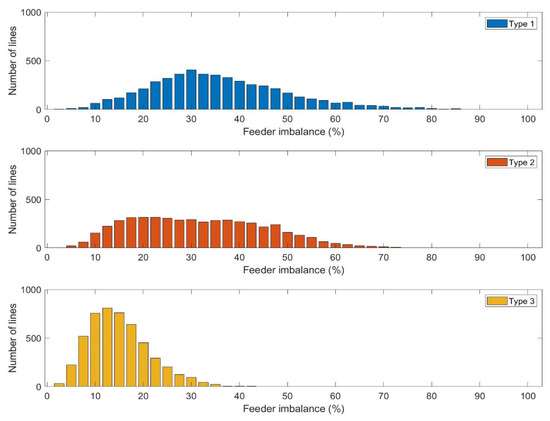
Figure 15.
Case 2 results: feeder imbalance of Types 1, 2, and 3 in order from top to bottom.
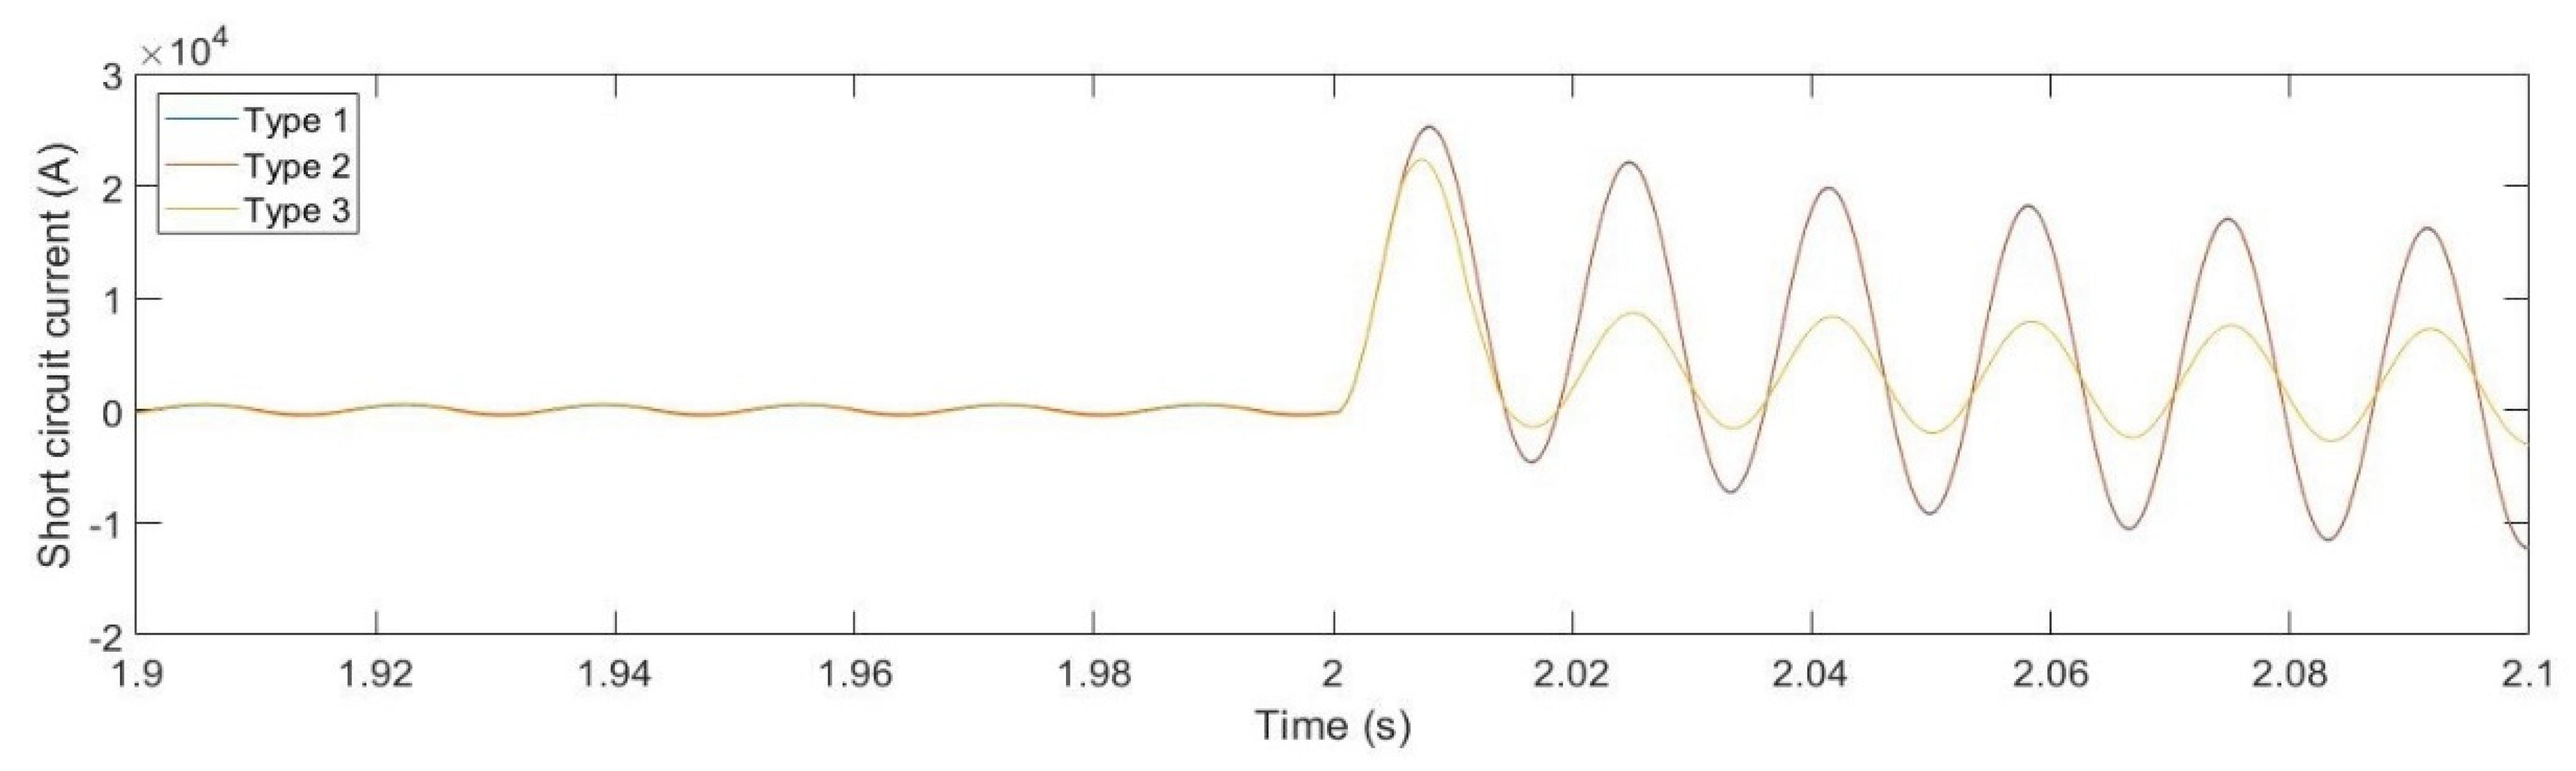
Figure 16 shows the short circuit analysis results of Case 3. In this graph, the short circuit currents of Types 1 and 2 are almost identical. This indicates that the introduction of an NDS in the same MTR did not result in an increase of the short circuit current of the RDS, which does not require breaker replacement. In contrast, the short circuit current of Type 3 was reduced within approximately 0.5 cycle and was maintained at a lower level. It is worthwhile to note that the proposed method can contribute to the system stability of the NDS, where a fault in a single feeder can spread to all four feeders and cause damage to the apparatus more frequently.
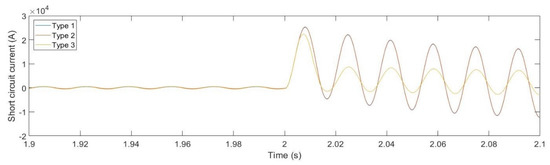
Figure 16.
Case 3 results: short circuit current.
5. Discussions and Conclusions
This study proposed a methodology to control the line overload and short circuit current of an NDS. To this end, an operating strategy for preventing line overload and relieving the short circuit current was developed based on the tap changing algorithm of the series reactor. The proposed method was evaluated using practical indicators, such as the utilization rate, feeder imbalance, and short circuit current. Three different distribution systems, including an RDS, an NDS without the proposed method, and an NDS with the proposed method, were analyzed.
It was observed that the RDS ias unable to operate stably and efficiently against load fluctuations. Under this condition, the introduction of an NDS can be an efficient solution when the line impedances of the four feeders are the same. This can prevent line overload and enhance the utilization rate dramatically. However, if one feeder is shorter than the others, the introduction of an NDS seriously concentrates the loads into the shorter feeder. This can cause line overloading even at an appropriate loading (0.5 < U.R < 1) and can be a disadvantage to the NDS. The proposed method can effectively address this issue by equalizing the load distribution among the four feeders, thereby, preventing line overload and enhancing the utilization rate of the underloaded lines.
The performance of this method is mostly unaffected by the grid conditions (i.e., line impedances), in which the difference rates of the number of overloaded lines and underloaded lines between Cases 1 and 2 were 2.09% and 1.02%, respectively. That is, the proposed method showed high performance regardless of the grid conditions. In addition, the proposed method reduced the short circuit level of the NDS within a 0.5 cycle, in which a fault in a single feeder spreads to all four feeders, causing the device to suffer from damage more frequently. Thus, the proposed method enhances the stability of the NDS.
It is worth noting that this study also contributes to the economic operation of the NDS. As mentioned in Section 2.1.2, the operation of the NDS requires an integrated operation of all four feeders, and this presents significant complexities. Load concentration may occur if the grid conditions are not adequately controlled, causing line overload. From the standpoint of DSO, the control of loads consumed by customers is challenging, except in emergencies; thereby, line extension is inevitable in severe cases. The proposed method can automatically equalize the load distribution among the four feeders. This prevents line extension and enhances the utilization rate of the existing feeders.
This paper is an initial study on how to operate an NDS efficiently and stably based on the tap changing algorithm of the series reactor. Therefore, this paper dealt with the basic concept of this method, including the structure, installation sites, determination of the parameters, and tap changing algorithm. However, numerical factors may also need to be considered to implement this method into an actual grid. Evaluation of implementation and economic feasibility (i.e., tap changing time, power factor change, increase of loss, etc.) will be addressed in future studies.
In conclusion, the NDS has many advantages and may become a norm in the near future. This has the potential to increase system flexibility against load fluctuations; however, it can lead to load concentration depending on the relative line impedances of each feeder. Since the line conditions of each feeder are probably different in real cases, this can be a major concern in NDSs. The proposed method effectively addresses this problem, allowing the stable and efficient operation of an NDS.
Author Contributions
Conceptualization, J.L., W.C. and W.K.; Data curation, J.L. and S.C.; Formal analysis, J.L.; Funding acquisition, S.C.; Investigation, S.C.; Methodology, J.L.; Project administration, W.C., W.K. and S.C.; Resources, W.K.; Software, J.L.; Supervision, S.C.; Validation, J.L., W.C. and W.K.; Visualization, J.L. and S.C.; Writing—original draft, J.L.; Writing—review and editing, J.L. and S.C. All authors have read and agreed to the published version of the manuscript.
Funding
This research was supported in part by the Korea Electric Power Corporation (No. CX71200030), in part by Korea Institute of Energy Technology Evaluation and Planning (KETEP) grant funded by the Korea government (MOTIE) (No. 20191210301890), and in part by the Basic Research Program through the National Research Foundation of Korea (NRF) funded by the MSIT (No. 2020R1A4A1019405).
Institutional Review Board Statement
Not applicable.
Informed Consent Statement
Not applicable.
Conflicts of Interest
The authors declare no conflict of interest.
References
- Sortomme, E.; Hindi, M.M.; MacPherson, S.D.J.; Venkata, S.S. Coordinated Charging of Plug-In Hybrid Electric Vehicles to Minimize Distribution System Losses. IEEE Trans. Smart Grid. 2011, 2, 198–205. [Google Scholar] [CrossRef]
- Zheng, Y.; Song, Y.; Hill, D.J.; Meng, K. Online Distributed MPC-Based Optimal Scheduling for EV Charging Stations in Distribution Systems. IEEE Trans. Ind. Inform. 2019, 15, 638–649. [Google Scholar] [CrossRef]
- Celli, G.; Pilo, F.; Pisano, G.; Allegranza, V.; Cicoria, R.; Iaria, A. Meshed vs. Radial MY Distribution Network in Presence of Large Amount of DG. In Proceedings of the IEEE PES Power Systems Conference and Exposition, New York, NY, USA, 10–13 October 2004; pp. 709–714. [Google Scholar]
- Meera, P.S.; Hemamalini, S. Integrated resource planning for a meshed distribution network under uncertainty. Electr. Power Syst. Res. 2021, 195, 107127. [Google Scholar] [CrossRef]
- Cruz, M.R.M.; Fitiwi, D.Z.; Santos, S.F.; Catalao, J.P.S. Meshed Operation of Distribution Network Systems: Enabling Increased Utilization of Variable RES Power. In Proceedings of the IEEE International Conference on Environment and Electrical Engineering and 2018 IEEE Industrial and Commercial Power Systems Europe (EEEIC/I&CPS Europe), Palermo, Italy, 12–15 June 2018; pp. 1–6. [Google Scholar]
- Wang, B.; Zhang, C.; Dong, Z.Y.; Li, X. Improving Hosting Capacity of Unbalanced Distribution Networks via Robust Allocation of Battery Energy Storage System. IEEE Trans. Power Syst. 2020, 36, 2174–2185. [Google Scholar] [CrossRef]
- Nishant, B.; Niroj, G.; Heng, C.; Sri, R.K. Priority-based Management Algorithm in Distributed Energy Resource Management Systems. In Proceedings of the 2021 IEEE Green Technologies Conference (GreenTech), Denver, CO, USA, 7–9 April 2021; pp. 351–356. [Google Scholar]
- Ding, F.; Mather, B.; Gotseff, P. Technologies to Increase PV Hosting Capacity in Distribution Feeders. In Proceedings of the 2016 IEEE Power and Energy Society General Meeting (PESGM), Boston, MA, USA, 17–21 July 2016; pp. 1–5. [Google Scholar]
- Davoudi, M.; Cecchi, V.; Aguero, J.R. Investigating the Ability of Meshed Distribution Systems to Increase Penetration Levels of Distributed Generation. In Proceedings of the IEEE Southeastcon 2014, Lexington, KY, USA, 13–16 March 2014; pp. 1–5. [Google Scholar]
- Cruz, M.R.M.; Fitiwi, D.Z.; Santos, S.F.; Mariano, S.J.P.S.; Catalao, J.P.S. Prospects of a Meshed Electrical Distribution System Featuring Large-Scale Variable Renewable Power. Energies 2018, 11, 3399. [Google Scholar] [CrossRef] [Green Version]
- Alvarez-Herault, M.C.; N’Doye, N.; Gandioli, C.; Hadjsaid, N.; Tixador, P. Meshed distribution network vs reinforcement to increase the distributed generation connection. Sustain. Energy Grids Netw. 2015, 1, 20–27. [Google Scholar] [CrossRef]
- Wolter, D.; Zdrallek, M.; Stotzel, M.; Schacherer, C.; Mladenovic, I.; Biller, M. Impact of meshed grid topologies on distribution grid planning and operation. CIRED Open Access Proc. J. 2017, 2017, 2338–2341. [Google Scholar] [CrossRef]
- Capitanescu, F.; Ochoa, L.F.; Margossian, H.; Hatziargyriou, N.D. Assessing the Potential of Network Reconfiguration to Improve Distributed Generation Hosting Capacity in Active Distribution Systems. IEEE Trans. Power Syst. 2014, 30, 346–356. [Google Scholar] [CrossRef]
- Thapar, A.; Saha, T.K.; McDonald, J.D.F. An Investigation of Composite System Reliability in Meshed and Extended Networks. In Proceedings of the 2005 International Power Engineering Conference, Singapore, 29 November–2 December 2005; pp. 1099–1104. [Google Scholar]
- Ruben, B.; Cross, A.; Strickland, D.; Aten, M.; Ferris, R. Meshing Radial Networks at 11kV. In Proceedings of the 2011 2nd IEEE PES International Conference and Exhibition on Innovative Smart Grid Technologies, Manchester, UK, 5–7 December 2011; pp. 1–8. [Google Scholar]
- Cristian, N.; Ahmed, A.A.; Dakyo, B. Impact Analysis of Distributed Generation on Mesh and Radial Distribution Network. Overview and State of the art. In Proceedings of the PLUMEE Conference, Bucharest, Romania, 18–20 June 2013; pp. 1–10. [Google Scholar]
- Grzanic, M.; Antic, T.; Flammini, M.G.; Wilkening, H.; Prettico, G. Renewable energies integration in a DiNeMo model based on a German urban grid. In Proceedings of the CIRED 2020 Berlin Workshop (CIRED 2020), Oline Conference, 22–23 September 2020; pp. 596–598. [Google Scholar]
- Gandioli, C.; Alvarez-Herault, M.C.; Tixador, P.; Hadjsaid, N.; Medina, D.M.R. Innovative Distribution Networks Planning Integrating Superconducting Fault Current Limiters. IEEE Trans. Appl. Supercond. 2013, 23, 5603904. [Google Scholar] [CrossRef]
- Yu, P.; Venkatesh, B.; Yazdani, A.; Singh, B.N. Optimal Location and Sizing of Fault Current Limiters in Mesh Networks Using Iterative Mixed Integer Nonlinear Programming. IEEE Trans. Power Syst. 2016, 31, 4776–4783. [Google Scholar] [CrossRef]
- Penaloza, J.D.R.; Borghetti, A.; Napolitano, F.; Tossani, F.; Nucci, C.A. A New Transient-Based Earth Fault Protection System for Unearthed Meshed Distribution Networks. IEEE Trans. Power Deliv. 2021, 36, 2585–2594. [Google Scholar] [CrossRef]
- Yazdaninejadi, A.; Nazarpour, D.; Golshannavaz, S. Dual-setting directional over-current relays: An optimal coordination in multiple source meshed distribution networks. Int. J. Electr. Power Energy Syst. 2017, 86, 163–176. [Google Scholar] [CrossRef]
- Tsimtsios, A.M.; Nikolaidis, V.C. Toward Plug-and-Play Protection for Meshed Distribution Systems with DG. IEEE Trans. Smart Grid. 2020, 11, 1980–1995. [Google Scholar] [CrossRef] [Green Version]
- Hatata, A.Y.; Ebeid, A.S.; El-Saadawi, M.M. Optimal Restoration of Directional Overcurrent Protection Coordination for Meshed Distribution System Integrated with DGs based on FCLs and adaptive relays. Electr. Power Syst. Res. 2022, 205, 107738. [Google Scholar] [CrossRef]
- Muhammad, Y.; Amin, J.; Kashem, M.M.; Danny, S. An Adaptive Overcurrent Protection Scheme for Dual-Setting Directional Recloser and Fuse Coordination in Unbalanced Distribution Networks with Distributed Generation. IEEE Trans. Ind. Appl. 2022, 2, 1831–1842. [Google Scholar]
- Hoang, T.T.; Quoc, T.T.; Yvon, B. An Advanced Protection Scheme for Medium-voltage Distribution Networks Containing Low-voltage Microgrids with High Penetration of Photovoltaic Systems. Int. J. Electr. Power Energy Syst. 2022, 139, 107988. [Google Scholar] [CrossRef]
- Su, C.; Zhou, W.; Meng, L.; Yang, S.; Li, T.; Hu, X. Research on Loop-Closing Strategy of Two-Way Active Distribution Network Based on Power Flow Controller. In Proceedings of the 2021 IEEE/IAS Industrial and Commercial Power System Asia (I&CPS Asia), Chengdu, China, 2 December 2021; pp. 132–135. [Google Scholar]
- Chen, T.H.; Huang, W.T.; Gu, J.C.; Pu, G.C.; Hsu, Y.F.; Guo, T.Y. Feasibility Study of Upgrading Primary Feeders From Radial and Open-Loop to Normally Closed-Loop Arrangement. IEEE Trans. Power Syst. 2004, 19, 1308–1316. [Google Scholar] [CrossRef] [Green Version]
- Huang, W.T.; Chen, T.H. Assessment of Upgrading Existing Primary Feeders from Radial to Normally Closed Loop Arrangement. In Proceedings of the IEEE/PES Transmission and Distribution Conference and Exhibition, Yokohama, Japan, 6–10 October 2002; pp. 2123–2128. [Google Scholar]
- Kerzel, M.; Garzon-Real, J.; Zdrallek, M.; Wolter, D.; Schacherer, C. Optimal Switch Configuration Algorithm for Dynamically Meshed Power Distribution Grids. In Proceedings of the 2020 International Conference on Smart Energy Systems and Technologies (SEST), Istanbul, Turkey, 7–9 September 2020; pp. 1–6. [Google Scholar]
- Loos, M.; Werben, S.; Maun, J.C. Circulating Currents in Closed Loop Structure, a New Problematic in Distribution Networks. In Proceedings of the 2012 IEEE Power and Energy Society General Meeting, San Diego, CA, USA, 22–26 July 2012; pp. 1–7. [Google Scholar]
- Chen, L.; Xu, X.; Yao, L.; Xu, Q. Study of a Distribution Line Overload Control Strategy Considering the Demand Response. Electr. Power Compon. Syst. 2014, 42, 970–983. [Google Scholar] [CrossRef]
- Grond, M.O.W.; Morren, J.; Slootweg, J.G. Integrating Smart Grid Solutions into Distribution Network Planning. In Proceedings of the 2013 IEEE Grenoble Conference, Grenoble, France, 16–20 June 2013; pp. 1–6. [Google Scholar]


Publisher’s Note: MDPI stays neutral with regard to jurisdictional claims in published maps and institutional affiliations. |
© 2022 by the authors. Licensee MDPI, Basel, Switzerland. This article is an open access article distributed under the terms and conditions of the Creative Commons Attribution (CC BY) license (https://creativecommons.org/licenses/by/4.0/).