Article

The Impact of Innovation-Driven Strategy on High-Quality Economic Development: Evidence from China

1
School of Law and Business, Sanjiang University, Nanjing 210012, China
2
School of Economics and Management, Nanjing University of Science & Technology, Nanjing 210094, China
3
College of Humanities and Social Sciences, Xi’an Jiaotong Liverpool University, Suzhou 215000, China
4
School of Management Science and Engineering, Nanjing University of Information Science & Technology, Nanjing 210044, China
*
Authors to whom correspondence should be addressed.
Sustainability 2022, 14(7), 4212; https://doi.org/10.3390/su14074212
Submission received: 17 March 2022 / Revised: 30 March 2022 / Accepted: 31 March 2022 / Published: 1 April 2022

Abstract

:
It is of great significance to study the impact of innovation-driven strategy on high-quality development. This paper investigates the relationship between the economic development quality index (EDQI) and the innovation-driven index (IDI) using the entropy method based on China’s macroeconomic data from 2000 to 2019. It examines the impacts of innovation-driven strategy on the economy using systematic cluster analysis and the impact of innovation on economic development quality through regression analyses. Results of empirical analyses illustrate that the innovation-driven strategy of China has played an important role in the quality of economic development. Still, the lack of hard innovation leads to primary and secondary industries’ insufficient development quality. Different innovation indicators have different effects, and the overall efficiency of financial research funds is insufficient. Further, the results also show that the positive role of innovation-driven strategy is mainly realized through high-tech markets in China. Therefore, R&D investment should focus on high-tech industries or fields related to the national economic lifeline or strategic industries, such as environmental protection, microchips, and high-end instruments industries in China. This paper attempts to study the effect of China’s innovation-driven strategy on the quality of economic development to provide reference experience for developing countries’ sustainable economic development.

1. Background

China’s economy has been booming since the innovation-driven strategy was launched in 2012. China has invested significant resources in transforming its economy. The priorities of its reforms have been changed from investment-driven to technological progress and from technology introduction to independent innovation, from a high-carbon economy to a low-carbon economy. China’s economic development stage has gone through two stages: production factor-driven and investment-driven. Now, it has been entering a stage of innovation-driven economic development.
However, there are still many problems in China’s current economic development. Ma J [1] considered Pivotal R&D and technology should solve the technology innovation evaluation of equipment manufacturing enterprises and promote the innovation of its subjects. Leavit [2] held that profit organizations’ competitive driving force is important for technology development. Innovation has become the origin of driving entrepreneurship through technology spill-over and impacts enterprise development and the economy [3].
Reform-era innovation policy strategies have established China’s innovation capabilities [4]. The Chinese leadership adopted the so-called “revitalizing the nation through science and education” strategy in 1995. In 2005, China put forward the important task of building an innovative country by 2020 before proposing the innovation-driven strategy in 2012. Until 2020, there were 78 innovative national cities in China, accounting for 10% of the land area and 33% of the population [5]. China’s national science and technology parks and innovation policies are the main driving forces of China’s innovative economy [6].
The innovation-driven strategy was launched ten years ago, but there are also deep economic growth and unsustainability problems [7]. Therefore, China proposed a high-quality strategy for economic development in 2018, which includes the quality of economic development at the micro-level, high quality at the macroeconomic level, and high quality of social and livelihood undertakings.
The purpose of this research is to explore the effect of China’s innovation-driven economic development strategy and its impact on the quality of China’s economic development. China’s economic growth has changed from high speed to medium-low speed. There are many problems in the quality of economic development. To cope with the weak recovery of the international economy and the unfavorable external development environment, China should further promote the rationalization proposal of the innovation-driven strategy. It can also provide a useful reference for other countries to formulate economic development strategies.
This research creatively uses the entropy method to calculate China’s economic development quality index and innovation driving index and carries out regression analysis to study the impact of innovation driving on the quality of economic development. Cluster analysis is used to verify that China’s innovation-driven strategy has played a role in driving China’s economic development. These research methods are helpful to enrich the study model of the Chinese economy and improve management practice. It can also have a positive impact on improving social and public policy.
This paper is structured as follows: Section 2 is the literature review, and Section 3 outlines the materials and methodology. Section 4 is a metrological analysis, and Section 5 is the results of the metrological analysis. Section 6 concludes and provides recommendations.

2. Literature Review

2.1. Innovation-Driven Strategy

Michael E. Porter initially proposed the concept of innovation-driven economic development. He divided national economic development into four stages: factor-driven growth, investment-driven growth, innovation-driven growth, and wealth-driven growth [8]. In the first three stages, the national economy grows rapidly, while the fourth stage is the turning point of national economic development, which may lead the national economy into recession.
The key success factor of open innovation-driven companies is building a strategic map and formulating an action plan to measure key drivers. However, we also need to point out that social institutions lack the norms and regulations required by a well-functioning economy [9]. The correlation between regulatory and cultural cognitive dimensions is different between factor-driven (or production-driven) countries and innovation-driven countries [10]. At the same time, unlimited technology acceleration has a potential impact on the possibility of unrest in a technology-driven society [3]. There are still various factors affecting the economic effect of the government’s innovation-driven strategy at the national level.
Promoting an innovation-driven strategy requires a higher material and technological foundation. Innovation, higher education, and technology preparation have a positive and significant impact on entrepreneurial activities in innovation-driven countries but not in factor-driven countries [11]. An innovation-driven strategy should play the role of social and ecological education in economic development [12]. Moreover, it can create a social innovation culture in the atmosphere by cultivating the understanding of creativity, flexibility of change, and innovation resources [13].
Making full use of new technologies such as the Internet and intelligent devices gives play to the ease of use and value of information and data. It promotes patent research, technology, and innovation activities [14]. The government should seek appropriate measures to support innovation clusters and accelerate regional economic and investment policies and university research [15]. These measures will affect the economy, technology, culture, and system.

2.2. The Relationship between Innovation-Driven Strategy and Economic Development

From the national economic level perspective, Marsiglio Simone [16] thought that it is undeniable that the innovation-driven strategy can effectively promote economic growth. The innovation of the national economy is the key factor to stimulate economic growth and enhance competitiveness. Effective national innovation policies and strategies can create conditions for enterprise development and national competitiveness.
Dobrzanski P [17] found that even countries with limited innovative capacity need to gradually increase R&D expenditure to achieve innovation-driven growth and economic development. Under normal conditions, the government generally only supports promoting the innovation output of innovative enterprises. In other cases, the government can provide more special R&D subsidies to ensure the effectiveness of innovation policies [18]. Due to low productivity, high production cost, limited development capacity, inefficient management structure, limited skills training, and system inefficiency caused by rising labor costs, the international market competition is very fierce. Walsh John Christopher [19] considered that only innovation-driven could overcome these competitive challenges.
There are differences between countries in the transition from efficiency-driven to innovation-driven. Developing countries need to pay attention to the impact of social capital and establish an information/feedback collection system to improve the innovation and competitiveness of the market when experiencing various transformation problems [20].
There are differences between enterprise innovation and enterprise productivity performance [21]. Du Weijian [18] holds that government support can only increase the intensity of innovation; the breadth of innovation is insufficient in the case of less competition. So, without innovation, government support does not necessarily improve the innovation probability of enterprises. If competition is insufficient, the breadth of innovation will be insufficient. Therefore, government support will not necessarily increase the innovation probability of enterprises.

2.3. The Innovation-Driven Strategy and China

In China, the innovation incentive under the government-led economic system can be much more than those under the market-led economy, rather than much less. Government-led may be more conducive to transforming China’s economy from a factor- and investment-driven economy to an innovation-driven economy. However, Ji Y. [22] put forward that government-led will reduce the initial value of innovation. Since 2011, China’s economic growth has been declining rapidly. The average growth rate decreased from nearly 10% in 1979–2010 to 6.7% in 2016, a drop of over 3%. The root cause of the economic slowdown is the lag of deep-seated institutional reform, which is the lack of a system suitable for innovation-driven strategy. By deepening comprehensive market-oriented reform, China must further enhance economic inclusiveness and accelerate its transformation into an efficiency-driven and innovation-driven economy [23]. The export-oriented economic model has experienced a development stage driven by factors and investment and has accumulated multiple distortions and structural imbalances. China is undergoing quantity transformation to produce high-quality service and knowledge-intensive products and using locally designed technologies to meet domestic demand [24]. China needs to move more firmly to the stage of innovation-driven growth.
Since 2012, China’s innovation has achieved leapfrog economic development. Nowadays, innovation has become the main driving force of China’s economic development; high-tech industries especially have made great contributions [25]. Innovation, which transforms China’s economic structure into a more advanced model of technological progress and improvement in technical efficiency, is the main driving force for the growth of the green total factor productivity index in relatively backward areas. Eliminating internal administrative barriers and improving resource and energy efficiency will also help promote the transformation of urban agglomeration development from a factor-driven economy to an innovation-driven economy [26]. From the supply side, it will improve the quality and efficiency of the supply system and promote overall economic development. Wu F. [27] considered that the government should combine the innovation-driven strategy with the patent protection mechanism. Butt Atif Saleem [28] believes through research that China’s key to becoming a global innovation power lies in the innovation ecosystem and plays the role of policies in promoting scientific and technological innovation.
Research on the mechanism of China’s innovation-driven strategy driving economy. Chen Xiafei [29] studied the effect of innovation performance and economic development from the driving mechanism of innovation performance and explained that implementing an innovation-driven strategy is of great significance to China’s economic development. Hutschenreiter [4] studied China’s 30 years of economic development, in which the economic growth model left behind social and economic risks and sustainable development problems and pointed out that innovation is the key factor to solving the problem of relying on low-cost and resource-intensive manufacturing. Wonglimpiyarat [30] pointed out that China improves the cooperation among institutions in the innovation system through government intervention policies, especially innovation financing policies, which bring business creation and economic growth. Liang [31] concluded that technological innovation and regional economic coordination could form an interactive development relationship and contribute to high-quality economic development.
In China’s National Innovation-driven Development Strategy Program, it is argued that the combination of scientific and technological innovation supported by institutional, management, business model, formatting, and cultural innovation will lead to the transformation of development to be reliant on the continuous accumulation of knowledge, technological progress, and improvement in the quality of labor. Additionally, the quality of economic development mainly includes the coordination of economic structure, the improvement in economic efficiency, the degree of economic stability, the improvement in people’s lives, and the balance of environment and ecology [32]. The connotation of an innovation-driven strategy is the harmonious role of innovation-driven elements, which aim at economic growth and development. Different stages and levels of economic development need different development impetus [33]. Implementing an innovation-driven strategy to promote the quality of economic development is mainly reflected in the economic effect, economic level, green economy, coordinated economy, and innovation economy [34]. Through the innovation-driven strategy, it is helpful to promote the economic development stage and level, realize the harmony between man and nature and social harmony, and realize the development of circular and green economies [34]. According to the above relationship between the innovation-driven strategy and economic development quality, the change in economic development quality indicators should be consistent with the effect of the innovation-driven strategy [35], and innovation-driven should also have an impact on social capital formation, household consumption, and net exports of goods and services, whether through direct or indirect effects. See Appendix A for the mechanism of the innovation-driven strategy driving economic development.

3. Materials and Methodology

This paper will first study the effect of an innovation-driven strategy to explore the impact of China’s innovation-driven strategy on the quality of economic development, then study the relationship between economic development, quality index (EDQI), and innovation-driven index (IDI). Further, study the impact of an innovation-driven index on the quality of economic development.
Assumptions of this paper:
  • China’s innovation-driven strategy impacts all aspects of the macroeconomy;
  • China’s innovation-driven factors have a positive effect on the quality of economic development;
  • Innovation driving factors have a positive impact on the quality of economic development (EDQ).

3.1. Materials

Goh [8], from the perspective of the evolution of Singapore’s industrialization process, explained that the national economic strategy must take industrial development as the goal and consider that value creation and pursuit of innovation promote an innovation-driven economy, which includes world-class exports, highly-skilled jobs, and high industry growth. Liang [31] believed that the mechanism of the innovation-driven economy is a closed cycle of regional economic growth, technological innovation, knowledge spill-over, technology diffusion, and innovation. Wang [36] used economic infrastructure (EI), the quality and structure of innovators (QSI), and regional openness (RO) to reveal the relationships between the regional innovation environmental components and innovation efficiency (IE). Chen [29] studied the economic structure effect, R&D intensity effect, innovation efficiency effect, and economic development effect according to the driving mechanism.
Therefore, this research adopted the indicators selected in this study, mainly referring to their research indicators. As for the selection of the indicators of green, social harmony, and innovation, they are used to reflect the value of the quality of economic development. The explanation considered the new concepts of innovation, green, harmony, and win–win of Chinese economic development. The specific explanation is put in Appendix A Table A1. In this study, R&D, patents, high technology, and the full-time equivalent of R&D personnel, etc., are selected as innovation driving factors and factors affecting the quality of economic development.
The data used in this study are from the Bureau of Statistics of the People’s Republic of China (refer to http://www.stats.gov.cn/easyquery.htm?cn=C01). These indicators are shown in Appendix A Table A1. The main performance indicators are economic effects, GDP, the three industries’ added value, and fiscal revenue. At the economic level, the composition of the three industries is the main indicator. In the green economy, energy processing conversion rate, environmental governance investment, energy consumption, import, and export are always the main indicators. Economic coordination is mainly reflected in total labor productivity, the rate of high-quality products, education funds, per capita health funds, social insurance fund income, catering turnover, and tourism expenditure. The innovation economy is mainly reflected by research costs, high-tech product export, technology market transaction volume and the full-time equivalent of R&D personnel. The following indicators were selected for innovation-driven data: the full-time equivalent of R&D personnel; basic, applicated, and experimental research expenditure on research and experimental development; the number of invention patent apsplications authorized; the export volume of high-tech products; and the turnover of the technology market. For use in the cluster analysis, data were acquired from 2000 to 2018 to exclude the effect of the July 2018 Sino–American Trade War, but for all other analyses, data were acquired from 2000 to 2019.

3.2. Methodology

There are many research methods in the literature on China’s innovation-driven strategy. Generally speaking, there are two methods: the index method and the econometric model. For example, Liang Longwu [31] used the Malmquist productivity index to calculate innovation efficiency. Chen Xiafei [29] used the Logarithmic mean divisor index (LMDI) to analyze innovation performance. Fan Fei [37] used the DEA method and the spatial econometric model to research China’s city innovation.
This paper mainly studies the economic effects of innovation-driven strategy at the macro level. Therefore, it may be easier to determine whether the macroeconomic indicators take the innovation-driven strategy as the inflection point by using the system cluster method. The entropy method is easier to reflect the time-based change in EDQI and IDI. The most commonly used linear regression analysis method was used to analyze their relationship. The regression analysis used the least square method and stepwise progressive regression method.

3.2.1. Systematic Clustering Method

The basis of systematic clustering is that different samples can be divided into different groups (classes) due to similarity. For time series i x i , i = 1, 2,…, 20, the methods of systematic cluster analysis are as follows:
First, each sample forms a class and the statistic d ij and the statistic d ij is used to measure the similarity between samples. Here d ij is defined as:
d ij = x i x j 2 i j , ( i , j = 1 , 2 , ,   20 )
The samples with the smallest d ij are classified into one class, and the samples with long-distance belong to different classes.
Second, the minimum distance method is still used to measure the similarity between different classes. The two sample distances with the smallest distance in the two classes are used as the inter-class distance, and the two classes with the smallest inter-class distance are grouped into one class.
Repeat the process in sequence until all samples are grouped into one class.
Finally, a complete classification system diagram, also known as the pedigree diagram, is gradually drawn according to the relationship between various types. The clustering results show that the group construction difference is the largest and the intra-group difference is the smallest.
This statistical analysis was conducted using SPSS Statistical software.

3.2.2. The Entropy Method

According to the national statistical index data performances in Appendix A Table A1 from 2000 to 2019, the entropy method was used to calculate the quality index of China’s economic development to explore the relationship between innovation-driven economic indicators and the quality of economic development. Due to the time series trend of statistical data, the comprehensive score of entropy analysis must also have an increasing trend in time. However, its patterns or characteristics can still be explored through entropy analysis. The specific data processing steps are as follows:
(1) Establish the original data matrix:
x 1 , 1       x 1 , 2                 x 1 , 22 x 2 , 1     x 2 , 2             x 2 , 22 x 20 , 1     x 20 , 2               x 20 , 22
where i is the years from 2000 to 2019 and j are the 22 indicators of innovation-driven strategy-driven economics.
(2) Reverse index processing. The proportion of the first and the second industries decreases over time, while other indicators increase. We need to address these two reverse indicators in a reciprocal method. The inverse index takes the reciprocal to arrive at x ij | .
(3) Data standardization ( P ij ). Standardization eliminates different data dimensions and solves the problem of incompatibility but retains the data distribution characteristics. Then set
P ij = X ij | x j ¯ σ j ,   i = 1 ,   2 ,   ,   20
where
x j ¯ = X ij | i = 1 20 X ij |
σ j = ( X ij | x j ¯ ) 2 20
and j = 1, 2, …, 22.
(4) Eliminate negative values ( P ij | ). We order P ij | = P ij + b, among them, b > min{| | P ij | |}, which make P ij | > 0, the smaller the value of b, the better the effect. The following P ij | matrix then becomes:
(5) Measuring the available data ( y ij ), we have
y ij = P ij | i = 1 20 P ij |
(6) Computing information entropy ( e j ), we have
e j = i = 1 20 y ij × ln y ij ln 20 ,   j = 1 ,   2 ,   ,   22
(7) Calculate the effect value ( g j ), we have
g j = 1 e j ,   j = 1 , 2 , ,   22
(8) Calculate the weight of different performance indicators ( W j ), we order
W j = g j j = 1 22 g j ,   j = 1 ,   2 , ,   22
(9) Calculate the quality index of economic development ( Z i ), we order
Z i = j = 1 22 W j × y ij × 100 ,   i = 1 , 2 ,   ,   20

3.2.3. Least Squares Method

Establish a multiple linear regression model, matrix representation:
Y = X β + e ,
where   Y = y 1 y n ,   and   X = 1     x 12     x 13     x 1 k 1     x 22     x 23     x 2 k 1     x n 2     x n 3     x nk ,
where Y is the dependent variable, x ij represents the Ith year, the j-1 indicator in the time series is the observed value of the independent variable. β is the regression coefficient:
β = β 1 β 0 β k , e represents the error term, and e = e 1 e n .
Then e = Y − Xβ. Take the sum of squares of errors 1 n e i 2 as loss function.
Then 1 n e i 2 = e | e   = Y X β | Y X β , e | is the transpose of e.
To obtain the optimal linear model, it should minimize the loss function, that is, mix the sum of squares; the following requirements shall be met:
e | e β   = 0 ,   namely , 2 X | Y   + 2 X | X β   = 0
Then we obtained the estimated coefficient of the regression model:
β   = X | X 1 X | Y
This statistical analysis was conducted by using EViews statistical software.

3.2.4. Stepwise Regression Method

This paper adopted stepwise estimation to find the best regression model and used the least independent variables but enough to explain the maximum of the whole regression model, to solve the collinearity problem between variables. The steps of this method are as follows:
First, select the independent variable with the largest correlation coefficient with the dependent variable. Then, among the remaining independent variables, use the backward deletion method to test whether variables are deleted in the regression equation for each new independent variable. Test until all the selected variables reach a significant level and finally obtain the best model by adding the selected variables forward and deleting them later. The correlation coefficient of the independent variable x 1 with dependent variable Y is recorded as follows:
r x 1 y = x 1 x 1 ¯ y y ¯ x 1 x 1 ¯ 2 y y ¯ 2
The partial correlation coefficient independent variable x 2 with the dependent variable Y is recorded as follows:
r y x 2 , x 1 = r yx 2 r yx 1 · r x 2 x 1 · 1 r x 2 x 1 2
where the influence of x 1 is excluded from x 2 .
This statistical analysis was conducted by using SPSS Statistical software.

4. Metrological Analysis

4.1. Entropy Analysis Economic Development Quality Index and Innovation-Driven Index

China’s economic development quality index (EDQI) for 2000 to 2019 was finally obtained by calculating the above steps. According to the corresponding innovation indicators, such as R&D personnel’s full-time equivalent and expenditure, high-tech product export volume, technology market transaction volume, China’s innovation-driven index (IDI) was calculated. Results are presented in Table 1; then, we obtained the line diagrams of the index in Figure 1. In general, EDQI and IDI curves had the same fluctuation.
China’s strategy of innovation-driven has promoted significant changes in economic development. In Figure 1, two inflection points show that China’s innovation-driven strategy has played a role. In other words, the innovation-driven strategy of China has a positive impact on the quality of economic development. On the whole, the two have the same growth trend. However, the gap between the two lines is becoming larger and larger. Therefore, China’s EDQI and IDI are entering the slow growth period, so we need to study further how to develop economic development and innovation.

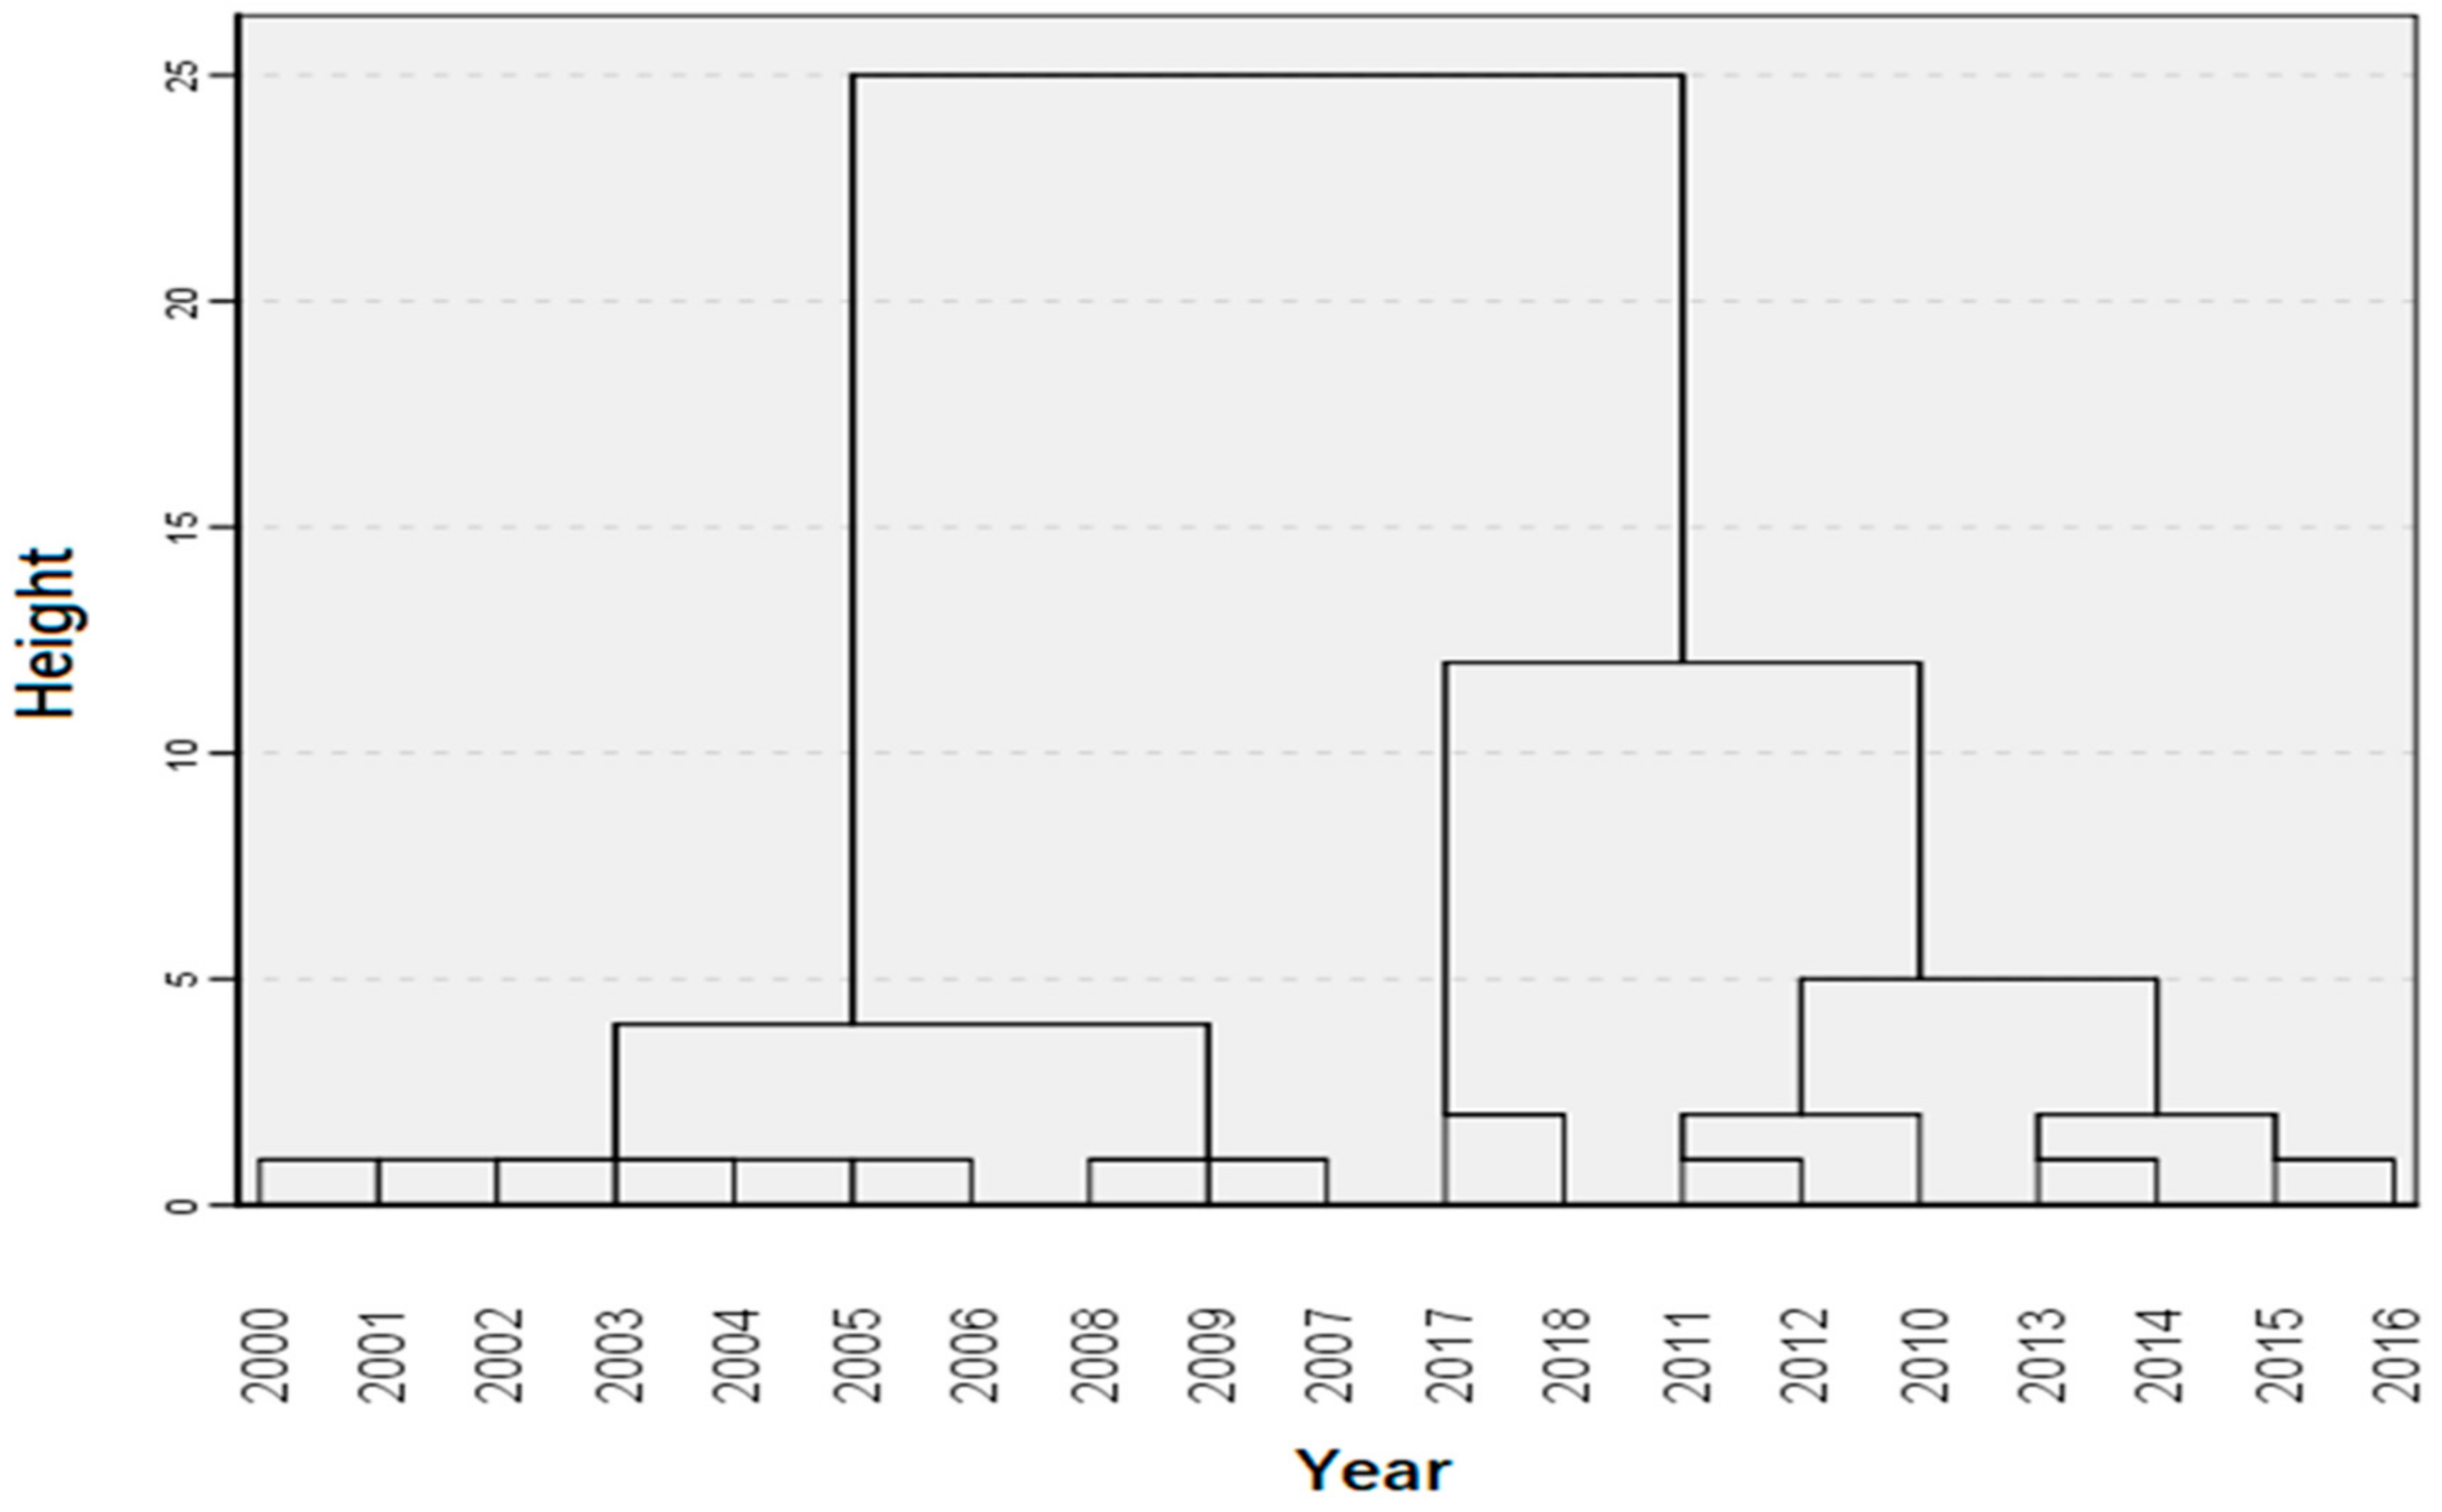
4.2. Systematic Cluster Analysis of the Impact of Innovation-Driven Strategy on Economic Development in China

4.2.1. Systematic Cluster Analysis of Economic Indicators

Given the great impact of Sino-US economic and trade friction on China’s economy after 2018, data from 2000 to 2018 were used. The results of the nominal GDP cluster analysis are presented in Figure 2. There, GDP is divided into two groups with different natures by 2010. Since the outbreak of the US subprime mortgage crisis in 2008, China has gradually focused on “the Supply-side Structural Reform,” “the New Normal” of the economy, and the transformation of economic growth power. The systematic cluster analysis analyzed other indices. The statistical analysis results are as follows: real GDP, total capital formation, M1 money supply, the primary industry’s added value of the secondary industry, and the export of high-tech products were divided into two categories, namely 2000–2010 and 2011–2018. Household consumption, R&D expenditure, patent application authorization, M2 money supply, and added value of the tertiary industry were divided into two categories from 2000 to 2012, and 2013 to 2018, respectively. Technology market turnover and energy processing conversion rates were divided into two categories centered on 2010 and 2014, respectively. The net exports of goods and services trade were divided into three categories from 2000 to 2005, 2018, and 2006 to 2017.

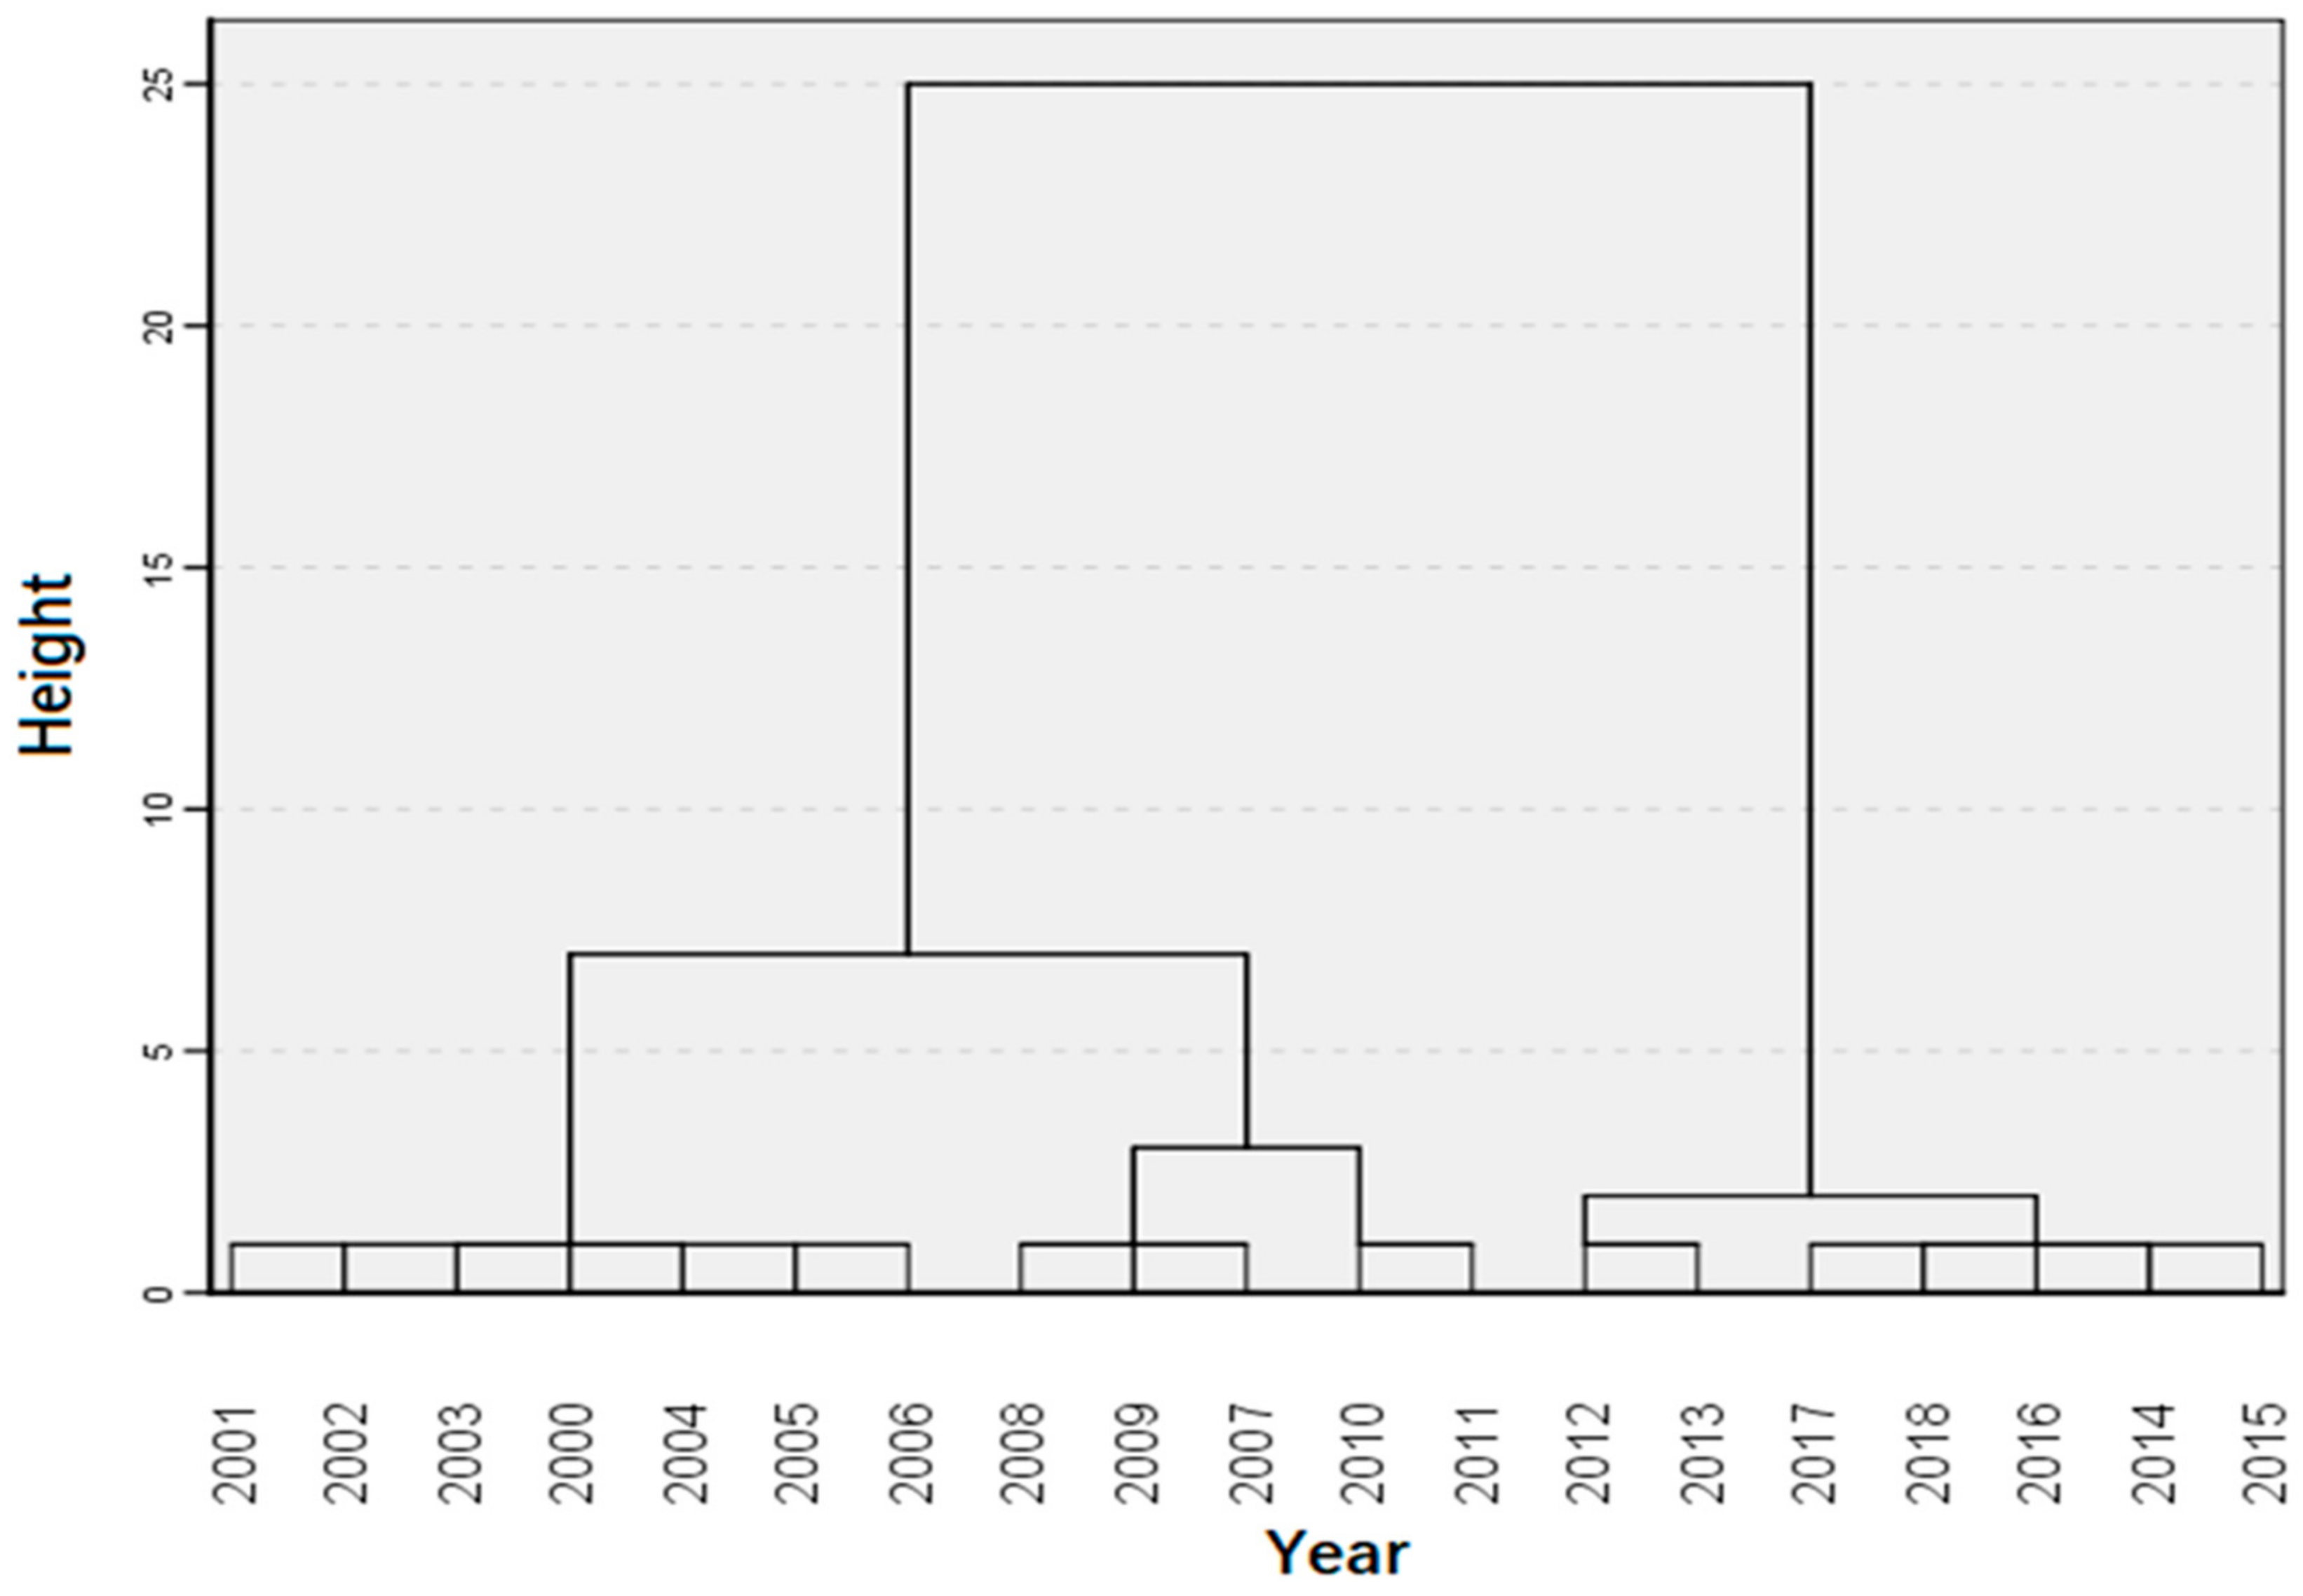
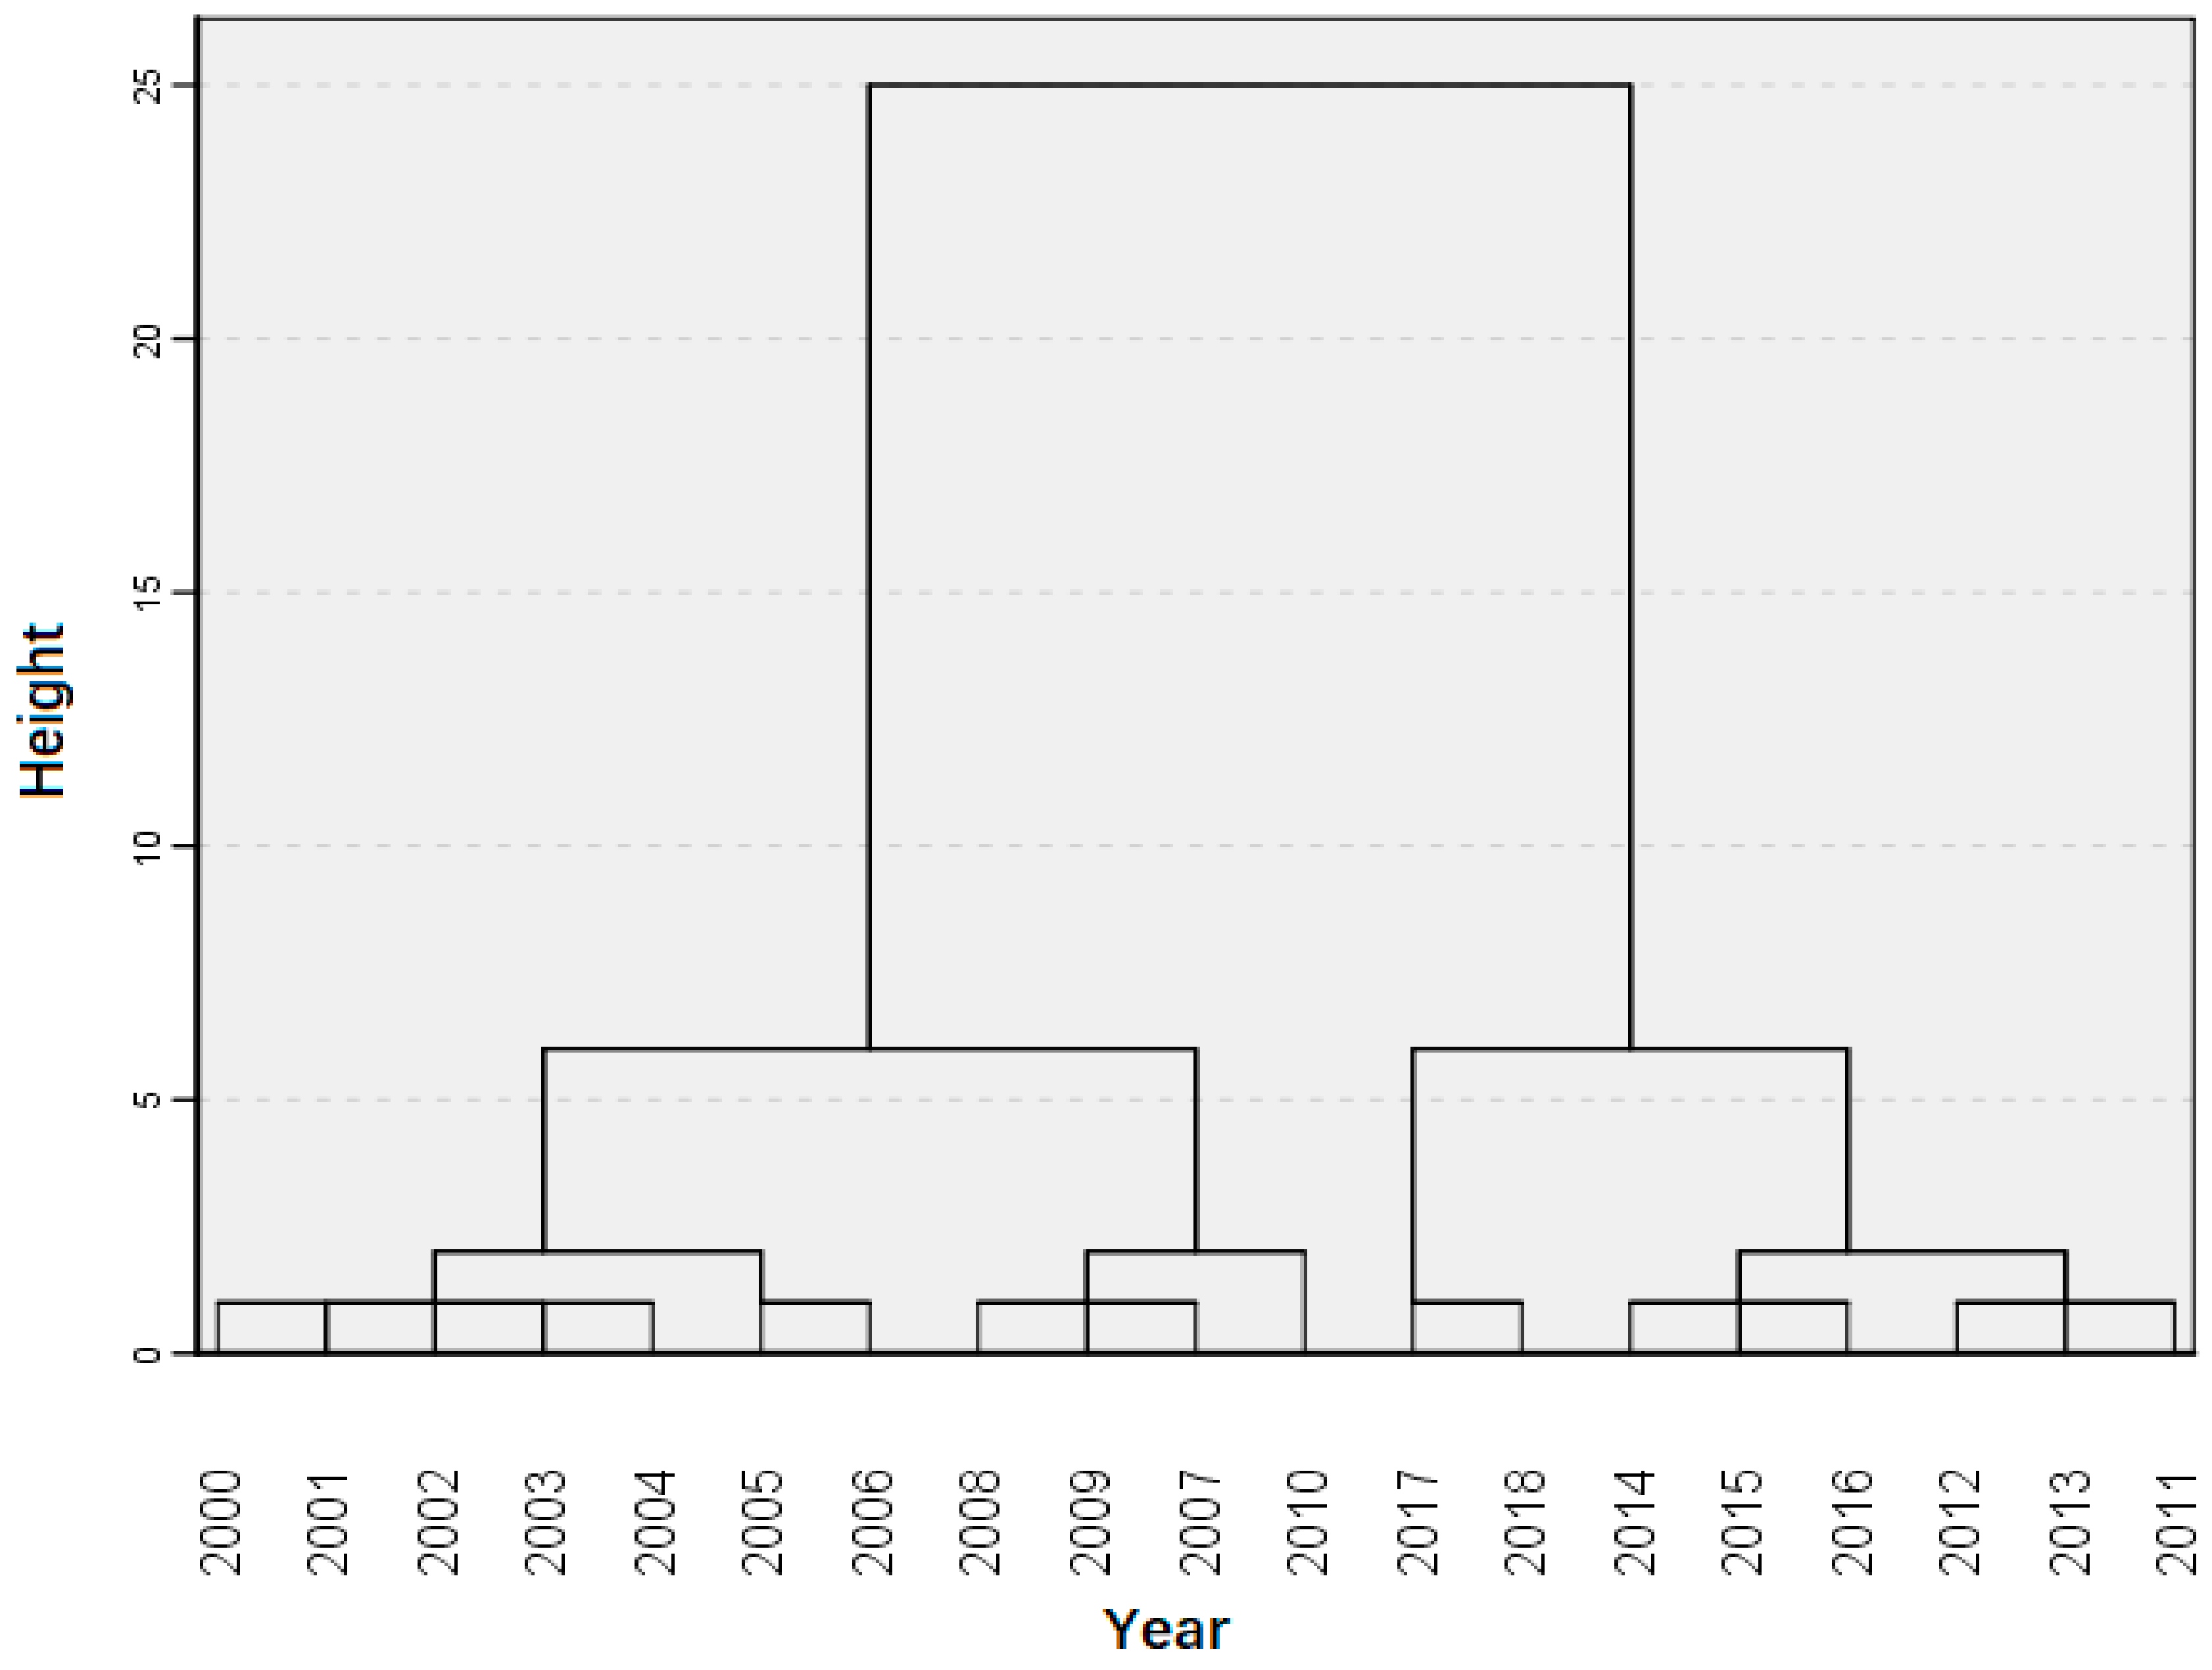
4.2.2. System Cluster Analysis on the Impact of Innovation Drive on the Added Value of China’s Industries

Through the system cluster analysis, after 2000, China’s economic index GDP clustering had a certain consistency with the National Five-Year Plan, which showed that China’s Five-Year Plan plays a positive role in economic development. Added value can reflect the effect of innovation-driven economic development. In order to further explore the impact of innovation-driven on the quality of economic development, this paper made a systematic cluster analysis of the added value of the three industries in Figure 3, Figure 4 and Figure 5.
To sum up the systematic cluster analysis, the internal properties of data were clustered into different classes, and the reasons for clustering can be found in the external environment and cases. The segmentation point of index clustering coincided with the innovation-driven strategy’s start-up time. The implementation of an innovation-driven strategy must have a positive impact on various macroeconomic indicators through the policy transmission mechanism, which is mentioned in the literature.

4.3. Regression Analysis of Economic Development Quality and Innovation-Driven Economic Indicators

4.3.1. Regression Analysis of EDQI and IDI

According to EDQI and IDI, the following univariate linear regression model 1 can be established as follows:
EDQI =   β 0 +   β 1 IDI + ε
where ε is the error term.
Regression analysis is performed through least squares (LS), and results are presented in Table 2, output results of the model test in Table 3 and Figure 6.
From the residual heteroscedasticity test and autocorrelation test in Table 2 and the residual normal distribution test in Figure 5, we determined that the model’s assumptions are tenable, which means that the conclusion of regression analysis is reasonable.
So, the resulting estimation regression equation is as follows:
EDQI = 0.037 + 0.805 IDI

4.3.2. Regression Analysis of EDQI and Innovation-Driven (ID)

Based on the economic development quality index (EDQI), and seven indicators reflecting the innovation-driven index: the full-time equivalent of R&D personnel ( X 1 ), basic expenditure of R&D ( X 2 ), applied expenditure of R&D ( X 3 ), experimental expenditure of R&D ( X 4 ), number of invention patent applications authorized ( X 5 ), import and export volume of high-tech products ( X 6 ), and technology market turnover ( X 7 ), we established multiple regression model 2:
ln EDQI = β 0 + β 1 ln X 1 + β 2 ln X 2 + β 3 ln X 3 + β 4 ln X 4 + β 5 ln X 5 + β 6 ln X 6 + β 7 X 7 + ε
where ε is the error term. We used the LS method for regression, and the obtained regression estimation equation is as follows (20). The results of multiple linear regression are shown in Table 4, and the output results of the model test are shown in Table 5.
ln EDQI = 4.2 0.21 ln X 1 0.26 ln X 2 0.04 ln X 3 + 0.56 ln X 4 + 0.04 ln X 5 + 0.13 ln X 6 + 0.27 ln X 7
According to Table 4, the F statistics and global linear equation test passed the significance test requirements. At the 0.05 significance level, explanatory variables, such as experimental research funds ( X 4 ), import and export volume of high-tech products ( X 6 ), and technology market turnover ( X 7 ), were significantly correlated with China’s economic development quality. In contrast, other explanatory variables, such as research and the full-time equivalent of R&D personnel ( X 1 ), basic research funds ( X 2 ), applied expenditure of R&D ( X 3 ). Number r of invention patent applications authorized ( X 5 ), did not pass the significance test. At the same time, the coefficients of the full-time equivalent of R&D personnel, basic research funds, and applied research funds were negative, which is not in line with reality. The general equation passed the linear correlation test, but some variables failed the significance test. However, the explanatory variables of R&D personnel’s full-time equivalent, basic research funds, and applied research funds were not in line with reality. The coefficient of the explanatory variable, the number of invention patent applications authorized, did not pass the significance test. Therefore, there may be multiple linear correlations between variables in the model.
According to the residual analysis shown in Table 5, there was no heteroskedasticity, autoregression, or autocorrelation in the model. Meanwhile, because the unit root test of residual proved that there was no unit root, there was a cointegration relationship between variables, which is suitable for the regression model. Because the coefficients of related variables still did not pass the significance test and the coefficients were negative, there may be multiple collinearities among variables, which must be modified.

4.3.3. Model Modification

Given the multicollinearity between variables, the elimination of some variables was considered. Therefore, the stepwise regression method was adopted to obtain the best model. Results are presented in Table 6, and the final model is as follows:
ln EDQI = 3.76 + 0.37 ln X 4 + 0.13 ln X 6 + 0.13 ln X 7
This result showed that, in the model, variables X 4 , X 6 , and X 7 passed the significance test, but all other variables were rejected.
To summarize the above regression analysis, the EDQI and IDI models were tested, and the optimal multivariate linear model was obtained, showing that the driving mechanism of innovation plays a role. However, the government cannot use the same force in all aspects of the innovation-driven strategy, and the effects of different indicators are also different. Therefore, some innovation indicators in the final model were excluded. At the same time, it may also be a problem with the program or execution in the execution process of strategy.

5. Results of Metrological Analysis

5.1. Results of Systematic Cluster Analysis

5.1.1. Results of Systematic Cluster Analysis of Economic Indicators

China’s innovation-driven strategy was formally put forward in 2012; the impact of China’s innovation-driven strategy is reflected in various economic indicators. China has carried out economic activities around the innovation-driven strategy in all aspects.

5.1.2. Results of Systematic Cluster Analysis of the Added Value of China’s Industries

In Figure 3, Figure 4 and Figure 5, China’s innovation-driven strategic effect was different in the three industries.
In the cluster combination of the value-added system of the primary industry, the cluster combination conformed to the different characteristics before and after the innovation-driven strategy. Nevertheless, the similarity in different years showed a time-series combination. This time-series trend was obvious, reflecting the non-randomness of the data; that is, the influencing factors of economic development were not the only ones driven by innovation.
In the cluster combination of the added value system of the secondary industry, the cluster combination had different characteristics before and after the innovation-driven strategy. Still, the similarity of different years showed a stage time non-sequential combination, and the impact of innovation-driven on the secondary industry’s added value had some delay lag phenomenon.
In the cluster combination of the value-added system of the tertiary industry, the cluster combination was completely consistent with the different characteristics before and after the innovation-driven strategy, and the stage progression was similar, indicating that the influencing factors were stable.

5.2. Results of Regression Analysis

Equation (18) showed a positive correlation between EDQI and IDI, which confirmed the resonance of the two mentioned above, namely, every 1 increase in IDI increased EDQI by 0.805. From the regression coefficient value, we can understand why the gap between the two indices is expanding.
From the multiple regression analysis, China’s economic development quality index was mainly affected by the experimental expenditure on R&D, the import and export volume of high-tech products, and the turnover of the technology market. Other innovation-driven indicators had an insufficient impact on the quality of economic development. In particular, the two indicators of applied R&D expenditure and basic R&D expenditure in R&D expenditure were excluded from the multiple regression model.

6. Conclusions and Recommendations

6.1. Conclusions

6.1.1. Conclusions of Cluster Analysis

China’s innovation-drive strategy has had an impact on economic development; that is, the first hypothesis of this paper is tenable:
According to the cluster analysis, other China macroeconomic indicators had similar cluster groupings with GDP, indicating that macroeconomic indicators generally reflect China’s innovation-driven strategy. China has carried out economic activities around the innovation-driven strategy in all aspects, and China’s innovation-driven strategic role has emerged.
Due to the inertia of economic growth, the time demarcation point was advanced. Therefore, it can be considered that the changes in nominal GDP, real GDP, total capital formation, the added value of the primary industry, added value of the secondary industry, and M1 money supply were consistent with the innovation-driven strategy. Considering the lag of policy and the lag of effect, we think that the changes in household consumption, R&D expenditure, patent application authorization, the tertiary industry’s added value, and M2 money supply were consistent with the effect of innovation-driven strategy.
As for the indicators of the volume of trade in the technology market, the conversion rate of energy processing, and the export of high-tech products, these indicators’ change nodes were ahead of other indicators due to the implementation of national policies, such as technology introduction, technology innovation, energy conservation, and emission reduction, high-tech industry, and other national policies, before the innovation-driven strategy. It can be considered that they are implementing an innovation-driven strategy.
As for the net export index of goods and services, since China’s reform and opening up, the economic growth model has been driven by investment, consumption, and exports. Due to the slow recovery of the world economy from 2009 to 2018 and the continuous challenge of the Trump administration to the world economic order in 2017, it is normal that China’s net exports of goods and services were inconsistent with the innovation-driven effect.
However, in industry, China’s inn has played a positive role in developing the tertiary industry-driven strategy. In contrast, the driving effect on the development of the primary and secondary industries is not particularly stable.
We can see that the current innovation-driven strategy positively impacts the quality of economic development, but China still lacks hard innovation. China’s economic development is mainly benefited from China’s soft innovation, such as “Internet Plus”(Internet plus represents a new economic form. It refers to the integration of the Internet and traditional industries relying on Internet information technology. The transformation and upgrading of the economy through optimizing production factors, updating business systems, and reconstructing business models) and “the New Four Inventions” (an online buzzword born in 2017, specifically refers to “high-speed railway, code scanning payment, bike-sharing, and online shopping”). In addition, China’s new economic format is mainly the tertiary industry’s new economic development. As the foundation of national economic security, the industrial economy needs to implement an in-depth innovation-driven strategy to improve the quality of the development of the first and second industries. In the current severe Sino-US economic and trade relations, the United States sanctions on Chinese enterprises are generally seen. Therefore, we still need to maintain high-tech cooperation with the United States or strengthen the originality of the technology.

6.1.2. Conclusions of Regression Analysis

China’s innovation-drive strategy has a positive impact on economic development; that is, the second hypothesis of this paper is true, but the IDI does not form a multiple effect. According to the regression analysis on EDQI and IDI, the innovation-driven index plays a positive role in the quality index of economic development. The innovation-driven strategy has a positive impact on the quality of economic development.
The impact of China’s innovation driving factors on the quality of economic development is incomplete, and the impact of some factors is limited; that is, the third hypothesis of this paper is not fully established. According to the multiple regression, China’s technological innovation does not play a sufficient role in the quality of economic development. China’s innovation comes mainly from the technology market. In other words, technology and its market transactions directly impact the quality of economic development. China’s technological innovation still needs to be realized by relying on the technology market.

6.2. Recommendations

China should increase its support and encouragement of independent innovation. In basic scientific research, especially in universities and research institutes, it is necessary to retain talent with rich treatment [38] and give them a free academic environment [39]. At the same time, it causes researchers professional pressure, such as classifying professors’ titles into life-long systems, changing the current situation that researchers do not regard research as a profession. In terms of technology application research, China should not only give the leading role to central enterprises in terms of economic strength and scientific and technological ability but also support and encourage private enterprises in R&D. In terms of technological innovation, China needs to “enhance the technological innovation ability of enterprises, give full play to the role of state-owned enterprises in technological innovation,” and “discover and cultivate innovative talents” [40].
Additionally, green technology is not exclusive to the environmental protection industry, so green innovation should be actively supported [28]. In terms of the primary industry, green farms and green tourism should be developed to ensure the harmonious development of humans and nature. Meanwhile, to strengthen the green innovation power [33], agricultural industrialization should be actively implemented to improve the growth quality of the primary industry through innovation. China should establish the system consciousness of harmonious development of humans and technology [12] to promote the harmonious development of man and nature, minimize the development of natural resources, increase environmental protection, and increase the protection of some scarce resources. Innovation should adapt to the changes of the times, for example, vigorously developing the digital economy [41]. By establishing the rigid index requirements for the harmonious development of humans and nature, China should give the most direct impetus and external pressure to innovate. At the same time, great investment and policy guarantees will be given to the research and development of new materials and new energy conducive to environmental protection.
China should improve the efficiency of the use of national scientific research funds. National scientific research projects should prevent the corruption of funds [42] and prevent the corruption of procedures and achievements from improving the efficiency of scientific research funds. We need to build a scientific research system [43].
Considering the external environment for development, China’s economic development will also be challenged by the existing international political and economic forms [44]. It is necessary to actively respond to the current adverse international political and economic environment and provide external environmental protection for China’s in-depth implementation of the innovation-driven strategy. Like the United States, China should emphasize that technology plays the most important role in a country’s economy [45]. The competition of international politics, military affairs, and economy, in the final analysis, is the competition of science and technology. China should maintain the good economic development achieved by the current innovation-driven strategy and deal with the unstable international political and economic development environment through the in-depth implementation of the innovation-driven strategy.

6.3. Limitations and Future Research

Due to the limited data obtained, the selection of relevant indicators in the analysis model is limited, especially the selection of innovation driving factor indicators, which leads to the adoption of the stepwise regression method in regression analysis. The clustering analysis of this study belongs to a posteriori nature, and other reasons cannot be excluded to explain the clustering characteristics of China’s macroeconomic data. As for the economic development quality index calculation, the statistical index method or econometric model method can also be used to calculate the economic development quality index, respectively, and then make the optimal selection. These areas need to be improved or continued in this study.

Author Contributions

Conceptualization, W.X.; Data curation, W.X. and L.S.; Formal analysis, V.B.; Funding acquisition, W.X. and H.K.; Investigation, W.X. and L.S.; Methodology, W.X.; Supervision, D.T.; Visualization, H.K., D.T. and V.B.; Writing—original draft, W.X.; Writing—review & editing, W.X., D.T., H.K., L.S. and V.B. All authors have read and agreed to the published version of the manuscript.

Funding

This research was funded by the National Social Science Fund Project of China: Research on the transformation of China’s economic growth power from the perspective of supply-side structural reform. Grant Number 16BJL056.

Institutional Review Board Statement

Not applicable.

Informed Consent Statement

Not applicable.

Data Availability Statement

The data presented in this study comes from the Bureau of Statistics of the People’s Republic of China, and sort it out (http://www.stats.gov.cn/easyquery.htm?cn=C01).

Acknowledgments

Thanks are extended to the Bureau of Statistics of the People’s Republic of China for providing the statistics used in this paper. Brandon J. Bethel, Wenya Chen and the anonymous reviewers are thanked for their insightful comments that greatly improved the quality of this manuscript.

Conflicts of Interest

The authors declare no conflict of interest.

Appendix A

Table A1. Mechanism of innovation-driven strategy-driven economic quality development.
Ways to Improve the Quality of Driving
Economic Development
Performance Indicators Driving the Improvement in Economic
Development Quality
The Mechanism of Driving the Quality of Economic
Development
Economic effectsGDPThe economic goal driven by innovation is the economic effect [46]. Through the progress of science and technology, we can realize the innovation of production technology and process, improve production and operation efficiency, and increase the value of each link of the value chain, which reflects the changes in economic aggregate and financial revenue.
Fiscal revenues
Added value of primary industry
Added value of second industry
Added value of tertiary industry
Economic levelThe proportion of primary industry in GDPTechnological progress promotes the continuous improvement in economic development and realizes the phased advancement of economic development, which is also proved by the experience of developed countries.
The proportion of second industry in GDP
The proportion of tertiary industry in GDP
Green economyThe conversion rate of energy
processing
An innovation-driven society aims for harmony between the economy and nature [47]. Through innovation, we can reduce energy consumption, reduce economic dependence on resources, and make rational use of them to realize the sustainability of economic development.
Investment in environmental
pollution control
Energy consumption
Total export–import volume
Coordinated EconomyTotal labor productivityThe national innovation system forms the driving force of innovation, guarantees the optimization of an economic development system, and realizes the coordinated development of humans and society, human and nature [48]. It is specifi reflected in the improvement in labor productivity and consumptivecally social expenditure.
Rate of high-quality products
Education funds
Per capita health expenditure
Income from social
insurance fund
Catering turnover
Total cost of domestic tourism
Innovation economyExport volume of high tech
products
Innovation directly produces economic effects and contributes to the knowledge economy and new economy [49].
Basic expenditure on research and experimental
Application expenditure of
research and experimental
Experimental expenditure of research and experimental
Full-time equivalent of R&D
personnel
Turnover of the technology market

References

  1. Ma, J.; Guo, M. Technology Innovation Driven Upgrade Strategy Evaluation Model: A Case of Marine Equipment Industry. J. Coast. Res. 2021, 94, 842–845. [Google Scholar] [CrossRef]
  2. Leavit, H.J. Technology and Organizations: Where’s the off button? Calif. Manag. Rev. 2002, 44, 126–140. [Google Scholar] [CrossRef]
  3. González-Pernía, J.L.; Jung, A.; Peña, I. Innovation-driven entrepreneurship in developing economies. Entrep. Reg. Dev. 2015, 27, 555–573. [Google Scholar] [CrossRef]
  4. Hutschenreiter, G.; Zhang, G. China’s quest for innovation-driven growth—The policy dimension. J. Ind. Compet. Trade 2007, 7, 245–254. [Google Scholar] [CrossRef]
  5. Gao, K.; Yuan, Y. The effect of innovation-driven development on pollution reduction: Empirical evidence from a quasi-natural experiment in China. Technol. Forecast. Soc. Chang. 2021, 172, 121047. [Google Scholar] [CrossRef]
  6. Yan, M.R.; Chien, K.M.; Hong, L.Y.; Yang, T.N. Evaluating the collaborative ecosystem for an innovation-driven economy: A systems analysis and case study of science parks. Sustainability 2018, 10, 887. [Google Scholar] [CrossRef] [Green Version]
  7. Zhang, H.; Li, L.J.; Chen, T.T.; Li, V. Where will China’s real estate market go under the economy’s new normal? Cities 2016, 55, 42–48. [Google Scholar] [CrossRef]
  8. Goh, A.L. Towards an innovation-driven economy through industrial policy-making: An evolutionary analysis of Singapore. Innov. J. Public Sect. Innov. J. 2005, 10, 34. [Google Scholar]
  9. Krstevski, D. SMEs open innovation management: Strategy map for innovation driven company. Econ. Dev. Ekon. Razvoj 2016, 18, 195–210. [Google Scholar]
  10. Pinho, J. Institutional theory and global entrepreneurship: Exploring differences between factor- versus innovation-driven countries. J. Int. Entrep. 2017, 15, 56–84. [Google Scholar] [CrossRef]
  11. Rostami, N.; Khyareh, M.M.; Mazhari, R. Competitiveness, entrepreneurship, and economic performance: Evidence from factor-, efficiency-, and innovation-driven countries. Ekon. Anal. Econ. Ann. 2019, 64, 33–64. [Google Scholar] [CrossRef]
  12. Apanasyuk, L.A.; Egorova, E.N.; Kryukova, E.M.; Mosalev, A.I.; Mukhomorova, I.V. Socio-ecological education as a factor of economic development. In Proceedings of the International Multidisciplinary Scientific Conference on Social Sciences and Arts SGEM, PARADISE BLUE Congress Center, Albena Resort and SPA, Albena, Bulgaria, 22–31 August 2017; pp. 971–977. [Google Scholar] [CrossRef]
  13. Kim, S.; Yoon, G. An Innovation-Driven Culture in Local Government: Do Senior Manager’s Transformational Leadership and the Climate for Creativity Matter? Public Pers. Manag. 2015, 44, 147–168. [Google Scholar] [CrossRef]
  14. Block, A.; Meyerratken, J.; Terlinde, C.; Voß, P.N.; Konhäuser, J.H. When data science meets patent information—Analyzing complex business environments of innovation-driven industries. J. Bus. Chem. 2021, 18, 20–42. [Google Scholar] [CrossRef]
  15. Kobzeva, L.; Gribov, E.; Snigireva, M.; Raevskaya, V. Cluster Initiative in Fine Chemicals as a Case of Practical Implementation of Triple Helix Collaboration for Regional Economic Growth and Innovation-Driven Development. Manag. Dyn. Knowl. Econ. 2017, 5, 33–56. [Google Scholar] [CrossRef] [Green Version]
  16. Marsiglio, S.; Tolotti, M. Endogenous growth and technological progress with innovation driven by social interactions. Econ. Theory 2018, 65, 293–328. [Google Scholar] [CrossRef] [Green Version]
  17. Dobrzanski, P.; Bobowski, S.; Chrysostome, E.; Velinov, E.; Strouhal, J. Toward Innovation-Driven Competitiveness across African Countries: An Analysis of Efficiency of R&D Expenditures. J. Compet. 2021, 13, 5–22. [Google Scholar] [CrossRef]
  18. Du, W.; Li, M. Government support and innovation for new energy firms in China. Appl. Econ. 2019, 51, 2754–2763. [Google Scholar] [CrossRef]
  19. Walsh, J.C.; Zeng, Y. Call for Innovation-Driven Development: A Grounded Theory Study of Thai Export-Oriented Garment Industry Facing Competitive Challenges in the Context of Industry 4.0 Era. Acta Univ. Danub. Oecon. 2018, 14, 65–85. [Google Scholar]
  20. Laužikas, M.; Dailydaitė, S. Impacts of social capital on transformation from efficiency to innovation-driven business. J. Bus. Econ. Manag. 2015, 16, 37–51. [Google Scholar] [CrossRef] [Green Version]
  21. Crowley, F.; McCann, P. Firm innovation and productivity in Europe: Evidence from innovation-driven and transition-driven economies. Appl. Econ. 2018, 50, 1203–1221. [Google Scholar] [CrossRef]
  22. Ji, Y. Government-led Economy: Factors Driven or Innovation Driven? Int. J. China Mark. 2014, 4, 97–112. [Google Scholar]
  23. Tian, G. Deceleration of China’s Economic Growth: Causes and Countermeasures. Front. Econ. China 2019, 14, 3–25. [Google Scholar] [CrossRef]
  24. Pencea, S.; Bâlgăr, A. China’s Transition to the Innovation-Driven Economy: Stepping Stones and Road-Blocks. Glob. Econ. Obs. 2016, 4, 135–150. [Google Scholar]
  25. Zhang, H.L.; Xu, S. The Innovation-Driven Impact on Economic Structure Transition. The Case of China. Int. J. Manag. Econ. 2017, 53, 9–26. [Google Scholar] [CrossRef] [Green Version]
  26. Liu, T.; Li, Y. Green development of China’s Pan-Pearl River Delta mega-urban agglomeration. Sci. Rep. 2021, 11, 15717. [Google Scholar] [CrossRef]
  27. Wu, F. Supply-Side Structural Reform, and Quality and Efficiency of China’s Economic Transition. China Econ. Transit. CET 2018, 1, 92–100. [Google Scholar]
  28. Butt, A.S.; Arshi, T.A.; Rao, V.; Tewari, V. Implications of Belt and Road Initiative for Supply Chain Management: A Holistic View. J. Open Innov. 2020, 68, 136. [Google Scholar] [CrossRef]
  29. Chen, X.; Liu, Z.; Ma, C. Chinese innovation-driving factors: Regional structure, innovation effect, and economic development—Empirical research based on panel data. Ann. Reg. Sci. 2017, 59, 43–68. [Google Scholar] [CrossRef]
  30. Wonglimpiyarat, J.; Khaemasunun, P. Strategies of remodelling China towards an innovation-driven economy. Int. J. Bus. Innov. Res. 2017, 12, 175–188. [Google Scholar] [CrossRef]
  31. Liang, L.; Wang, Z.B.; Luo, D.; Wei, Y.; Sun, J. Synergy effects and it’s influencing factors of China’s high technological innovation and regional economy. PLoS ONE 2020, 15, e0231335. [Google Scholar] [CrossRef]
  32. Freeman, C. Technology Policy and Economic Performance: Lessons from Japan; Pinter Publisher: London, UK, 1987. [Google Scholar]
  33. Francesco, C.; Adele, P.; Ilaria, T. Green Innovation Development: A Multiple Case Study Analysis. In Proceedings of the European Conference on Innovation and Entrepreneurship, Paris, France, 21–22 September 2017; pp. 116–124. [Google Scholar]
  34. Zhang, J.K.; Zhang, Y. Examining the economic effects of emissions trading scheme in China. J. Environ. Plan. Manag. 2021, 64, 1622–1641. [Google Scholar] [CrossRef]
  35. Cuerva, M.C.; Triguero-Cano, Á.; Córcoles, D. Drivers of green and non-green innovation: Empirical evidence in Low-Tech SMEs. J. Clean. Prod. 2014, 68, 104–113. [Google Scholar] [CrossRef]
  36. Wang, S.; Fan, J.; Zhao, D.; Wang, S. Regional innovation environ-ment and innovation efficiency: The Chinese case. Technol. Anal. Strateg. Manag. 2016, 28, 396–410. [Google Scholar] [CrossRef]
  37. Fan, F.; Lian, H.; Wang, S. Can regional collaborative innovation improve innovation efficiency? An empirical study of Chinese cities. Growth Chang. 2020, 51, 440–463. [Google Scholar] [CrossRef]
  38. Kimberly, B. New England’s Rich Widened the Pay Gap in the 1990s, Study Shows. Boston Globe (MA), 6 June 2003. [Google Scholar]
  39. Milner, A. “That’s Not What I Am”: Teacher Reflections on Purpose, Practice and Professionalism in the Swedish Free School System. FORUM Promot. 3-19 Compr. Educ. 2015, 57, 179–190. [Google Scholar] [CrossRef]
  40. Zhang, G.Q. Education Model of Industry-University-Research Cooperation in Training Application-oriented innovative Talents. Educ. Sci. Theory Pract. 2018, 18, 3573–3580. [Google Scholar] [CrossRef]
  41. Coles, L.L.; Pasquier, P. Digital eco-art: Transformative possibilities. Digit. Creat. 2015, 26, 3–15. [Google Scholar] [CrossRef]
  42. Hu, A.G.Z. Public funding and the ascent of Chinese science: Evidence from the National Natural Science Foundation of China. Res. Policy 2020, 49, 103983. [Google Scholar] [CrossRef]
  43. Ley, V.; Rey-Campos, J. Research Evaluation: Institutions versus individuals. Rass. Ital. Valutazione 2012, 16, 55–65. [Google Scholar] [CrossRef]
  44. Cousins, B.; Borras, S.M., Jr.; Sérgio, S.; Ye, J. BRICS, middle-income countries (MICs), and global agrarian transformations: Internal dynamics, regional trends, and international implications. Globalizations 2018, 15, 1–11. [Google Scholar] [CrossRef]
  45. Meares, C.A.; Sargent, J.F. Technology in the National Interest. Executive Office of the President; ERIC: Washington, DC, USA, 1996; p. 89. [Google Scholar]
  46. Philipp, L. A Short Story of GDP: On the Influence of GDP on the World Political and Economic Pattern; Suhrkamp Verlag: Berlin, Germany, 2013. [Google Scholar]
  47. Cao, W.; Zhang, Y.; Qian, P. The Effect of Innovation-Driven Strategy on Green Economic Development in China—An Empirical Study of Smart Cities. Int. J. Environ. Res. Public Health 2019, 16, 1520. [Google Scholar] [CrossRef] [Green Version]
  48. Zhu, J.R. Study on coordinated development of ecological environment and economy. Fresenius Environ. Bull. 2020, 29, 7934–7939. [Google Scholar]
  49. Eduardo, C.V.; Mireya, C.M.; Hector, P.L.P. Business Model of Learning Platforms in Sharing Economy. Electron. J. E-Learn. 2020, 18, 102–113. [Google Scholar]
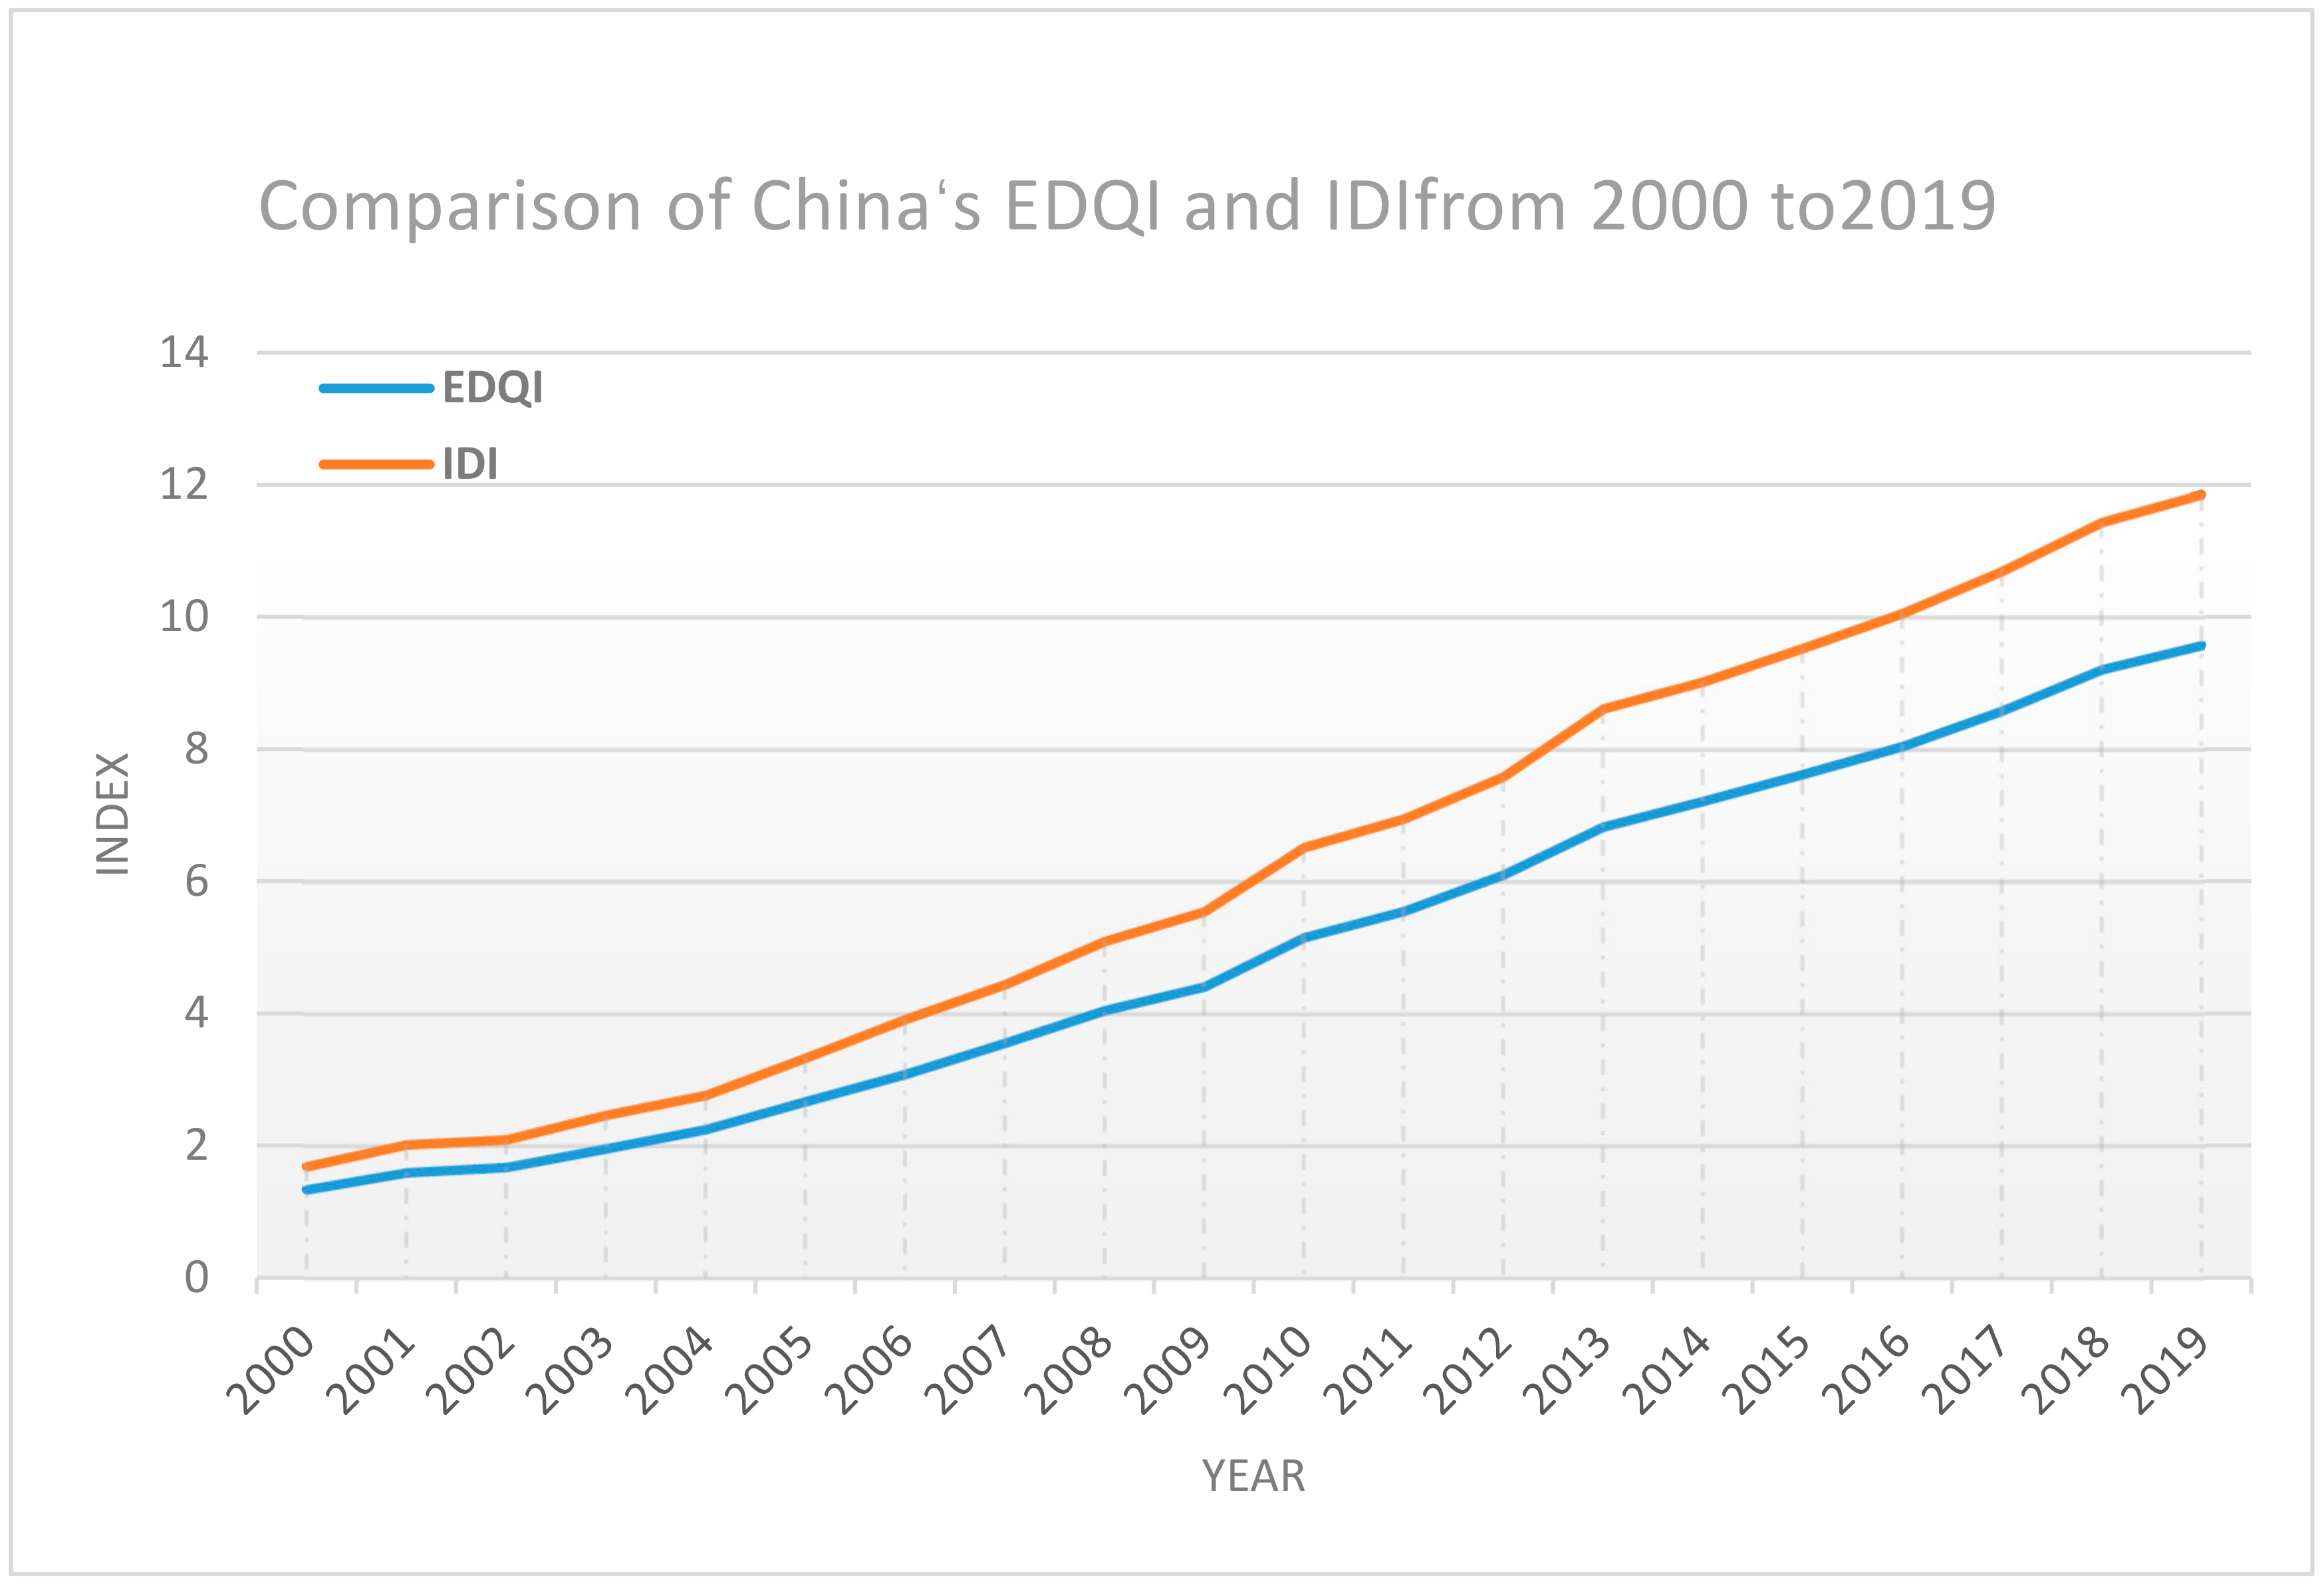
Figure 1. Relationship between the economic development quality and innovation-driven indices from 2000 to 2019.
Sustainability 14 04212 g001
Figure 2. China’s nominal GDP cluster analysis pedigree chart from 2000 to 2018.
Sustainability 14 04212 g002
Figure 3. China’s added value of primary industry cluster analysis pedigree chart from 2000 to 2018.
Sustainability 14 04212 g003
Figure 4. China’s added value of secondary industry cluster analysis pedigree chart from 2000 to 2018.
Sustainability 14 04212 g004
Figure 5. China’s added value of tertiary industry cluster analysis pedigree chart from 2000 to 2018.
Sustainability 14 04212 g005
Figure 6. The result of the residual normal distribution test.
Sustainability 14 04212 g006
Table 1. 2000–2019 China’s EDQI and IDI.
YearEDQIIDIYearEDQIIDI
20001.34051.690520105.15666.5214
20011.59622.023120115.55446.9523
20021.67812.096120126.10557.5893
20031.95842.467420136.83328.6203
20042.25472.773120147.21839.0244
20052.67353.335220157.62669.5337
20063.08653.917520168.048710.0613
20073.55964.444920178.588310.6997
20084.05375.102320189.211611.4408
20094.41255.549220199.577911.8583
Table 2. Summary of regression analysis of the EDQI and IDI.
VariableCoefficientStd. Errort-StatisticProb.
C−0.0306630.016974−1.8065070.0876
IDI0.8046730.002388336.97490.0000
R-squared0.999842
Adjusted R-squared0.999833
S.E. of regression0.035456
Sum squared resid0.022629
Log likelihood39.46384
F-statistic113552.10.0000
Mean dependent var5.026740
S.D. dependent var2.741261
Akaike info criterion −3.746384
Schwarz criterion −3.646810
Hannan–Quinn criter. −3.726946
Durbin–Watson stat1.467568
Table 3. Summary of model test of regression analysis of the EDQI and IDI.
White’s Heteroskedasticity Test:
F-statistic0.784707Prob. F(2,17)0.4721
Obs*R-squared1.690321Prob. Chi-Square(2)0.4295
Scaled explained SS1.298781Prob. Chi-Square(2)0.5224
Breusch–Godfrey Serial Correlation LM Test:
F-statistic0.361662Prob. F(2,16)0.7021
Obs*R-squared0.865049Prob. Chi-Square(2)0.6489
Table 4. Summary of Regression analysis of EDQI and ID.
VariableCoefficientStd. Errort-StatisticProb.
C−4.2092060.630389−6.6771530.0000
Ln(X1)−0.2091990.208410−1.0037860.3353
Ln(X2)−0.2555690.228058−1.1206330.2844
Ln(X3)−0.0374780.119098−0.3146870.7584
Ln(X4)0.5579640.1618173.4481140.0048
Ln(X5)0.0400950.0582570.6882390.5044
Ln(X6)0.1254580.0378853.3115130.0062
Ln(X7)0.2726590.0970242.8102170.0157
R-squared0.999255
Adjusted R-squared0.998821
S.E. of regression0.021944
Sum squared resid0.005778
Log likelihood53.11483
F-statistic2299.6610.0000
Mean dependent var1.441878
S.D. dependent var0.638968
Akaike info criterion−4.511483
Schwarz criterion−4.113190
Hannan–Quinn criter.−4.433732
Durbin–Watson stat2.236371
Table 5. Summary of model test of multiple linear regression analysis of RDQI and ID.
Heteroskedasticity Test: Breusch–Pagan–Godfrey
F-statistic1.460645Prob. F(7,12)0.2691
Obs*R-squared9.201115Prob. Chi-Square(7)0.2385
Scaled explained SS3.365306Prob. Chi-Square(7)0.8493
Breusch–Godfrey Serial Correlation LM Test:
F-statistic1.158984Prob. F(2,10)0.3526
Obs*R-squared3.763555Prob. Chi-Square(2)0.1523
Chow Breakpoint Test: 2012
F-statistic0.825531Prob. F(8,4)0.6226
Log likelihood ratio19.49921Prob. Chi-Square(8)0.0124
Wald Statistic6.604247Prob. Chi-Square(8)0.5799
Residual unit root Test:
t-StatisticProb.
Augmented Dickey–Fuller test statistic−4.3525370.0037
Table 6. Results of the stepwise regression model.
VariableCoefficientStd. Errort-StatisticProb.
C−3.7560960.065860−57.031460.0000
Ln(X4)0.3654110.0458847.9638750.0000
Ln(X6)0.1257970.0250455.0228660.0001
Ln(X7)0.1273420.0318334.0003000.0010
R-squared0.998989
Adjusted R-squared0.998799
S.E. of regression0.022141
Sum squared resid0.007844
Log likelihood50.05882
F-statistic5269.1780.0000
Mean dependent var1.441878
S.D. dependent var0.638968
Akaike info criterion−4.605882
Schwarz criterion−4.406736
Hannan–Quinn criter.−4.567007
Durbin–Watson stat2.163606
Publisher’s Note: MDPI stays neutral with regard to jurisdictional claims in published maps and institutional affiliations.

