Abstract
Oil is one of the most important sources of energy, about 25 percent of which comes from offshore sources. As a result, the transportation of oil tankers, and the construction of offshore oil platforms and subsea pipelines have increased, to facilitate offshore oil exploitation. However, most oil spill risk assessments analyze the impact of one risk source, and rarely consider multiple risk sources in the study area. This paper focuses on three risk sources that may cause oil spills in a certain area, and establishes an oil spill risk assessment model through a fuzzy inference system. Oil spill probabilities for different risk sources are calculated through the model. According to the definition of oil spill risk, the risk probability of multiple risk sources in the study area is obtained, which can provide technical support for regional oil spill emergency capacity and emergency resource allocation.
1. Introduction
According to incomplete statistics, there are now more than 100 countries and regions in the world conducting offshore oil and gas exploration. More than 150 offshore oil and gas fields are exploited in more than 40 countries and regions. Offshore crude oil production is increasing day by day, and the daily output has exceeded 1 million tons, accounting for about 25% of the world’s total.
The density of various ships, such as tankers, continues to increase with the rapid growth in marine oil transportation. Oil spills at sea occur from time to time, with serious economic losses and environmental threats. Therefore, these present a serious challenge to emergency preparedness. In 2003, the Tasman Spirit ran aground in Karachi, Pakistan, spilling about 27,000 tons of light crude oil. In 2002, due to the weather, the Prestige was involved in a collision. Due to the weather, it was flying the Bahamian flag of convenience, which caused a spill of 17,000 tons of fuel oil. In 2007, the Hebei Spirit collided outside Daesan port in South Korea, sending about 10,500 tons of crude oil into the sea. From 1973 to 2018, a total of 3336 ship oil spills occurred in China, with an average of 76 per year [1].
In recent years, there have been more and more oil spill accidents not only from ships, but also from oil well platforms and submarine oil pipelines. For example, on 20 April 2010, an explosion occurred on the “Deepwater Horizon” drilling platform in the Gulf of Mexico. The oil well platform has been leaking oil since 24 April 2010, and the daily oil leakage reached 5000 barrels. However, various remedial measures did not take effect, to a noticeable extent. On July 16 of the same year, the explosion of an oil pipeline near the Dalian Xingang Oil Terminal caused a 1500-ton crude oil spill. The Penglai 19-3 oilfield accident in 2011 also caused a large number of oil spills. The extensive impact and serious consequences of these oil spills sounded the alarm for the world.
From the above mentioned classic oil spill accidents, it can be seen that the main risk sources of oil spills at sea are ships, oil well platforms and submarine pipelines. Therefore, on the basis of considering multiple risk sources, the risk assessment of offshore oil spill accidents has important practical significance. From the perspective of regional multi-risk sources, the establishment of corresponding risk indicators is different from that when considering a single risk source. From the perspective of regional multi-risk sources, it is almost impossible to conduct a fully quantitative risk assessment, so we can only adopt a combination of qualitative and quantitative methods for risk assessment. However, the existing combination of qualitative and quantitative methods is not suitable for the offshore oil spill risk assessment in this paper. Therefore, this paper proposes an oil spill risk assessment model combined with a fuzzy inference system.
2. Literature Review
Offshore oil spills have a great impact on the marine environment. For more than ten years, offshore oil spills have attracted much attention, because oil pollution will lead to various ecological and socioeconomic impacts [2]. Petroleum hydrocarbons in oil will seriously affect the growth of phytoplankton in the ocean and the long term effect of petroleum hydrocarbons will destroy the marine food chain and affect biodiversity, especially of the nearshore ecosystem [3]. Marine environmental pollution caused by offshore oil spills, and fishery, aquaculture, tourism and other industries, will suffer huge economic losses due to offshore oil spills [4]. Ana et al. [5] developed a rapid, sensitive and reliable method to determine eight polycyclic aromatic hydrocarbons in marine products, and optimized, verified and applied this method. Finally, a risk assessment was performed to evaluate the daily dietary intake of seafood and the carcinogenic potential of the measured levels, based on the Brazilian seafood consumption profile, PAHs levels, and toxicity equivalent factors.
The main sources of offshore oil spills are ship accidents, offshore oil well platform accidents and subsea pipeline accidents. Payam et al. [6] combined the oil spill probability of a sunken ship with the potential oil spill consequences, and proposed a complete quantitative model for sunken ship risk assessment. Wu [7] believes that the probability of accidents during ship navigation follows the binomial probability distribution. On this basis, the probability of a ship oil spill accident is derived, and the offshore oil spill trajectory model is established by using the Oilmap model. Finally, the risk evaluation model is established by a fuzzy comprehensive evaluation. Chen et al. [8] set up an entropy weighted grey relation analysis method to analyze key contributors to oil spills, and evaluate the extent of the impacts of each factor in different ship operations. Based on the actual operation of cruise ships, seven main influencing factors are selected for analysis, the analysis framework of global cruise ship oil spill factors is established, and the specific analysis steps and methods are provided. Zhang et al. [9] establishes an underwater oil spill model under the combined action of waves, currents and wind by Fluent, and compares and analyzes the trajectory of deep water oil spills under different velocities and wind speeds. Wu et al. [10] proposes a quantitative decision-making model for early emergency responses to oil spill from ships. Through the previous work, the influencing factors that can be quantified are identified, and then a hierarchical decision-making framework is established. Finally, it is analyzed by an evidential reasoning algorithm.
Raf et al. [11] adopt a combination of binary logistics regression and expert judgment for the identification of various influencing factors, and the Bayesian networks environment for the inference and analysis of these factors, and then construct a risk assessment model for dangerous cargo ships when berthing in the port. In the end, they compare the quantitatively calculated risk against the certain developed risk categories by the government. Kamal et al. [12] present a novel model for causal mechanisms of oil pollution, and the research examines the probabilistic relationships among the causal factors that are revealed qualitatively and quantitatively utilizing a fuzzy Bayes network approach. Findings of the research indicate that the existence of overflow, and the existence of operational causes and crew causes appear as the major contributory factors to account for the occurrence of pollution. Polinov et al. [13] performed a geostatistical analysis of three data bases of oil spills in the Mediterranean Sea (REMPEC 1977–2000, ITOPF 1970–2018, and EMSA 2015–2017). It was found that, at the exclusive economic zone level, EMSA oil spill densities were positively correlated with shipping and port activity. With the increase in Arctic shipping, the risk of oil spill is also increasing. Victor et al. [14] evaluated the response of two ice oil drift models implemented in the open source Lagrange framework. By considering two numerical simulation experiments, their main findings show that the drift model provides quite similar outputs with the same input. It is also found that using a higher resolution ice sea model does not mean better results. Chen et al. [15] construct an oil spill risk index system based on oil spill probability, impact factors, meteorological and hydrological conditions and the sensitivity coefficient of sensitive targets. Then, the oil spill risk index is calculated. Finally, according to the idea of hierarchical classification and zoning management and control, the Yangtze River Estuary is divided into areas with different oil spill risk levels. Tian et al. [16] use the system engineering analysis method, propose the idea of river section division, and establishe an inland river regional oil spill risk assessment method including oil transportation volume analysis, risk assessment, environmental sensitivity analysis and other steps. Taking a section of the Yangtze River trunk line as an example, the evaluation conclusion is given. Huang [17] carries out the investigation of pollution factors through an expert analysis method, uses the risk matrix LS method to evaluate the risk level, establishes a plane two dimensional hydrodynamic water quality model to predict and study the high risk oil spill emergencies, and reveals the influence law of sudden oil spill pollution events in different locations and degrees on the water intake of the diversion project. Rajendran et al. [18] analyze satellite images to further detect, evaluate and monitor the oil spill of Wakashio, stranded on the coast of Mauritius on 6 August 2020. Kong and Zhang [19,20] both study and analyze the influencing factors leading to ship oil spills from the perspective of man–ship–environment management, construct a Bayesian network, simulate and reason through the Bayesian network, obtain the sensitive factors of ship oil spill accidents, and give corresponding countermeasures and suggestions for different sensitivities. Pan et al. [21] also analyze human factors, ship factors, environmental factors and management factors, establish an oil spill risk evaluation index system for large oil tankers navigable in the Cape of Good Hope waters, and then analyze it through improved fuzzy comprehensive evaluation. Liu et al. [22] use satellite images to determine potential leakage points, and combine the data and literature of historical oil spill accidents to determine the probability of oil leakages, while the risk is defined as the product of leakage probability and its impact, and it is assume that the accident probability of ships follows a binomial distribution. Finally, it is calculated that ship accidents are the main risk in the Bohai Sea, and seven high risk areas are determined.
Liu et al. [23] establish an oil spill risk evaluation index system of offshore oil well platforms through an analytic hierarchy process, establish the oil spill risk grade evaluation method of offshore oil platforms by using a fuzzy comprehensive evaluation method, and evaluate the oil spill risk of the Bohai oil platform. Xu et al. [24] is different: although they also establish an oil spill risk evaluation index system of offshore oil well platforms by using an analytic hierarchy process, Xu et al. combine the Monte Carlo method with fuzzy comprehensive evaluation for comprehensive evaluation. Zhang et al. [25] construct an oil spill pollution evaluation index system for offshore oil platforms, introduce matter element extension theory and improved AHP, and establish an oil spill pollution level evaluation model based on improved AHP and extension theory. Liu et al. [26] use the fuzzy bow tie model to quantitatively evaluate the risk of oil spills from deep water drilling platform wells. In the evaluation process, the causes of blowout in deep water drilling are analyzed based on the fault tree method, and the consequences caused by oil spills are analyzed by the event tree method. The combination of fuzzy set theory and expert evaluation is used to calculate the well oil spill probability and oil spill consequence risk value.
Yin et al. [27] use an analytic hierarchy process and expert evaluation method to give different weights to the indicators of submarine pipeline oil spill possibilities established in this paper. Finally, the fuzzy comprehensive evaluation method is used to analyze the case. Subagyo et al. [28] conduct a risk assessment on a submarine pipeline through bowtie and take the Pt XYZ Gresik natural gas exploration industry in East Java, Indonesia as an example. Jiang et al. [29] conduct experimental research on crude oil leakage and the diffusion of submarine oil pipelines. The influence of the water flow and the spilled discharge on the behavior of the spilled oil are analyzed from both qualitative and quantitative perspectives. A sensitivity study of the characteristic physical quantities to various factors are presented afterward.
Through the analysis of the previous articles, it can be seen that the current risk assessment of offshore oil spill is mainly to establish a corresponding risk index system, then to calculate the possibility of offshore oil spill accidents through an analytic hierarchy process, Bayesian network and other methods, and, finally, to obtain the risk level of offshore oil spills through fuzzy comprehensive evaluation.
At present, the research on offshore oil spill risk assessment is to separate ship oil spill accidents, oil well platform oil spill accidents and submarine pipeline oil spill accidents, and there is no article that analyzes the three risk sources together. One type of oil spill accident is studied separately, and the probability of offshore oil spills cannot represent regional oil spill probability. The risk assessment of offshore oil spills mainly includes fault tree, analytic hierarchy process, Bayesian network and fuzzy comprehensive evaluations. At present, the mainstream research direction is to analyze different index systems based on these methods, so as to determine which index has a greater impact on oil spills, and then formulate corresponding countermeasures for prevention.
According to the above description, it can be seen that the mainstream research methods for offshore oil spill risk assessment are the Bayesian network, analytic hierarchy process and fuzzy comprehensive evaluation methods. However, these methods have their own advantages and disadvantages, which are applicable to offshore oil spill risk assessment under different circumstances. The advantages and disadvantages of the various methods are shown in Table 1.

Table 1.
Advantages and disadvantages of existing risk assessment research methods.
However, this paper believes that various indicators will inevitably affect each other, but this mutual influence cannot be expressed simply by using mathematical formulas or models. Moreover, due to the uncertainty, fuzziness and contingency of offshore oil spill accidents, it is very difficult to accurately obtain the historical data and relevant information of offshore oil spill accidents. Due to the unavailability of some data, it is very likely that the final result is inconsistent with the reality. The concept of fuzzy logic proposed by Zadeh [30] is a powerful tool to deal with this situation. Fuzzy logic control is abbreviated as fuzzy control. It is a computer digital control technology based on fuzzy set theory, fuzzy language variables and fuzzy logic reasoning. In 1974, E.H. Mamdani of Britain first used fuzzy control statements to form fuzzy controller, and applied it to the control of a boiler and steam engine, which was successful in the laboratory. This pioneering work marked the birth of fuzzy control theory. Among its subsequent use, E.H. Mamdani et al. [31] use the concepts of fuzzy set and fuzzy logic to translate a set of completely unstructured language heuristics into an algorithm, which is also the most widely used algorithm. Ali et al. [32] combine fuzzy inference control theory with a relative risk score, to quantitatively analyze pipeline risk. It is not only the content of fuzzy logic that is used in pipeline risk assessment, but also that the fuzzy logic in risk modeling has been applied in many different fields, which will not be listed one by one here.
As mentioned above, the risk source of offshore oil spill risk is not just one, so when calculating the risk level of different risk sources, we need to solve the problem of how to normalize. In the fuzzy inference system, the evaluation of different risk sources can be easily integrated by modifying the fuzzy rules. Therefore, fuzzy rules are an important part of the method to explain different risk sources. In addition, in order to more accurately describe the severity of oil spill risk in a study area, the oil spill is divided into four different levels, and, then, the probability of an oil spill of four different levels is calculated, respectively, which is different from other scientific research. Through the discussion and analysis of an expert group, the fuzzy rules consistent with the four oil spill levels are formulated, and, then, the occurrence probabilities corresponding to different oil spills are calculated.
The purpose of this paper is to establish a new fuzzy inference system, which can evaluate regional oil spills under the joint influence of ship oil spills, oil well platforms and submarine pipelines, from the perspective of the whole region. The fuzzy rules in the system can explain the interaction between risk indicators, and, finally, calculate the oil spill probability and oil spill risk value corresponding to different oil spills in the whole region.
3. Methodology
3.1. Fuzzy Inference System Theory
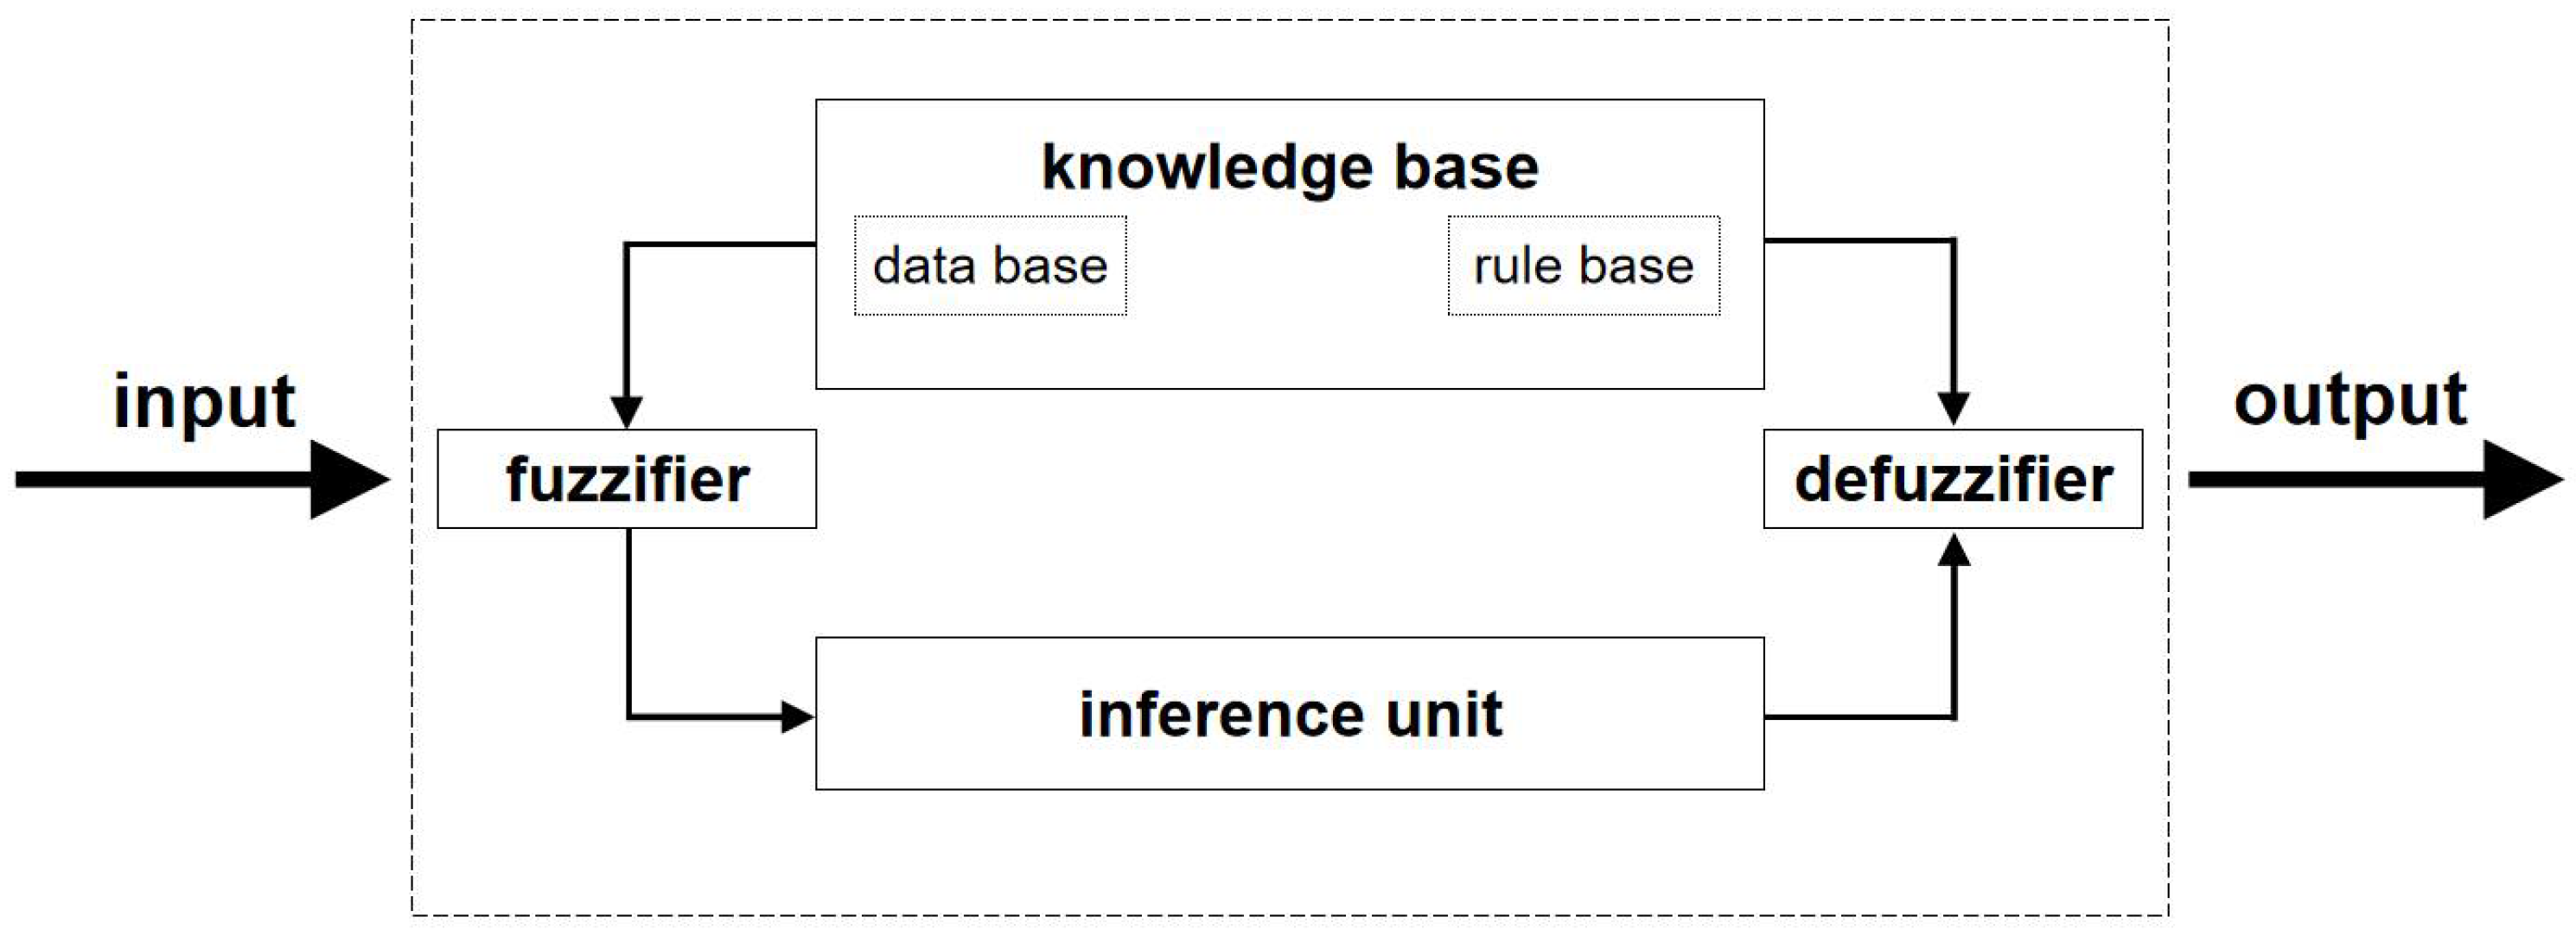
Fuzzy control realizes human’s control experience through computer, which is nonlinear control in essence and belongs to intelligent control. The main features are systematic theory and a large number of practical application backgrounds. As shown in Figure 1, it consists of four parts: fuzzification, knowledge base, fuzzy inference system and defuzzification [32].
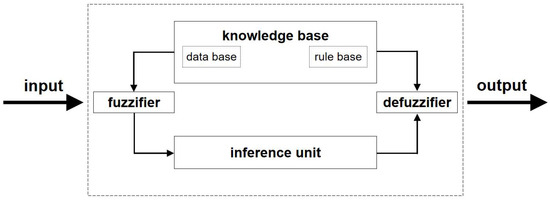
Figure 1.
Flow chart of fuzzy inference system.
3.1.1. Fuzzification
Fuzzification is a necessary step to realize fuzzy control, which converts the definite value input by the fuzzy controller into the corresponding fuzzy language variable. Since a fuzzy linguistic variable is a fuzzy set, this method should show how to transform from exact values to fuzzy sets. Common methods include graded fuzzy set method, input point membership taking 1 method, single point fuzzy set method and membership value method.
3.1.2. Knowledge Base
Knowledge base consists of database and rule base. The membership functions of the fuzzy sets applied in generating the fuzzy rules are defined by database and fuzzy if–then rules build rule base.
Database: the fuzzy subset membership vector values of all input and output variables, in other words, the set of corresponding values after discretization of the universe level, are stored in the database.
Rule base: These rules are usually connected by a series of relational words—such as if–then, else, also, and, and or—which must be “translated” to quantify fuzzy rules. The most commonly used relative words are if–then and also, which are suitable for multivariable fuzzy control systems.
3.1.3. Fuzzy Inference System
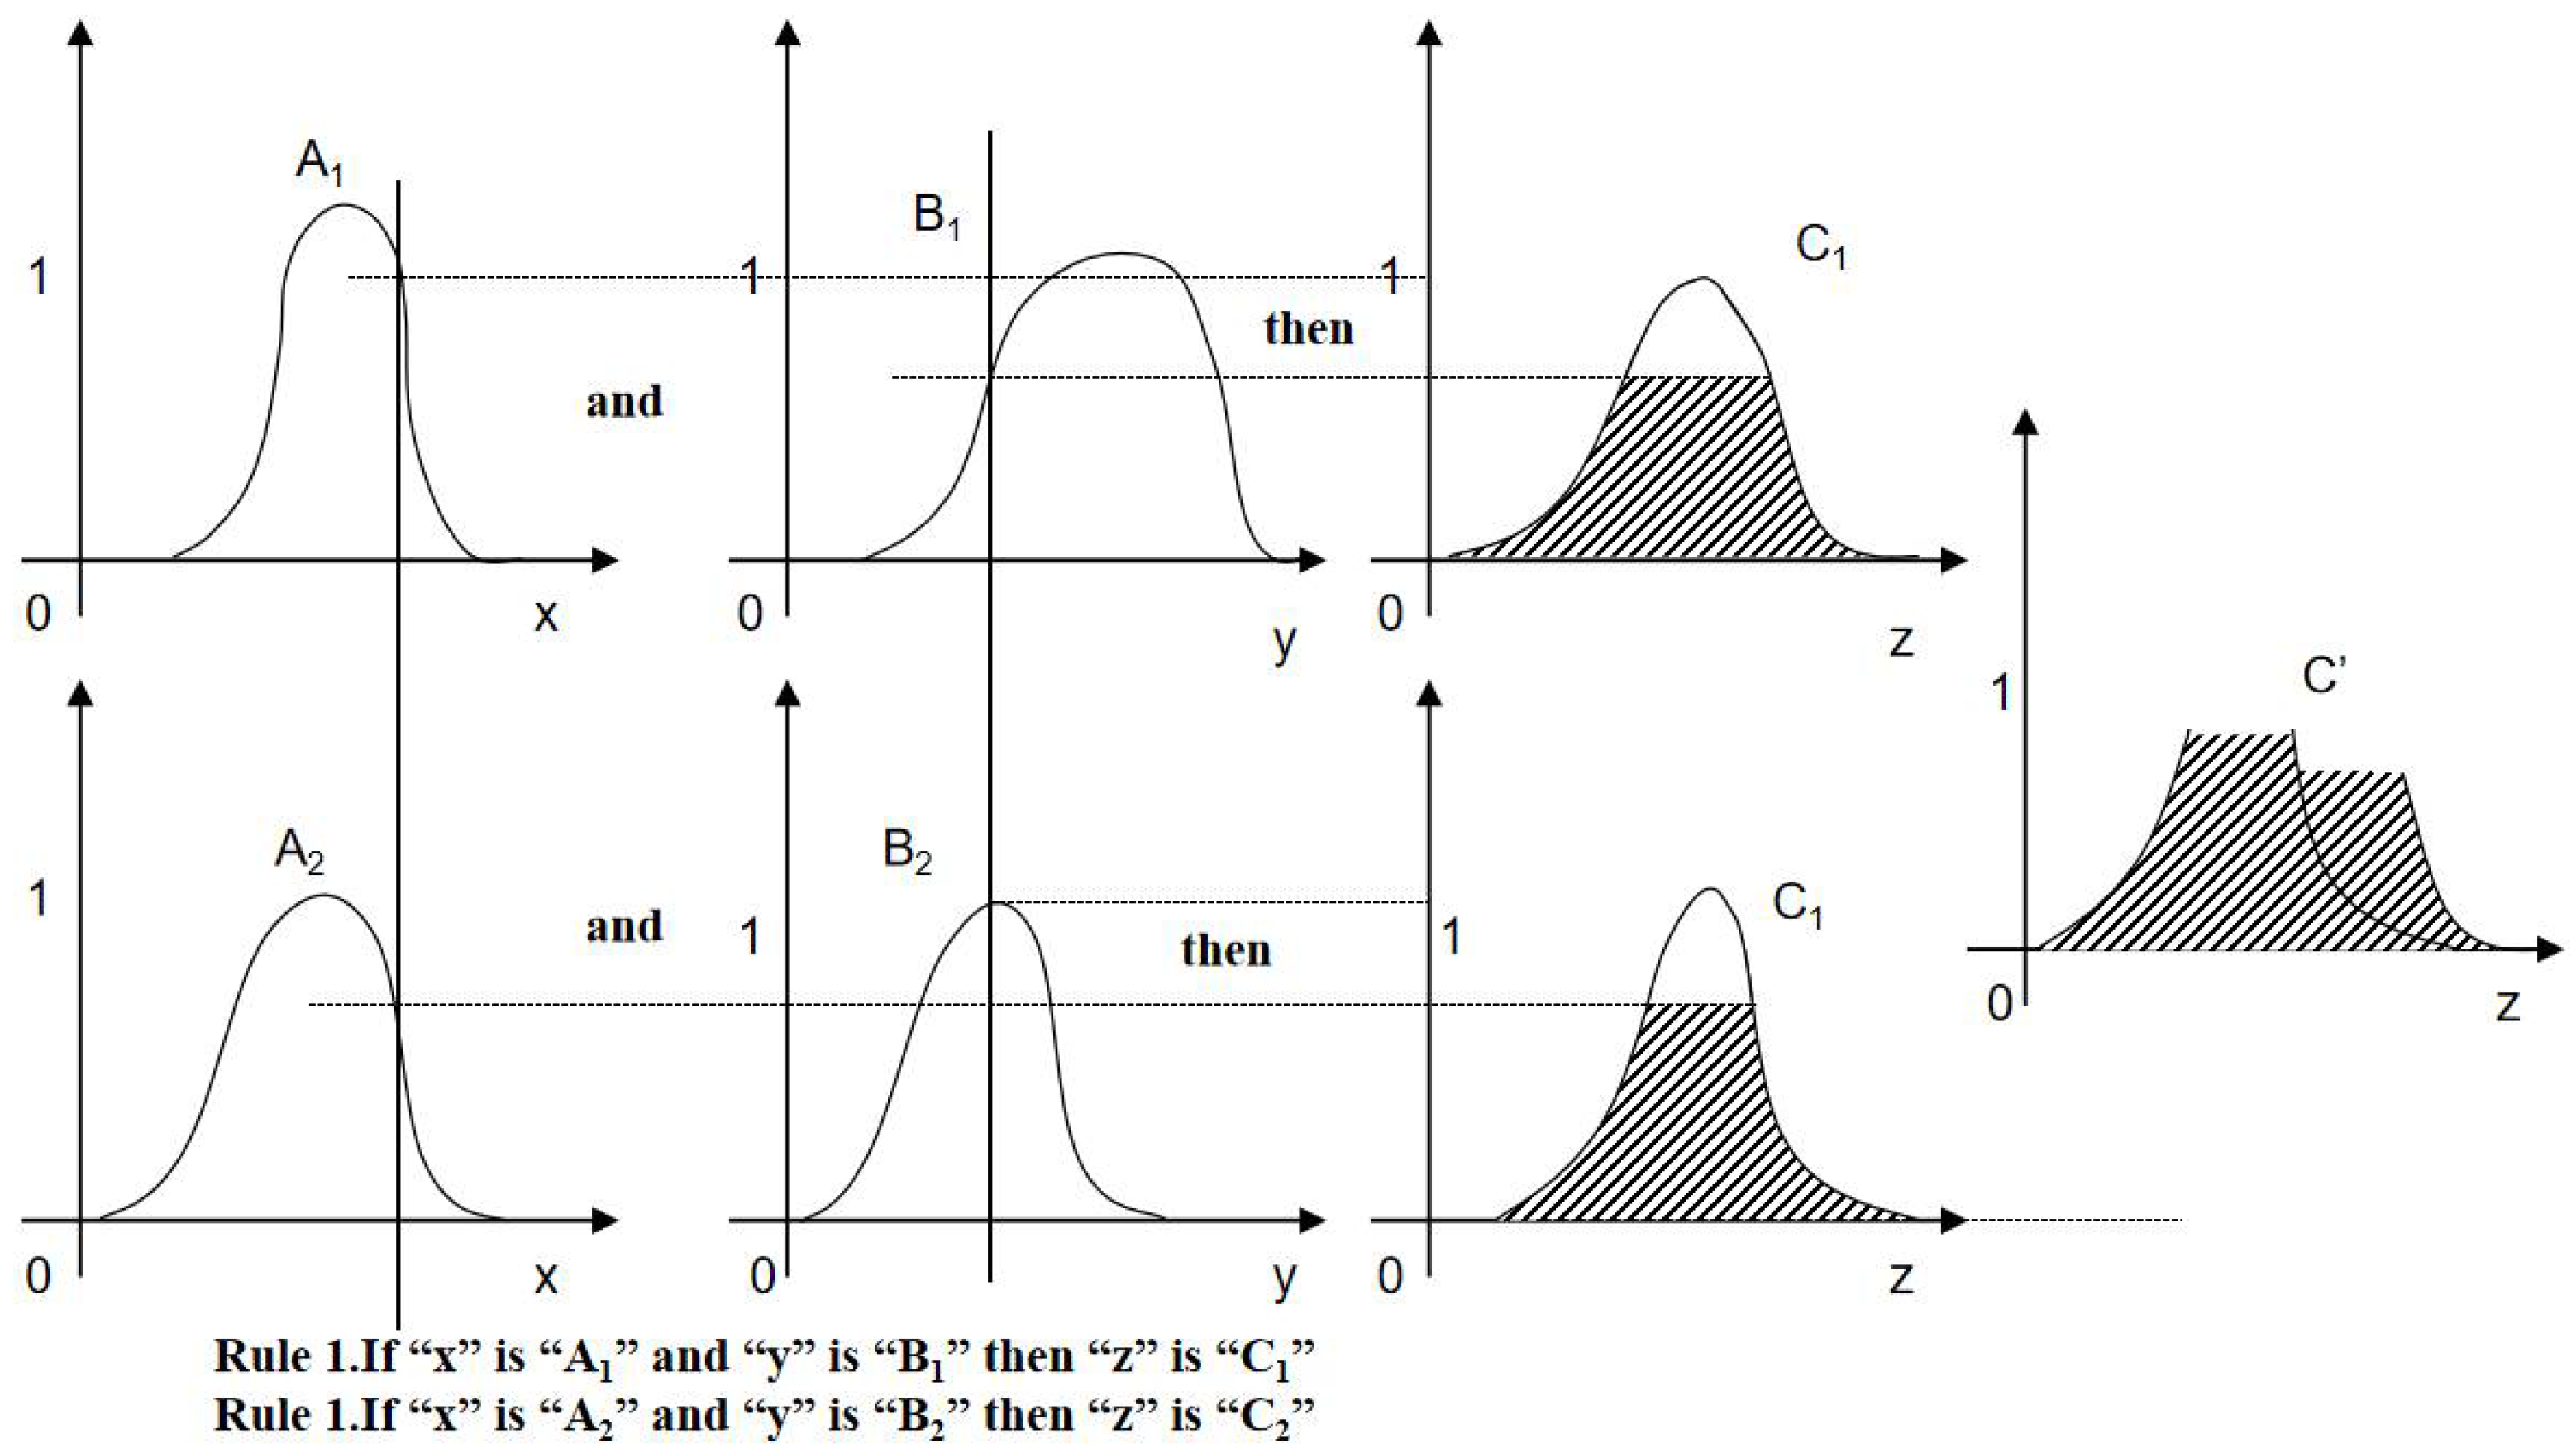
In this step, these fuzzy if–then rules are applied to the fuzzy inference unit, and the mapping from fuzzy input to fuzzy output is assigned according to fuzzy synthesis rules. This is the main part of the fuzzy expert system, which aggregates the facts obtained during the fuzzification process with the rule base generated in the previous part and performs the modeling [6]. There are several types of FIS that have been applied to different aspects of scientific and engineering applications. For example, Mamdani fuzzy model is one of the most popular algorithms, and its general “If-then” rule form is shown in Figure 2 [33].
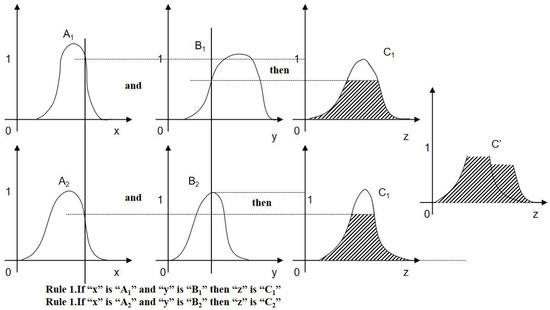
Figure 2.
Mamdani fuzzy inference system scheme.
3.1.4. Defuzzification
The fuzzy output obtained from the fuzzy control system is no longer expressed in fuzzy language. Its mapping to the real world is main function of defuzzification. In this paper, the common centroid of area (COA) method is used to complete the defuzzification.
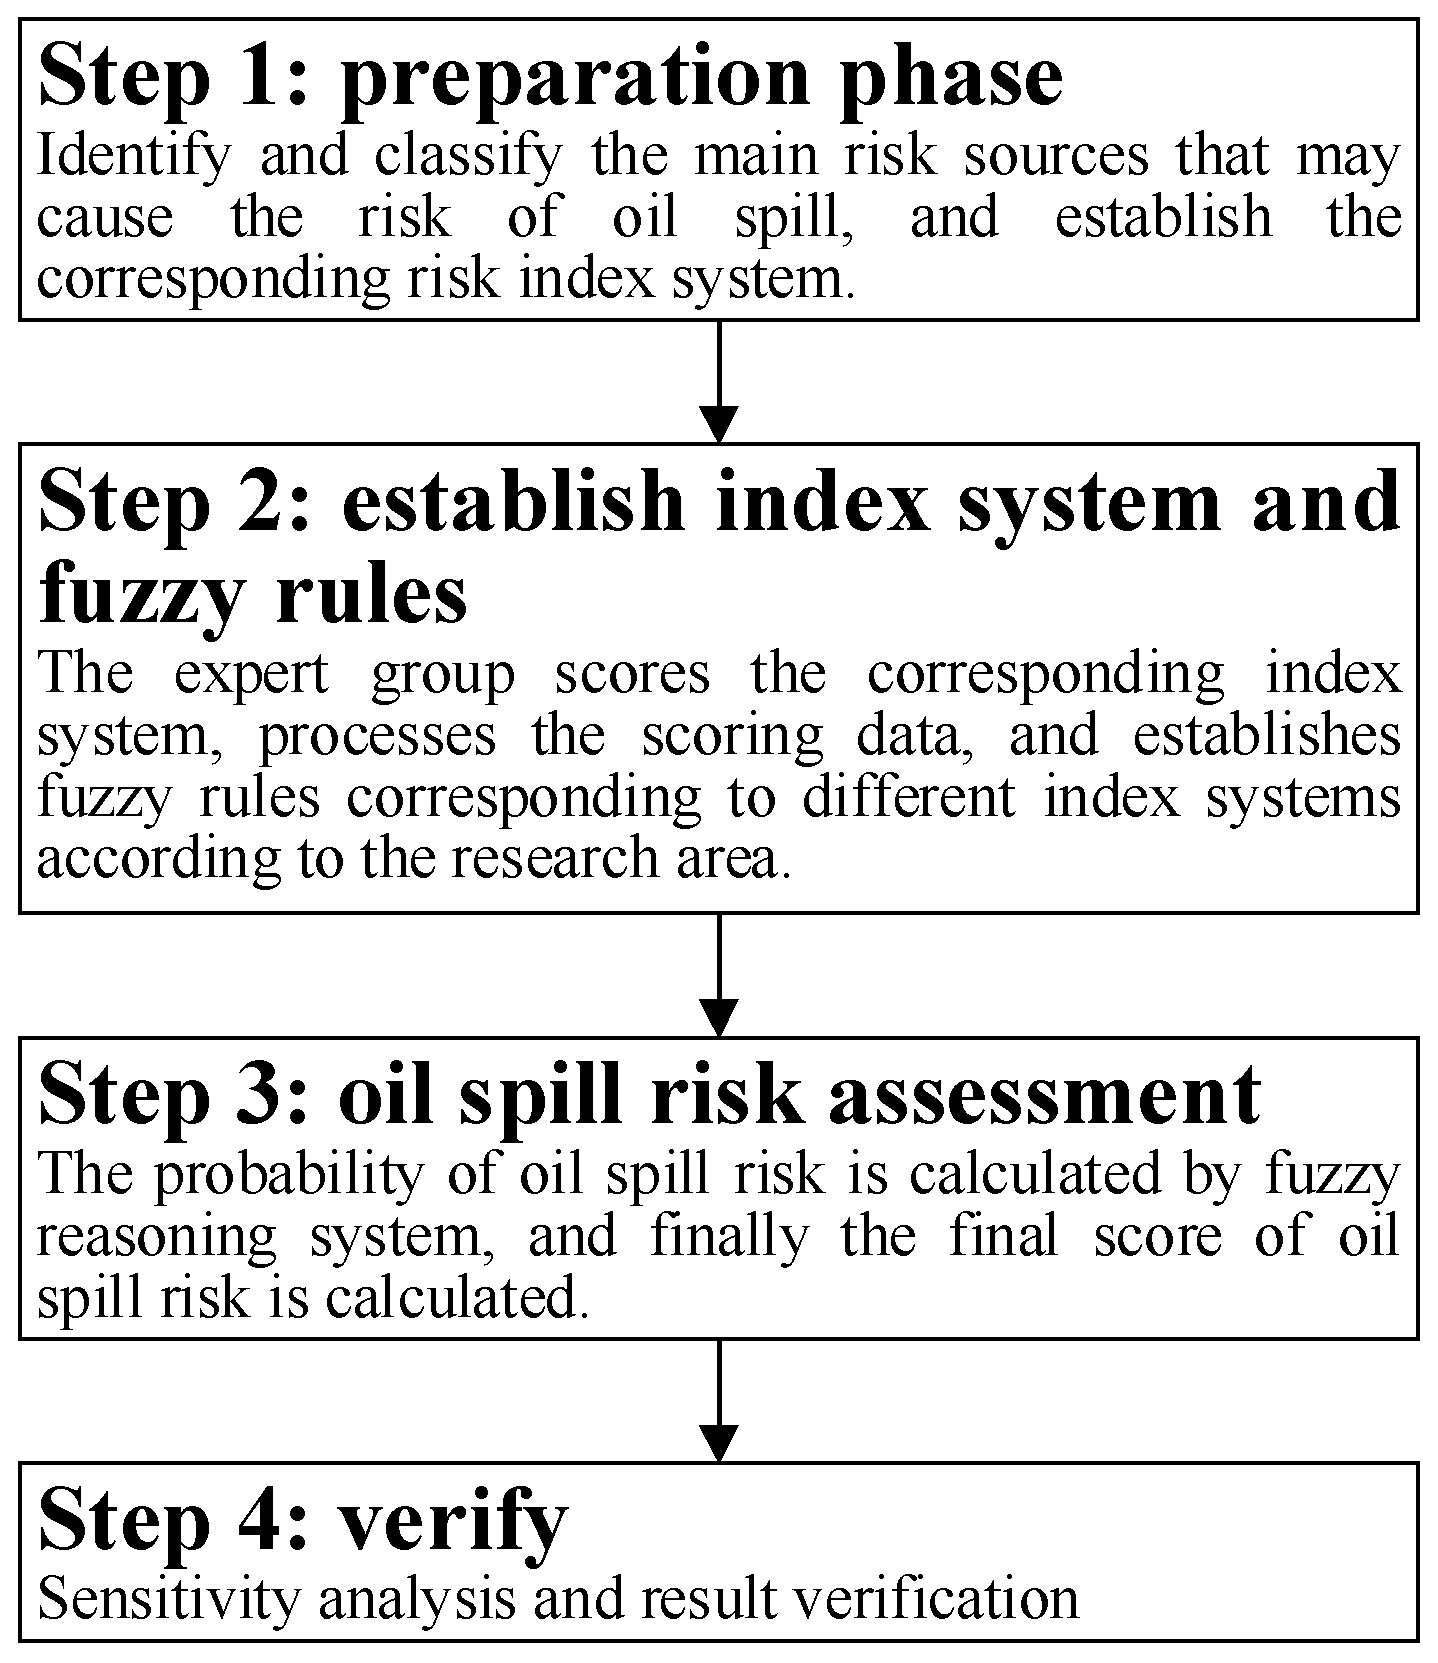
3.2. Oil Spill Risk Assessment Model
Firstly, this paper conducts oil spill risk assessment in the study area from the perspective of the whole region. Then, the risk sources of oil spills in the region are mainly divided into three types, namely, ship oil spills, oil well platform oil spills and submarine pipeline oil spills. On this basis, a risk index system corresponding to the three accident types is established, and each index in the system is scored. After this, the score is used as an input value to calculate the oil spill probability of three oil spills with different oil spill levels through the fuzzy inference system. Finally, the oil spill probability is multiplied by the corresponding oil spill level to obtain a risk score for that type of oil spill. The final regional risk score is calculated by assigning weights based on the characteristics of the three oil spills in the area. The framework of the risk assessment model is shown in Figure 3.

Figure 3.
Frame diagram.
3.2.1. Classification of Oil Spill Accident Types and Establishment of Index System
It can be seen from the foregoing that the main risk sources of oil spills are ship accidents, oil well platform accidents and submarine pipeline accidents. Based on this, a risk index system is established. After that, each risk index is scored by the expert group for subsequent calculation in the fuzzy inference system.
- (1)
- Establishment of index system and score evaluation of ship oil spill.
The index system of ship accident risk is mostly established from the factors of human–ship–environment management in previous studies. However, this article focuses on regional oil spills, where these factors are uncertain and change over time. For example, different ships have different oil spill risks after arriving in the same area. Therefore, it is not rigorous to analyze regional oil spill risks by these factors. The risk indicators of oil spills caused by ship accidents considered in this paper are mainly from the perspective of environment. Based on Zhang and Kong [19,20], this paper establishes the risk index of ship oil spill accidents (see Figure 4).
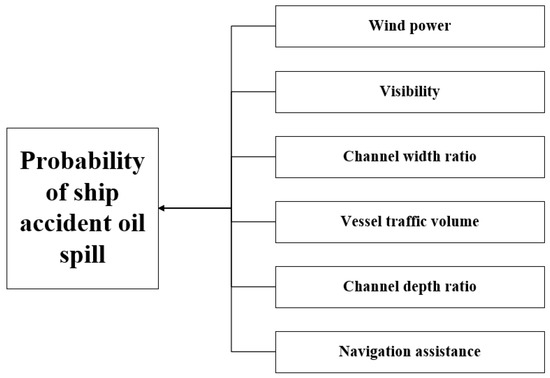
Figure 4.
Risk index of ship oil spill.
The indicators in the risk indicator system established by the appeal are scored by the expert group. The scoring rules are as follows: the lowest score is 0 points and the highest score is 10 points. The higher the score, the more likely the index being scored is to cause a ship oil spill.
- (2)
- Establishment of index system and score evaluation of offshore oil well platform oil spill.
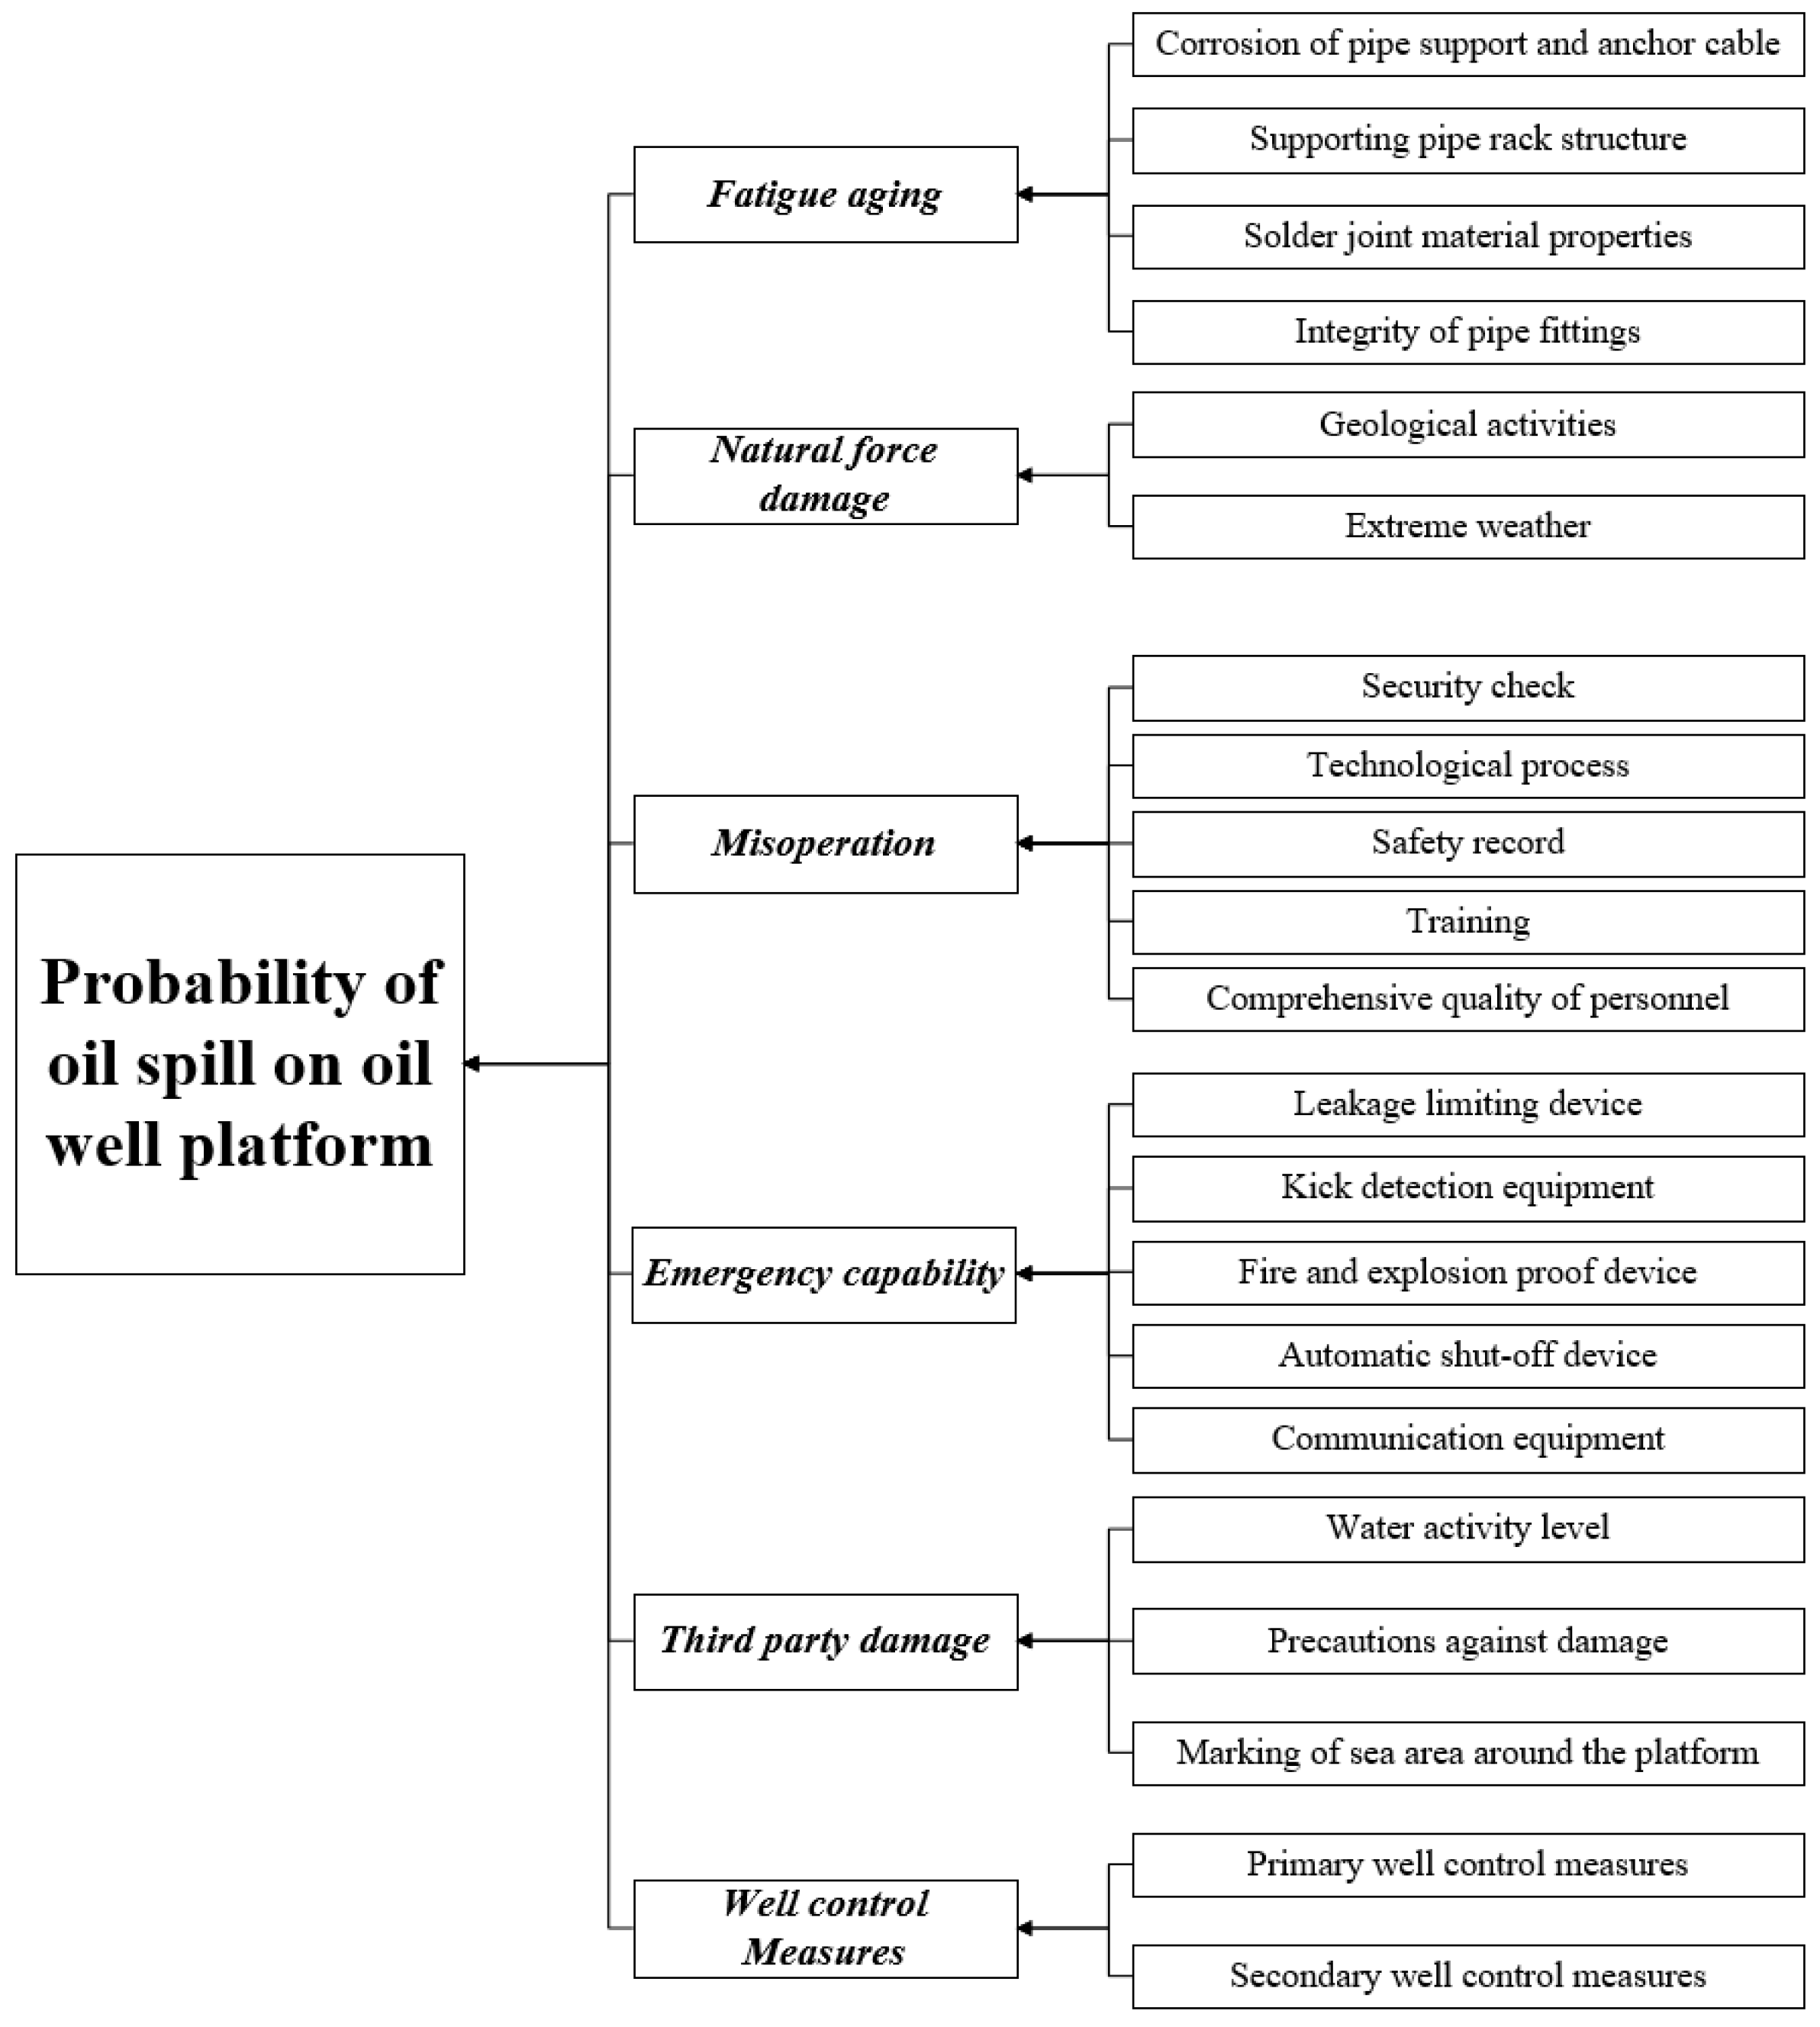
The location of the oil well platform, related equipment and staff are basically fixed, so all possible influencing factors need to be considered when establishing oil spill risk indexes of oil well platforms. Based on Liu and Xu [23,24], the oil spill risk index of oil well platforms is established(see Figure 5).
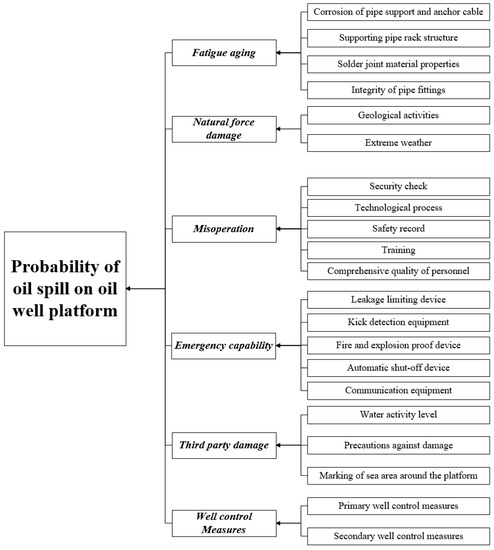
Figure 5.
Oil spill risk index of offshore oil well platform.
As can be seen from the above figure, there are many risk indicators for oil well platforms, which leads to more than 200 million fuzzy rules when the scores of various indicators are directly applied to the fuzzy inference system. In order to solve the problem of excessive quantity, after the expert group scores each risk index, it classifies and summarizes each risk index, and adds the scores of the same kind of index to obtain the final score of the same kind of risk index. Classification can effectively reduce the number of inputs in the fuzzy inference system, so that the number of fuzzy rules will not exceed the range of common sense. The rules for scoring each indicator here are similar to those for ship oil spills.
- (3)
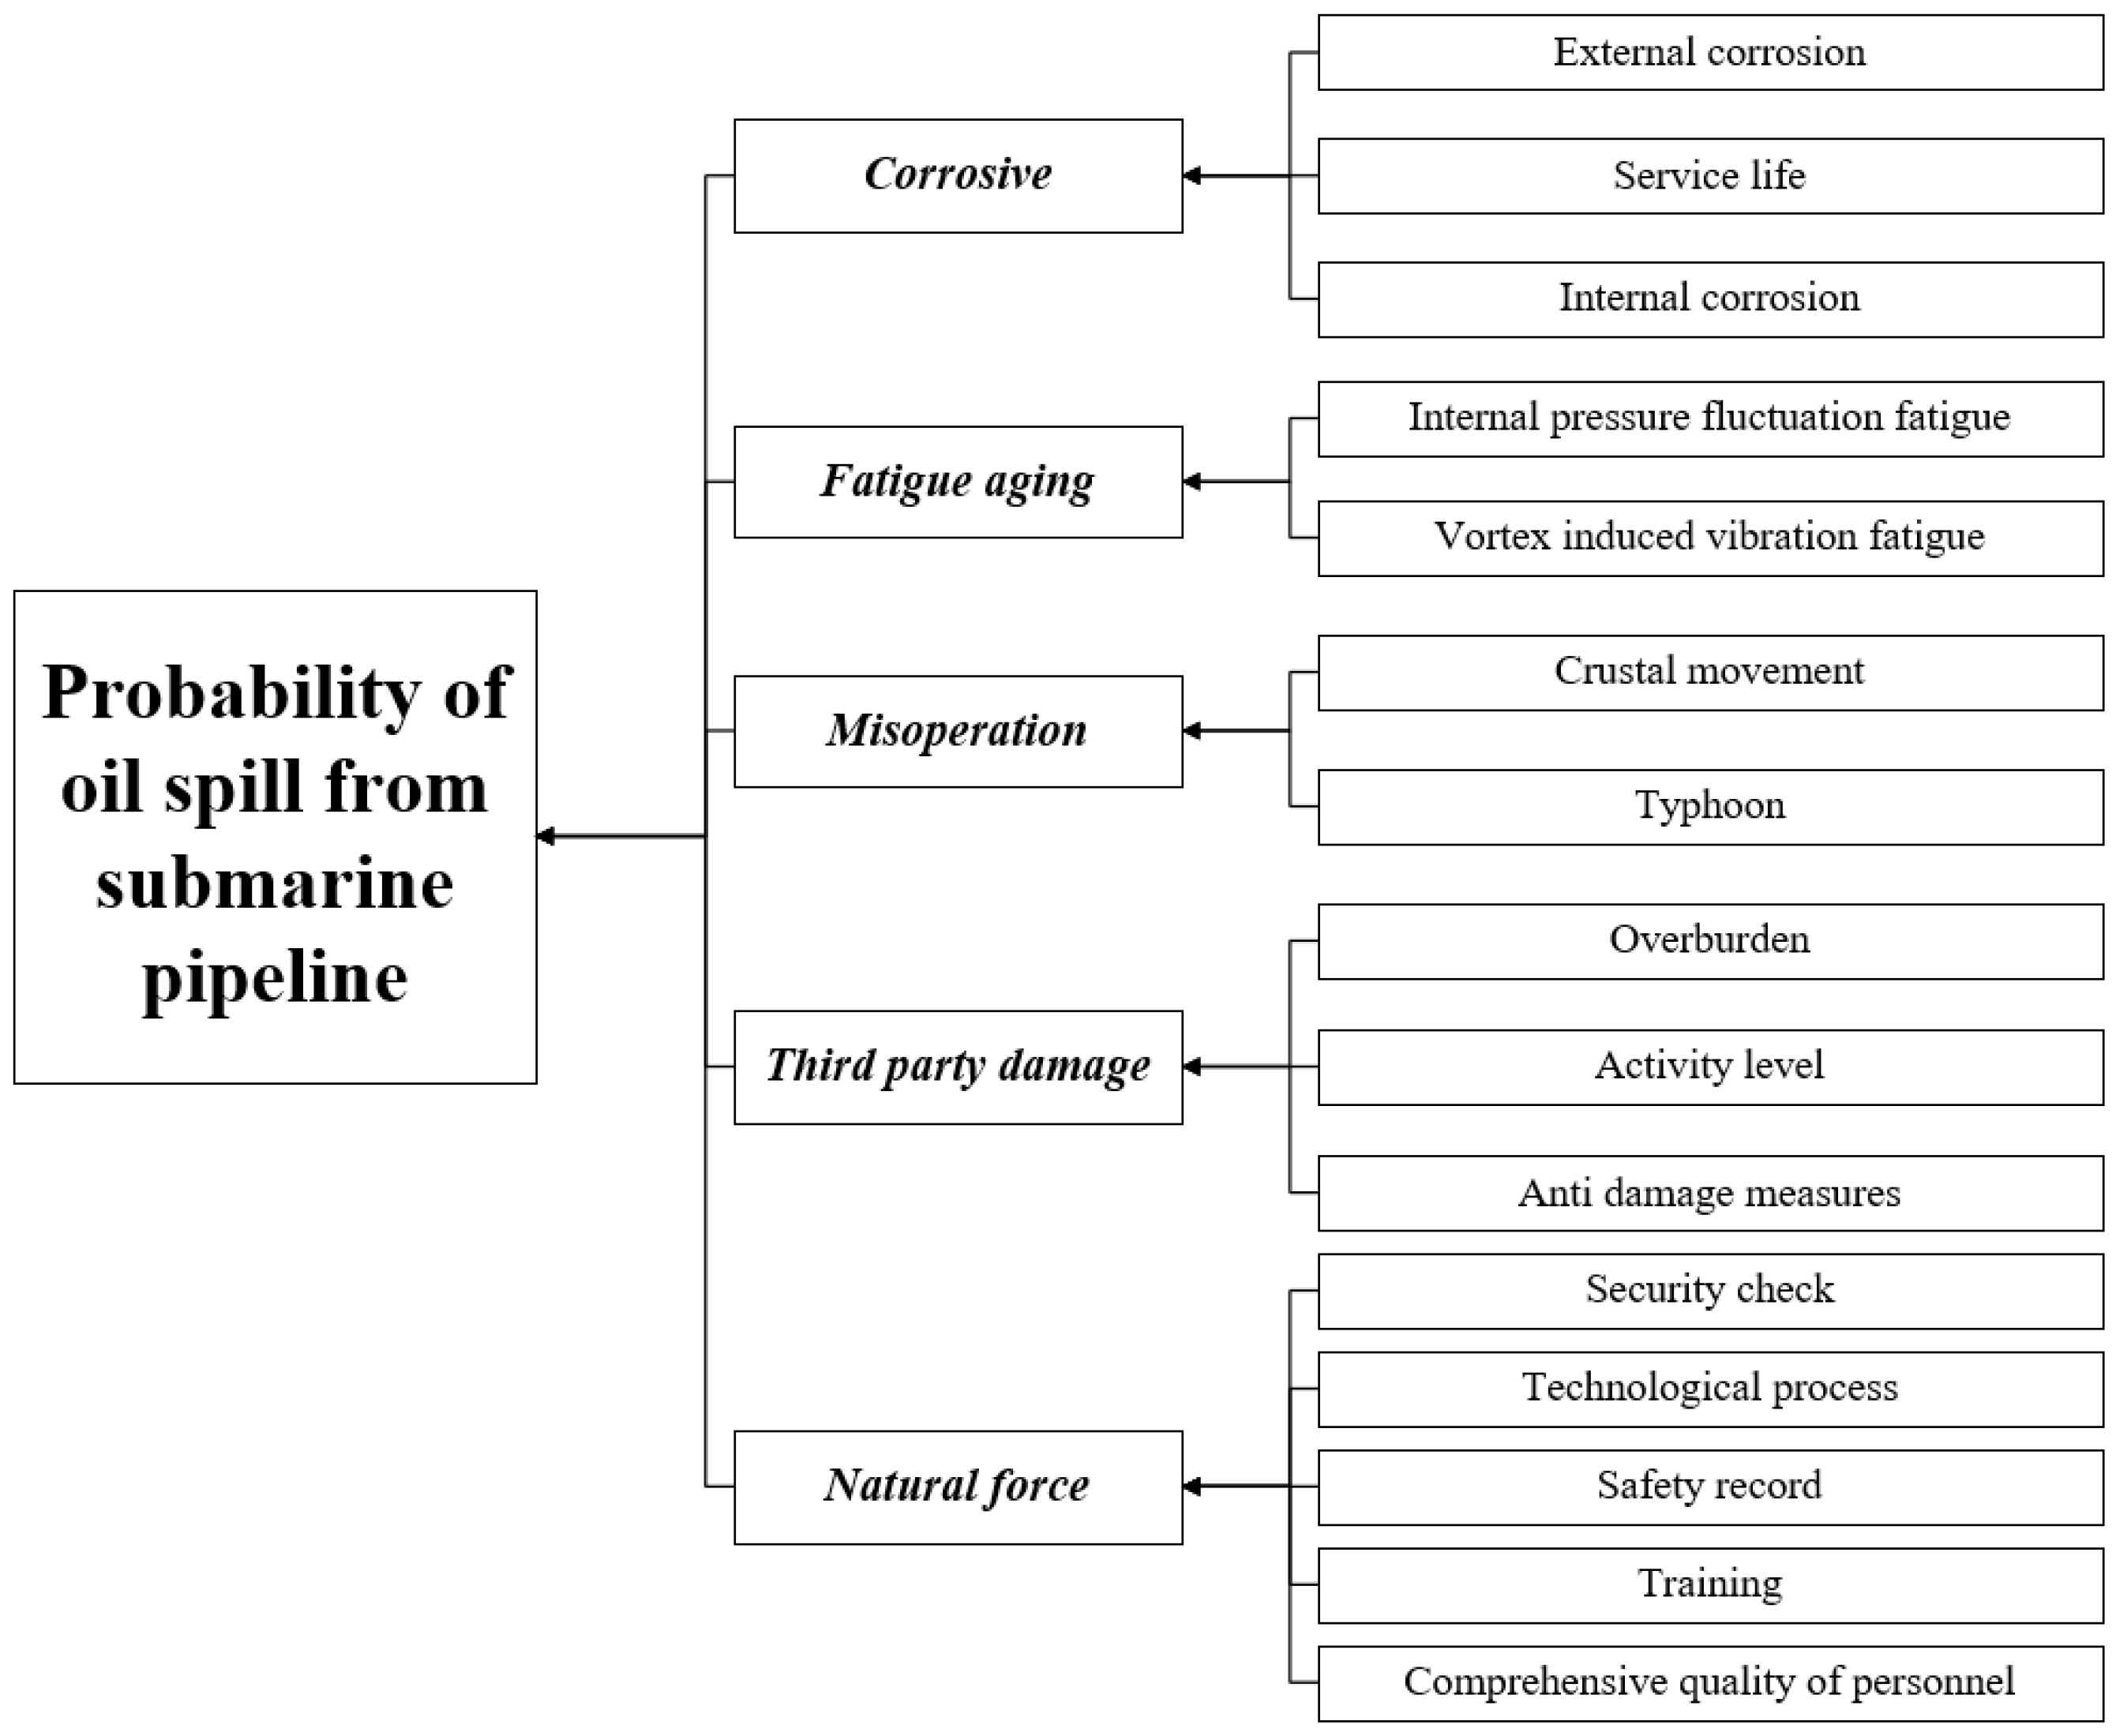
- Establishment of index system and score evaluation of submarine pipeline oil spill.
Submarine pipeline indicators are established based on the relevant contents of Yang et al. [34] and have corresponding scoring rules (see Figure 6). Similarly, there are many indicators in the risk index system of submarine pipelines, so the same classification method is used to classify these indicators, and, finally, the oil spill probability of submarine pipelines is obtained.
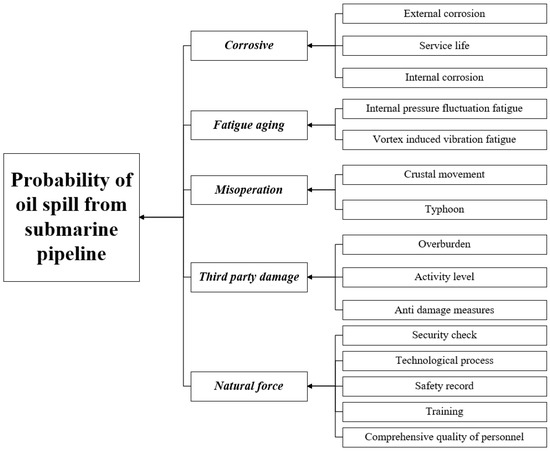
Figure 6.
Risk index of submarine pipeline oil spill.
3.2.2. Data Processing of Risk Indicators
- (1)
- Ship risk indicators data processing.
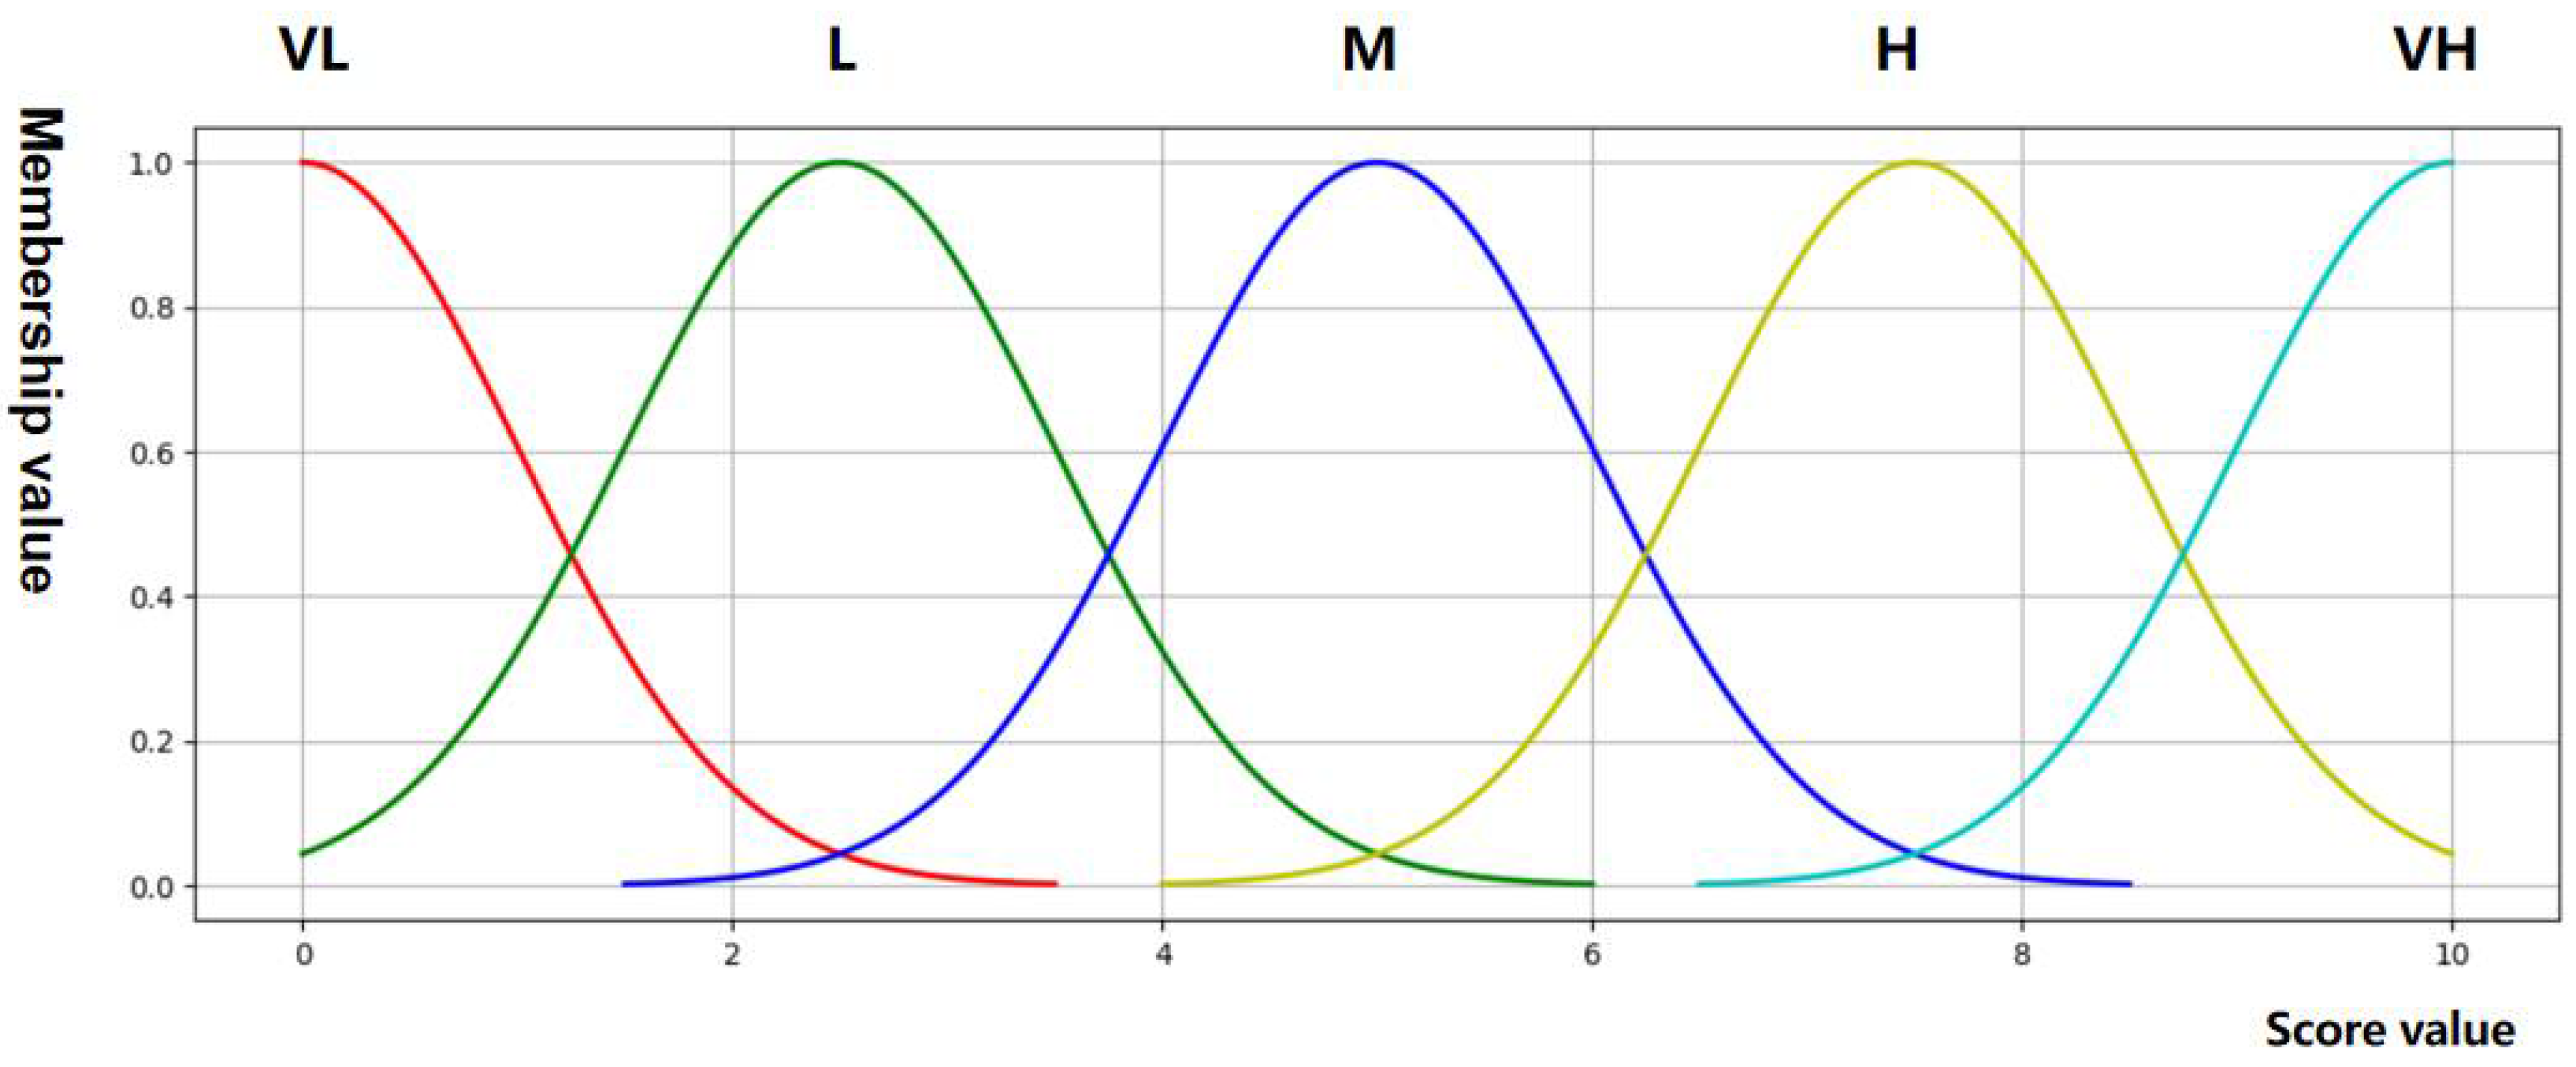
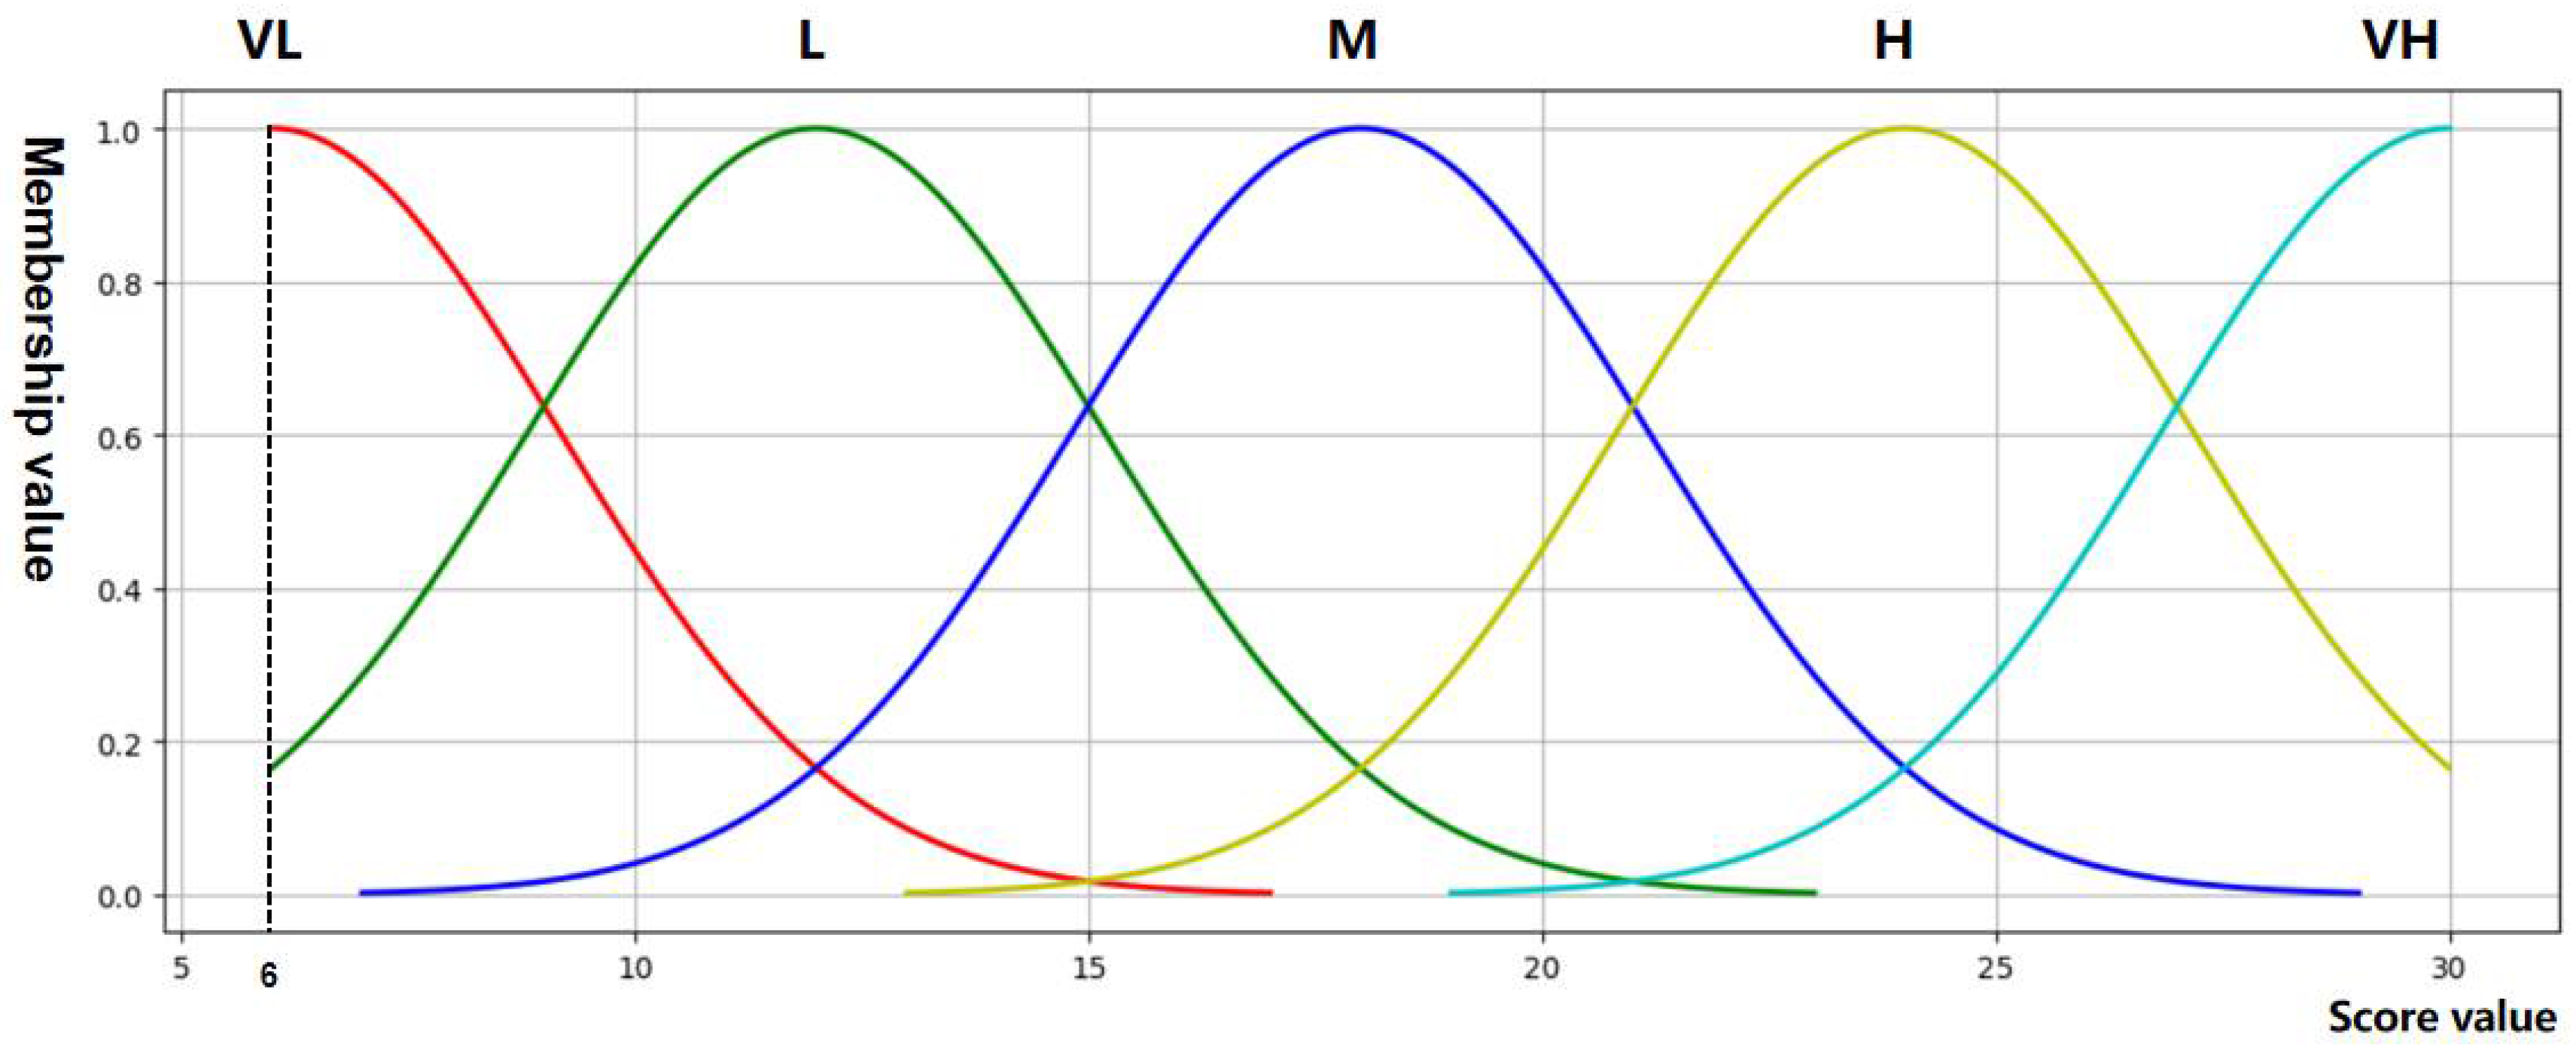
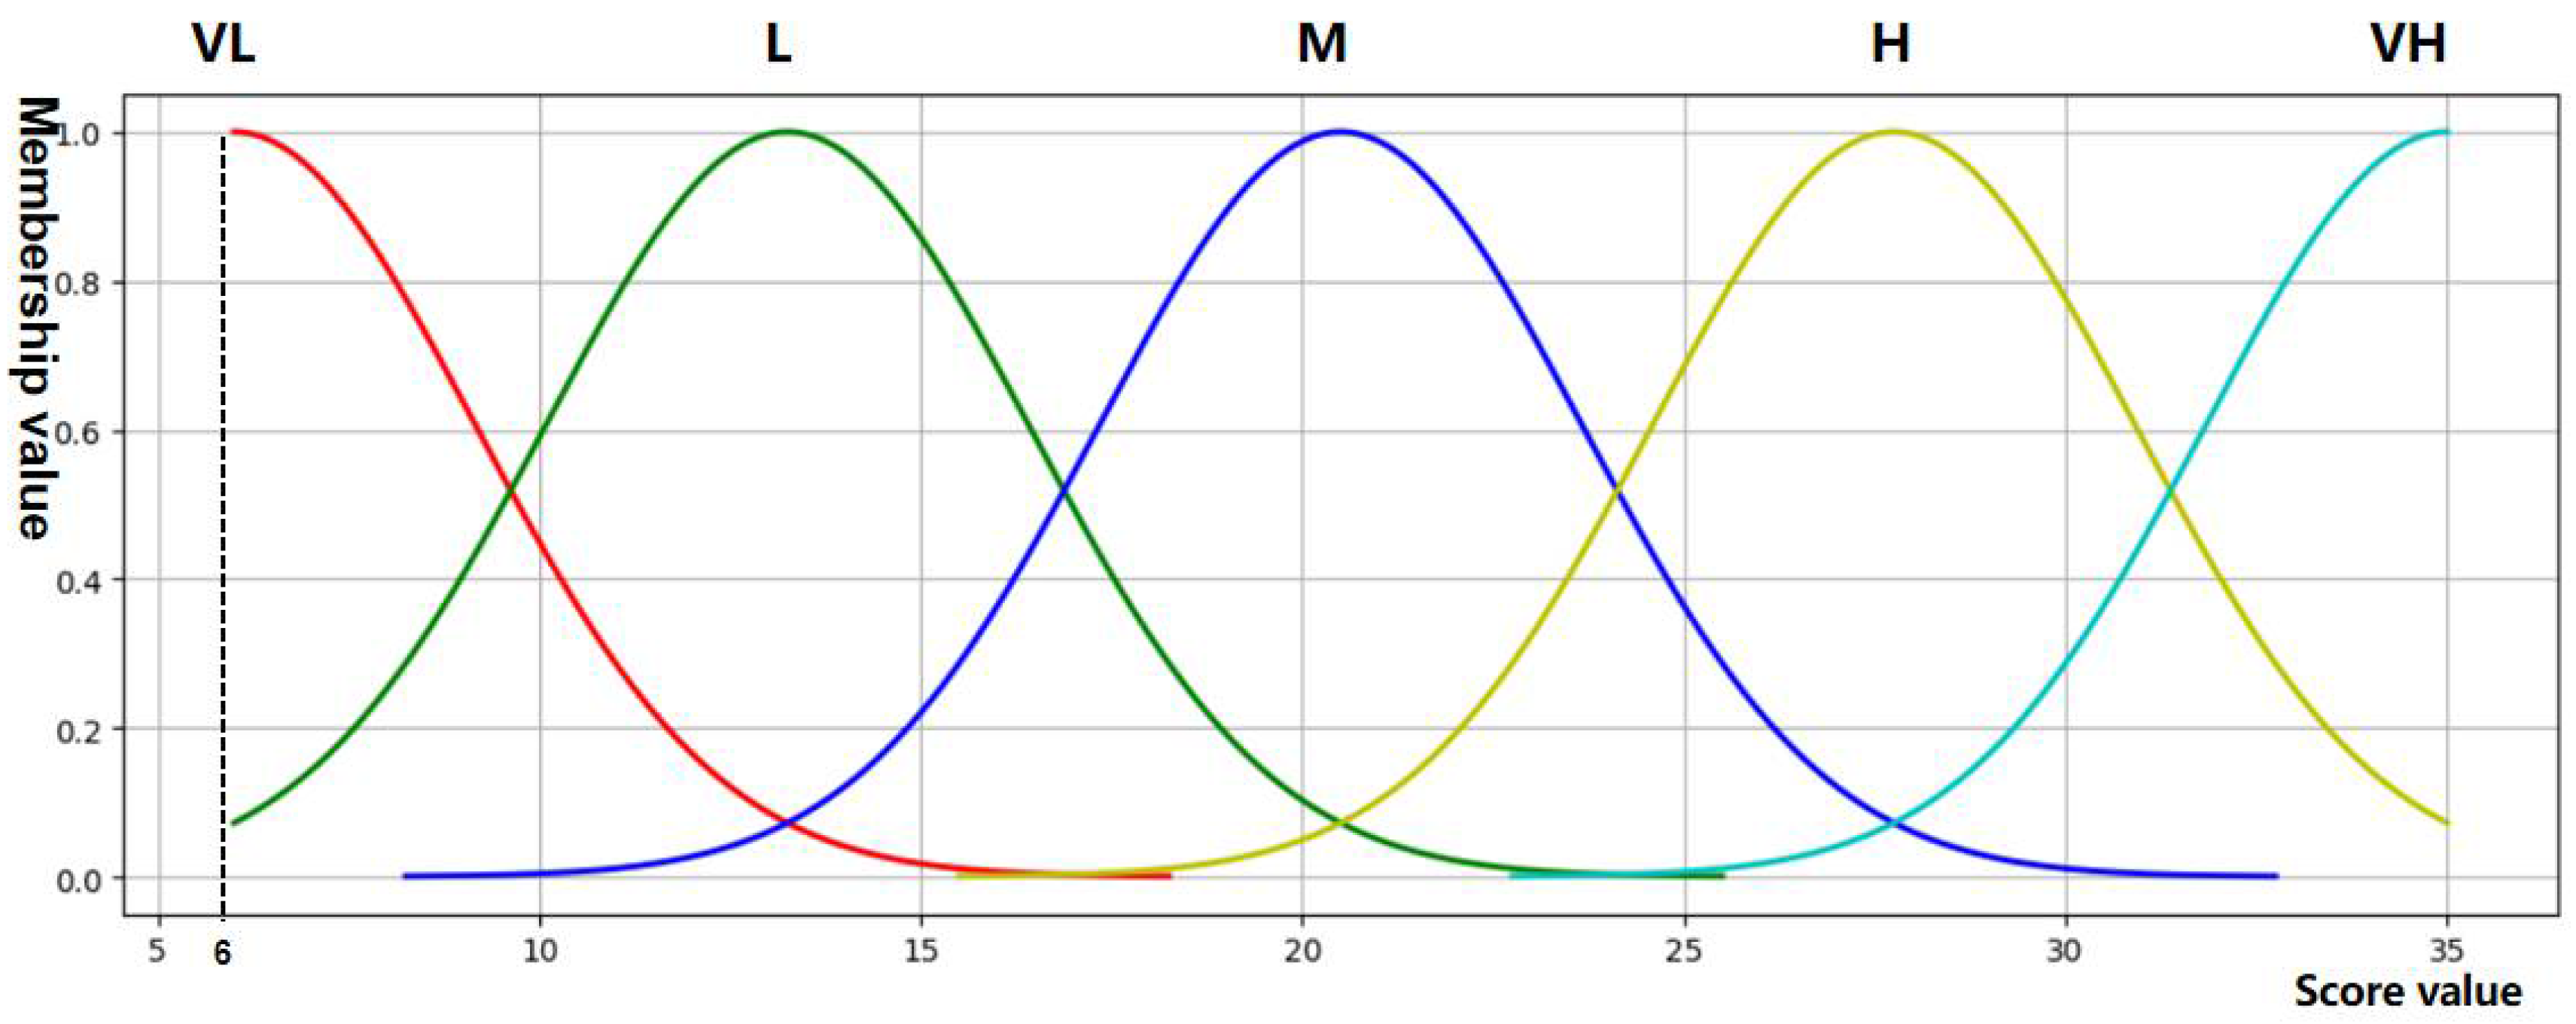
Based on the ship risk indicator established in Section 3.2.1, because Gaussian function is more in line with the reality, this paper uses Gaussian membership function for membership analysis [35]. The risk level of risk indicators is set as 5 levels (very low, low, medium, high and very high). For length reasons, only the membership function of wind risk indicator is shown Figure 7.
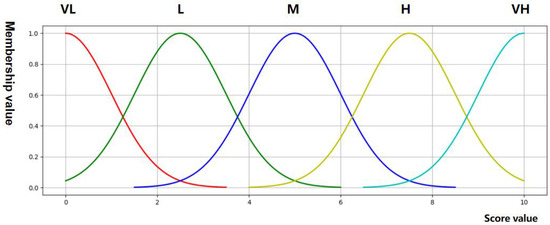
Figure 7.
Gaussian membership function of wind index.
- (2)
- Data processing of risk indicators of offshore oil well platform and submarine pipeline.
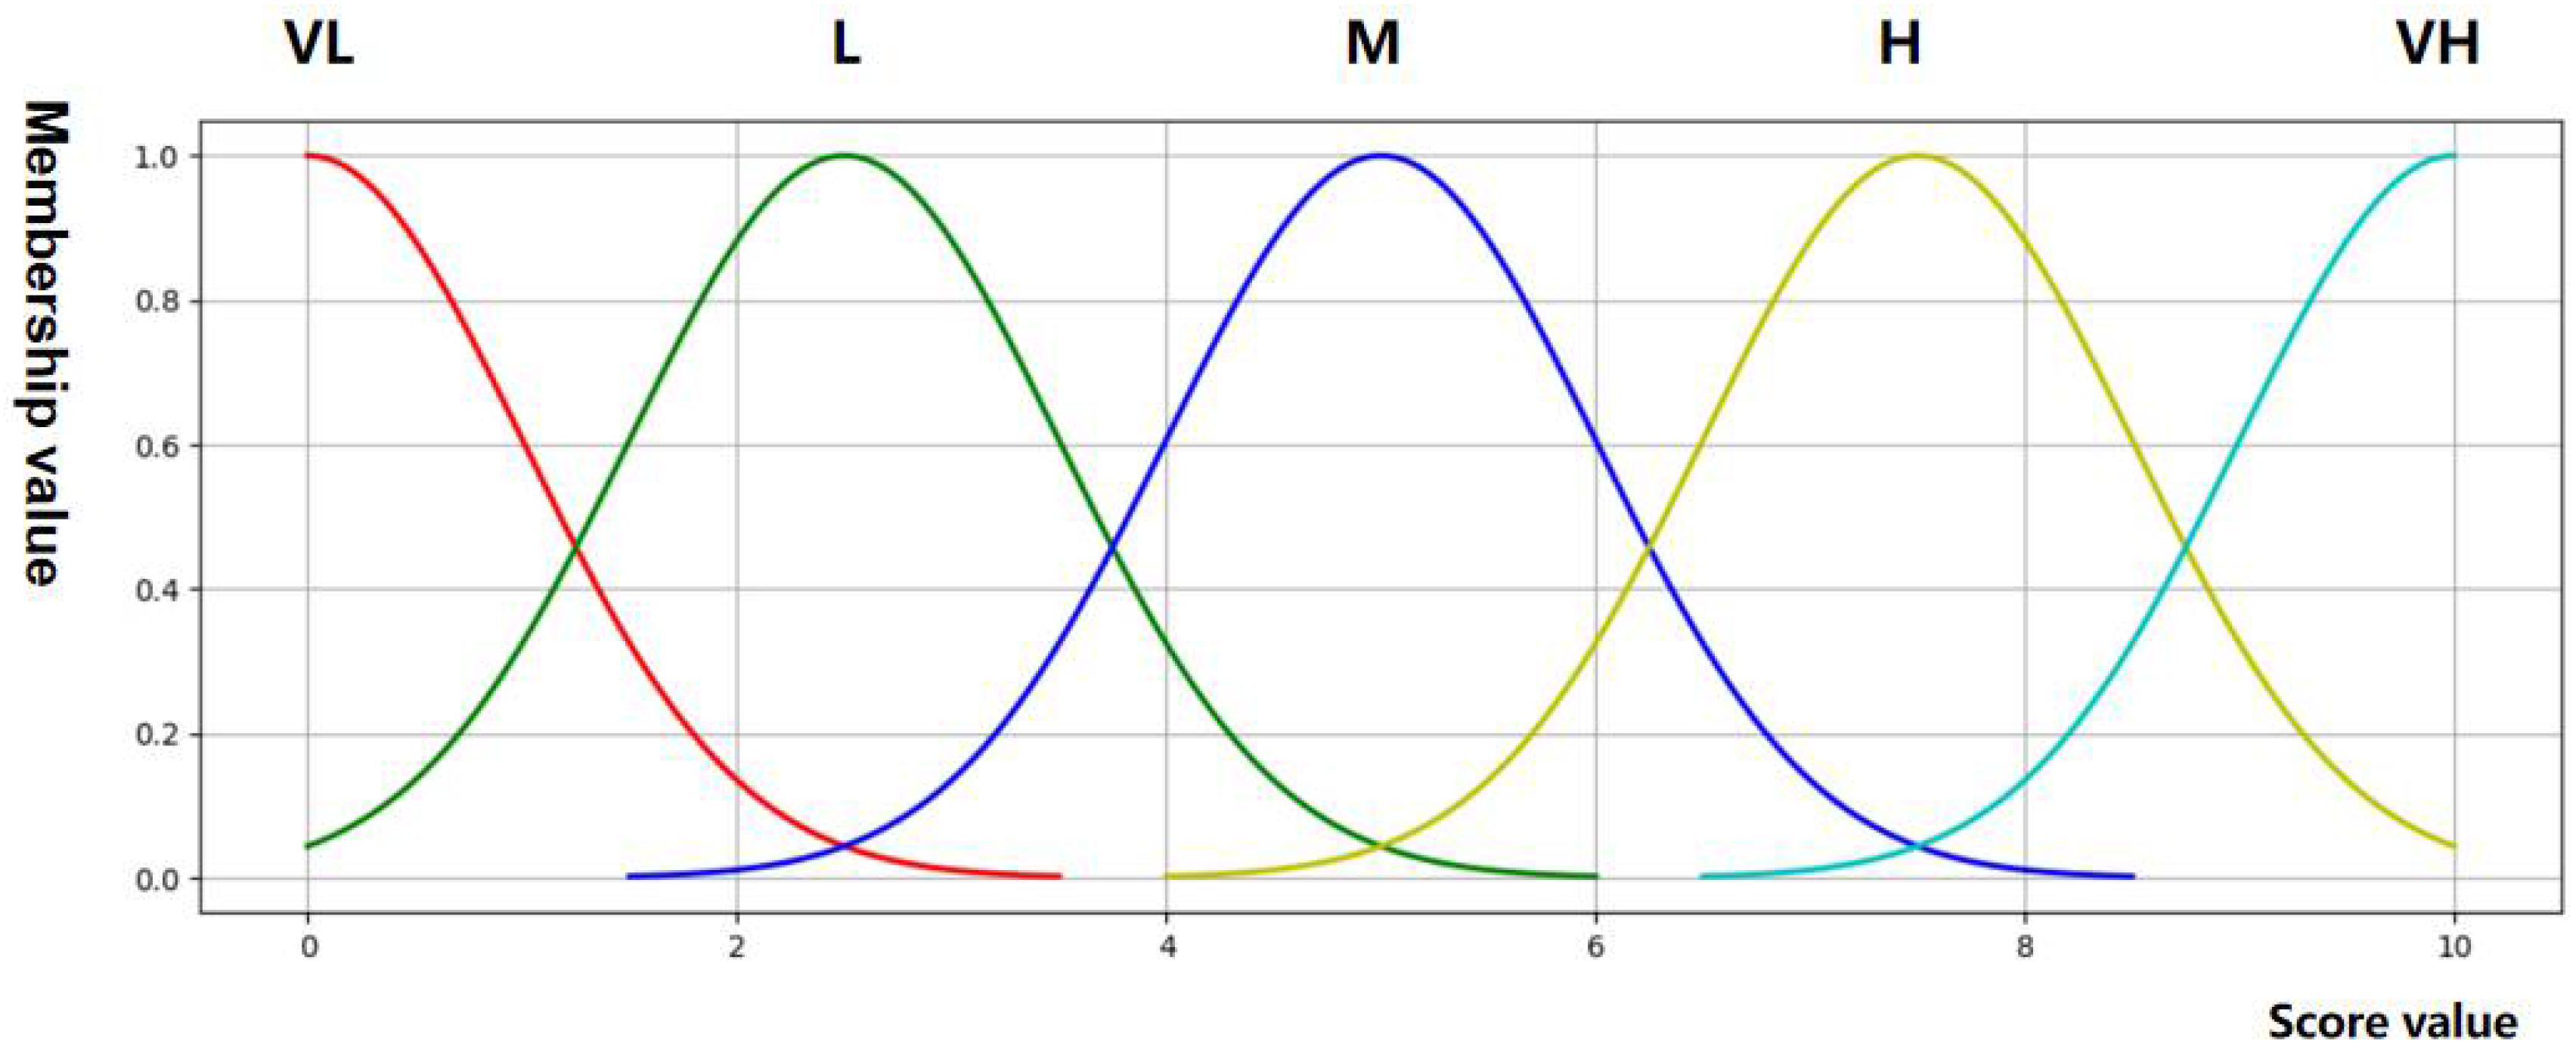
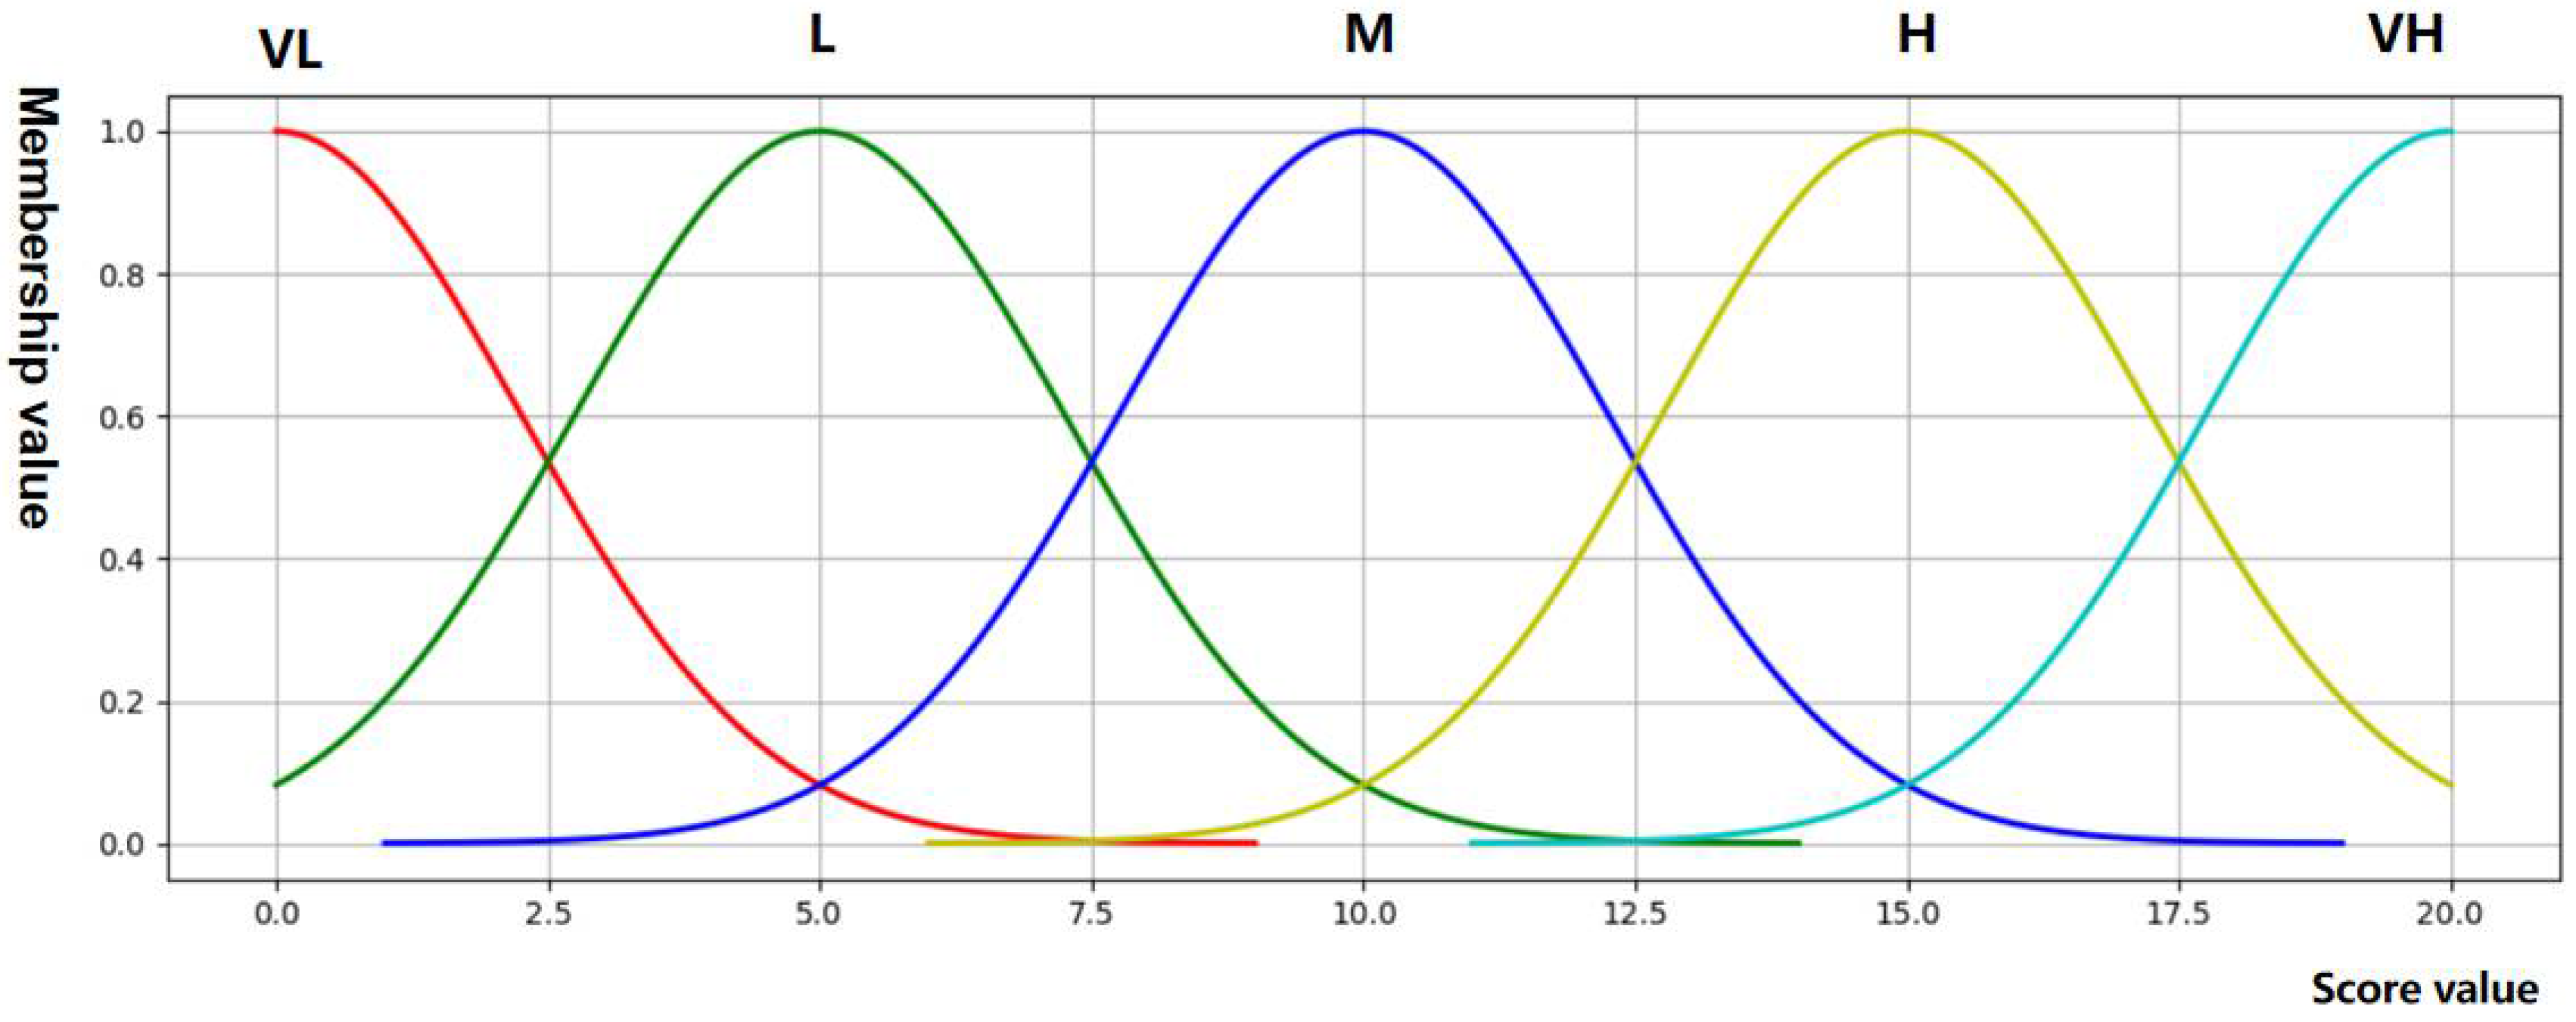
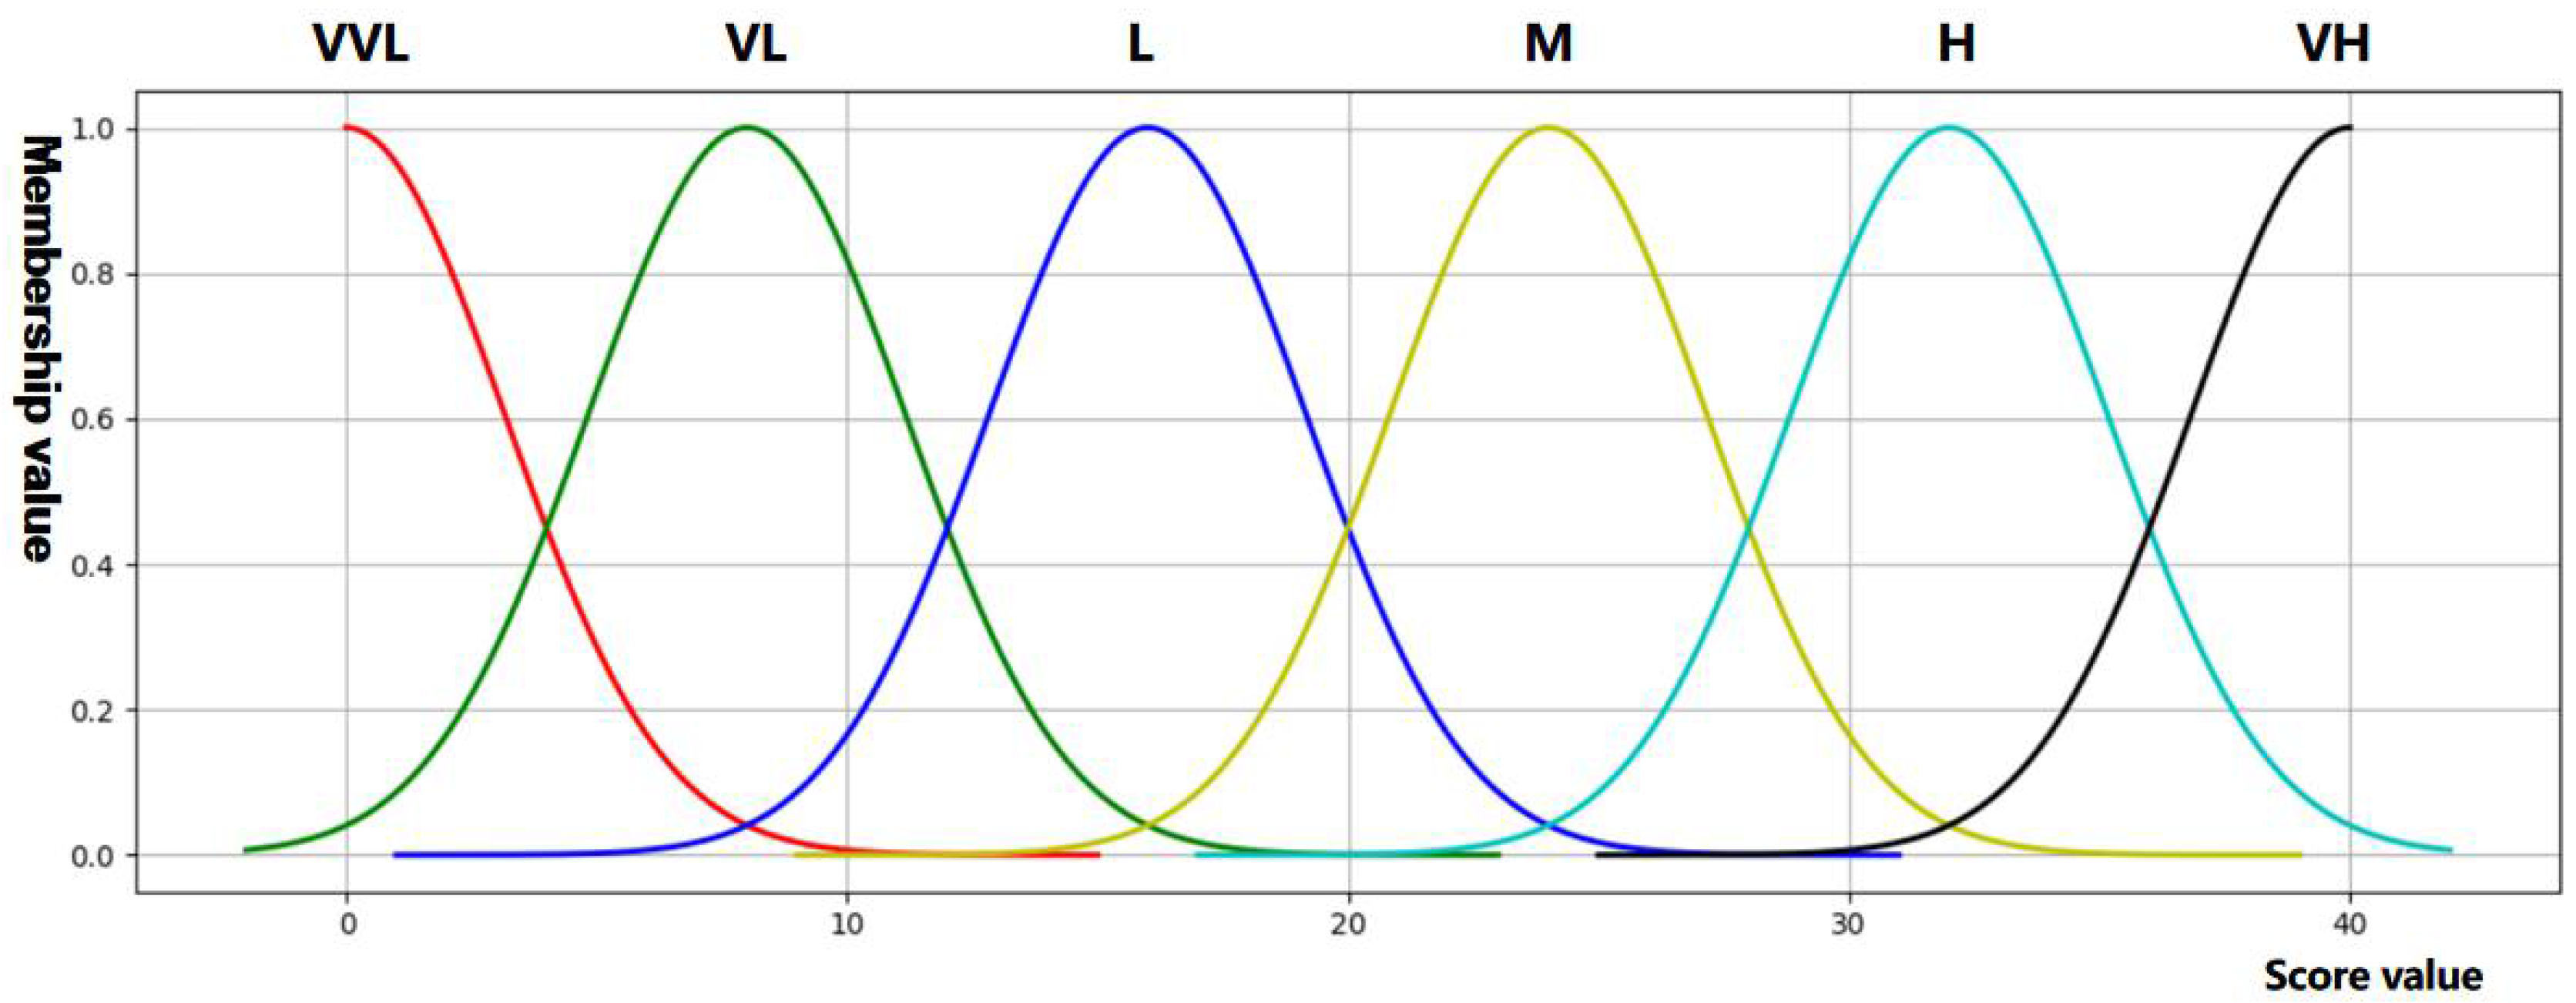
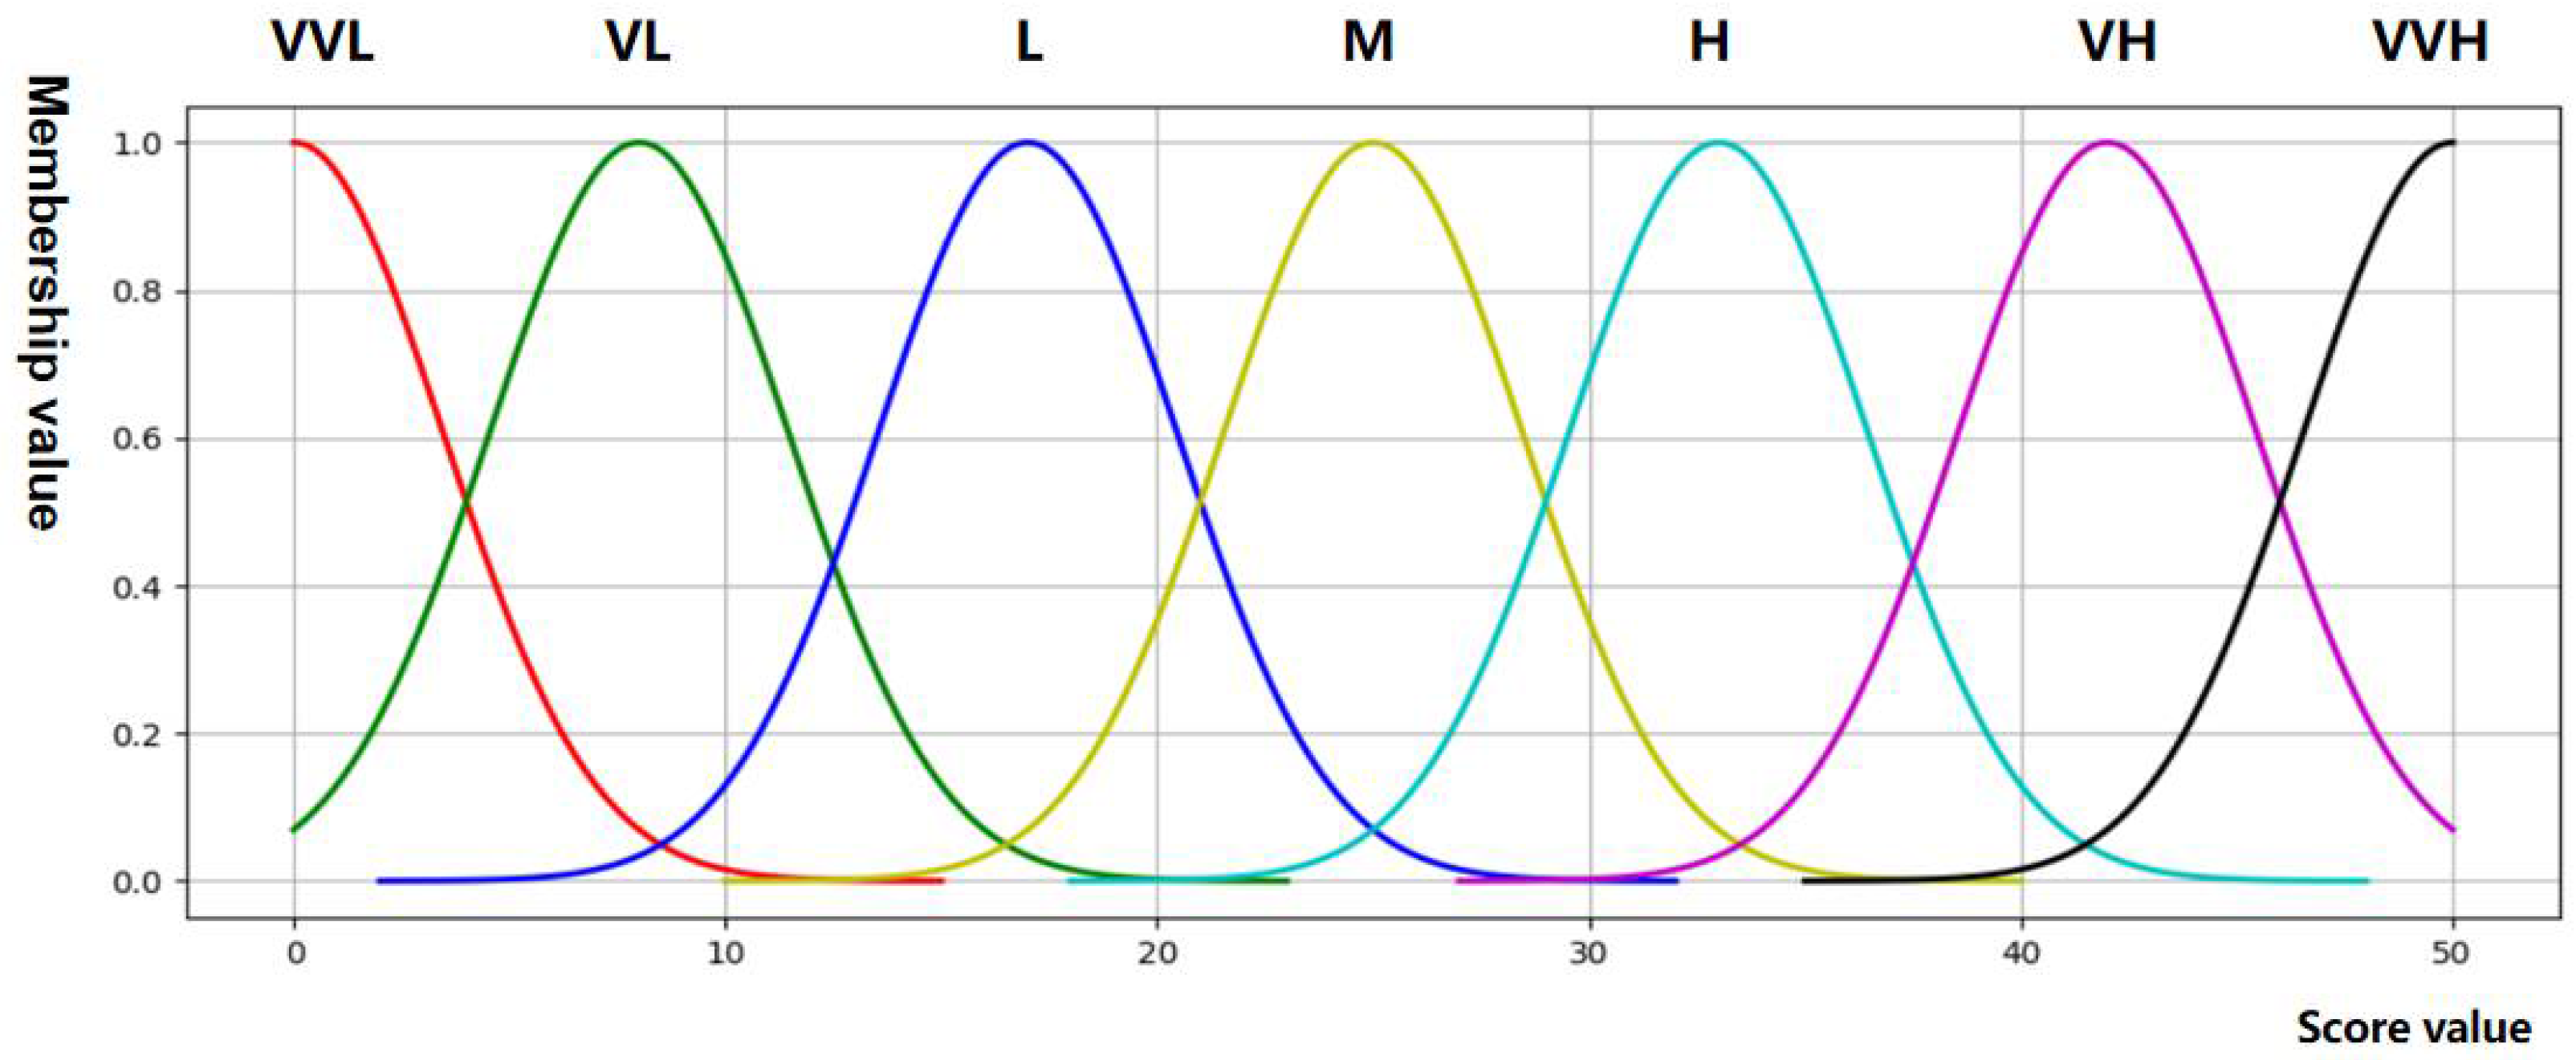
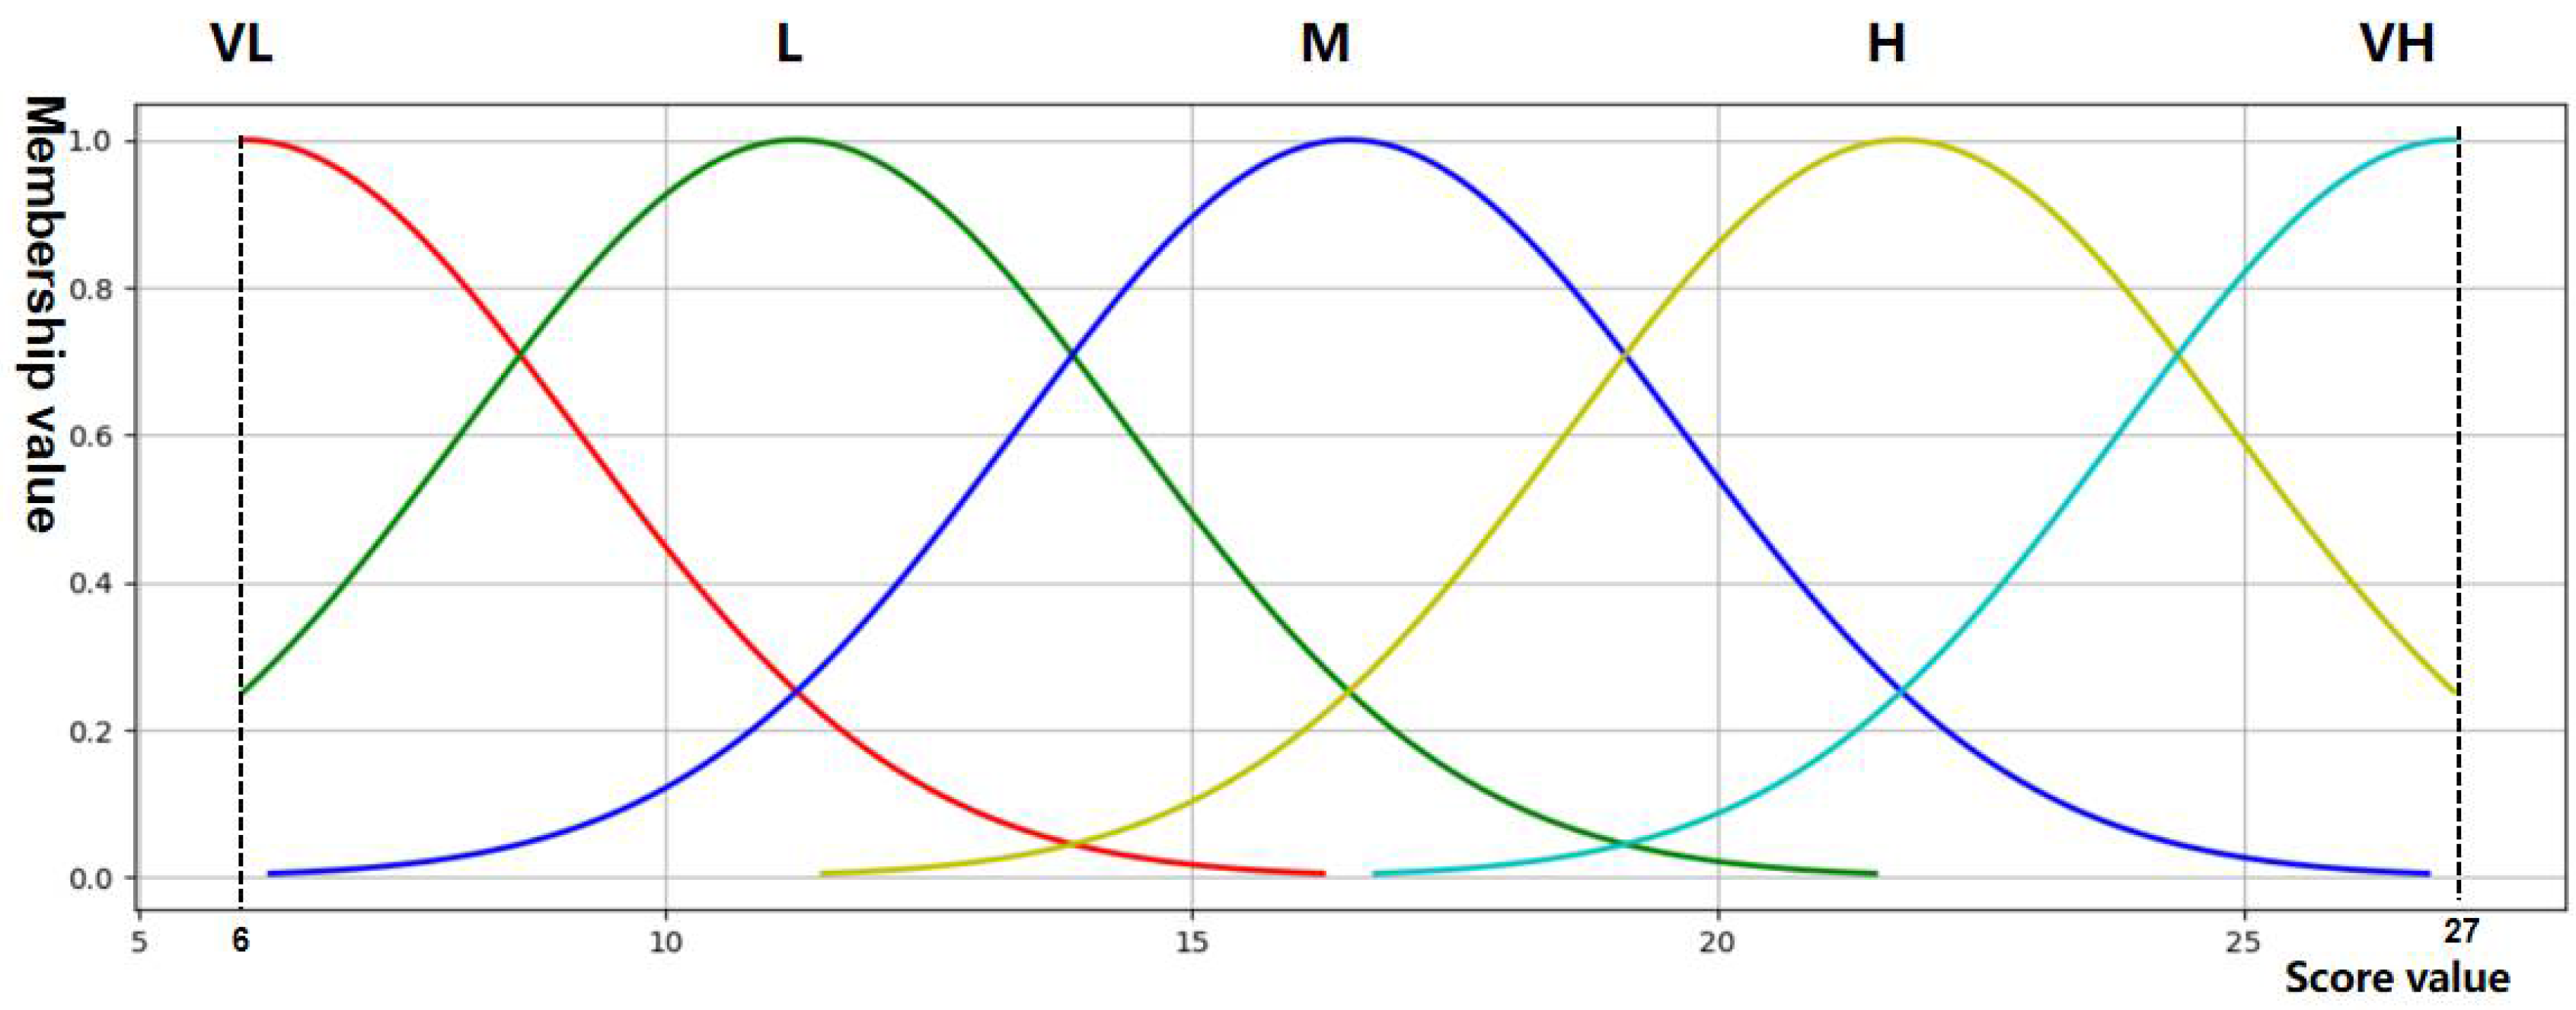
It can be known from Section 3.2.1 that, before the fuzzy inference system, the risk indicators are classified first. The score of classified risk indicator is the sum of the scores of similar risk indicators. Here, when establishing the membership function of the risk index after classification, it is necessary to appropriately increase the risk level of the risk index to ensure the accuracy of the membership function. For example, the risk indicators of oil well platform emergency capability are divided into five categories, so the maximum score of emergency capability is 50 and the minimum score is 0, while the corresponding risk level is increased to seven levels (very low, very low, low, medium, high, very high and very high). The membership function of oil well platform emergency capability risk indicators is shown in Figure 8.
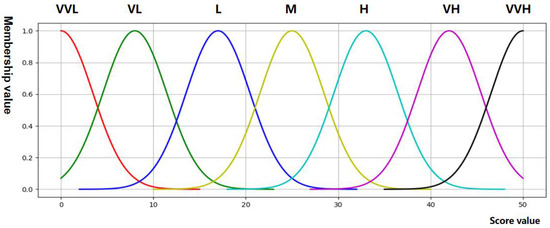
Figure 8.
Membership function of risk index of emergency capability of oil well platform.
3.2.3. Formulation of Fuzzy Rules
According to the description of fuzzy inference principle in Section 3.1, the main forms of fuzzy rules in this paper are as follows:
where, represents the score of oil spill risk index, that is, the input value of fuzzy rule; represents the risk level to which the oil spill risk index score belongs; Z is the final oil spill probability corresponding to different types of oil spill accidents (Z here will be further subdivided in Section 3.2.4 according to different oil spills); and B is the risk level of the final oil spill probability corresponding to different types of oil spill accidents.
- (1)
- Fuzzy rules for ship oil spill accidents.
There are six risk indicators of ship oil spill accidents. The scores of these six risk indicators are used as the input value of the fuzzy inference system, that is, xn in Formula (1). The number of fuzzy rules corresponding to the fuzzy inference system can be deduced. In this paper, the number of fuzzy rules corresponding to ship accidents is up to 15,625. Even if one tenth of them is simplified, there are more than 1500. This number of rules requires expert group evaluation, which is not only inefficient, but also of little significance. Therefore, this paper uses Gaussian function to establish the membership function of the final ship oil spill accident probability, and determines the risk level of the final oil spill probability in the fuzzy rules through the membership function of the final ship oil spill accident probability, that is, B in Formula (1).
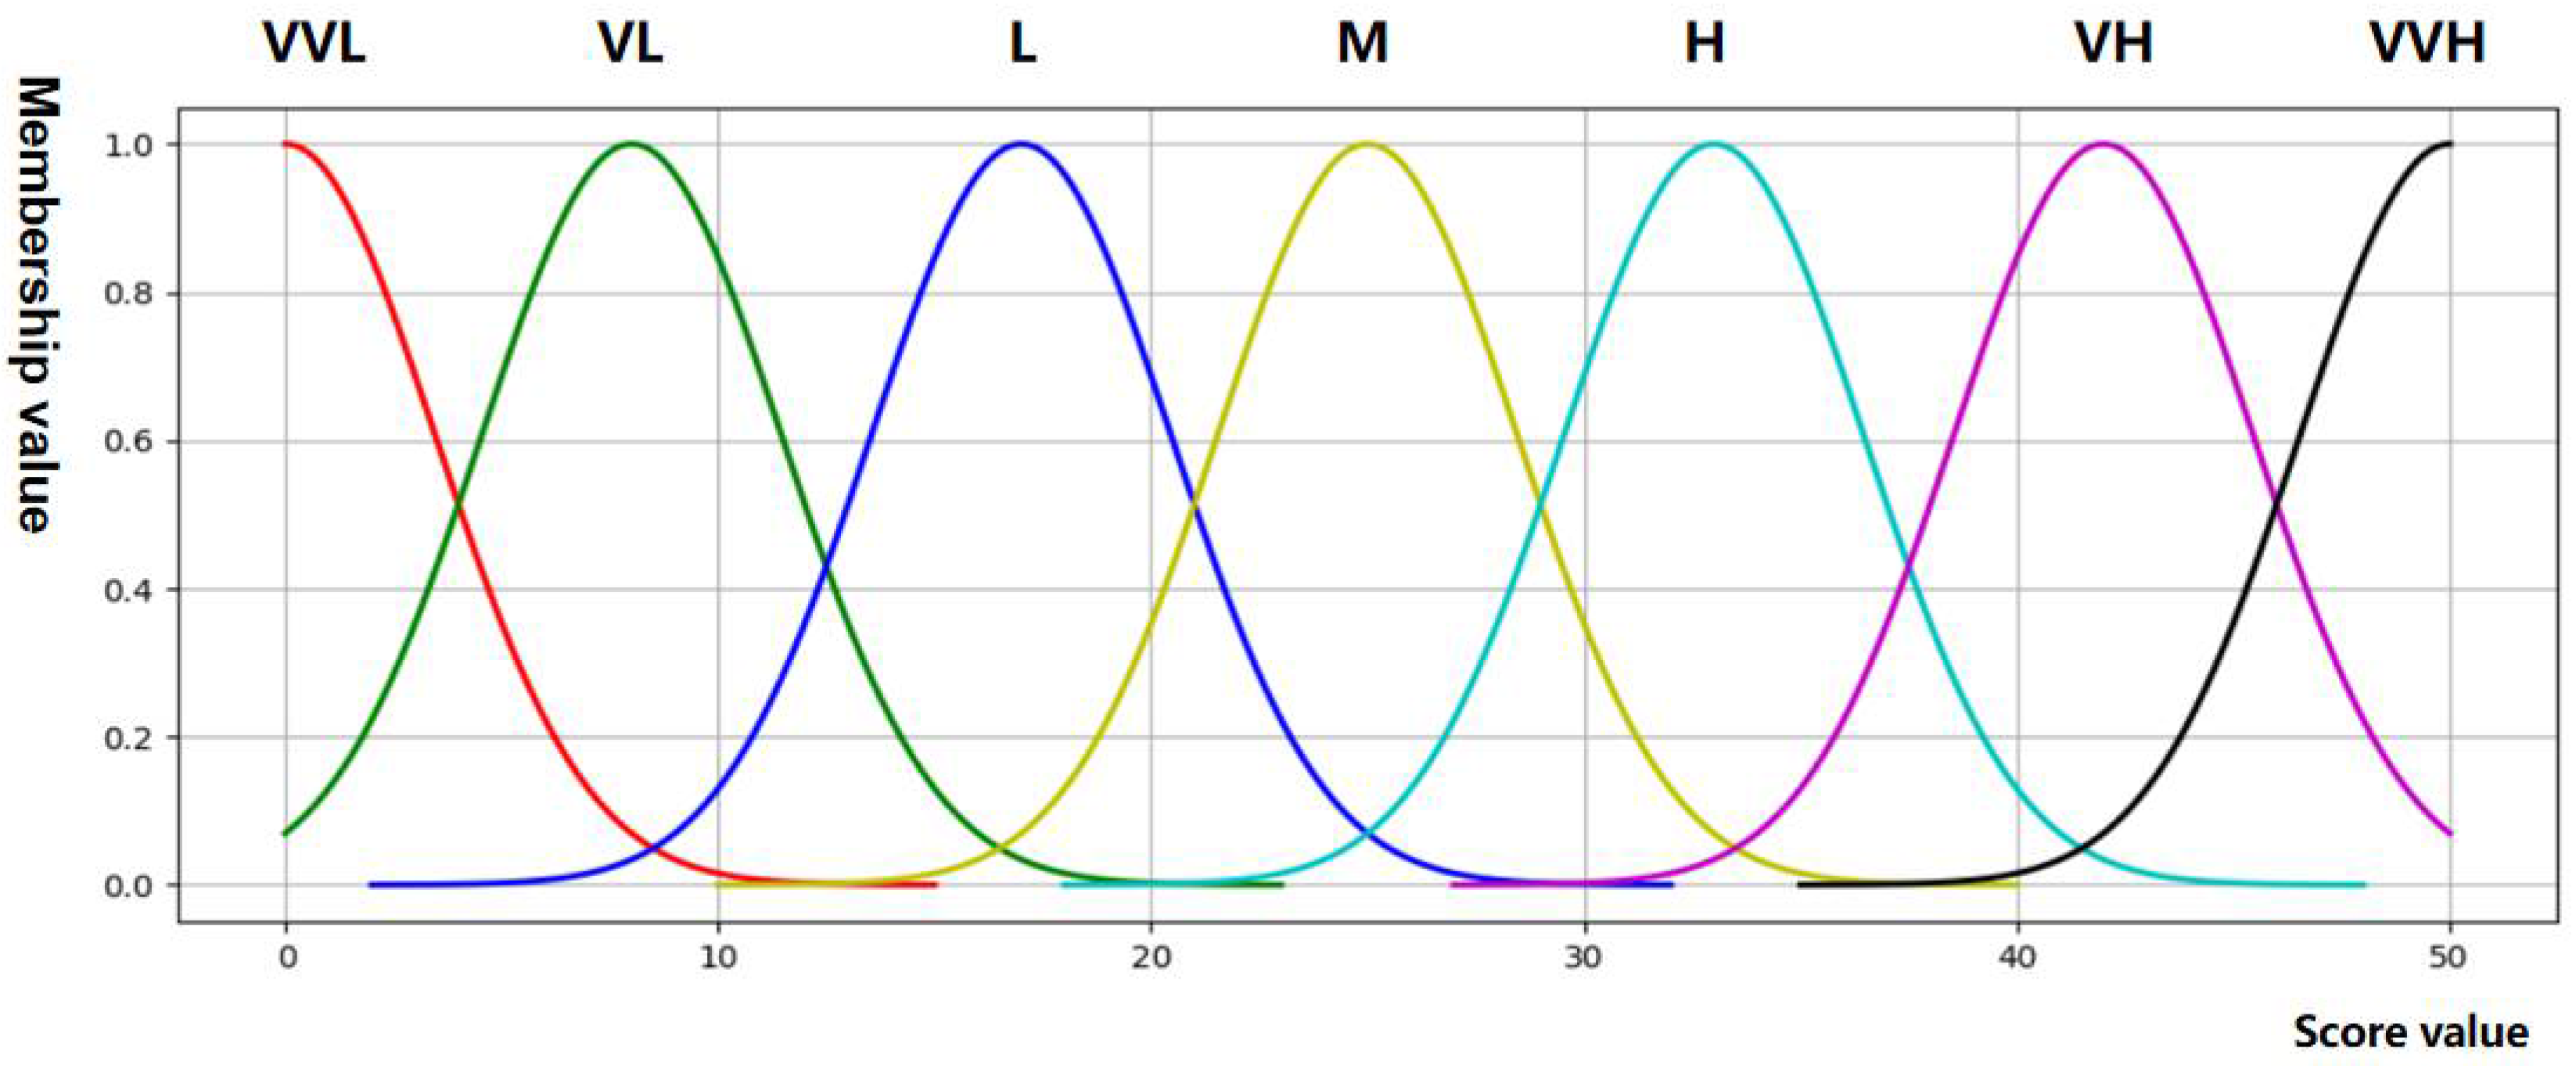
As different risk indicators of the ship have different impacts on the final results, the six risk indicators selected in this paper are the main risk sources of ship oil spill accidents. Although the impact of the six risk indicators on the final results is different, this can be ignored. Therefore, this paper assumes that the six risk indicators selected in this paper have the same impact on the final results. On this basis, it is helpful to establish the Gaussian membership function of the final ship oil spill probability. The six indicators correspond to different oil spill levels. The highest level of each indicator is 5 and the sum is 30. Then, the risk level of the final result of ship oil spill can be divided into five levels (very low, low, medium, high and high). According to the opinions of the expert group, the Gaussian membership function of the final probability of ship oil spill accident is established, as shown in Figure 9.
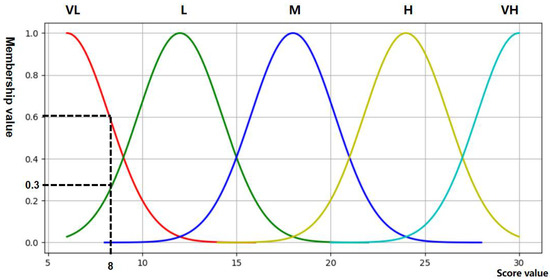
Figure 9.
Gaussian membership function of final ship oil spill accident probability.
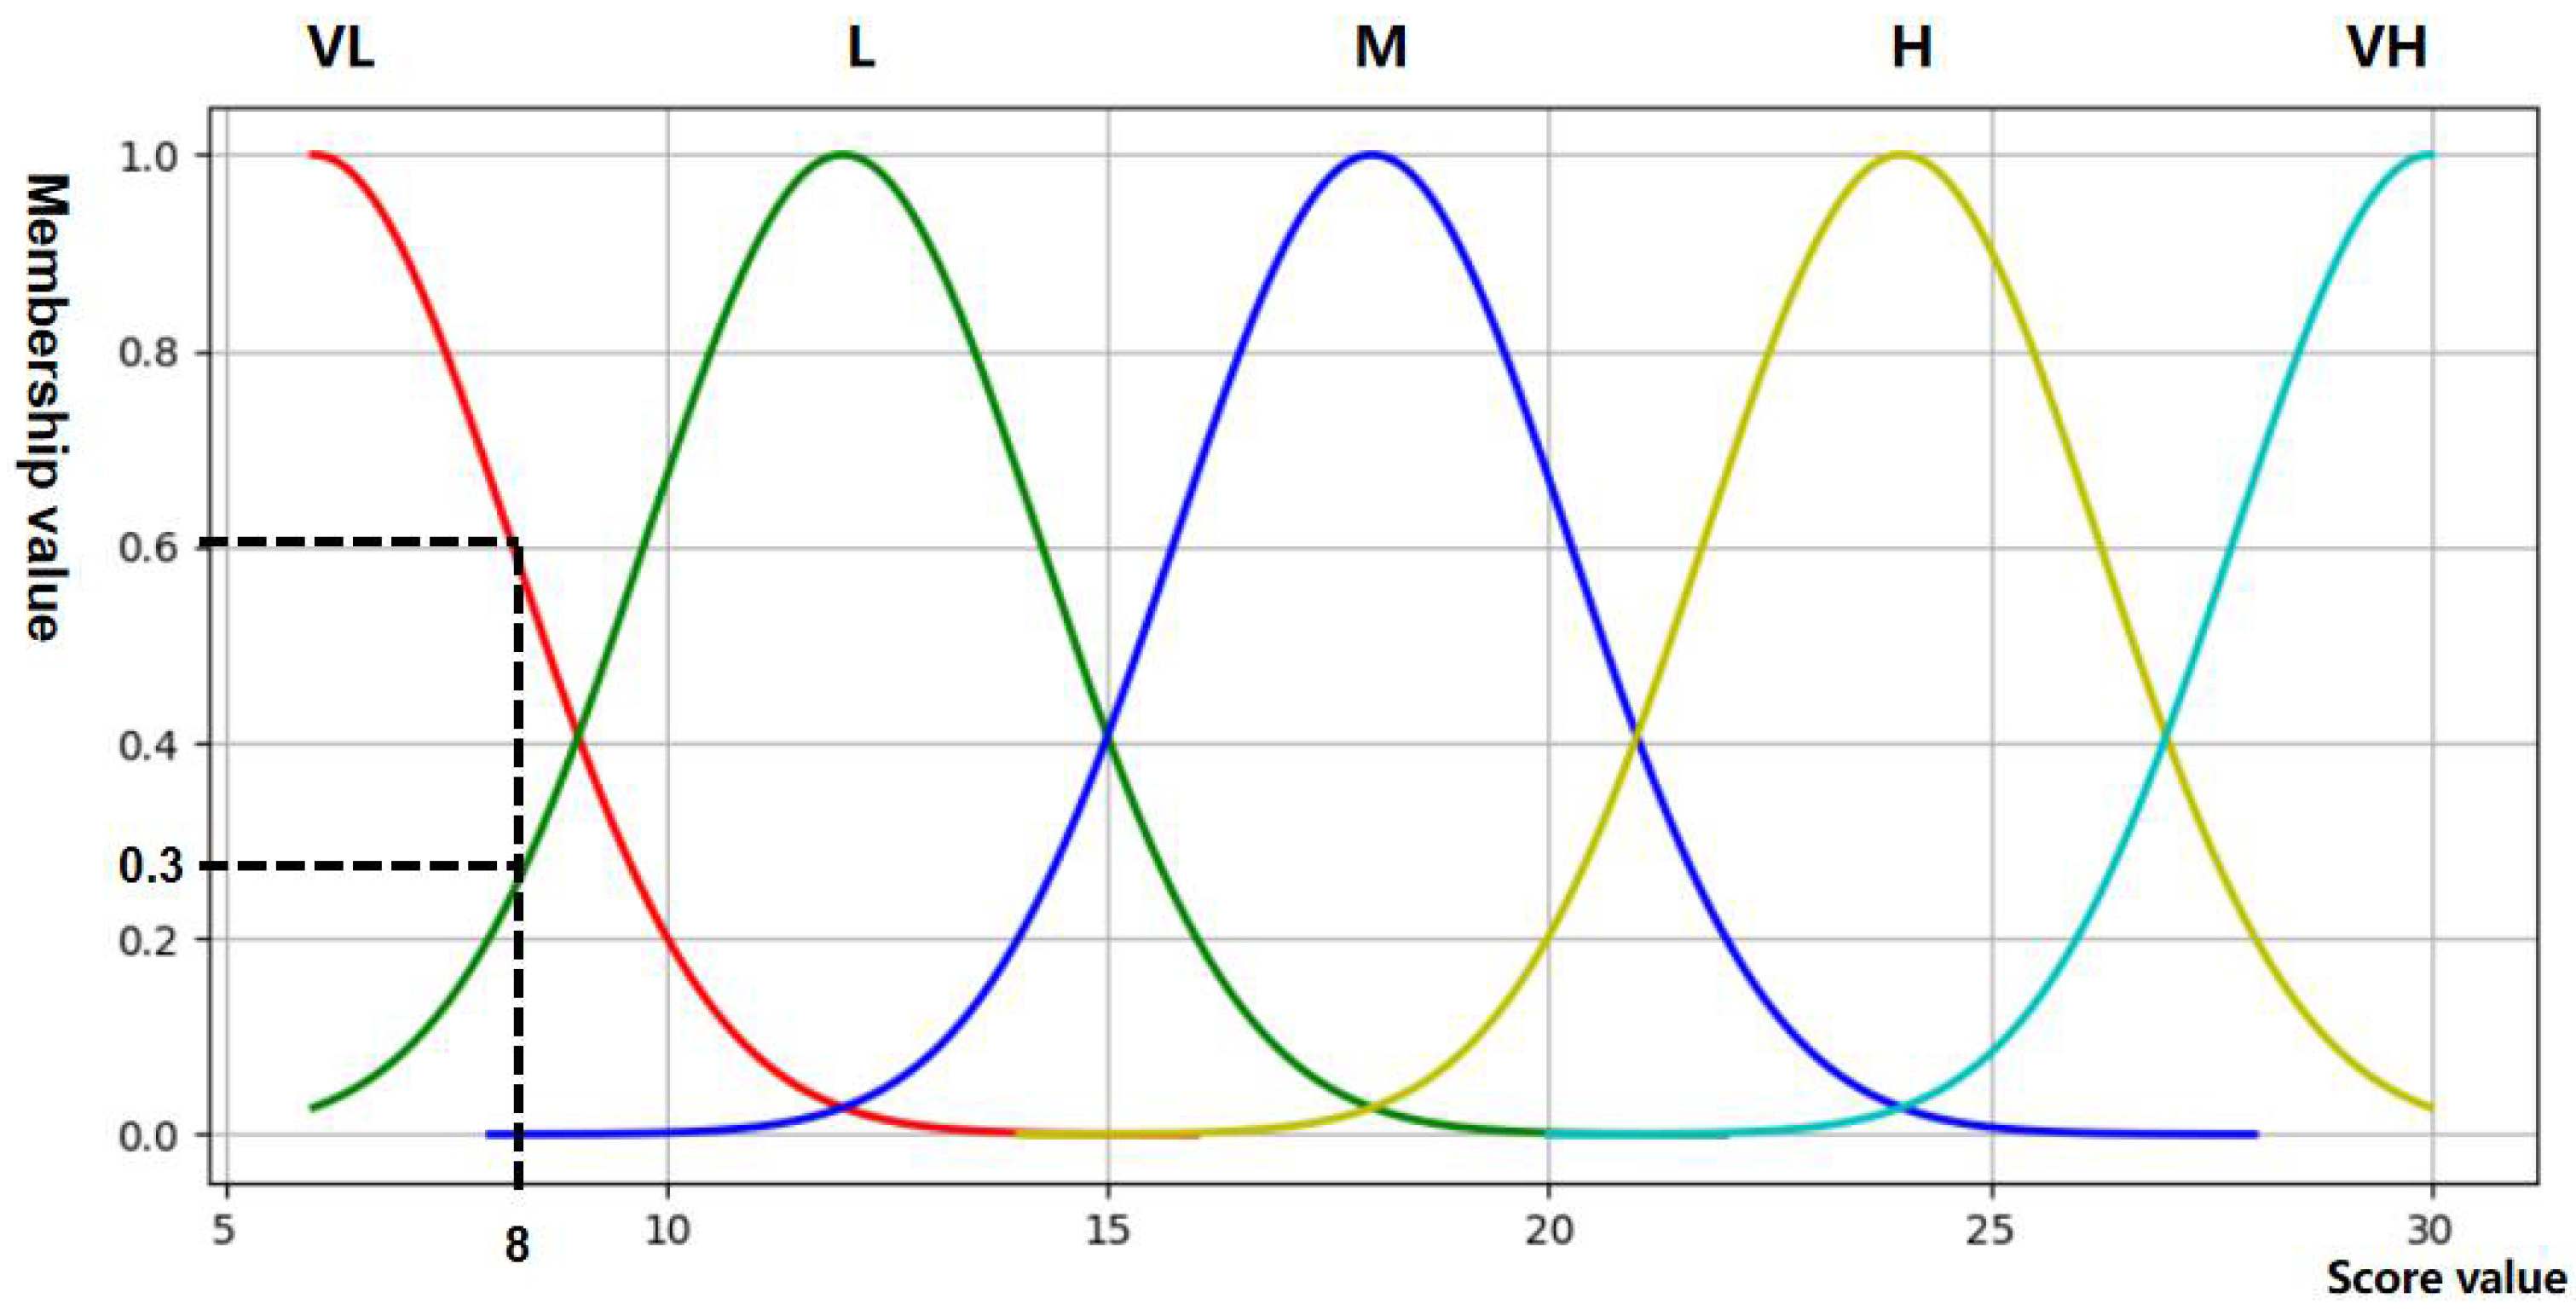
According to the Gaussian membership function of the final ship oil spill accident probability given by the expert group in Figure 9, it can be seen that the sum of different levels of the six risk indicators will correspond to the membership of different levels of the final result of ship oil spill, and then the different combinations of the six indicators will be divided into the ship oil spill level with higher membership. As shown in Figure 9, assuming that the sum of the six indexes of ship oil spill is 8, the membership degree corresponding to the final ship oil spill grade of “very low” is 0.6, and the membership degree corresponding to the final ship oil spill grade of “low” is 0.3. When the sum of the six indexes is 8, the corresponding final ship oil spill probability grade is very low, then the corresponding fuzzy rules can be obtained.
Using the above method, we can obtain the fuzzy rules corresponding to all the combinations of six indicators, but inputting more than 15,000 fuzzy rules into the code is a huge workload. Although it can ensure high accuracy, it is not necessary to obtain the final oil spill probability in this paper. Therefore, in order to appropriately reduce the workload and ensure the accuracy of the results, this paper expects to use about 1000 fuzzy rules.
- (2)
- Fuzzy rules for oil well platform and submarine pipeline.
In Section 3.2.1, the risk indicators of these two types of offshore oil spill accidents are established and classified according to the types of risk indicators. After classification, the oil spill risk indicators of oil well platforms are divided into 6 categories and the oil spill risk indicators of submarine pipelines are divided into 5 categories. The oil well platform takes the scores of the above classified six types of risk indicators as the input value of the fuzzy rules of the oil well platform, that is, xn in Formula (1), and the submarine pipeline takes the scores of the above classified five types of risk indicators as the input value of the fuzzy rules of the submarine pipeline, that is, xn in Formula (1). The derivation process of subsequent fuzzy rules is the same as that of ship oil spill accidents. After derivation, the number of fuzzy rules of oil well platforms is 36,750 and that of submarine pipelines is 4375. On the premise of ensuring the calculation accuracy, random sampling is carried out in these fuzzy rules. The fuzzy rules obtained by random sampling are the fuzzy rules required by the fuzzy inference system of oil well platforms and submarine pipelines in this paper.
3.2.4. Calculation Method of Corresponding Probability of Different Oil Spill Amount
At present, the severity of offshore oil spill accidents is mainly divided into four levels, and the oil spill volumes corresponding to different severities is also different. An oil spill of more than 1000 tons is a particularly major offshore oil spill event, an oil spill of 500–1000 tons is a major offshore oil spill event, an oil spill of 100–500 tons is a major offshore oil spill event, and an oil spill of less than 100 tons is a general offshore oil spill event. It can be seen that the severity of oil spill accidents corresponding to different oil spills is also different.
Therefore, this paper first sets Z in Formula (1) as the probability of oil spill in different types of oil spill accidents. On this basis, combined with the guidance given by the expert group, the fuzzy rules of different types of oil spill accidents are deduced, and the probability of oil spill in different types of oil spill accidents is calculated by using the fuzzy inference system.
After calculating the probability of oil spill of different types of oil spill accidents, we calculate the possibility of oil spill accidents with different degrees of oil spill, taking ship oil spill accidents as an example. Firstly, Z in Formula (1) is set as the possibility of general offshore oil spill events below 100 tons, and the index as the input value does not change. On this basis, combined with the guidance of the expert group, the fuzzy rules of general offshore oil spill events below 100 tons are deduced, and then the possibility value of general offshore oil spill events below 100 tons is calculated through the fuzzy inference system. Similarly, we can calculate the probability of major offshore oil spills of 100–500 tons, major offshore oil spills of 500–1000 tons and particularly major offshore oil spills of more than 1000 tons. Then this value is divided by the sum of the corresponding values of the four oil spill levels to obtain the weight corresponding to different oil spill levels. Finally, this weight is multiplied by the previously calculated probability of different types of marine oil spill accidents, and the corresponding result is the probability corresponding to different levels of oil spill.
3.2.5. Calculation Method of Regional Oil Spill Risk
The oil spill risk score in this paper is the oil spill quantity of different levels multiplied by the corresponding oil spill probability, and then the corresponding scores of each level of oil spill quantity are added to obtain the final score of oil spill risk of an accident type. Since the oil spills of different grades given in this paper are a range value and cannot be multiplied directly to calculate the risk score, this paper decides to take the middle value of the oil spill range of each grade for calculation.
Different types of offshore oil spill accidents also have different impacts on regions. Some regions even have no oil well platform or submarine pipeline. Therefore, before calculating the final risk score, three different types of offshore oil spill accidents are given different weights, α, for different regions. The purpose is to normalize the risk score in order to calculate the final score of regional oil spill risk. In order to add the risk scores of the three types of oil spill accidents, the weight α need a reference value. This paper takes the risk score of ship oil spill accident as the reference value of this paper, so the weight α of the risk score of ship oil spill accident in this paper is 1. For the value of the weight α of the risk score of other types of oil spill accidents, it is necessary to compare the impact of other types of oil spill accidents on the studied area with the impact of ship oil spill accidents on the studied area, and then determine the value of the weight according to the specific conditions of the studied area.
To sum up, the final score of regional oil spill risk is calculated as follows:
where oij represents the oil spill probability value corresponding to the oil spill amount level j of type i offshore oil spill accident. Furthermore, gij represents the type i offshore oil spill accident, and the level is j, which corresponds to the median value of the oil spill amount range. In addition, represents the weight value corresponding to type i offshore oil spill accident in the study area.
3.2.6. Sensitivity Analysis
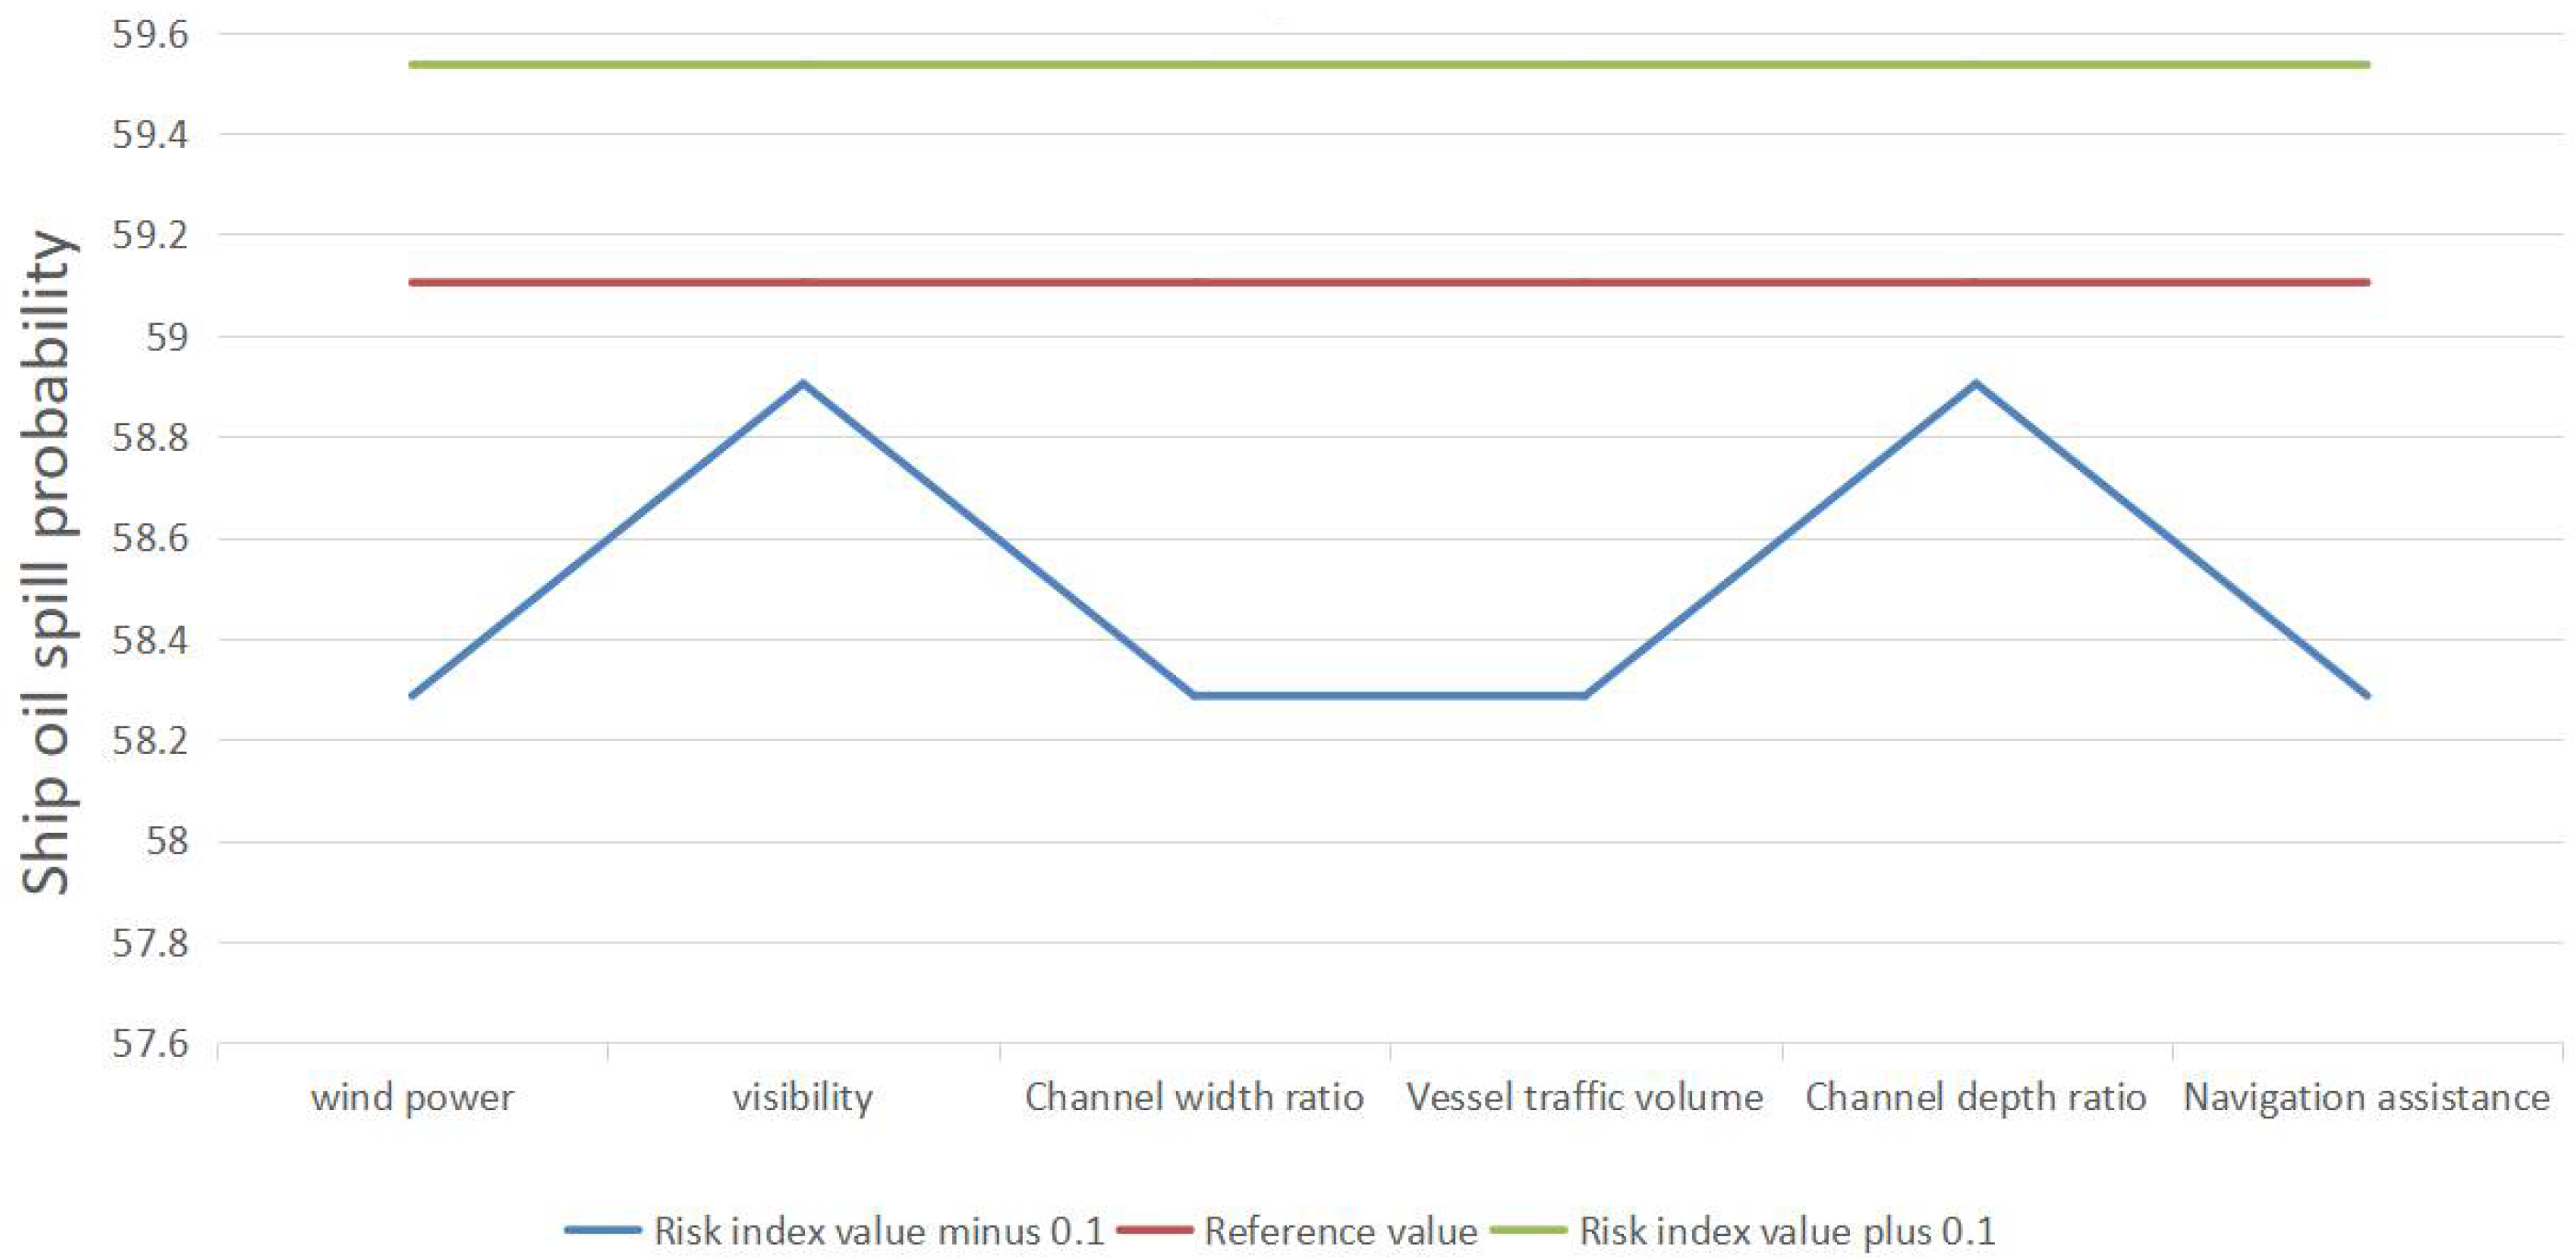
Finally, the sensitivity analysis method of fine adjustment of the input value is used to verify the effectiveness of the oil spill risk assessment model established in this paper. The objects of minor change adjustment in this paper are mainly the scores of various risk indicators. In order to verify the effectiveness of this method and its inference reasoning, the following axiom [36] must be met. And the sensitivity analysis diagram is shown in Figure 10.
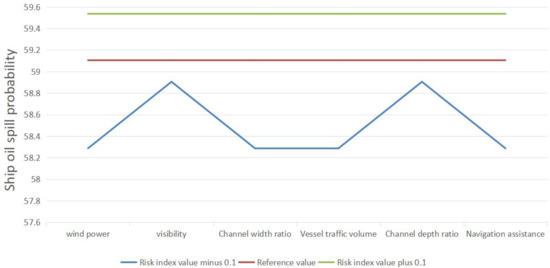
Figure 10.
Sensitivity analysis of ship oil spill probability.
Axiom 1. Slight decline in belief degrees associated with linguistic terms of risk parameters should result in a decrease in the risk estimates of the model output, correspondingly.
Axiom 2. Slight increment in belief degrees associated with linguistic terms of risk parameters should result in an increase in the risk estimates of the model output, correspondingly.
3.2.7. Result Verification
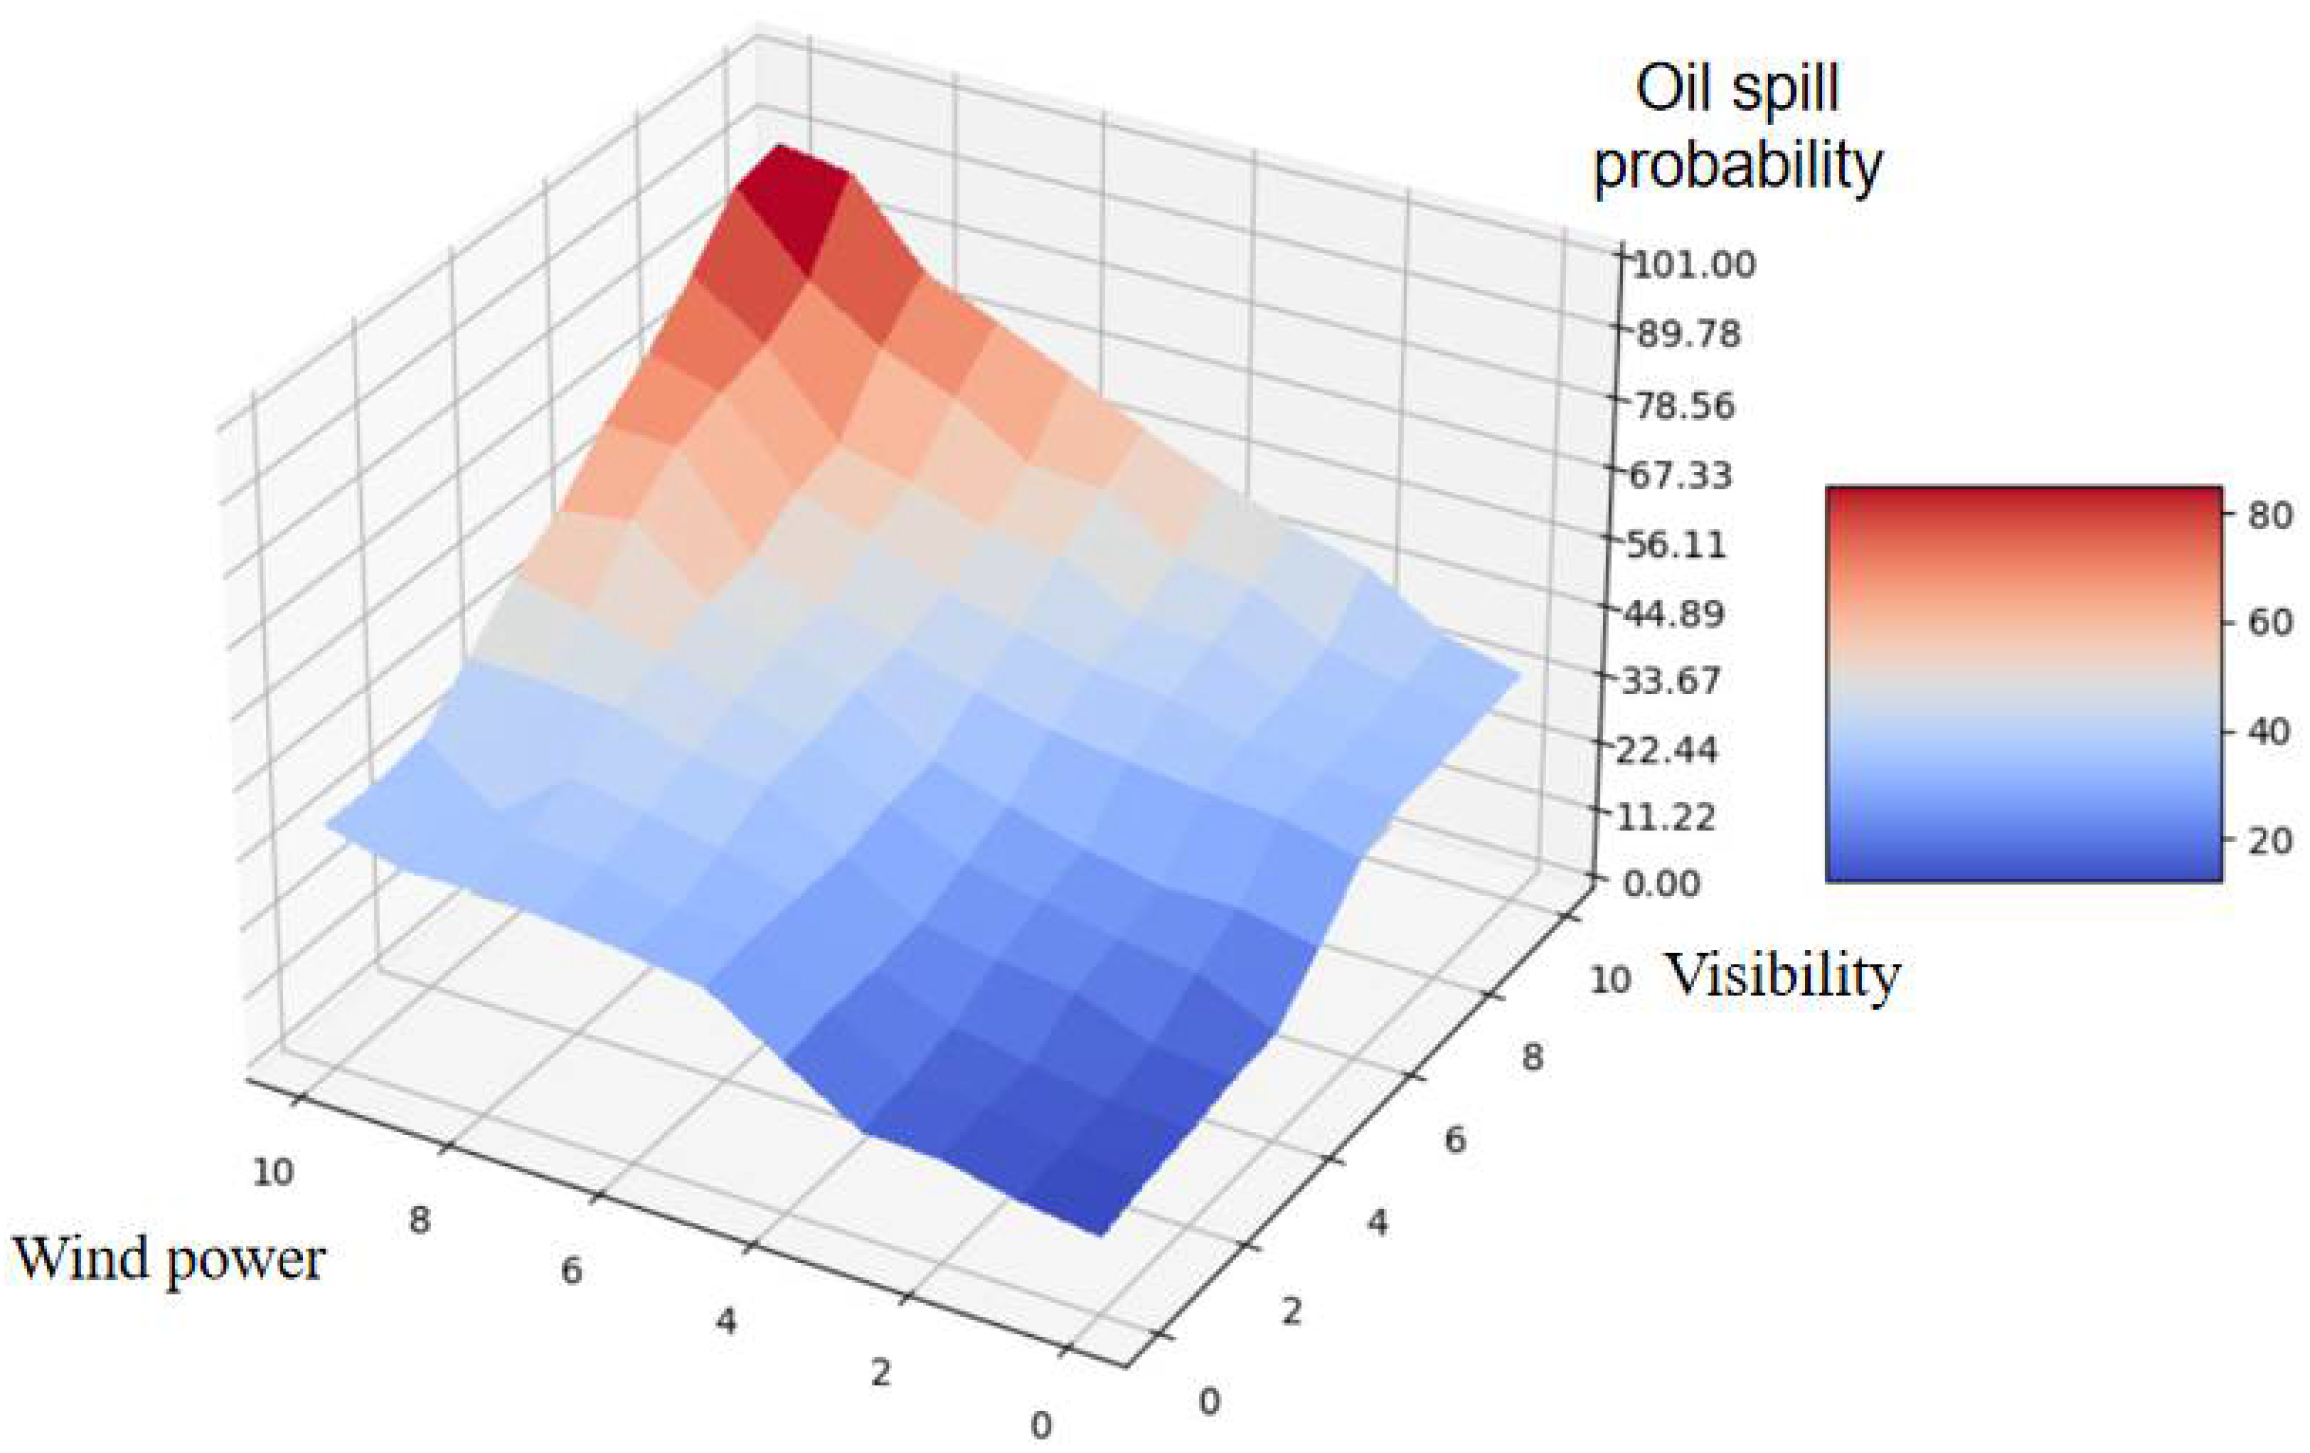
Firstly, a large number of scores of risk indicators are randomly generated in this paper, and then calculated through the risk assessment model in this paper. The scores of risk indicators randomly generated here cover all possible situations as much as possible. Through the inspection of a large amount of data, the three dimensional diagram of risk indicators and oil spill probability can be generated. Here, taking the risk indicators of ship oil spill accidents as an example, the three dimensional diagram is as follows. Due to space reasons, only the three dimensional diagram of wind index and visibility index is shown here (See Figure 11), and the diagrams of other risk indicators are the same as this diagram type.
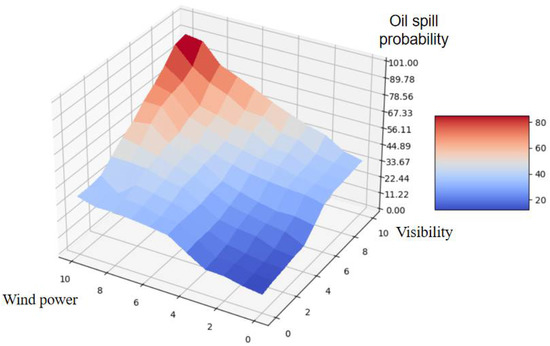
Figure 11.
Three dimensional diagram of wind index, visibility index and oil spill probability.
Where x axis is the risk level of wind index, y axis is the risk index of visibility index, and z axis is the probability value of oil spill. It can be seen from the figure that, when the risk index score is low, the probability of oil spill is relatively low. When the risk index score is high, the probability of oil spill will be very high. Additionally, it can be seen from the figure that, with the increase in the risk index score, the probability of oil spill is also increasing, which is in line with the actual situation.
Finally, through consultation with the industry expert group, the calculation results of this paper and the above three dimensional diagram are in line with the actual situation. Therefore, this paper believes that the risk assessment model established in this paper is feasible.
4. Case Study
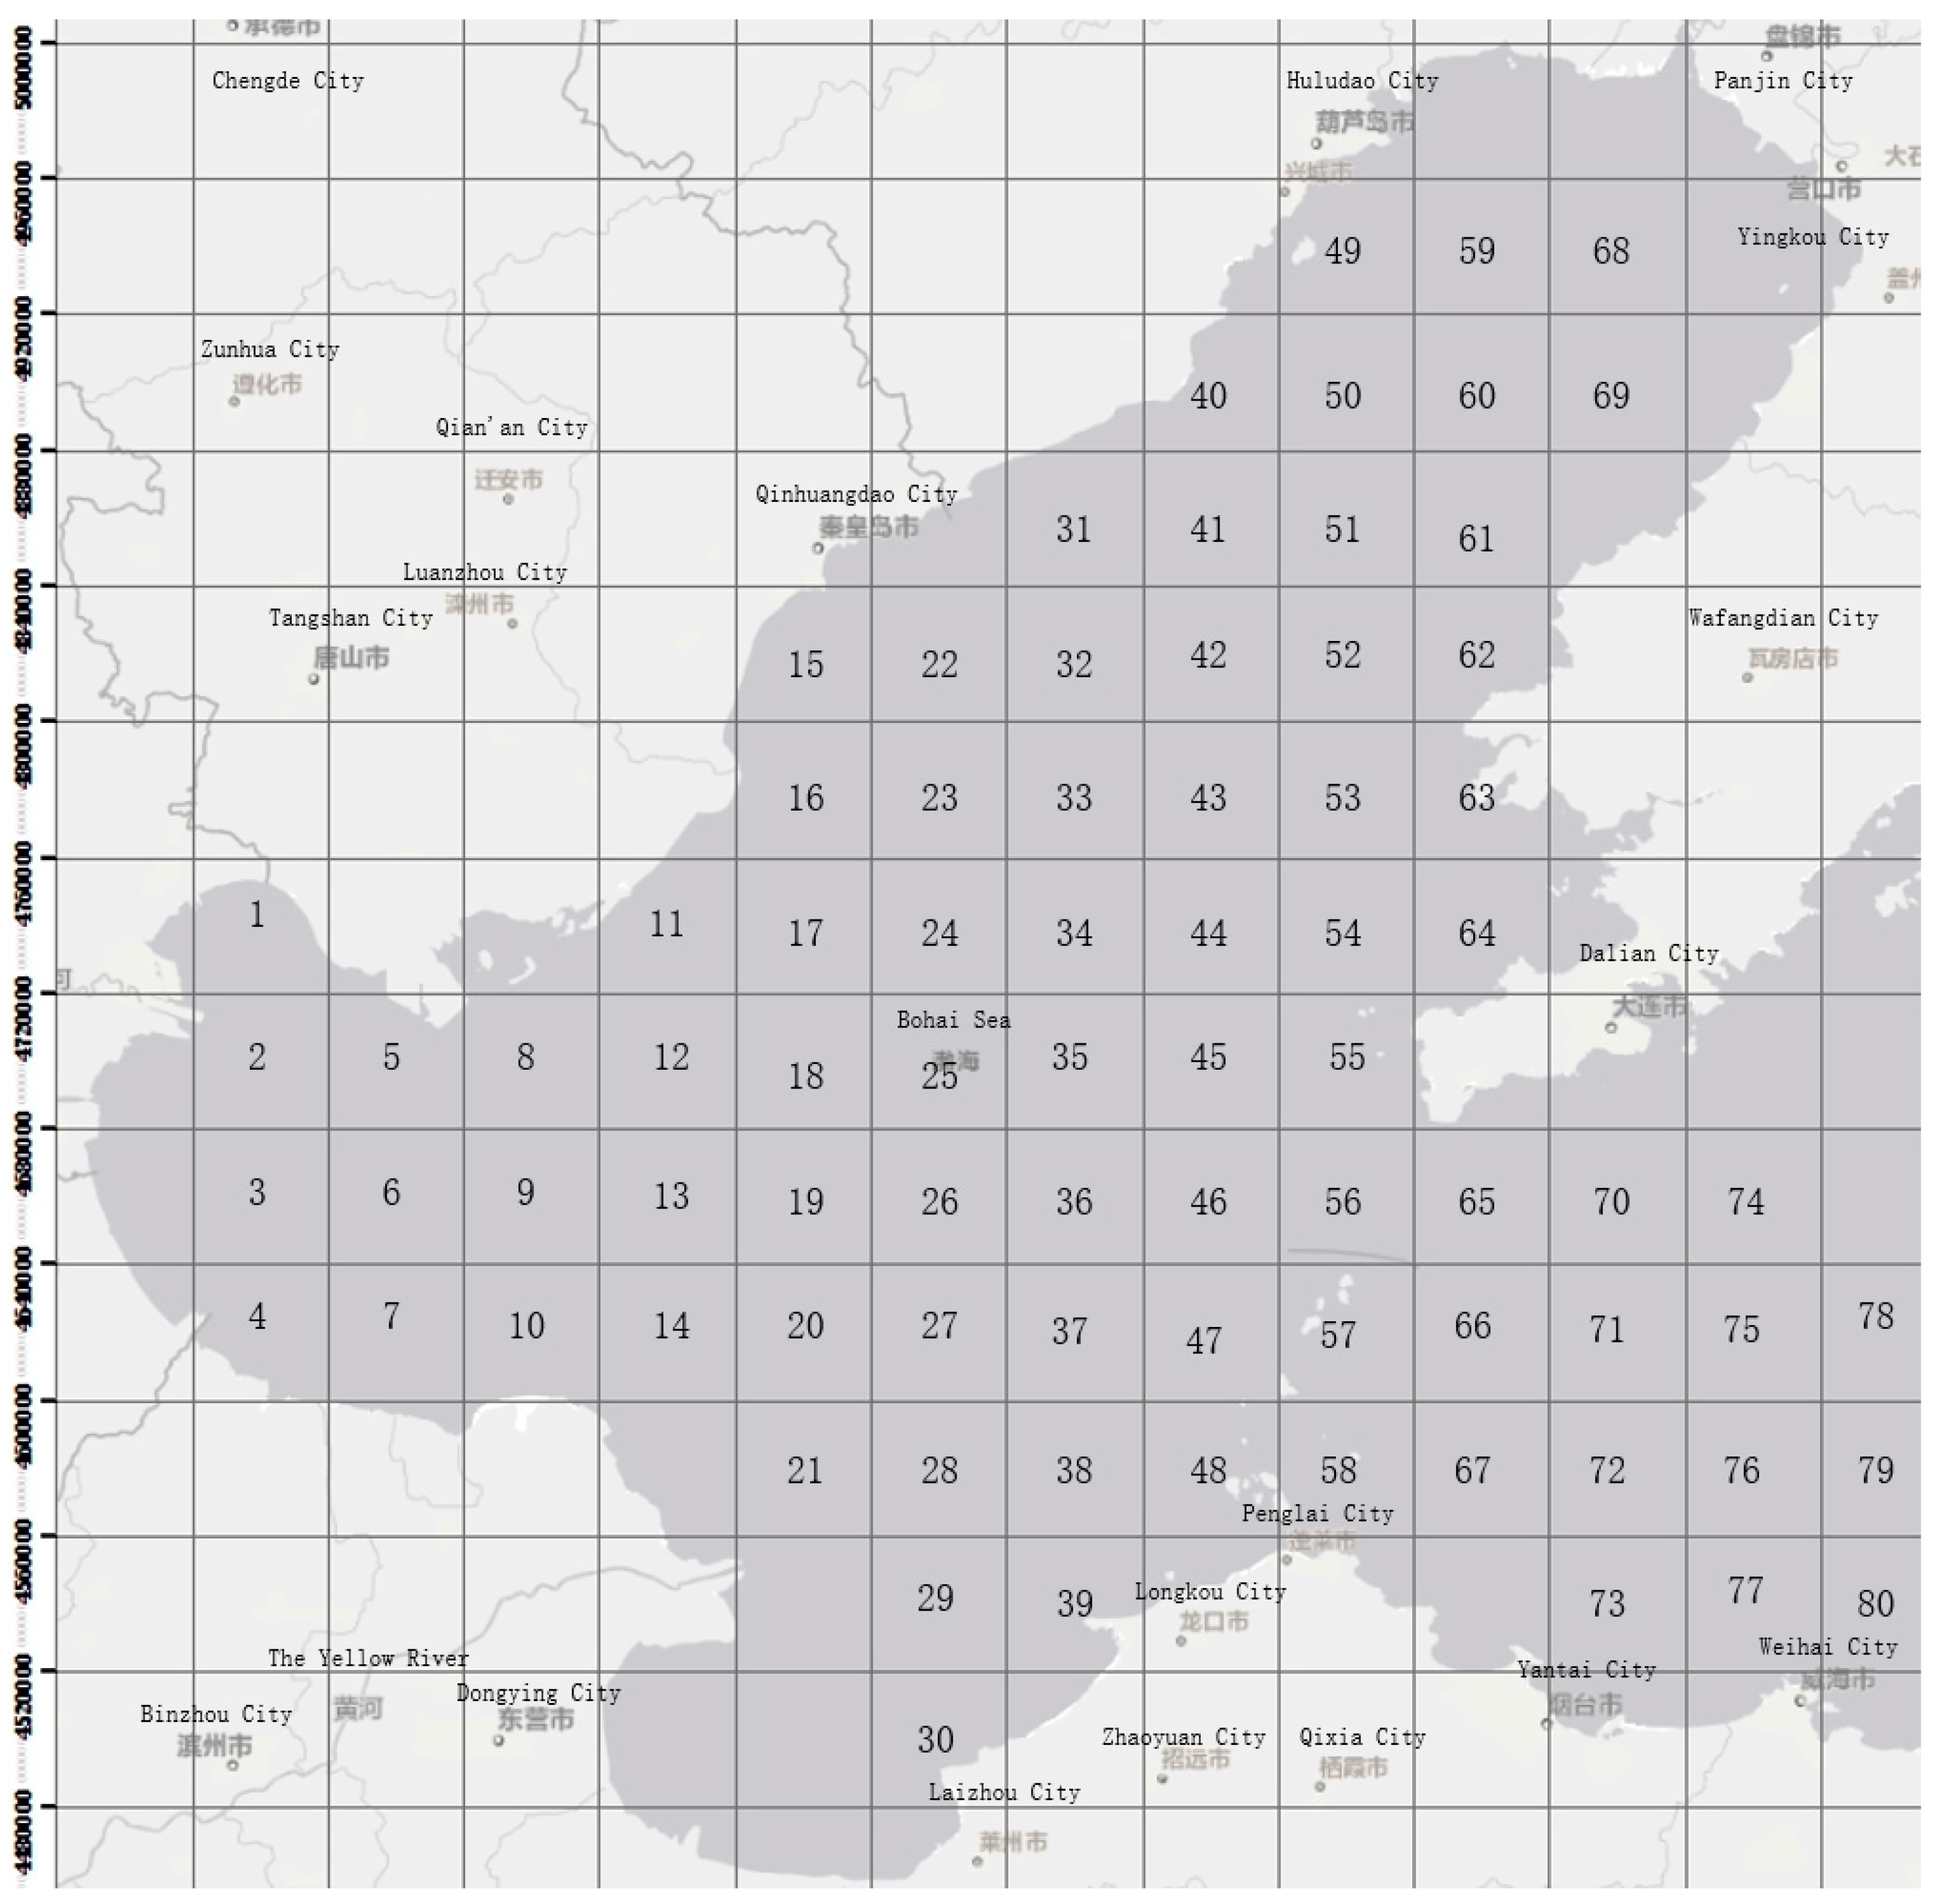
In the selection of the example area, the sea area covering three types or more of oil well platform, submarine pipeline and ship is mainly considered. This paper takes the Bohai Rim region as the overall regional scope of the study. The areas selected are numbered 32, 2 and 7, respectively.
Area 32 is the sea area near Qinhuangdao, covering oil well platforms, ships and pipelines. Due to the distance from the port area and coastline, the wind force is relatively large, the visibility is good, the ship density in the offshore sea area is relatively small, and there are relatively few navigation aids. There are a large number of oil well platforms in area 32. The overall oil production in this area is large. Submarine pipelines are arranged near the platform, and most of them are operated by the same oil company. The operation and maintenance of oil well platforms are basically the same.
Area 2 is the sea area near Tianjin, with a large number of ships entering and leaving the port, and the area is covered with ships and pipelines. This area is located in the west of the Bohai Sea, with large waves in the open sea in winter, and small wind, small waves and light fog in summer. The sea area near Tianjin port is a light silted port with a deep depth, channel width of 190 m and high ship traffic flow.
Area 7 is the sea area near Huanghua port, which contains ships, pipelines and platforms. The wind direction is mainly northerly in autumn and winter, mostly easterly in spring, and the wind direction of thunderstorms in summer is uncertain. There are many channels near Huanghua port. Taking the 200,000 ton channel as an example, the bottom elevation is 18.3 m and the bottom width is 250 m. Compared with the sea areas near Tianjin and Qinhuangdao, the ship traffic flow is relatively small. The area near area 7 covers oil drilling platforms and submarine oil pipelines. It is an early joint venture oil platform in China, with a full time emergency response team. The safety management level and civil and physical defense measures are relatively good. Due to the long operation life of some platforms, some equipment and facilities have entered the fatigue period.
To sum up, this paper selects area 32, area 2 and area 7 as the research object of this paper. The specific distribution of the three areas is shown in Figure 12, below.
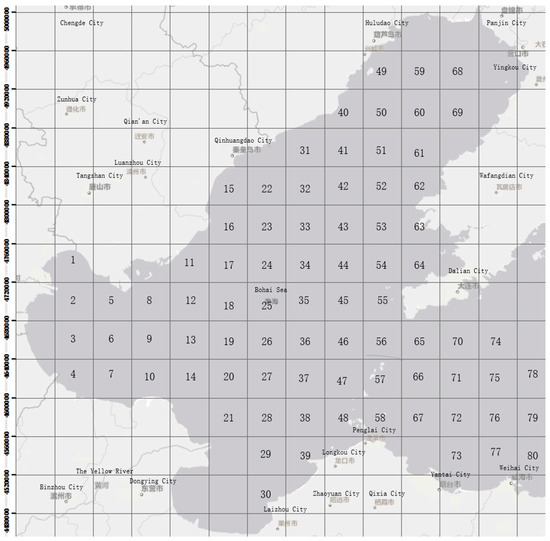
Figure 12.
Map of Bohai Rim region.
The scoring principles for these three regions are as follows. Firstly, this paper studies the risk level of regional oil spills, so this paper scores the region from a macro perspective. Secondly, according to the risk index system established in this paper, only the primary indicators are scored.
This paper uses the expert scoring method to score the risk indicators. The selected research area in this paper is the Bohai Sea area, so the members of the expert group are mainly researchers and workers in relevant fields. The specific composition of the members of the expert group is shown in Table 2, below.
Table 2.
Members of the expert group.
By consulting relevant literature and combining the scores of the expert group for the three regions, the corresponding scoring results of various types of oil spill accidents in the three regions are obtained as follows (Table 3, Table 4 and Table 5).
Table 3.
Coring of various risk indicators of ship oil spill accidents in three regions.
Table 4.
Scoring of various risk indicators of oil spill accidents of oil well platforms in three regions.
Table 5.
Scoring of various risk indicators of submarine pipelines in three regions.
After obtaining the scores of different types of risk indicators in each region, the membership function of each risk index is established. The membership function of each risk index in this paper is established on the basis of the discussion and analysis of the expert group. In view of the length of the article, only the membership function of the representative risk index in the three types of oil spill accident is shown here. The membership function of each risk index is shown in Figure 13, Figure 14, Figure 15, Figure 16 and Figure 17.
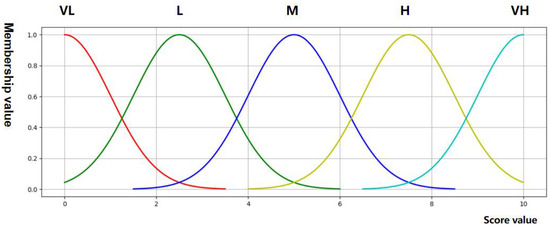
Figure 13.
Gaussian membership function of wind index.
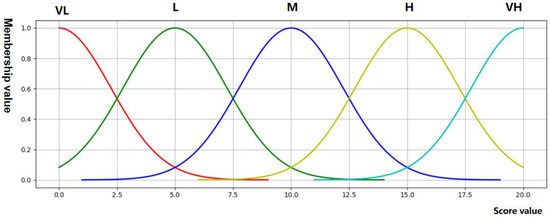
Figure 14.
Gaussian membership function of well control measures damage.
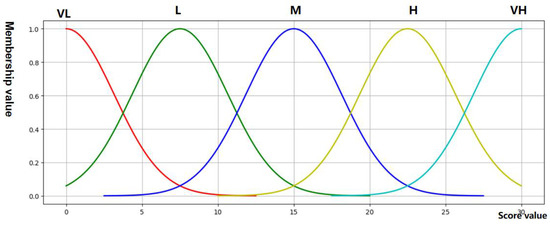
Figure 15.
Gaussian membership function of third party damage.
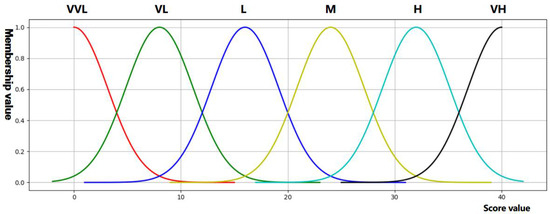
Figure 16.
Gaussian membership function of fatigue aging.
Figure 17.
Gaussian membership function of risk index of emergency capability of oil well platform.
Since the scoring ranges of the risk indicators of ship oil spill accidents are the same, the membership functions of the other five risk indicators are the same as those in Figure 13.
The above, Figure 13, Figure 14, Figure 15 and Figure 16, show the Gaussian membership function diagram of the representative risk indicators of oil well platforms and submarine pipelines. The Gaussian membership functions of the other risk indicators are the same as the above membership functions.
Based on the discussion and analysis of the expert group, the Gaussian membership function of the final result of the fuzzy rules is established. The specific calculation process is shown in Section 3.2.3. The Gaussian membership function of the final result of the fuzzy rules of the three types of oil spill accidents is shown in Figure 18, Figure 19 and Figure 20.

Figure 18.
Gaussian membership function of fuzzy rules for ship oil spill accidents.
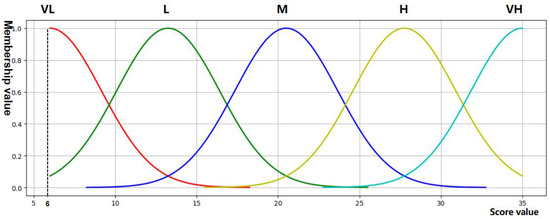
Figure 19.
Gaussian membership function of fuzzy rules for oil spill accident of oil well platform.
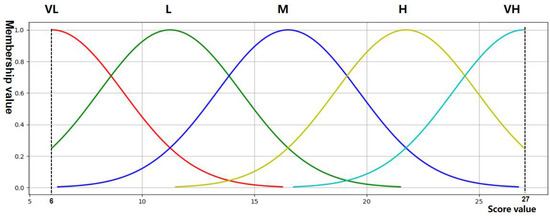
Figure 20.
Gaussian membership function of fuzzy rules for submarine pipeline oil spill.
Finally, the risk index score, risk index membership function and fuzzy rules obtained from the appeal are input into the fuzzy inference system for calculation, and the probabilities of the different levels of oil spill corresponding to the different types of oil spill accidents are obtained. The specific calculation results are shown in the tables below (Table 6, Table 7 and Table 8).
Table 6.
Fuzzy inference results of ship oil spill in three regions.
Table 7.
Fuzzy inference results of oil well platform oil spill in three regions.
Table 8.
Fuzzy inference results of submarine pipeline oil spill in three regions.
After that, the oil spill volumes of different grades and the corresponding oil spill probabilities are substituted into Formula (2), and, combined with the weight values corresponding to different oil spill accident types in Table 9, the final score value of the study area is calculated.
Table 9.
Weight α corresponding to three oil spill accidents in three regions.
It can be seen from Table 10 that: when only a single risk source is considered in the ship oil spill score, the risk value of an oil spill in area 2 is the highest; in the oil spill score of oil well platforms, the risk of an oil spill in area 7 is the highest; and in the oil spill score of submarine pipelines, the risk of an oil spill in area 7 is the highest. Among the ship oil spill scores, area 2 has the highest risk of an oil spill, because area 2 is located near Tianjin port, there are a large number of ships in and out; and the oil spill scores of oil well platforms and submarine pipelines in area 7 are high, because area 7 is relatively close to Huanghua Port, there are some oil well platforms and submarine oil pipelines, and some facilities are aging. To sum up, the oil spill risk score obtained by considering only a single risk source can only reflect the relatively singular situation of the region, and cannot accurately describe the overall oil spill risks of the studied region.
Table 10.
Final scoring results of oil spill risk in three regions.
For the final oil spill score, it can be seen that the risk of an oil spill in area 7 is higher than those in the other two areas. According to the description of area 7, there are a large number of oil well platforms and submarine pipelines in area 7. At the same time, due to the long operation life of some facilities and fatigue aging, it is in line with the reality that the risk of oil spill in area 7 is higher. Although there are a large number of oil well platforms and submarine pipelines in area 32, the risk of an oil spill is low because area 32 is far from the port area and coastline and the corresponding facilities are in good condition. Area 2 is close to Tianjin port, and the oil spill risk sources to be considered in area 2 are only ships and submarine pipelines. Therefore, the oil spill risk of area 2 is the lowest.
The results of the case study show that, when selecting and allocating emergency resources, we should focus on area 7, and the risk of oil spill in area 7 is significantly higher than that in the other two areas. Although area 32 is not at the highest risk, there are also a large number of submarine pipelines and other facilities of oil well platforms in area 32, so the risk of oil spill in area 32 is not low. Although region 2 has the lowest score among the three regions, the score of a ship oil spill in region 2 is the highest. Therefore, we should focus on the prevention and control of ship oil spill accidents in region 2.
5. Conclusions
When assessing the risk of oil spill in a region, it is inevitable to consider only a single source of oil spill risk, which cannot accurately reflect the risk of oil spill in the region. Therefore, from a macro perspective, this paper considers multiple risk sources at the same time, so as to evaluate the regional risk of an oil spill. This evaluation method is more comprehensive for the regional risk assessment of oil spills. On the basis of the comprehensive evaluation results, the overall allocation of emergency resources can save the overall emergency cost of the state and enterprises.
In this paper, different oil spill levels are divided according to different oil spill sources, and different oil spill probabilities corresponding to different oil spill levels are calculated by a fuzzy inference system. Through this probability value, we can have a further understanding of the severity of regional oil spill accidents. On this basis, the allocation of emergency resources can be further optimized to avoid the unnecessary waste of resources.
The limitations of the oil spill risk assessment model proposed in this paper are as follows. This paper mainly starts from the perspective of multiple risk sources in the whole study area, so the subjectivity of scoring various risk indicators is stronger. Compared with the complete quantitative risk assessment model, the results obtained from the oil spill risk assessment model in this paper are subjective.
Due to the large number of fuzzy rules established in this paper, the expert group cannot analyze each fuzzy rule one by one. Therefore, the processing method of fuzzy rules in this paper may lead to slight errors in the results.
Author Contributions
Conceptualization, Y.J.; methodology, Y.J.; investigation, Y.W.; data curation, J.W.; writing—original draft preparation, Y.J.; writing—review and editing, Y.J. and X.Z.; project administration, X.Z.; data collecting and analysing, Y.W. and J.W. All authors have read and agreed to the published version of the manuscript.
Funding
This research was funded by [the National Social Science Fund Emergency Management System Construction Research Project] grant number [20VYJ024], and was funded by [the National Social Science Fund] grant number [18VHQ005].
Institutional Review Board Statement
Not applicable.
Informed Consent Statement
Not applicable.
Data Availability Statement
Not applicable.
Conflicts of Interest
The authors declare no conflict of interest.
References
- Liu, X.J.; Wang, Q.; Li, Z.M.; Zhang, K. Material dispatch in marine oil spill emergency. Navig. China 2020, 43, 105–109+140. [Google Scholar]
- Allo, M.; Loureiro, M.L. Estimating a meta-damage regression model for large accidental oil spills. Ecol. Econ. 2013, 86, 167–175. [Google Scholar] [CrossRef]
- Nikolopoulou, M.; Kalogerakis, N. Biostimulation strategies for fresh and chronically polluted marine environments with petroleum hydrocarbons. J. Chem. Technol. Biotechnol. 2009, 84, 802–807. [Google Scholar] [CrossRef]
- Cui, H. Study on environmental hazards of oil spill in offshore oil exploration. Chem. Eng. Equip. 2020, 7, 234–235. [Google Scholar]
- de Melo, A.P.Z.; Hoff, R.B.; Molognoni, L.; Kleemann, C.R.; de Oliveira, T.; de Oliveira, L.V.A.; Daguer, H.; Barreto, P.L.M. Determination of polycyclic aromatic hydrocarbons in seafood by PLE-LC-APCI-MS/MS and preliminary risk assessment of the Northeast Brazil oil spill. Food Anal. Methods, 2022; prepublish. [Google Scholar] [CrossRef]
- Amir-Heidari, P.; Arneborg, L.; Lindgren, J.F.; Lindhe, A.; Rosen, L.; Raie, M.; Axell, L.; Hassellov, I.M. A state-of-the-art model for spatial and stochastic oil spill risk assessment: A case study of oil spill from a shipwreck. Environ. Int. 2019, 126, 309–320. [Google Scholar] [CrossRef]
- Wu, R.J. Study on risk assessment method of ship oil spill. Ship Sci. Technol. 2017, 39, 166–168. [Google Scholar]
- Chen, J.H.; Zhang, W.P.; Li, S.F.; Zhang, F.W.; Zhu, Y.H.; Huang, X.L. Identifying critical factors of oil spill in the tanker shipping industry worldwide. Clean. Prod. 2017, 180, 1–10. [Google Scholar] [CrossRef]
- Zhang, J.L.; Liang, X.; Li, W. Numerical simulation of ship oil spill under ocean environment. In Proceedings of the 2nd International Conference on Frontiers of Manufacturing and Design Science (ICFMD 2011), Taichung, Taiwan, 11–13 December 2011. [Google Scholar]
- Wu, B.; Zhang, J.H.; Yip, T.L.; Soares, C.G. A quantitative decision-making model for emergency response to oil spill from ships. Marit. Policy Manag. 2020, 48, 299–315. [Google Scholar] [CrossRef]
- Khan, R.U.; Yin, J.B.; Mustafa, F.S.; Anning, N. Risk assessment for berthing of hazardous cargo vessels using Bayesian networks. Ocean Coast. Manag. 2021, 210, 105673. [Google Scholar] [CrossRef]
- Kamal, B.; Kutay, S. Assessment of causal mechanism of ship bunkering oil pollution. Ocean Coast. Manag. 2021, 215, 105939. [Google Scholar] [CrossRef]
- Polinov, S.; Bookman, R.; Levin, N. Spatial and temporal assessment of oil spills in the Mediterranean Sea. Mar. Pollut. Bull. 2021, 167, 112338. [Google Scholar] [CrossRef] [PubMed]
- de Aguiar, V.; Dagestad, K.F.; Hole, L.R.; Barthel, K. Quantitative assessment of two oil-in-ice surface drift algorithms. Mar. Pollut. Bull. 2022, 175, 113393. [Google Scholar] [CrossRef]
- Chen, H.; Lu, S.Q.; Shao, Y.P.; Wang, B.; Liu, Y. Study on oil spill risk zoning in the Yangtze River Estuary based on the visited probability method of sensitive targets. J. Environ. Eng. Technol. 2022, 1–10. [Google Scholar] [CrossRef]
- Tian, R.J.; Cheng, J.X.; Xu, H.L.; Mao, N. The risk assessment method of inland river oil spill based on division of river segment. Ship Ocean Eng. 2020, 49, 68–71+79. [Google Scholar] [CrossRef]
- Huang, Z.G. Identification and assessment of oil spill pollution risk in Zhuqi Water Source of Minjiang river basin. Water Resour. Hydropower Eng. 2021, 52, 143–150. [Google Scholar]
- Rajendran, S.; Aboobacker, V.M.; Seegobin, V.O.; AlKhayat, J.A.; RangelBuitrago, N.; Al-Kuwari, H.A.S.; Sadooni, F.N.; Vethamony, P. History of a disaster: A baseline assessment of the Wakashio oil spill on the coast of Mauritius, Indian Ocean. Mar. Pollut. Bull. 2022, 175, 113330. [Google Scholar] [CrossRef]
- Kong, J. Study on Ship’s Accidental Oil Spill Risk of Dalian Port Based on Bayesian Network; Dalian Maritime University: Dalian, China, 2019. [Google Scholar]
- Zhang, S.Y. Research of Risk Zoing for Ship Oil Spill Based on Bayesian Network; Dalian Maritime University: Dalian, China, 2017. [Google Scholar]
- Pan, Y.Y.; Li, Z.H.; Wei, Y.Y.; Lu, H.Q. Risk assessment on oil spill of large oil tanker in the waters of Cape of Good Hope in Africa. Oil Gas Storage Transp. 2021, 40, 404–410. [Google Scholar]
- Liu, X.; Meng, R.L.; Xing, Q.G.; Lou, M.J.; Chao, H.; Bing, L. Assessing oil spill risk in the Chinese Bohai Sea: A case study for both ship and platform related oil spills. Ocean Coast. Manag. 2015, 108, 140–146. [Google Scholar] [CrossRef]
- Liu, B.Z.; Wei, W.P.; Duan, M.L.; An, W.; Jin, W.W. Oil spill risk assessment of offshore platform in Bohai Sea. Mar. Environ. Sci. 2017, 36, 15–20. [Google Scholar]
- Xu, L.C.; Yang, H.; Wang, C.F. Study on oil spill risk assessment of oil production platforms in the East China Sea. Mar. Environ. Sci. 2020, 39, 260–267. [Google Scholar]
- Zhang, K.; Liu, X.J. Evaluation on oil spill pollution level of offshore oil platform based on improved AHP and extension theory. J. Shanghai Marit. Univ. 2018, 39, 98–103. [Google Scholar]
- Liu, B.Z.; Jin, W.W.; An, W.; Zhao, J.P. Oil Spill Risk Assessment for blowout of deepwater drilling platform based on fuzzy bow-tie model. Ship Ocean Eng. 2020, 49, 1–5. [Google Scholar]
- Yin, W.H.; Qu, Z.; Li, Y.R.; Liu, Y.Y.; Wen, T.T. Risk evaluating of oil spill pollution in submarine pipelines based on fuzzy comprehensive evaluation. Ship Ocean Eng. 2020, 49, 84–88. [Google Scholar]
- Subagyo, E.; Kholil, K.; Ramli, S. Risk assessment using bowtie analysis: A case study at gas exploration industry PT XYZ Gresik East Java Indonesia. Process Saf. Prog. 2020, 40, e12190. [Google Scholar] [CrossRef]
- Jiang, M.R.; Yu, J.X.; Li, Z.G.; Zhong, W.J.; Wu, Z.H.; Yu, Y. Laboratory investigation into the oil diffusion from submarine pipeline under water flow. Acta Oceanol. Sin. 2018, 37, 96–103. [Google Scholar] [CrossRef]
- Zadeh, L.A. Fuzzy sets. Inf. Control. 1965, 8, 338–353. [Google Scholar] [CrossRef] [Green Version]
- Mamdani, E.H.; Assilian, S. An Experiment in Linguistic Synthesis with a Fuzzy Logic Controller. Int. J. Hum.-Comput. Stud. 1999, 51, 135–147. [Google Scholar] [CrossRef]
- Jamshidi, A.; Yazdani-Chamzini, A.; Yakhchali, S.H.; Khaleghi, S. Developing a new fuzzy inference system for pipeline risk assessment. J. Loss Prev. Process Ind. 2013, 26, 197–208. [Google Scholar] [CrossRef]
- Ghasemi, E.; Ataei, M. Application of fuzzy logic for predicting roof fall rate in coal mines. Neural Comput. Appl. 2013, 22, 311–321. [Google Scholar] [CrossRef]
- Yang, Y.; Lv, Y.; Wei, W.P. Risk Assessment of Submarine Pipeline Oil Spill; Harbin Institute Of Technology Press: Harbin, China, 2016. [Google Scholar]
- Adam, S.; Markowski, M.; Mannan, S. Fuzzy risk matrix. J. Hazard. Mater. 2008, 159, 152–157. [Google Scholar]
- Yang, Z.; Wang, J.; Bonsall, S.; Fang, Q.G. Use of fuzzy evidential reasoning in maritime security assessment. Risk Anal. 2009, 29, 95–120. [Google Scholar] [CrossRef] [PubMed]

Publisher’s Note: MDPI stays neutral with regard to jurisdictional claims in published maps and institutional affiliations. |
© 2022 by the authors. Licensee MDPI, Basel, Switzerland. This article is an open access article distributed under the terms and conditions of the Creative Commons Attribution (CC BY) license (https://creativecommons.org/licenses/by/4.0/).