Abstract
A series of systematic changes have occurred in the areas of growth rate, economic structure, and growth engine in China’s economic “new normal” stage. This study aims to evaluate how these systematic changes affect the slowdown in China’s energy consumption growth at both national and regional levels. We propose a nested index decomposition analysis (NIDA) model to uncover both the production- and demand-side factors. Development patterns are also defined in terms of energy consumption deceleration. Results show that the national energy consumption deceleration is mainly attributed to economic slowdown rather than improvements in economic structure (including energy mix, industrial structure, regional structure, and demand structure) and energy efficiency, implying that China’s current development pattern is unsustainable because the energy consumption deceleration is gained mainly at the expense of economic expansion. From a regional perspective, the developed regions are on an unsustainable path toward energy consumption deceleration because of relatively limited potential for structural updates and efficiency gains; while most of the less developed regions are on sustainable or unbalanced development paths. Policy recommendations are provided for both national and regional energy consumption deceleration.
1. Introduction
China’s economy slowed down in 2012 after decades of rapid growth, with a significant decline in average annual growth rate (AAGR), from 10.5% between 2000 and 2011 to 7.1% between 2012 and 2019 [1]. At the same time, China’s total energy consumption growth suffered a deceleration, from 9.3% (2000–2011) to 2.9% (2012–2019) [1]. This may be closely related to the fact that China entered the economic “new normal” stage in 2012 [2,3]. A series of systematic changes occurred or are expected to occur in China’s “new normal” stage. That is, the economy shifted toward medium-speed growth (e.g., 7.1% annually in 2012–2019) from high-speed growth (e.g., 10.5% annually in 2000–2011); economic development was gradually driven by technical innovation instead of factor inputs (especially capital formation, e.g., a rising trend of investment share in 2000–2011, and a declining trend of investment share in 2012–2019), and the economic structure was continuously optimized and upgraded (e.g., from a secondary industry-dominated economic structure in 2000–2011 to a tertiary industry-dominated economic structure in 2012–2019) [3,4,5]. These systematic changes in the “new normal” stage might play important roles in the slowdown in China’s energy consumption growth because they are linked to drivers of energy consumption growth, e.g., economic growth, structural changes (e.g., energy mix, industrial structure, and demand structure (among final uses)), and efficiency gains. The Chinese regional economies also experienced systematic changes in the “new normal” stage, which might be responsible for the changing patterns in regional energy consumption. Therefore, it is important to find out how the systematic changes in China’s “new normal” stage affect the slowdown in energy consumption growth, especially across regions. If the energy consumption deceleration is driven by improvements in structural factors and energy efficiency more than the slowdown in economic growth, China seems to be on a path toward sustainable development in terms of energy mitigation and emissions reduction, which is of great importance in the context of China’s ambitious goals of reaching a carbon peak by 2030 and becoming carbon neutral by 2060.
There is an extensive body of literature on the driver analysis of China’s energy consumption/carbon emissions growth [2,6,7,8,9,10,11,12,13], while few studies have elaborated on energy consumption deceleration at the “new normal” stage. Studies related to this paper were provided by Mi et al., who found that there was a pattern shift in determining energy consumption growth in the new economic stage [14,15]. Using the structural decomposition analysis (SDA) method based on the environmental input–output (IO) model, Mi et al. found that the strongest factors that offset carbon emissions and energy consumption have shifted from efficiency gains to structural changes (including production structure and demand structure) at the “new normal” stage in China. A very closely related study was provided by Zheng et al. and directly focused on the slowdown of carbon emissions growth in China at the “new normal” stage from 2012 to 2017 [16]. Using the SDA method, they found that energy efficiency gains, economic slowdown, and changes in demand structure were the main causes of the deceleration of China’s emissions growth at the “new normal” stage. However, the systematic changes in the “new normal” stage discussed above are not completely analyzed in either single study. For example, the above studies only considered production structure (or industrial structure) and demand structure, and the energy mix and regional structure were not considered. In the SDA method, energy mix can be explored, while the regional structure is very difficult to identify, because the multi-regional IO tables are very limited in China. There were multi-regional IO tables, but they were not released annually, which might mean a loss of information for intermediate years. From the above discussion, we attempt to use the index decomposition analysis (IDA) method to analyze the energy consumption deceleration in China’s economic “new normal” stage. The IDA method makes it easy to identify drivers like energy mix, industrial structure, regional structure, energy intensity, and economic growth. However, it is difficult to obtain the demand structure because the IDA model is built on the production side of an economy [17,18,19]. Nevertheless, inspired by the multilevel-hierarchical (MH) model introduced by Xu and Ang [20], we find a solution to identify the demand structure in the IDA model in a nested way.
The objective of this study is to explore how the systematic changes appearing in the “new normal” stage in China affect the energy consumption deceleration. This study contributes to the literature threefold. (1) We propose a nested index decomposition analysis (NIDA) model to account for both production-side and demand-side factors, which is the first time that this has been tried, to the best of our knowledge. Overall, seven socioeconomic drivers are decomposed by the NIDA model, including four regional drivers (i.e., energy mix, energy intensity, industrial structure, and regional structure) and three national drivers (demand structure, per capita GDP, and population). (2) We use the NIDA model to explore the drivers of China’s energy consumption deceleration with newly updated modification data by the National Bureau of Statistics of China (NBSC). We conduct a comparative analysis of the drivers of the deceleration of China’s energy consumption growth between the old growth model stage and the “new normal” stage. This comparative analysis helps to identify potential drivers of China’s further energy consumption deceleration in the “new normal” stage. (3) We define development patterns in terms of energy consumption deceleration. National and regional development patterns are explored, which helps to provide heterogeneous and targeted policy recommendations for further energy consumption deceleration.
The remaining sections are organized as follows: Section 2 provides a brief literature review on IDA method studies and elaborates on the idea of NIDA. Section 3 introduces the methodology of the NIDA model with demand structure. Data sources are also described in this section. Section 4 provides and discusses the decomposition results of China’s energy consumption growth, with a focus on the deceleration of energy consumption growth. Section 5 concludes.
2. A Brief Literature Review on IDA Method Studies and the Idea behind the NIDA
IDA, essentially rooted in the index number theory, has been well built and widely adopted to quantify the contributions of different drivers to changes in energy and environmental indicators over time [21]. Among different IDA methods, the logarithmic mean Divisia index (LMDI) methods, including LMDI I and LMDI II [22,23], are two ideal decomposition methods, with no residual terms. Moreover, the LMDI I method is considered to be the most preferred method [24]. This is owing to the method’s numerous outstanding attributions, e.g., consistency-in-aggregation and ease of implementation, especially with multiple drivers [24]. However, in the past, the LMDI (I and II) methods might have suffered zero-value and negative-value problems, due to their logarithmic terms [25]. Fortunately, those problems have been well resolved in [26,27,28,29].
Besides the refinement in methodology, IDA has also witnessed many developments in its identities which could fall into two categories. The first category includes such IDA models that can be directly built into one identity. Most existing IDA models and some special extensions belong to this category, e.g., multi-dimension models [30,31], multiple stages in the whole process treatment [32], models with multiple levels that can be constructed in parallel [33,34,35], ad hoc models with a focus on drivers of interest [36,37,38], and models combined with production–theoretical decomposition analysis (PDA) [39,40,41,42,43,44,45]. An outstanding feature of these IDA models is that they share only one weight function, no matter how many factors are decomposed. The second category of IDA models cannot be directly constructed into only one identity. As far as we know, this category includes the multilevel-hierarchical IDA (MH-IDA) model [20] and the multi-level scenario IDA model [46] that could be regarded as an extension of the MH-IDA model. Both the MH-IDA model and the multi-level scenario IDA model are constructed in more than one separate identity because they have more than one weight function.
The existing IDA models, to the best of our knowledge, have not taken into consideration the demand structure among different final uses. This is because the IDA models are constructed from the production side of an economy [17,18,19]. Thus, they cannot directly describe energy consumption behaviors pertaining to different final uses. That is to say, (i) the energy consumption data constructed from the demand side are not readily available in practice; (ii) in theory, energy is essentially an intermediate input. However, we find that the demand structure can be indirectly captured by the IDA model following the method in the MH-IDA model.
In the MH-IDA model with two-level data proposed in Xu and Ang [20], the aggregate energy consumption change is decomposed step-by-step, corresponding to the levels of data. In the first step, the aggregate energy consumption change is decomposed into the economic activity effect, first-level industrial structure effect, and first-level energy intensity effect, using the first level of data. In the second step, the first-level energy intensity effect is further decomposed into the sub-structure effect (or second-level industrial structure effect) and sub-intensity effect (or second-level energy intensity effect), using the second level of data. Note that the first-level effects and the second-level effects are weighted by respective weight functions. To produce a complete IDA decomposition, the second-level effects need to be “nested” into the first-level energy intensity effect. In other words, the second-level effects must be weighted again using the first-level weight function to describe themselves in the complete IDA decomposition.
The MH-IDA model demonstrates that one effect (e.g., the energy intensity effect) in the main IDA identity (the first-level IDA identity) can be further decomposed into sub-effects if the data are constructed with finer levels. However, in a broad sense, the MH-IDA model provides the possibility to integrate the subordinate identity into the main IDA identity. In this study, the way in which the subordinate IDA identity is combined into the main IDA identity is referred to as the nested approach (NA). Thus, the IDA model that uses NA is referred to as the nested IDA (NIDA) model.
3. Methodology and Data
3.1. A NIDA Model with Demand Structure
The total energy consumption () with dimensions of region and industry can be in general formulated as follows [2,31]:
where , , and denote regions, industries, and fuel types respectively; and are the national GDP and population, respectively. Equation (1) shows that the total energy consumption can be represented by six factors, as follows:
- (1)
- Variable is the share of fuel type in sector and region , measuring the energy mix effect due to different qualities of fuel types;
- (2)
- Variable is the energy intensity of sector in region , measuring the energy efficiency effect or technical change effect;
- (3)
- Variable is the share of sector in region ’s GDP, measuring the regional industrial structure effect;
- (4)
- Variable is the share of region in total GDP, representing the regional structure effect. Du to different dependence on energy consumption for regional economic development, a shift in regional share to total GDP caused by unbalanced regional economic growth affects the growth of total energy consumption;
- (5)
- Variable is the per capita GDP, measuring the economic growth effect;
- (6)
- Variable is population, measuring the population growth effect on total energy consumption growth.
As Equation (1) shows, the demand structure, measured by shares of different final uses to GDP, is absent because the IDA model is formulated from the production side of an economy and only captures the direct effects concerning production [17]. However, inspired by the MH-IDA model [20], the demand structure can be indirectly captured through further decomposing one of the factors in Equation (1). The factor chosen depends on the availability of final use data. In theory, the concerning output indicators in Equation (1), i.e., total GDP (), regional GDP (), and sectoral value-added production at the regional level (), can be accounted for by the expenditure approach. In practice, the data of the expenditure-based total GDP and regional GDP are released annually in China, while the data of expenditure-based sectoral value-added production at the regional level are less regularly released. In this regard, we re-formulate the regional structure () in Equation (1), in order to isolate the (national) demand structure as follows:
where denotes types of final use, i.e., consumption, investment, and net exports; denotes the expenditure of final use type in region ; denotes the total national expenditure of final use type . To understand how a national factor affects a regional factor, one can follow the idea in the shift–share analysis [47,48]. In the shift–share analysis, the regional economic growth is commonly composed of three factors: the national growth effect, the industrial mix effect, and the competitive effect. Here, the national growth effect for the regional growth is similar to the national demand structure for the common regional structure. Thus, by combining Equations (1) and (2), the complete decomposition of total energy consumption can be formulated as follows:
where the brackets “()” in Equation (3) mean that factors in them are not able to be captured directly unless in the “nested” way. Thus, Equation (3) is called a nested IDA (NIDA) model. Equation (3) shows that the common regional structure effect in Equation (1) is a product of two sub-effects that are defined as follows:
- (7)
- Variable is the share of regional expenditure to total national expenditure in terms of final use type , representing the regional structure effect in terms of final uses. Note that final uses induce energy consumption and different final uses induce different energy consumption [15,49]. In this regard, changes in regional final uses have a structural effect on energy consumption growth;
- (8)
- Variable is the share of final use ’s expenditure to total national expenditure, measuring the demand structure effect. In this study, we do not distinguish between the induced (embodied) energy consumption of exports and imports. In other words, we assume that the imports of goods and services act as the exports of goods and services to induce energy consumption. Besides, we use the net exports to calculate the demand structure following the expenditure–approach GDP, which is different from those SDA studies using exports as the final uses.
We apply the LMDI I method to calculate the changes in factors in Equation (3) due to the method’s above-mentioned attributions. Moreover, the multiplicative LMDI I method rather than the additive LMDI I method is used in this study, because it is directly feasible without any transformations [20]. Thus, the index changes in total energy consumption from period to any period can be calculated by the product of index changes in each factor as follows:
where and indicate different logarithmic mean weight functions which are given by:
In Equation (4), the symbol denotes the multiplicative effect using the multiplicative LMDI method. Each factor on the right-hand side represents its effect on energy consumption growth, with other factors remain constant. It should be noted that there are two different weight functions in the regional structure effect () and the demand structure effect () that describe how the regional structure and demand structure are nested to exert effects on total energy consumption growth. The weight function in Equation (6) is used to weight changes in the regional structure (in terms of final uses) () and the demand structure (), to show their respective effects on the common regional structure (). Then, the weight function in Equation (5) is used to weight the above-calculated effects and show their indirect effects on total energy consumption growth, i.e., and , respectively.
Note that Equation (3) can be re-written as follows:
The first equation in Equation (7) indicates that the total national energy consumption can be divided into the energy consumption of multiple regions. The regional energy consumption () is affected by those factors in the squared brackets in Equation (7). Clearly, each regional effect is a product of seven factors’ effects and all regional effects sum up to the total energy consumption change. It is worth noting that the regional effect is not only affected by regional factors (, , , and ) but also by national factors (, , and ). For the latter case, we take the national population effect as an example. On the one hand, methodologically, the national population effect is a sum of the regional population effect, which is calculated by the national population growth multiplying a region-specific weight; see Equations (4) and (5). In this regard, the regional population effect can be seen as an effect that assumes that all regions’ populations grow at the national rate. On the other hand, we can understand how the national population growth affects regional energy consumption following a shift–share analysis on the regional economic growth, as we discussed above. Moreover, for any region, the regional structure decreases to the regional share of this region, which reflects the relative economic expansion among regional economies. In other words, when investigating the regional effect, both and reflect the economic growth effects on total energy consumption growth. This interpretation helps us to conduct the regional analysis below.
As observed, the NIDA model is very close to the MH-IDA model. The minor difference between them is that the further decomposition of the common regional structure (Equation (2)) is not dependent on the energy data hierarchy, while the MH-IDA model depends on the finer energy data hierarchy. As we have discussed, the NIDA model can be seen as a generalized case of the MH-IDA model.
3.2. Data
The decomposition analysis on the growth and deceleration of China’s energy consumption is conducted among thirty Chinese province-level regions (excluding Tibet, Taiwan, Hong Kong, and Macao) with three sectors (i.e., primary, secondary, and tertiary industries). First, both production–approach GDP and the expenditure–approach GDP data are needed in this study. China applied the hierarchical statistical system in the past, which always resulted in inequality between national accounting and provincial accounting. A reform to unify the accounting of provincial GDP occurred in 2019. Based on the data collected in the fourth economic census in 2018, the previous years’ data of provincial production–approach GDP were modified. However, the data on the provincial expenditure–approach GDP were not modified, and the data after 2017 were not released in China Statistical Yearbooks. Besides, only a handful of provinces (i.e., Beijing, Zhejiang, Anhui, Jiangxi, Henan, Hunan, Guangdong, Chongqing, Qinghai, and Ningxia) released their regional expenditure-based GDP data after 2017. In this regard, we use the modified provincial production–approach GDP data as a benchmark to modify the expenditure-based data. The provincial expenditure-based GDP includes local consumption, local investment, and the net outflow of goods and services that includes two net outflow sources: net domestic outflow (i.e., net outflow to other provinces) and net exports. Due to the lack of net outflow sources in provincial GDP, we suppose that the net outflow to other provinces is proportionate to local consumption and investment and use the national consumption and investment to scale local consumption and investment. Then, the remaining expenditure for one province denotes its net exports. The growth indices of regional GDP and the three industries are used to obtain the constant production–approach GDP at the 2017 price. Note that the sum of constant regional GDP is not equal to the national constant GDP due to different deflation indices. Thus, we use the national GDP to proportionately scale the regional GDP. All the above-mentioned data are collected from the online database in NBSC [1].
Second, the provincial energy data are collected from the provincial energy balance tables (EBTs) in the China Energy Statistical Yearbook (CESY). On the one hand, the number of reported energy products changed in 2010. That is, twenty energy products had been reported prior to 2010, but the number of reported energy products increased to thirty after 2010. Thus, we merge the energy products into twenty types in the study period 2000–2017. On the other hand, the provincial EBTs are reported in physical quantity. Since the provincial EBTs are parallel to the national EBTs, we use the derived sectoral conversion factors for each fuel type at the national level to convert the provincial physical energy into standard quantity (i.e., 109 tons of coal equivalent, Gtce). Note that CESY always provides the modification energy data for previous years in the economic census year. For example, in 2018 (2019′s CESY), the national energy data were modified for 2014–2017; however, the provincial energy data were not modified. We use the modified national energy data to proportionately scale the provincial energy data for 2014–2017. All provincial energy data between 2000 and 2017 are modified in the abovementioned way, which is consistent with the national energy data. Note that there were no EBTs in Ningxia (2000–2002) and Hainan (2002); we used interpolation to estimate these values using the data in adjacent years. Related data are provided in Table S1 in Supplementary Materials.
4. Results and Discussions
4.1. Drivers of China’s Energy Consumption Growth between 2000 and 2017
Due to the data availability of provincial final uses, our study period covers 2000–2017. To coincide with production activity, we analyzed the changes in final production energy consumption (i.e., final energy consumption excluding household energy consumption) in this study.
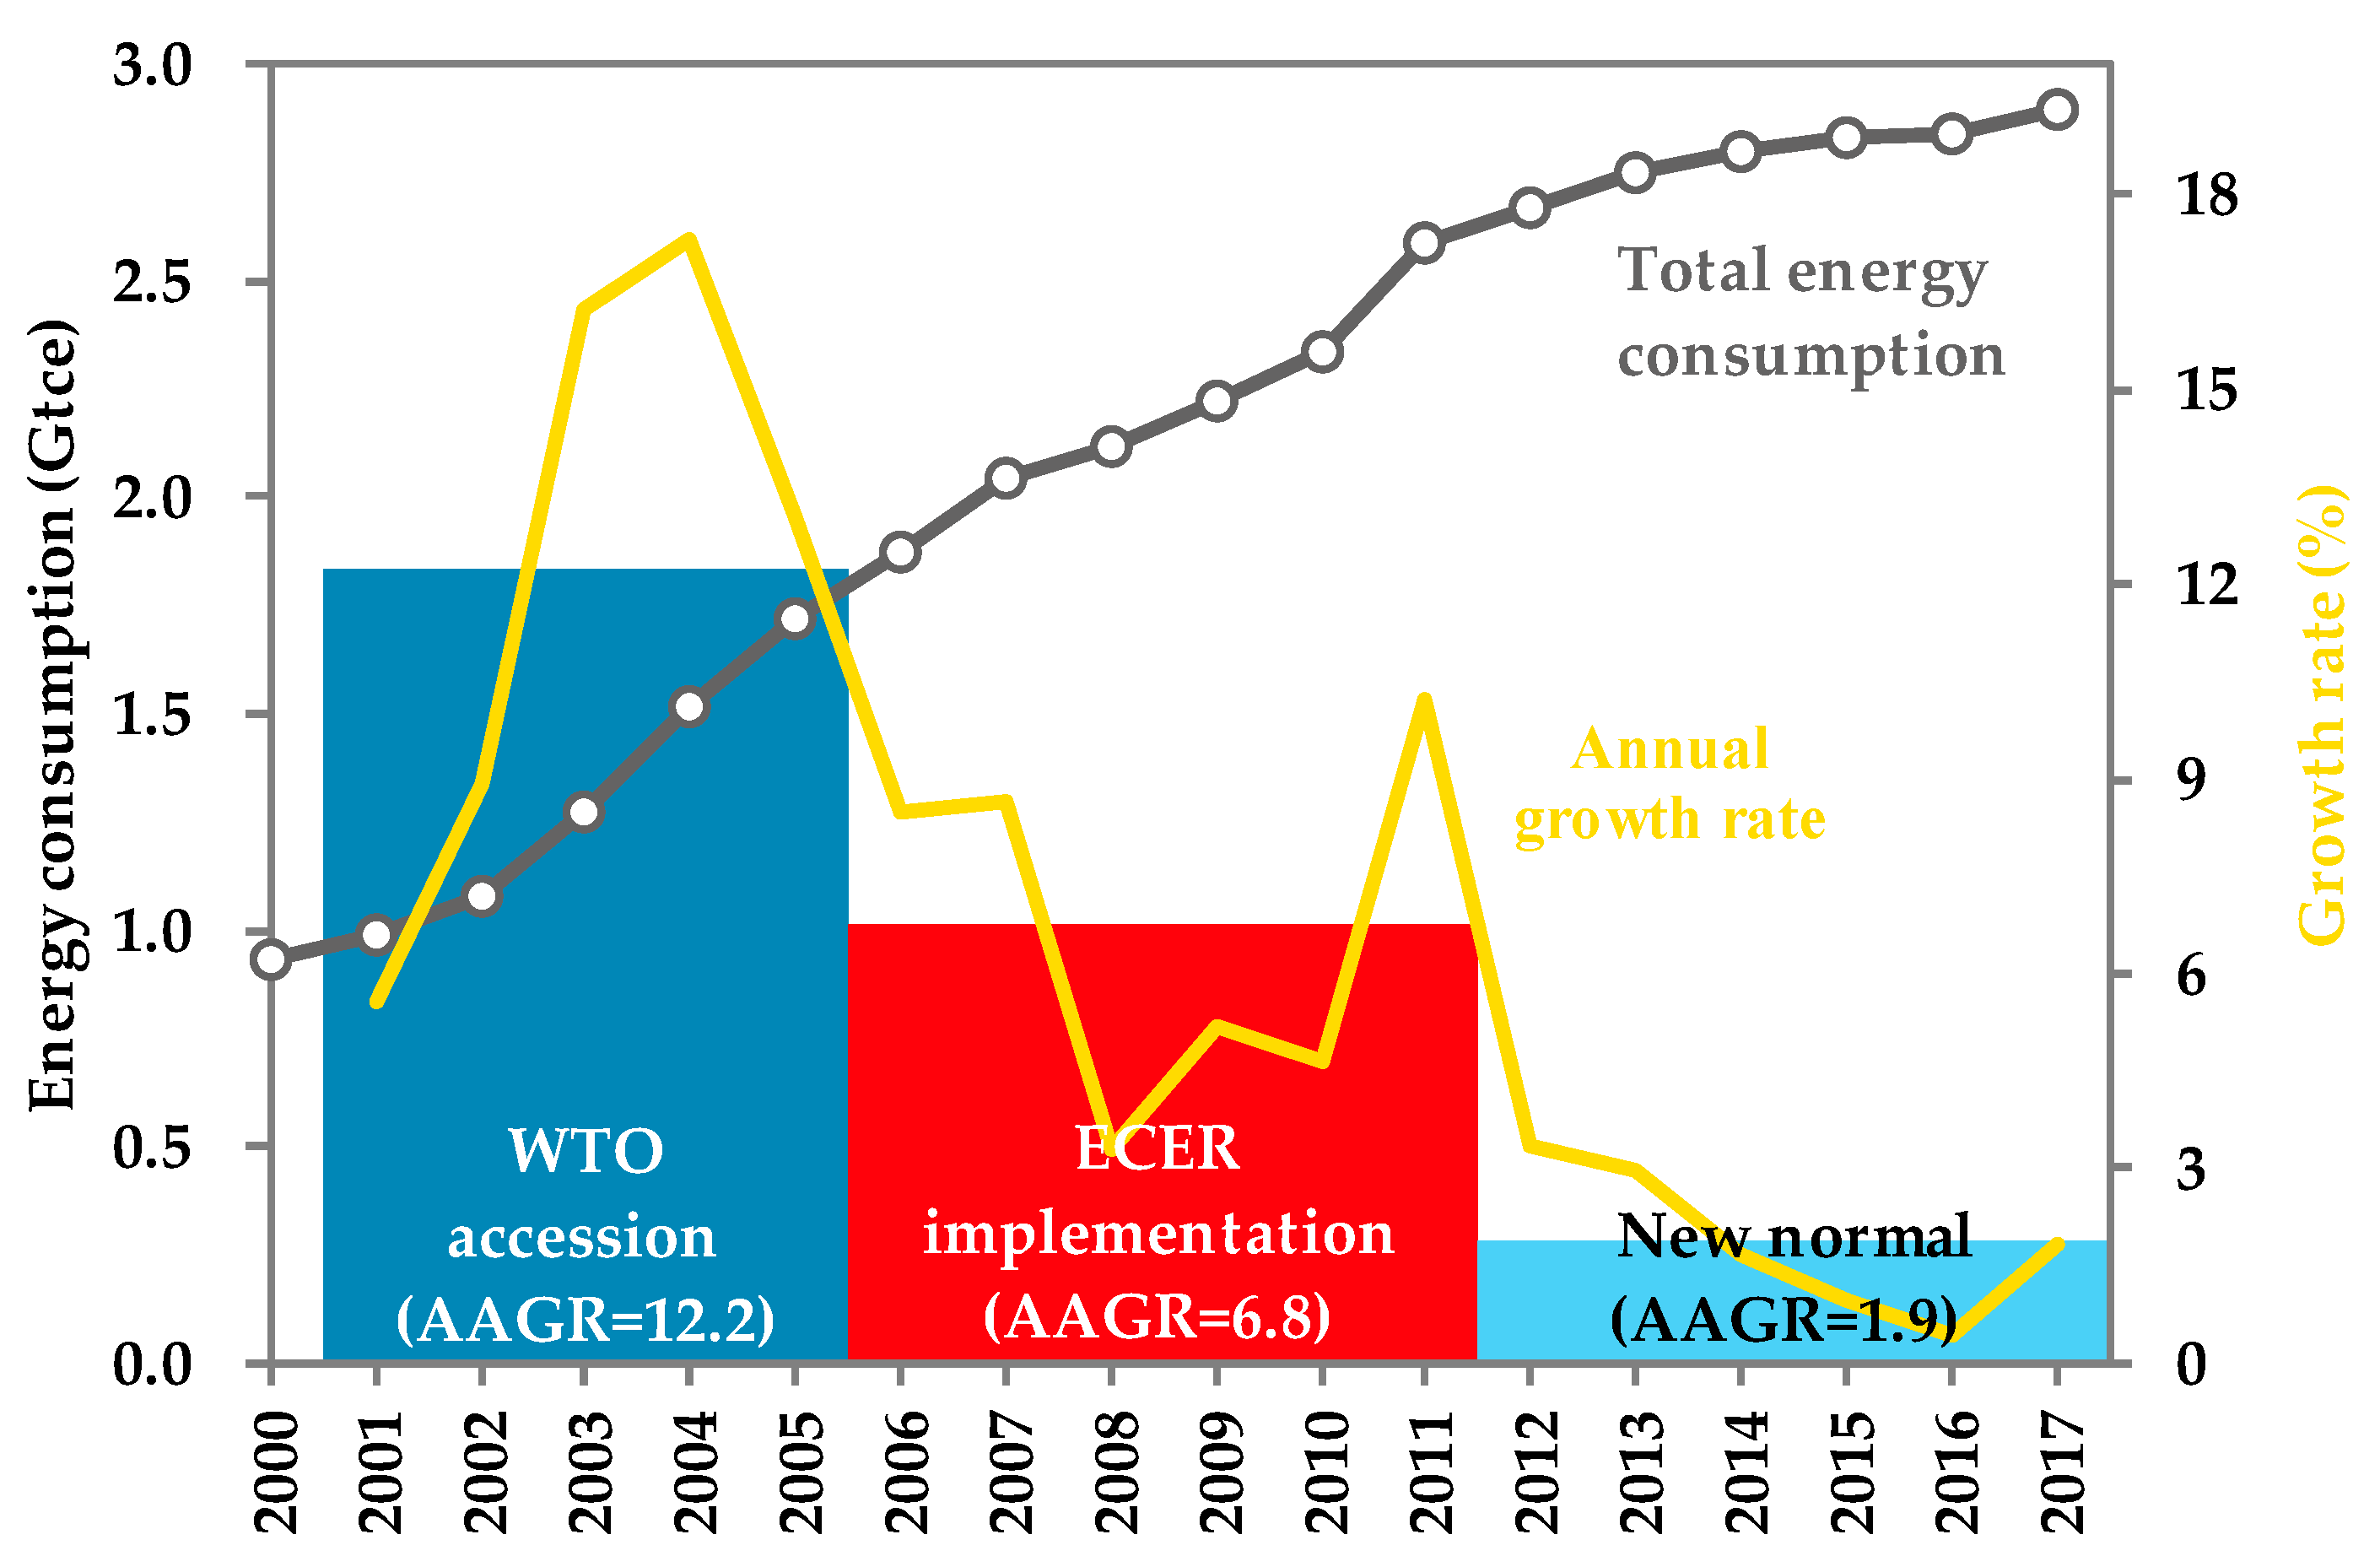
Figure 1 shows the rising trend of China’s total final energy consumption (hereafter total energy consumption) between 2000 and 2017, with an AAGR of 6.6%. The total energy consumption experienced rapid growth between 2000 and 2005 due to the WTO accession and heavy industrialization in China [36]. With a surge in exports and the speeding up of heavy industrialization, energy consumption soared in this period. However, China’s 11th Five-Year Plan proposed a constrained goal of energy conservation and emissions reduction (ECER) in 2006 [50]. Combined with damage caused by the global financial crisis, the energy consumption growth suffered a decline and remained at a relatively low growth rate between 2006 and 2010. However, a significant recovery of energy consumption growth occurred in 2011. There are two possible reasons to explain this sudden recovery. On the one hand, China implemented the counter-cycle policy (e.g., the CNY 4 trillion stimulus package) to offset the damage of the global financial crisis and this led to huge energy consumption [14,15]. On the other hand, there might be some retaliatory energy consumption suppressed in later years in China’s 11th Five-Year Plan period that could fulfill the constrained goal of ECER. Nevertheless, China immediately entered a low-growth period of the “new normal” in 2012, leading to a low growth of energy consumption.
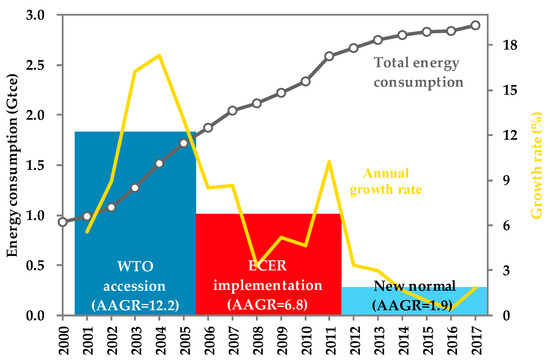
Figure 1.
Trends of energy consumption in China between 2000 and 2017. Boxes in blue, red, and light blue denote the AAGRs over the WTO accession period (2001–2005), ECER implementation period (2006–2011), and “New normal” period (2012–2017), respectively.
Thus, the whole period of 2000–2017 is divided into three sub-periods in this study. The first sub-period, named WTO accession following Zheng et al. [2], covers 2000–2005, when China’s energy consumption grew at a high rate, with an AAGR of 12.2%. The second sub-period, named ECER implementation, includes the years between 2006 and 2011, when severe ECER policies were implemented, leading to a significant decline in energy consumption growth, with an AAGR of 6.8%. The third sub-period represents the “new normal” stage, from 2012 to 2017, with an AAGR of 1.9%. Both of the latter two sub-periods were constrained by severe ECER policies. To conduct a comparative analysis, the second sub-period is seen as the old growth model stage in this study.
We applied the multiplicative LMDI I method to calculate the contributions of seven socioeconomic drivers to China’s total energy consumption growth between 2000 and 2017. In the calculation of the NIDA model, we followed the procedures proposed in [28,29] to deal with zero-value (gas consumption) and negative-value (net exports) problems. Table 1 provides the log growth of China’s total energy consumption and the contributions of seven drivers. For detailed results, see Table S2 in Supplementary Materials.

Table 1.
Contributions of drivers in log percentage (%).
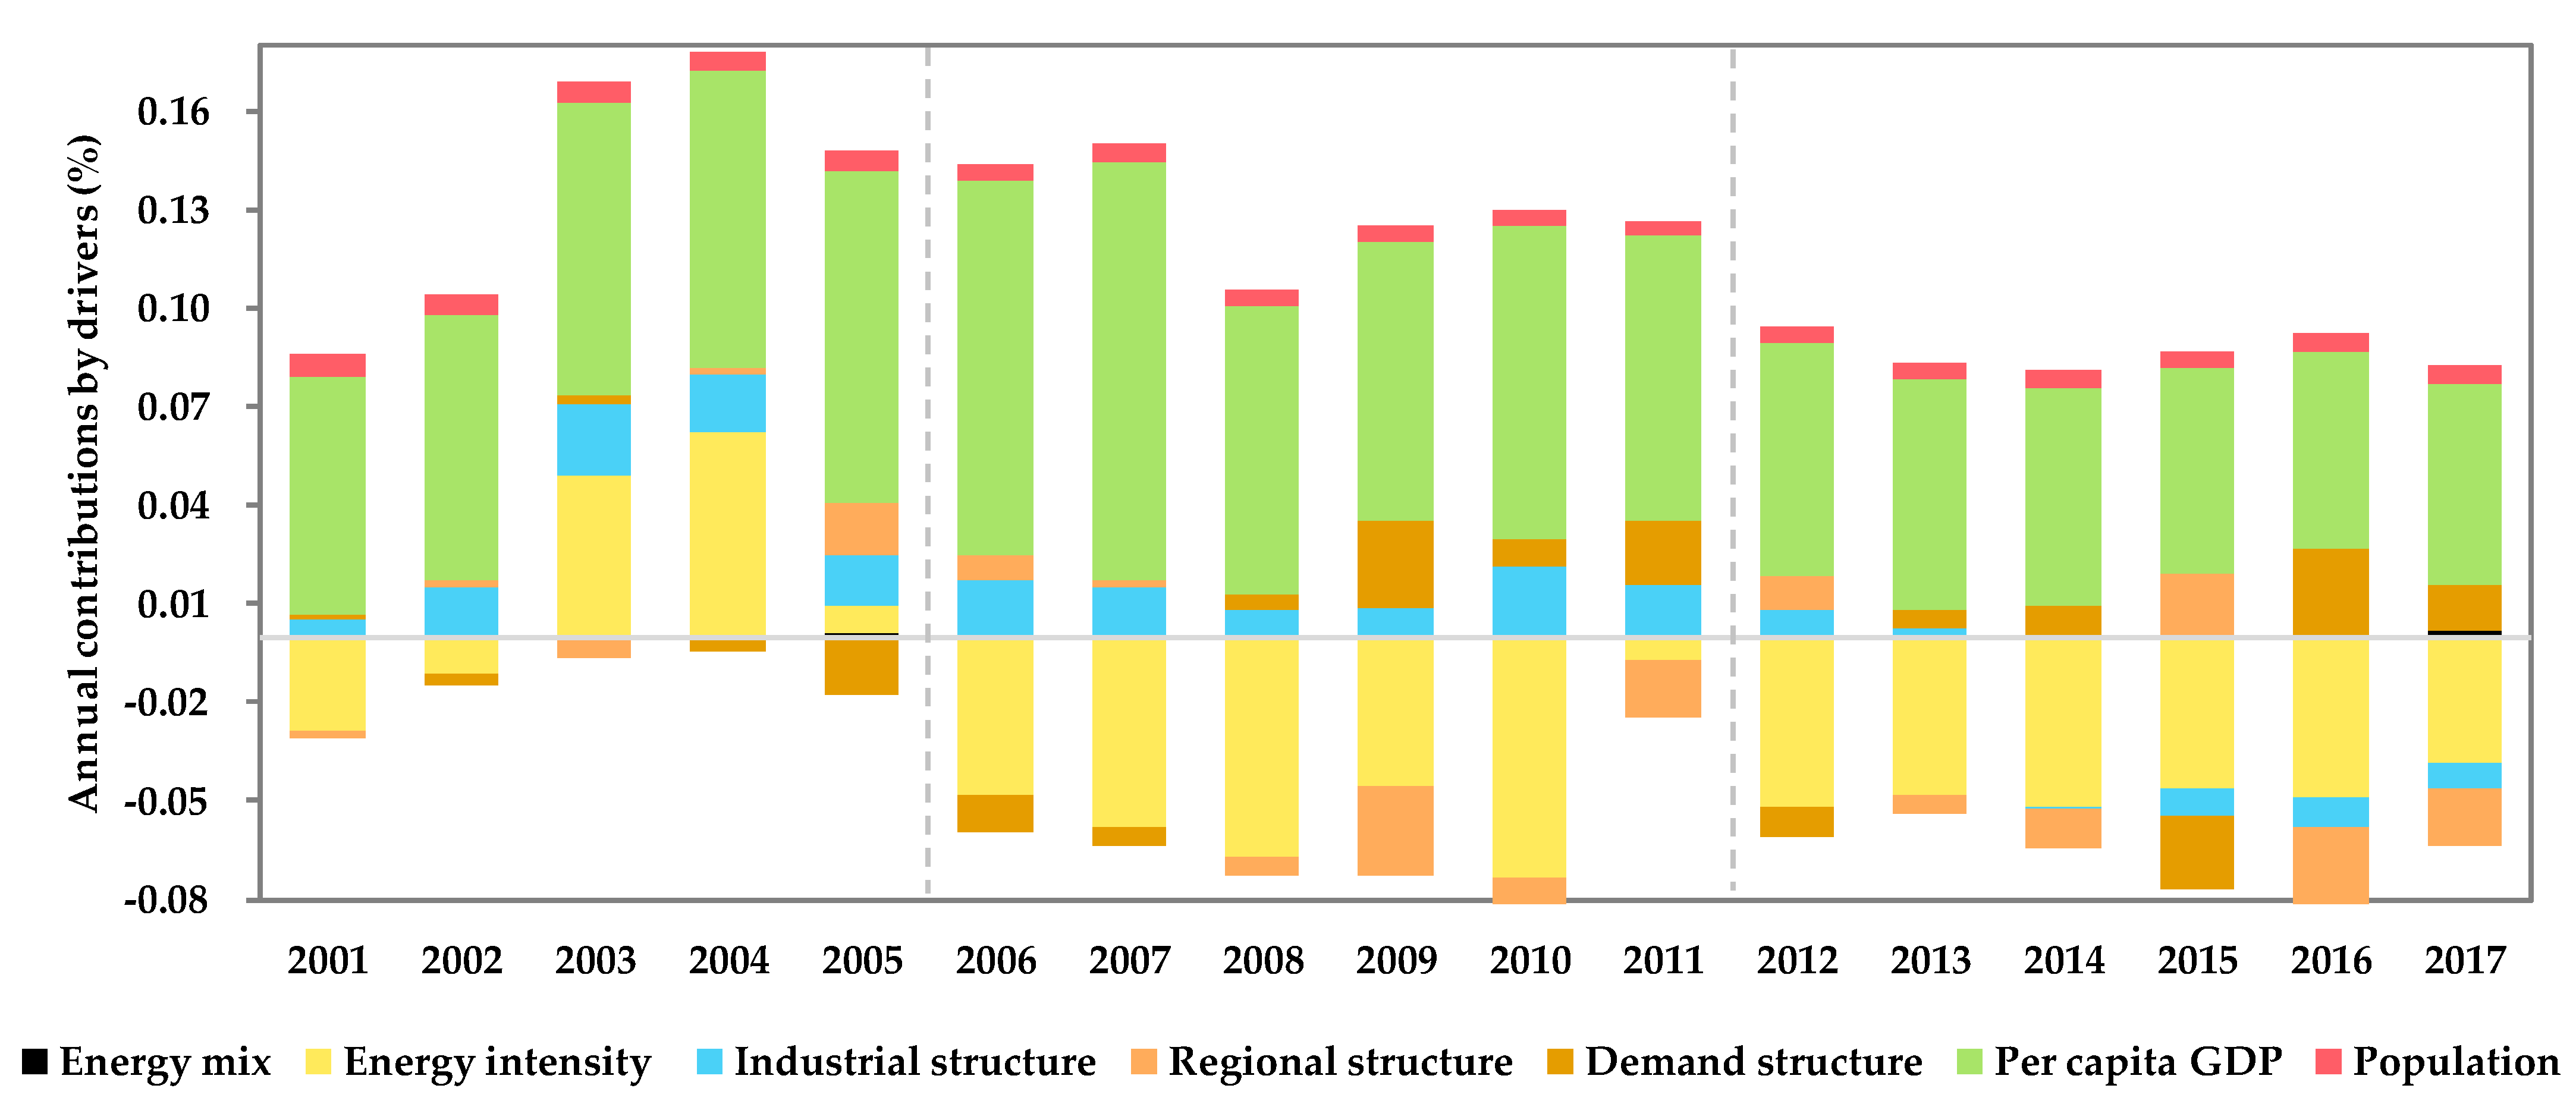
Figure 2 was created to show the annual contributions of each driver to China’s total energy consumption growth. It is shown that the annual growth of total energy consumption was mainly caused by the per capita GDP. Combined with population growth, it is the GDP growth that held the top contributor to energy consumption growth. Meanwhile, energy intensity acted as the strongest negative contributor to energy consumption growth most years (except for 2003–2005). This finding is supported by the average annual declining rate of energy intensity of −3.9%, indicating a general steady improvement in energy consumption efficiency. Meanwhile, during the 2003–2005 period, energy intensity exerted a positive effect on energy consumption growth. This was because most industries transformed into becoming energy-intensive during the heavy industrialization process [36]. The industrial structure promoted energy consumption during 2000–2013 due to the continuous expansion of the secondary industry with its value-added share to GDP increasing at an average annual rate of 1.4%. However, from then, the industrial structure contributed to offsetting energy consumption, due to the fact that China entered the “new normal” stage and the secondary industry share of GDP started to decline. The energy mix generally made a small but positive contribution to energy consumption growth; however, this contribution has become negative in some recent years (e.g., 2013 and 2016), implying a mitigating effect of energy transition at the “new normal” stage. The effects of regional structure and demand structure on energy consumption change were volatile over time, which needs further analysis to find out potential changing patterns.
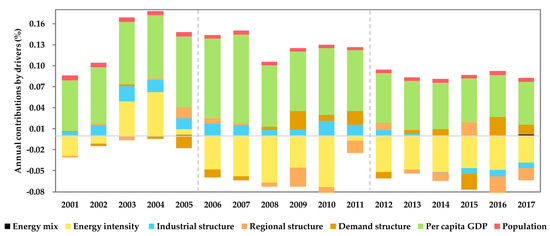
Figure 2.
Annual contributions of seven drivers to China’s total energy consumption growth.
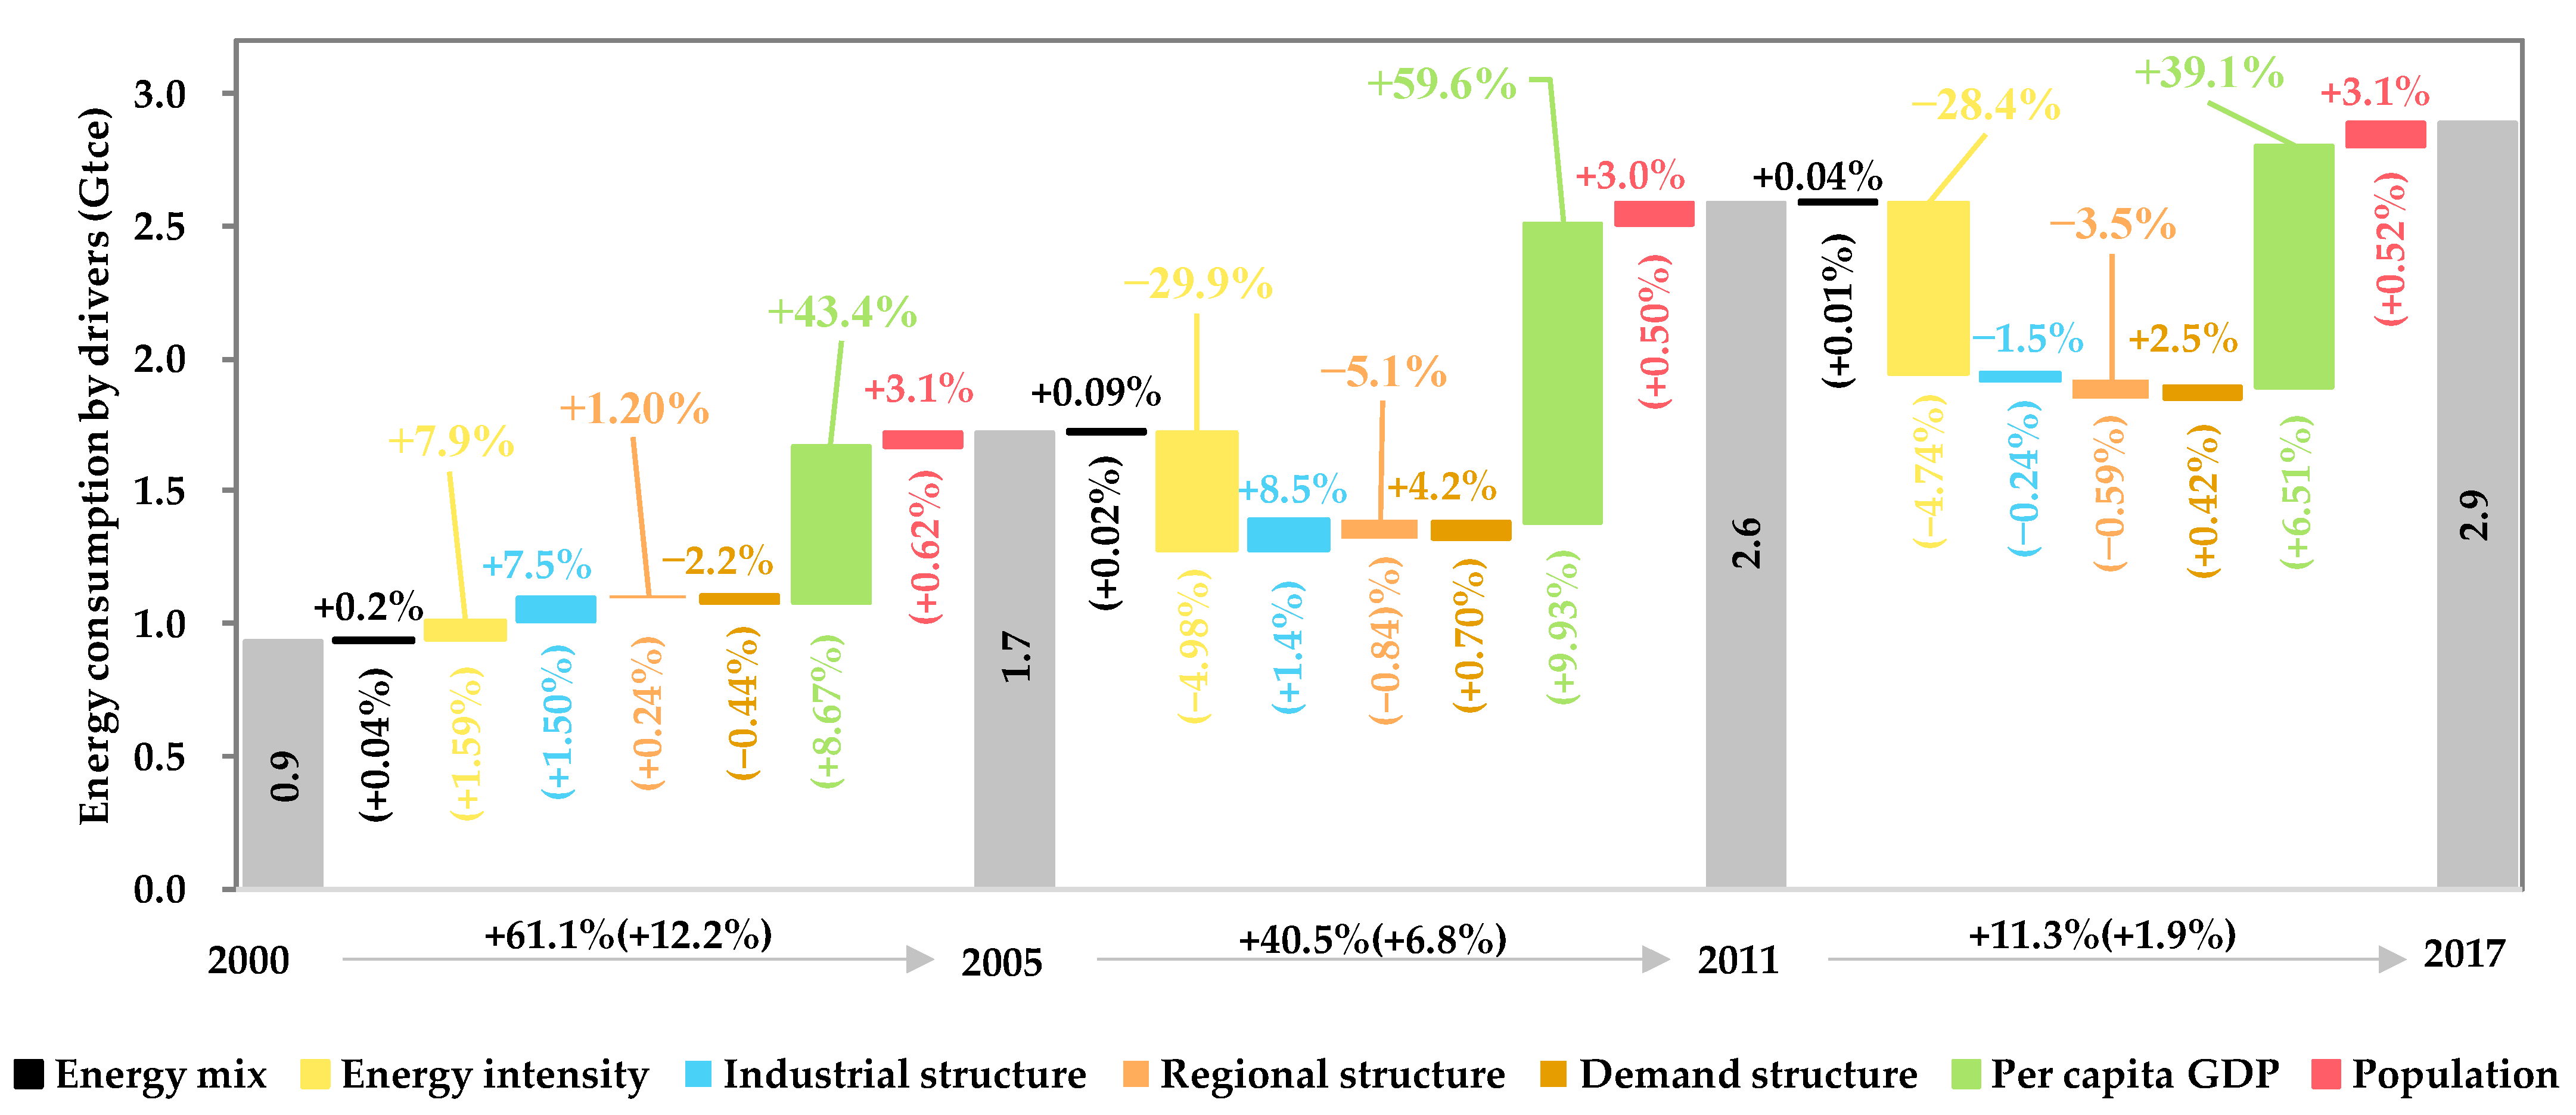
In Figure 3, the whole period is divided into three stages, as mentioned above. From a stage perspective and in terms of AAGR, the energy consumption growth showed a falling trend, from 12.2%, to 6.8%, and to 1.9%. The industrial structure effect and energy mix effect also experienced a falling trend in terms of AAGR, indicating structural improvements in the three industries and four fuels stage by stage. Due to exports expansion and heavy industrialization, the energy intensity at the stage of WTO accession promoted energy consumption; however, it reduced energy consumption considerably in the latter two stages due to severe ECER policies in China [51]. The per capita GDP held the top contributor to energy consumption growth across stages; however, its effect became smaller at the “new normal” stage, since China aimed to build a high-quality economy to replace the old high-quantity economy. In addition, the effect of population on energy consumption growth was almost stable over the stages, with very small fluctuations.
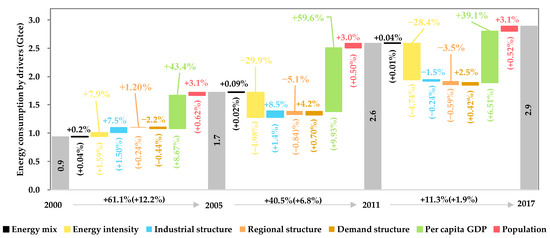
Figure 3.
Contributions of seven drivers to China’s total energy consumption change in three stages (values in brackets denote AAGRs).
As observed in Figure 3, the demand structure effect showed an inverted-U trend among stages in terms of AAGR, from −0.44%, to 0.70%, and to 0.42%. The inverted-U trend of the demand structure effect was in line with [11,14,15] for the period 2005–2015; however, it was different from [2] for the periods 2002–2007 and 2012–2017. Despite studied objective and data modification by NBSC, such differences may result from the different constructions of demand structure. As discussed above, the demand structure based on IO tables does not include the imports, while this study uses the expenditure–approach GDP data to construct the demand structure. As a result, the exports’ share of total final demand was much bigger than the net exports’ share of GDP (see Table A1 in Appendix A), and thus the demand structure effect based on IO tables highlighted the contribution of exports.
In this study, the net exports effect was a much smaller contributor to energy consumption growth compared to consumption and investment (see Figure 4a). In the WTO accession stage, the negative demand structure effect was mainly driven by the significant decline in consumption share to GDP, while investment and net exports made positive contributions. It was the considerable expansion of investment that dominated the positive demand structure effect at the ECER implementation stage, for which China released a CNY 4 trillion stimulus package with a focus on fixed assets and construction [14,15]. However, in the “new normal” stage, the investment suffered a shrinkage while the consumption experienced a faster increase, resulting in a positive demand structure effect. However, the positive demand structure effect at the “new normal” stage was smaller than that in the old growth model stage, implying an improvement in demand structure in the context of energy consumption deceleration.
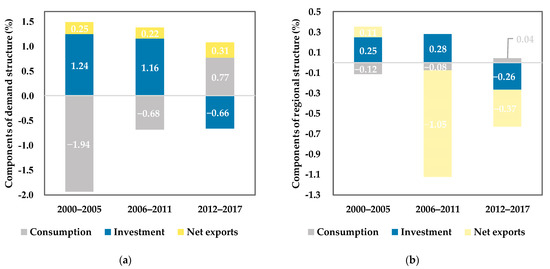
Figure 4.
Average annual contributions of final uses to the demand structure effect and regional structure effect. (a) Demand structure effect; (b) Regional structure effect.
The regional structure effect experienced a U trend among stages, from 0.24%, to −0.84%, and to −0.59%, which is not very in line with the findings in [2], especially in the period prior to 2012. This may be explained by the different measurements of the regional structure. Their measurement of the regional structure is the same as the common regional structure defined in Equation (1); however, in this study, the common regional structure is further decomposed into the final use-based regional structure and the (national) demand structure, which is absent in [2]. Moreover, in this study, the regional structure effect is made up of consumption-based, investment-based, and net export-based regional structure sub-effects. The negative regional structure effect in the “new normal” stage was mainly caused by net exports (−0.37%), followed by investment (−0.26%), while the consumption contributed positively to the regional structure effect by 0.04% (see Figure 4b).
4.2. Drivers to the Deceleration of Energy Consumption Growth in the “New Normal” Stage
4.2.1. The National Analysis
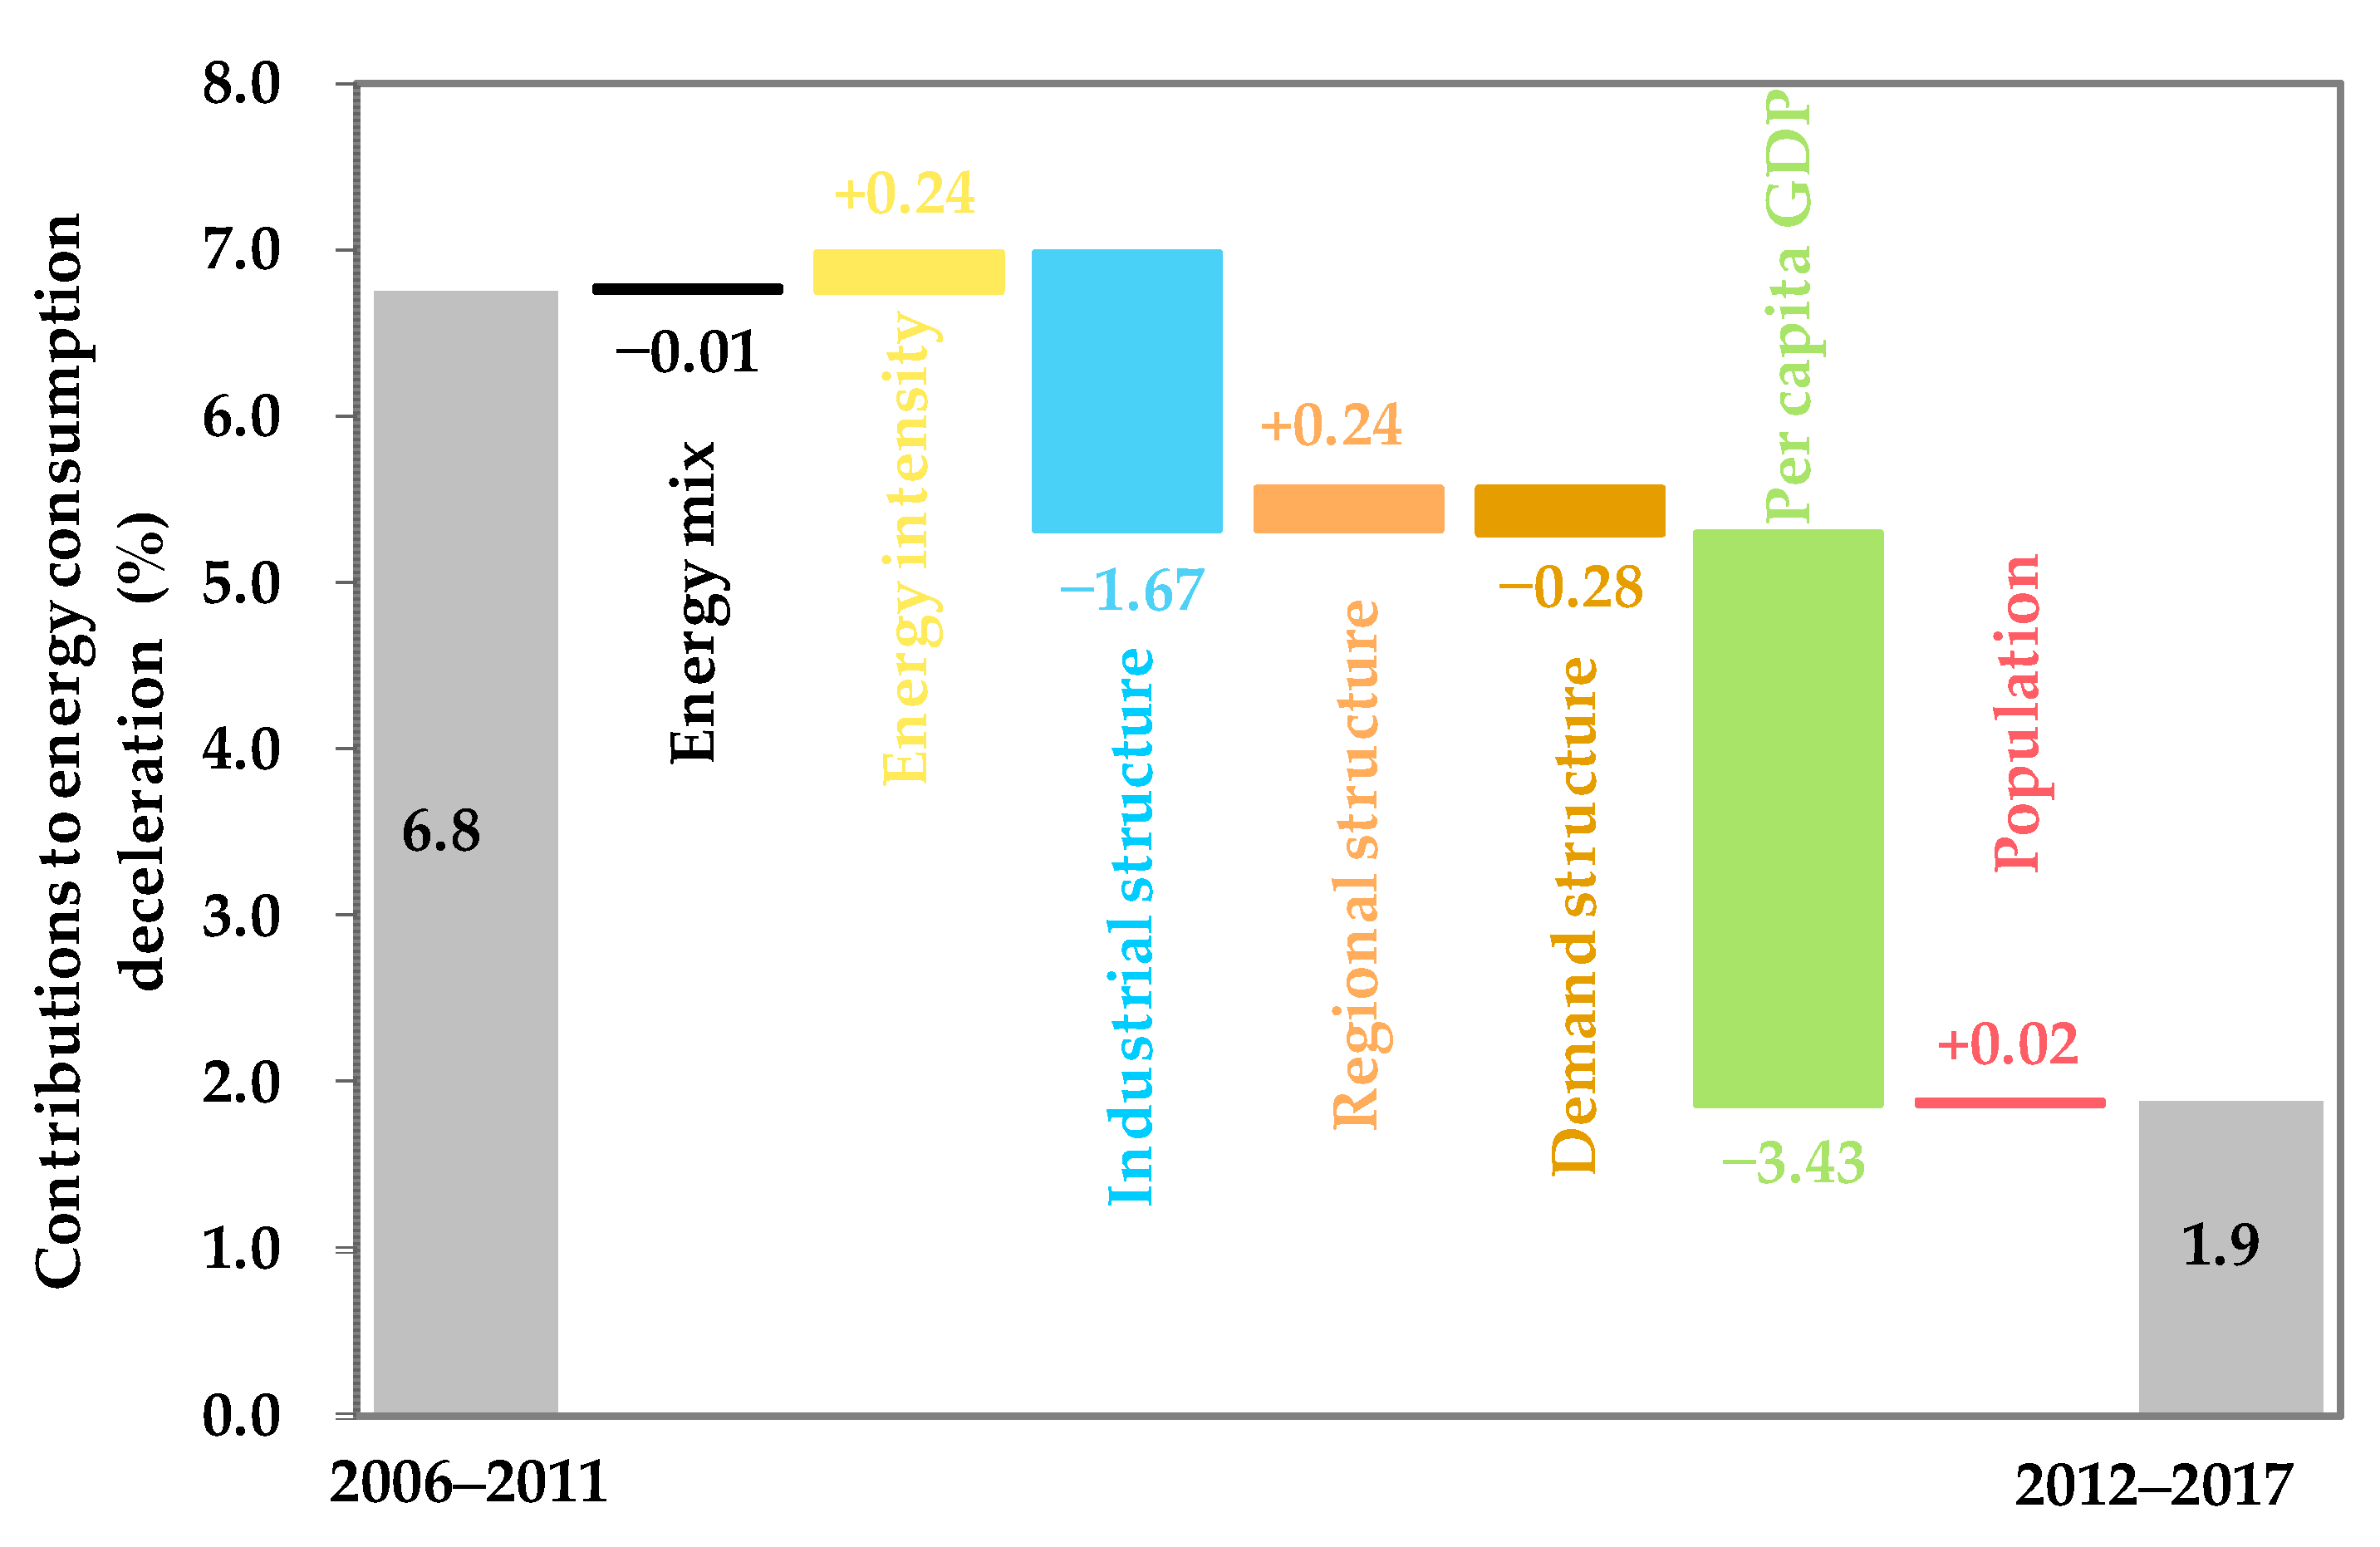
Figure 5 shows that an average annual 4.9% deceleration of energy consumption growth occurred from the old growth model stage (6.8%) to the “new normal” stage (1.9%). This deceleration was driven by the slowdown in economic growth (−3.43%), industrial structure (−1.67%), demand structure (−0.28%), and energy mix (−0.01%), while the remaining factors prevented this deceleration.

Figure 5.
Average annual contributions of seven drivers to energy consumption deceleration.
After decades of repaid growth, China’s economy entered the “new normal” with medium-speed growth. The slowing economic growth led to slowing energy consumption growth. Demand structure gained an improvement in the “new normal” stage and thus promoted energy consumption deceleration, from 0.7% in the old growth model stage to 0.42% in the “new normal” stage, in terms of AAGR (Figure 3). In the old growth model stage, the demand structure effect was dominated by investment share to GDP because of the surge in fixed assets and construction that acted as a counter-cycle measure to offset the damage of the global financial crisis [14,15]. However, sustainability and economic balance became the key foci when China entered the “new normal” [4]. The policy to encourage domestic consumption was implemented in the “new normal” stage, resulting in a rising consumption share of GDP. Among final uses, consumption induced less energy consumption than investment and exports [15,49]; a rising consumption share and a falling investment share in the “new normal” stage consequently led to a slowdown in energy consumption compared to the old growth model stage (Figure 4a).
In other words, the demand structure seemed a promising driver of future energy consumption deceleration, though it still promoted energy consumption in the “new normal” stage. Different roles of demand structure in offsetting energy consumption and decelerating energy consumption distinguished an always ignored issue: which factor is sustainable for further energy conservation? It is an important and serious issue because the old growth model was proven to not be sustainable and made it impossible to achieve the goals of carbon peaking by 2030 [52,53,54,55]. More importantly, the method to mitigate energy consumption at the expense of economic growth is not acceptable for China’s economic development goals. In this regard, the economic “new normal” seems to be a promising development model because of a series of systematic transitions toward a sustainable and green economy.
Apart from the demand structure, the industrial structure was also improved in the “new normal” stage, and thus contributed an average annual 1.67% deceleration to energy consumption growth between the old and new development stages (Figure 5). This was because the share of secondary industry to GDP started to decline in the “new normal” stage, while the share of tertiary industry to GDP kept growing, ultimately resulting in a significant promoting effect on energy consumption deceleration. The energy mix promoted energy consumption deceleration as a whole, but with a very small effect.
However, the remaining drivers, i.e., energy intensity, regional structure, and population, drove the acceleration of energy consumption growth between the old and new development stages. Population, a national driver, drove the acceleration of energy consumption growth by 0.02%. This might result from the sudden population rise in 2016 and 2017, when the comprehensive two-child policy was implemented in China [56]. Energy intensity, the dominant driver to energy consumption mitigation in both old and new development stages, promoted a 0.24% annual acceleration of energy consumption growth between stages, indicating that the energy efficiency gains in the “new normal” stage became smaller than those in the old growth model stage. The accelerating effect of energy intensity on energy consumption growth between the old and new development stages may be explained by changes in China’s R&D intensity (R&D expenditure share to GDP). The R&D intensity grew gradually from 1.8% in 2011 to 2.1% in 2017. Nevertheless, the AAGR of R&D intensity in the “new normal” stage (2.9%) was lower than that in the old growth model stage (5.1%), indicating a slowdown in R&D intensity growth and thus a slowdown in the offsetting effect of energy intensity on energy consumption growth. The regional structure acted as the energy intensity; that is, it offset energy consumption at both old and new development stages (Figure 3) but accelerated the energy consumption growth between stages (Figure 5). This might be explained by the sharp shrinkage of net export-based regional shares, as shown in Figure 4b.
Overall, we find that the structural effects (including energy mix, industrial structure, regional structure, and demand structure) and efficiency gains (i.e., energy intensity) together decelerated the energy consumption growth by −1.46% between stages. Meanwhile, the economic growth (i.e., per capita GDP plus population) contributed to the deceleration in energy consumption growth by −3.41%. In this sense, China’s current development pattern seems unsustainable in terms of energy consumption deceleration, because this deceleration was mainly at the expense of economic expansion.
4.2.2. The Regional Analysis
According to Equation (7), we can re-arrange all decomposition results to obtain regional effects which are also driven by seven factors. Table 2 presents the contributions of different factors to the regional energy consumption deceleration between the old growth model and “new normal” stages in terms of AAGR. Regions in Table 2 are divided into two groups: municipalities and provinces. Then, regions in each group are ranked from bottom to top with respect to energy consumption deceleration. We observe that most (27 out of 30) regions experienced an energy consumption deceleration, while three regions (i.e., Xinjiang, Heilongjiang, and Ningxia) accelerated energy consumption growth.
Table 2.
Contributions to regional energy consumption deceleration in terms of AAGR (%).
From a factor perspective, energy mix decelerated energy consumption growth in most (18 out of 30) regions, while it accelerated energy consumption growth in the remaining regions. For example, energy mix had the strongest effects on decelerating energy consumption growth in Hunan (−0.04%) and Inner Mongolia (−0.03%); in contrast, it accelerated energy consumption growth most in Guangdong (0.05%) and Yunnan (0.01%). Industrial structural updates and transitions, i.e., a falling share of the secondary industry and a rising share of the tertiary industry, occurred comprehensively in the regional economies and caused a promoting effect on energy consumption deceleration in most regions. Beijing is the only exception because it had already been a service economy with a low share of the secondary industry (less than 20%), which declined more slowly in the “new normal” stage than that in the old growth model stage. As a result, the industrial structure had a preventative effect on energy consumption deceleration in Beijing (0.016%). Demand structure, a national driver, exerts its effect on energy consumption growth by its regional weights (Equations (4)–(6)). The demand structure effect decelerated energy consumption in only 11 regions, while it accelerated energy consumption in the other 19 regions. For example, Inner Mongolia had the strongest demand structure effect on deceleration energy consumption, by −0.236%, while Guangdong had the strongest demand structure effect on accelerate energy consumption, by 0.117%.
Energy intensity decelerated energy consumption in 13 out of 30 regions, while it accelerated energy consumption in the remaining regions. Some energy-abundant provinces (e.g., Inner Mongolia, Sichuan, and Shaanxi) promoted energy consumption deceleration because they had higher levels of energy intensity, which meant more potentials for energy conservation and more flexible mitigation measures. In addition, they could learn from past experiences in provinces with low levels of energy intensity. Some provinces were driven by energy policies, e.g., Tianjin, Hebei, Shandong, and Henan. These provinces are in or surrounding the Beijing-Tianjin-Hebei region, which is a region focused on collaboratively governing environmental pollution [57]. Thus, strict energy policies were implemented in these provinces, including the elimination of backward production capacity, transformation industries by information technology, etc. [16]. However, Beijing, as the core of the Beijing-Tianjin-Hebei region, seemed to be an exception. Energy intensity in Beijing did offset energy consumption in the “new normal” stage by −0.087% annually, but it was slower than that in the old growth model stage (−0.165% annually) (see Table S2 in Supplementary Materials). The slowdown in energy efficiency gains in the “new normal” stage might not be surprising because Beijing had the lowest level of energy intensity (0.24 Gtce/108 CNY averaged between 2006 and 2011) among China’s regions, which meant limited potential and measures of energy conservation. Similarly, Shanghai, Jiangsu, and Zhejiang had very low levels of energy intensity (0.38 Gtce/108 CNY, 0.34 Gtce/108 CNY, and 0.30 Gtce/108 CNY, respectively) and did not show their potential for slowing energy consumption in the “new normal” stage.
At the regional level, the regional structure change is a weighted average growth among consumption, investment, and net exports. As discussed in Methodology, the regional structure effect here reflects the relative economic expansion/shrinkage. As shown in Table 2, the regional structure effect decelerated energy consumption in half of the regions, while it accelerated energy consumption in the other half of the regions. For example, Guangdong had the strongest regional structure effect on energy consumption deceleration, by −0.137%, while Jilin had the strongest regional structure effect on energy consumption acceleration, by 0.154%. Per capita GDP, a national driver, decelerated energy consumption growth in every region. The population growth decelerated energy consumption in nine regions, while it accelerated energy consumption in the remaining regions.
Finally, we evaluated each region’s performance on energy consumption deceleration. Three development patterns are identified by the comparison of the structure and efficiency effect and the economic growth effect. The structure and efficiency effect (column 10 in Table 2) includes the energy mix effect, industrial structure effect, demand structure effect, and energy intensity effect; the economic growth effect (column 11 in Table 2) includes the per capita GDP effect, regional structure effect, and population effect. The sustainable development pattern is defined as one region gaining economic expansion (positive economic growth effect) and obtaining energy consumption deceleration by improvements in structure and efficiency. The unbalanced development pattern is defined as one region experiencing an economic shrinkage, while the structure and efficiency factors dominate the energy consumption deceleration. The unsustainable development pattern is defined as one region suffering an economic shrinkage, and it is the economic shrinkage rather than the improvements in structure and efficiency that dominates the energy consumption deceleration.
According to the above definitions, we find that only two regions, i.e., Jilin and Guangxi, belong to the sustainable development pattern. For example, Jilin experienced an economic expansion during the “new normal” stage by 0.047%, mainly due to its relative regional economic expansion of 0.154%. Meanwhile, the total effect of structure and efficiency on energy consumption deceleration is −0.271%, mainly due to the demand structure effect (−0.155%) and energy intensity effect (−0.082%). Clearly, Jilin gained a co-benefit between economic expansion and energy consumption deceleration.
Notably, 10 out of 30 regions belong to the unbalanced development pattern. Take Tianjin as an example: the economic growth effect on energy consumption deceleration is −0.019%, mainly due to the per capita GDP effect of −0.042%. However, it is the structure and efficiency effect that dominated the energy consumption deceleration by −0.147%, mainly due to the energy intensity effect (−0.057%) and demand structure effect (−0.056%). The regions with unbalanced development patterns did decelerate energy consumption mainly by the structure and efficiency effect, while they also suffered economic shrinkage.
The unsustainable development pattern covers the remaining (18 out of 30) regions. For example, Shanghai experienced an energy consumption deceleration in the “new normal” stage by −0.072%. However, this deceleration was mainly driven by the economic growth effect of −0.154%, with per capita GDP as the dominant driver. Meanwhile, the structure and efficiency effect suffered a deterioration by 0.082% between stages, mainly due to the deterioration of energy intensity effect by 0.089%. Liaoning represents another case. The economic growth effect in Liaoning was −0.153%, while the effect of structure and efficiency was also negative by −0.118%. Nevertheless, it is the economic growth effect that dominated the energy consumption deceleration in Liaoning.
Overall, there was no municipality on the sustainable development path in terms of energy consumption deceleration. Two municipalities, Tianjin and Chongqing, were on the unbalanced development path. The other two municipalities, Shanghai and Beijing, were also on the unsustainable development path. For the province group, there were only two provinces, i.e., Jilin and Guangxi, on the sustainable development path for energy consumption deceleration. Besides, eight provinces belonged to the unbalanced development pattern and sixteen provinces belonged to the unsustainable development pattern. Furthermore, we find that the sustainable and unbalanced development patterns always cover those underdeveloped regions (e.g., Jilin and Guangxi) and moderately developed regions (e.g., Sichuan and Hainan), Meanwhile, the unsustainable development pattern covers either developed regions (e.g., Beijing, Shanghai, Guangdong, and Jiangsu) or underdeveloped regions (e.g., Xinjiang, Ningxia, Guizhou, and Qinghai). These results are closely related to the definitions of development patterns. That is, in this study, we define the development patterns from the energy consumption deceleration perspective. In this respect, the wealthy regions seemed to have limited potentials for energy consumption deceleration, because they might have updated their economic structure and already have advanced technologies. In other words, they were on the frontier of the Chinese economy and depended more on innovations than other regions. In contrast, the moderately developed regions and underdeveloped regions have great potential for updating and optimizing their economic structure and approaching the technological frontiers. In this respect, most of them were on sustainable or unbalanced development paths toward energy consumption deceleration. However, those regions that did not make use of the potentials were on an unsustainable path.
4.3. Discussion and Policy Recommendations
China’s energy consumption slowed down in the “new normal” stage, but this was mainly caused by economic slowdown (per capita GDP and population; −3.41% annually), rather than energy efficiency gains (energy intensity) and structural updates (energy mix, industrial structure, regional structure, and demand structure; −1.46% annually), implying an unsustainable development pattern because the energy consumption deceleration was at the expense of economic expansion. In particular, the energy intensity and regional structure, the top two drivers of mitigating energy consumption in the “new normal” stage (Figure 3), seemed to be unpromising drivers of energy consumption deceleration. Therefore, to realize energy consumption deceleration and carbon emission peak, the energy technological progress and the rearrangement and optimization of regional structure should be given top priority.
On the one hand, China’s overall technology was indeed enhanced in the “new normal” stage, and a number of major scientific and technological achievements emerged [58]. However, the overall R&D intensity slowed down in the “new normal” stage. That is, the R&D intensity grew 2.9% annually in the “new normal” stage, which was lower than that in the old growth model stage (5.1% annually) [1]. In the future, the R&D intensity, especially the R&D expenditures on energy conservation technologies and emission reduction technologies, should be sped up. Moreover, the R&D input is a special capital product, and thus, the existing R&D stock needs to be well managed to enhance the input-output transformation efficiency. We see that the Chinese government has paid attention to this field. For example, China amended the Law of the People’s Republic of China on the Promotion of Application of Scientific and Technological Achievements in 2015 and released the implemented rules for this law in 2016 [59,60]. However, there are still some blocking points for the transformation of technological achievements [61]. Moreover, vigorously promoting a circular economy and material recycling may be an effective way to improve energy efficiency, because the fewer materials produced, the less energy consumed. Additionally, the backward capacity should be removed and substituted by the advanced capacity so as to improve overall energy efficiency. On the other hand, both the old and new development stages saw a negative regional structure effect on energy consumption growth at the national level, which might be seen as a good response to the top-down severe energy policies implemented in 2006 [50]. However, the overall regional rearrangement seemed to be slowing down in the “new normal” stage, and thus exerted a preventing effect on energy consumption deceleration. In the future, a thorough rearrangement and optimization of the regional structure should be consolidated to unleash more potential for energy consumption deceleration.
In the “new normal” stage, the industrial structure contributed to declining energy consumption (Figure 3) and the second top driver of energy consumption deceleration (Figure 5). The industrial structure seemed a promising driver to further slowdown in energy consumption because China has been a service-dominated economy since 2012. Moreover, the high-tech and digital industries should be promoted with emphasis because they are less energy-intensive and have great spillover effects [62,63]. Energy mix, demand structure, and population promoted energy consumption at both old and new development stages. However, energy mix and demand structure were promising drivers to energy consumption deceleration because their promoting effects on energy consumption became smaller from the old growth model stage to the “new normal” stage. As for the energy mix, the substitution of high-quality and clean energy products (e.g., natural gas and electricity) for low-quality and dirty energy products (e.g., coal) should be sped up in the future. Studies found that there is great potential for energy mix optimization [64]. For example, the electrification rate in China’s final energy consumption was 20.6% in 2012–2017. Due to the high quality of electricity, the promotion of large-scale electrification will reduce the total energy consumption and decelerate energy consumption, or even reduce energy consumption in the future. We can see that the Chinese government has implemented a plan to speed up electrification in the 14th Five-Year Plan period to enhance the electrification rate, with the aim of reaching 30% by 2025 [65]. Moreover, to optimize the energy mix, it is very important to promote the shift of electricity generation from thermal power to clean electricity. That is because there have been large losses in thermal power generation, with an overall transformation efficiency of 43.9% in 2012–2017 in China [1]. However, the generation of clean electricity avoids such losses and thus will greatly reduce the consumption of fossil fuels under the plan to promote the proportion of clean electricity to be 39% by 2025 [65]. Besides, attention should be paid to building a more efficient energy system, e.g., a distributed energy system and a smart grid, to reduce the losses in delivery and storage and thus reduce total energy consumption [66]. The promoting effect of demand structure on energy consumption deceleration was mainly driven by investment, while consumption and net exports drove the acceleration of energy consumption growth between stages (Figure 4a). For the further deceleration of energy consumption, apart from the balance between consumption and investment, the inner-consumption structure, i.e., the structure between household consumption and government consumption, should also be balanced and optimized. Policies should be released to encourage and enlarge household consumption because household consumption induces smaller energy consumption than government consumption [15].
From a region perspective, the developed regions were on an unsustainable path toward energy consumption deceleration. This is not surprising because they have a well-updated economic structure and advanced technologies, implying limited potential for energy consumption deceleration. In the future, we suggest that these developed regions increase R&D investments in energy conservation and improve R&D transformation efficiency. For example, they can learn about practices from developed countries to decelerate or even decline energy consumption. Moreover, as developed regions, they can focus on developing low-carbon and green industries, e.g., the digital industry and high-end services. They can also strive to develop a smart grid and low-carbon energy system to waste less energy and improve energy efficiency [67]. Most of the moderately developed regions and underdeveloped regions were on sustainable and unbalanced development paths toward energy consumption deceleration. We suggest that these regions make use of the potential for economic restructuring and efficiency improvements. They can learn about the practices of energy policy design and environmental regulation from developed regions. Meanwhile, they can make use of the spillover effect of information and communications technology and digital technology to speed up improvements in energy efficiency. Severe environmental regulation may help the moderately developed regions to speed up economic restructuring and overcapacity phase out [57]. There are some underdeveloped regions that did not appropriately use their potential for energy consumption deceleration. We suggest that they choose an example to be followed. For example, Heilongjiang can follow Jilin’s practices to realize energy consumption deceleration because both of them are underdeveloped and have similar resource endowments. Heilongjiang can also learn from Shandong because both of them are heavy industry-dominated economies.
5. Conclusions
To comprehensively evaluate how a series of systematic changes in the “new normal” stage affects the slowdown in total energy consumption, we propose a NIDA model that can uncover both the production- and demand-side socioeconomic factors. Seven drivers are identified in the NIDA model, including four structural factors (i.e., energy mix, industrial structure, regional structure, and especially demand structure), energy intensity, per capita GDP, and population.
We conduct an empirical analysis on the total energy consumption growth in China. Results show that total energy consumption grew rapidly in 2000–2011, while it slowed down when China entered the “new normal” stage around 2012. Per capita GDP is mainly responsible for energy consumption growth in the “new normal” stage, followed by population, demand structure, and energy mix. Meanwhile, energy intensity, regional structure, and industrial structure contribute to mitigating energy consumption. However, their roles may be changed when investigating the energy consumption deceleration between the “new normal” stage (2012–2017) and the so-called old growth model stage (2006–2011). That is, the per capita GDP becomes the strongest driver of energy consumption deceleration (−3.43% annually); the demand structure and energy mix also slow down the energy consumption growth by −0.28% and −0.01% annually, respectively. The industrial structure contributes to the energy consumption deceleration (−1.67% annually) as an influential driver jest next to the per capita GDP. However, the energy intensity and regional structure accelerate energy consumption growth by 0.24% and 0.24% annually, respectively. Furthermore, we find that energy consumption deceleration is mainly due to economic slowdown (i.e., per capita GDP and population, −3.41% annually) rather than the total effect of structural updates and efficiency gains (i.e., energy mix, industrial structure, regional structure, demand structure, and energy intensity, −1.46% annually). This implies that China’s current development pattern is not sustainable for the slowdown of energy consumption because the energy consumption deceleration is at the expense of economic expansion.
The regional analysis shows that there are only two provinces on the sustainable development path toward energy consumption deceleration in the “new normal” stage relative to the old growth model stage. In other words, the two provinces jointly benefit from economic expansion and energy consumption deceleration. However, the other provinces are either on the unbalanced path or unsustainable path toward energy consumption deceleration. Of the Chinese four municipalities, none of them are on a sustainable path toward energy consumption deceleration; two municipalities, i.e., Tianjin and Chongqing, have an unbalanced development pattern, while the other two, i.e., Beijing and Shanghai, are unsustainable for energy consumption deceleration. We further find that the developed municipalities and provinces are likely to be unsustainable for energy consumption deceleration, while most moderately developed and underdeveloped regions have sustainable or unbalanced development patterns in terms of energy consumption deceleration. Besides, some underdeveloped regions do not make good use of their potential for economic restructuring and efficiency improvements, and thus are on a unsustainable path toward energy consumption deceleration.
Overall, the energy consumption deceleration in China’s “new normal” stage is a positive step toward the ambitious goals of reaching a carbon peak by 2030 and becoming carbon neutral by 2060. However, this study finds that the energy consumption deceleration does not seem sustainable because it is mainly attributed to the economic slowdown. Nevertheless, this situation is likely to change in the future. On the one hand, the economic slowdown in China is slowing down, from −3.4% annually in 2012–2017 (compared to the period 2006–2011) to −1.5% annually in 2018–2021 (compared to the period 2012–2017) [1]. Moreover, the Chinese government put forward in the 14th Five-Year Plan that the economic growth rate will be within a reasonable range, implying that there is little space for further economic slowdown. On the other hand, there will be considerable improvements in energy efficiency and economic structure. For example, the investment in energy R&D will grow by more than 7% annually during the 14th Five-Year Plan period and the energy mix will be further updated, by enhancing the electrification rate to be 30% and the clean electricity ratio to be 39% by 2025 [65]. Besides, it is worth studying the impacts of energy consumption deceleration on economic, environmental, and social changes in the future, so as to conduct a comprehensive evaluation of the slowdown of energy consumption. Besides, the NIDA model is proposed to identify the demand structure effect to investigate as many structural effects as possible in this study. However, the methodology of NIDA needs to be thoroughly discussed and formulated, including mathematical interpretations, application scopes, and advantages compared to the remaining IDA models. Then, the NIDA model could be well and easily applied to other research topics and other countries.
Supplementary Materials
The following supporting information can be downloaded at: https://www.mdpi.com/article/10.3390/su14074233/s1, Table S1: Data for the empirical analysis; Table S2: Detailed decomposition results of seven drivers in log percentage (%).
Author Contributions
Conceptualization, L.C.; methodology, L.C.; data curation, L.C.; writing—original draft preparation, L.C.; writing—review and editing, L.C. and H.W.; funding acquisition, L.C. All authors have read and agreed to the published version of the manuscript.
Funding
This research was funded by the Doctoral Fund Project of Qilu University of Technology (81110399), initiated by Lizhan Cao.
Institutional Review Board Statement
Not applicable.
Informed Consent Statement
Not applicable.
Data Availability Statement
Not applicable.
Conflicts of Interest
The authors declare no conflict of interest.
Appendix A
Table A1.
Comparison between final demand in IO tables and expenditure–approach GDP (%).
Table A1.
Comparison between final demand in IO tables and expenditure–approach GDP (%).
| Year | Final Demand in IO Tables | Expenditure–Approach GDP | ||||
|---|---|---|---|---|---|---|
| Consumption | Investment | Exports | Consumption | Investment | Net Exports | |
| 2000 | 50.2 | 29.1 | 20.8 | 63.9 | 33.7 | 2.4 |
| 2002 | 48.4 | 30.7 | 20.9 | 61.2 | 36.3 | 2.6 |
| 2005 | 39.6 | 32.7 | 27.7 | 54.3 | 40.3 | 5.4 |
| 2007 | 39.0 | 32.8 | 28.2 | 50.9 | 40.4 | 8.7 |
| 2010 | 39.2 | 38.6 | 22.3 | 49.3 | 47.0 | 3.7 |
| 2012 | 41.4 | 37.8 | 20.8 | 51.1 | 46.2 | 2.7 |
| 2015 | 44.6 | 37.2 | 18.2 | 53.7 | 43.0 | 3.2 |
| 2017 | 45.7 | 37.5 | 16.8 | 55.1 | 43.2 | 1.8 |
References
- National Bureau of Statistics of China. Available online: https://data.stats.gov.cn/english/ (accessed on 2 March 2022).
- Zheng, J.; Mi, Z.; Coffman, D.M.; Shan, Y.; Guan, D.; Wang, S. The slowdown in China’s carbon emissions growth in the new phase of economic development. One Earth 2019, 1, 240–253. [Google Scholar] [CrossRef] [Green Version]
- Xu, G.; Wang, W. China’s energy consumption in construction and building sectors: An outlook to 2100. Energy 2020, 195, 117045. [Google Scholar] [CrossRef]
- Green, F.; Stern, N. China’s changing economy: Implications for its carbon dioxide emissions. Clim. Policy 2017, 17, 423–442. [Google Scholar] [CrossRef] [Green Version]
- Chen, A.; Groenewold, N. China’s ‘New Normal’: Is the growth slowdown demand- or supply-driven? China Econ. Rev. 2019, 58, 101203. [Google Scholar] [CrossRef]
- Wang, M.; Feng, C. Decomposition of energy-related CO2 emissions in China: An empirical analysis based on provincial panel data of three sectors. Appl. Energy 2017, 190, 772–787. [Google Scholar] [CrossRef]
- Guan, D.; Meng, J.; Reiner, D.M.; Zhang, N.; Shan, Y.; Mi, Z.; Shao, S.; Liu, Z.; Zhang, Q.; Davis, S.J. Structural decline in China’s CO2 emissions through transitions in industry and energy systems. Nat. Geosci. 2018, 11, 551–555. [Google Scholar] [CrossRef]
- Ou, J.; Meng, J.; Shan, Y.; Zheng, H.; Mi, Z.; Guan, D. Initial declines in China’s provincial energy consumption and their drivers. Joule 2019, 3, 1163–1168. [Google Scholar] [CrossRef]
- Ma, X.; Wang, C.; Dong, B.; Gu, G.; Chen, R.; Li, Y.; Zou, H.; Zhang, W.; Li, Q. Carbon emissions from energy consumption in China: Its measurement and driving factors. Sci. Total Environ. 2019, 648, 1411–1420. [Google Scholar] [CrossRef]
- Liu, H.; Wang, C.; Tian, M.; Wen, F. Analysis of regional difference decomposition of changes in energy consumption in China during 1995–2015. Energy 2019, 171, 1139–1149. [Google Scholar] [CrossRef]
- Zheng, H.; Zhang, Z.; Wei, W.; Song, M.; Dietzenbacher, E.; Wang, X.; Guan, D. Regional determinants of China’s consumption-based emissions in the economic transition. Environ. Res. Lett. 2020, 15, 074001. [Google Scholar] [CrossRef]
- Yan, J.; Su, B. What drive the changes in China’s energy consumption and intensity during 12th Five-Year Plan period? Energy Policy 2020, 140, 111383. [Google Scholar] [CrossRef]
- Yang, J.; Cai, W.; Ma, M.; Li, L.; Liu, C.; Ma, X.; Chen, X. Driving forces of China’s CO2 emissions from energy consumption based on Kaya-LMDI methods. Sci. Total Environ. 2020, 711, 134569. [Google Scholar] [CrossRef] [PubMed]
- Mi, Z.; Meng, J.; Guan, D.; Shan, Y.; Liu, Z.; Wang, Y.; Wei, Y.M. Pattern changes in determinants of Chinese emissions. Environ. Res. Lett. 2017, 12, 074003. [Google Scholar] [CrossRef]
- Mi, Z.; Zheng, J.; Meng, J.; Shan, Y.; Zheng, H.; Ou, J.; Guan, D.; Wei, Y.M. China’s energy consumption in the New Normal. Earth’s Future 2018, 6, 1007–1016. [Google Scholar] [CrossRef]
- Zheng, J.; Mi, Z.; Coffman, D.M.; Milcheva, S.; Shan, Y.; Guan, D.; Wang, S. Regional development and carbon emissions in China. Energy Econ. 2019, 81, 25–36. [Google Scholar] [CrossRef]
- Hoekstra, R.; Der Bergh, J.J. Comparing structural decomposition analysis and index. Energy Econ. 2003, 25, 39–64. [Google Scholar] [CrossRef]
- Wang, H.; Ang, B.W.; Su, B. Assessing drivers of economy-wide energy use and emissions: IDA versus SDA. Energy Policy 2017, 107, 585–599. [Google Scholar] [CrossRef]
- Su, B.; Ang, B.W.; Li, Y. Structural path and decomposition analysis of aggregate embodied energy and emission intensities. Energy Econ. 2019, 83, 345–360. [Google Scholar] [CrossRef]
- Xu, X.Y.; Ang, B.W. Multilevel index decomposition analysis: Approaches and application. Energy Econ. 2014, 44, 375–382. [Google Scholar] [CrossRef]
- De Boer, P.; Rodrigues, J.F.D. Decomposition analysis: When to use which method? Econ. Syst. Res. 2020, 32, 1–28. [Google Scholar] [CrossRef]
- Ang, B.W.; Liu, F. A new energy decomposition method: Perfect in decomposition and consistent in aggregation. Energy 2001, 26, 537–548. [Google Scholar] [CrossRef]
- Ang, B.W.; Choi, K.H. Decomposition of aggregate energy and gas emission intensities for industry: A refined Divisia index method. Energy J. 1997, 18, 59–73. [Google Scholar] [CrossRef]
- Ang, B.W. Decomposition analysis for policymaking in energy: Which is the preferred method? Energy Policy 2004, 32, 1131–1139. [Google Scholar] [CrossRef]
- Chung, H.S.; Rhee, H.C. A residual-free decomposition of the sources of carbon dioxide emissions: A case of the Korean industries. Energy 2001, 26, 15–30. [Google Scholar] [CrossRef]
- Wood, R.; Lenzen, M. Zero-value problems of the logarithmic mean Divisia index decomposition method. Energy Policy 2006, 34, 1326–1331. [Google Scholar] [CrossRef]
- Wu, L.; Kaneko, S.; Matsuoka, S. Dynamics of energy-related CO2 emissions in China during 1980 to 2002: The relative importance of energy supply-side and demand-side effects. Energy Policy 2006, 34, 3549–3572. [Google Scholar] [CrossRef]
- Ang, B.W.; Liu, N. Handling zero values in the logarithmic mean Divisia index decomposition approach. Energy Policy 2007, 35, 238–246. [Google Scholar] [CrossRef]
- Ang, B.W.; Liu, N. Negative-value problems of the logarithmic mean Divisia index decomposition approach. Energy Policy 2007, 35, 739–742. [Google Scholar] [CrossRef]
- Ma, C. A multi-fuel, multi-sector and multi-region approach to index decomposition: An application to China’s energy consumption 1995–2010. Energy Econ. 2014, 42, 9–16. [Google Scholar] [CrossRef]
- Ang, B.W.; Wang, H. Index decomposition analysis with multidimensional and multilevel energy data. Energy Econ. 2015, 51, 67–76. [Google Scholar] [CrossRef]
- Wang, Q.; Wang, Y.; Zhou, P.; Wei, H. Whole process decomposition of energy-related SO2 in Jiangsu Province, China. Appl. Energy 2017, 194, 679–687. [Google Scholar] [CrossRef]
- Huang, J. Industry energy use and structural change: A case study of the People’s Republic of China. Energy Econ. 1993, 15, 131–136. [Google Scholar] [CrossRef]
- Ang, B.W. Multilevel decomposition of industrial energy consumption. Energy Econ. 1995, 17, 39–51. [Google Scholar] [CrossRef]
- Ma, C.; Stern, D.I. China’s changing energy intensity trend: A decomposition analysis. Energy Econ. 2008, 30, 1037–1053. [Google Scholar] [CrossRef] [Green Version]
- Shao, S.; Yang, L.; Gan, C.; Cao, J.; Geng, Y.; Guan, D. Using an extended LMDI model to explore techno-economic drivers of energy-related industrial CO2 emission changes: A case study for Shanghai (China). Renew. Sustain. Energy Rev. 2016, 55, 516–536. [Google Scholar] [CrossRef] [Green Version]
- Zhao, X.; Zhang, X.; Shao, S. Decoupling CO2 emissions and industrial growth in China over 1993–2013: The role of investment. Energy Econ. 2016, 60, 275–292. [Google Scholar] [CrossRef]
- Sun, X.; Liu, X. Decomposition analysis of debt’s impact on China’s energy consumption. Energy Policy 2020, 146, 111802. [Google Scholar] [CrossRef]
- Wang, C. Decomposing energy productivity change: A distance function approach. Energy 2007, 32, 1326–1333. [Google Scholar] [CrossRef]
- Zhou, P.; Ang, B.W. Decomposition of aggregate CO2 emissions: A production-theoretical approach. Energy Econ. 2008, 30, 1054–1067. [Google Scholar] [CrossRef]
- Kim, K.; Kim, Y. International comparison of industrial CO2 emission trends and the energy efficiency paradox utilizing production-based decomposition. Energy Econ. 2012, 34, 1724–1741. [Google Scholar] [CrossRef]
- Lin, B.; Du, K. Decomposing energy intensity change: A combination of index decomposition analysis and production-theoretical decomposition analysis. Appl. Energy 2014, 129, 158–165. [Google Scholar] [CrossRef]
- Li, A.; Zhang, A.; Zhou, Y.; Yao, X. Decomposition analysis of factors affecting carbon dioxide emissions across provinces in China. J. Clean Prod. 2017, 141, 1428–1444. [Google Scholar] [CrossRef]
- Wang, H.; Ang, B.W.; Zhou, P. Decomposing aggregate CO2 emission changes with heterogeneity: An extended production-theoretical approach. Energy J. 2018, 39, 59–79. [Google Scholar] [CrossRef]
- Wang, H.; Zhou, P.; Xie, B.C.; Zhang, N. Assessing drivers of CO2 emissions in China’s electricity sector: A metafrontier production-theoretical decomposition analysis. Eur. J. Oper. Res. 2019, 275, 1096–1107. [Google Scholar] [CrossRef]
- Ang, B.W.; Goh, T. Index decomposition analysis for comparing emission scenarios: Applications and challenges. Energy Econ. 2019, 83, 74–87. [Google Scholar] [CrossRef]
- Arcelus, F.J. An extension of shift-share analysis. Growth Chang. 1984, 15, 3–8. [Google Scholar] [CrossRef]
- Knudsen, D.C. Shift-share analysis: Further examination of models for the description of economic change. Socio-Econ. Plan. Sci. 2000, 34, 177–198. [Google Scholar] [CrossRef]
- Fu, F.; Ma, L.; Li, Z.; Polenske, K.R. The implications of China’s investment-driven economy on its energy consumption and carbon emissions. Energy Conv. Manag. 2014, 85, 573–580. [Google Scholar] [CrossRef]
- The State Council of China. Suggestions of the CPC Central Committee on Formulating the 11th Five-Year Plan. Available online: http://www.gov.cn/ztzl/2005-10/19/content_79386.htm (accessed on 27 March 2022).
- Shao, S.; Yang, Z.; Yang, L.; Ma, S. Can China’s energy intensity constraint policy promote total factor energy efficiency? Evidence from the industrial sector. Energy J. 2019, 40, 101–127. [Google Scholar] [CrossRef]
- Yuan, J.; Xu, Y.; Hu, Z.; Zhao, C.; Xiong, M.; Guo, J. Peak energy consumption and CO2 emissions in China. Energy Policy 2014, 68, 508–523. [Google Scholar] [CrossRef]
- Liu, Z.; Guan, D.; Moore, S.; Lee, H.; Su, J.; Zhang, Q. Climate policy: Steps to China’s carbon peak. Nature 2015, 522, 279. [Google Scholar] [CrossRef] [PubMed] [Green Version]
- Yu, S.; Zheng, S.; Li, X. The achievement of the carbon emissions peak in China: The role of energy consumption structure optimization. Energy Econ. 2018, 74, 693–707. [Google Scholar] [CrossRef]
- Yu, S.; Zheng, S.; Li, X.; Li, L. China can peak its energy-related carbon emissions before 2025: Evidence from industry restructuring. Energy Econ. 2018, 73, 91–107. [Google Scholar] [CrossRef]
- Zeng, Y.; Hesketh, T. The effects of China’s universal two-child policy. Lancet 2016, 388, 1930–1938. [Google Scholar] [CrossRef] [Green Version]
- Fang, D.; Chen, B.; Hubacek, K.; Ni, R.; Chen, L.; Feng, K.; Lin, J. Clean air for some: Unintended spillover effects of regional air pollution policies. Sci. Adv. 2019, 5, eaav4707. Available online: https://www.science.org/doi/full/10.1126/sciadv.aav4707 (accessed on 2 March 2022). [CrossRef] [Green Version]
- The State Council of China. The 14th Five-Year Plan for National Economic and Social Development of the People’s Republic of China and the Outline of Long-Term Objectives for 2035. Available online: http://www.gov.cn/xinwen/2021-03/13/content_5592681.htm (accessed on 2 March 2022).
- The State Council of China. Circular of the State Council on Printing and Distributing Several Provisions on the Implementation of the Law of the People’s Republic of China on Promoting the Transformation of Scientific and Technological Achievements. Available online: http://www.gov.cn/zhengce/content/2016-03/02/content_5048192.htm (accessed on 27 March 2022).
- The State Council of China. Notice of the General Office of the State Council on Printing and Distributing the Action Plan for Promoting the Transfer and Transformation of Scientific and Technological Achievements. Available online: http://www.gov.cn/zhengce/content/2016-05/09/content_5071536.htm (accessed on 27 March 2022).
- Xinhua Daily Telegraph. Available online: http://www.xinhuanet.com/mrdx/2022-01/17/c_1310427627.htm (accessed on 27 March 2022).
- Wang, J.; Dong, X.; Dong, K. How digital industries affect China’s carbon emissions? Analysis of the direct and indirect structural effects. Technol. Soc. 2022, 68, 101911. [Google Scholar] [CrossRef]
- Ma, Q.; Tariq, M.; Mahmood, H.; Khan, Z. The nexus between digital economy and carbon dioxide emissions in China: The moderating role of investments in research and development. Technol. Soc. 2022, 68, 101910. [Google Scholar] [CrossRef]
- Yang, Z.; Shao, S.; Yang, L.; Miao, Z. Improvement pathway of energy consumption structure in China’s industrial sector: From the perspective of directed technical change. Energy Econ. 2018, 72, 166–176. [Google Scholar] [CrossRef]
- The State Council of China. Modern Energy System Planning in the 14th Five-Year Period. Available online: http://www.gov.cn/zhengce/zhengceku/2022-03/23/content_5680759.htm (accessed on 30 March 2022).
- Lin, R.; Liu, Y.; Man, Y.; Ren, J. Towards a sustainable distributed energy system in China: Decision-making for strategies and policy implications. Energy Sustain. Soc. 2019, 9, 1–25. [Google Scholar] [CrossRef] [Green Version]
- Chen, Y.; Shao, S.; Fan, M.; Tian, Z.; Yang, L. One man’s loss is another’s gain: Does clean energy development reduce CO2 emissions in China? Evidence based on the spatial Durbin model. Energy Econ. 2022, 107, 105852. [Google Scholar] [CrossRef]

Publisher’s Note: MDPI stays neutral with regard to jurisdictional claims in published maps and institutional affiliations. |
© 2022 by the authors. Licensee MDPI, Basel, Switzerland. This article is an open access article distributed under the terms and conditions of the Creative Commons Attribution (CC BY) license (https://creativecommons.org/licenses/by/4.0/).