
Examining COVID-19-Related Changes toward More Climate-Friendly Food Consumption in Germany


Abstract
:1. Introduction
1.1. The COVID-19 Pandemic around the World and in Germany
1.2. Changes in (Climate-Friendly) Food Consumption in Response to COVID-19 Restrictions
1.3. Effects of People’s Motivation to Protect the Climate on COVID-19-Related Changes toward More Climate-Friendly Food Consumption
1.4. Research Objectives and Research Hypotheses
2. Materials and Methods
2.1. Data Collection and Studied Samples
2.2. Procedure and Measures
2.2.1. Self-Perceptions of COVID-19-Related Changes during the Period in which the COVID-19 Restrictions Were in Place
2.2.2. Engagement in Diverse Climate-Friendly Food-Consumption Behaviors during the Time Period in which the COVID-19 Restrictions Were in Place and in the Pre-COVID-19 Period
2.2.3. Personal Climate-Protection Norms
2.2.4. Intended Engagement in Diverse Climate-Friendly Food-Consumption Behaviors in an Imagined Post-COVID-19 Period
2.3. Statistical Analyses
3. Results
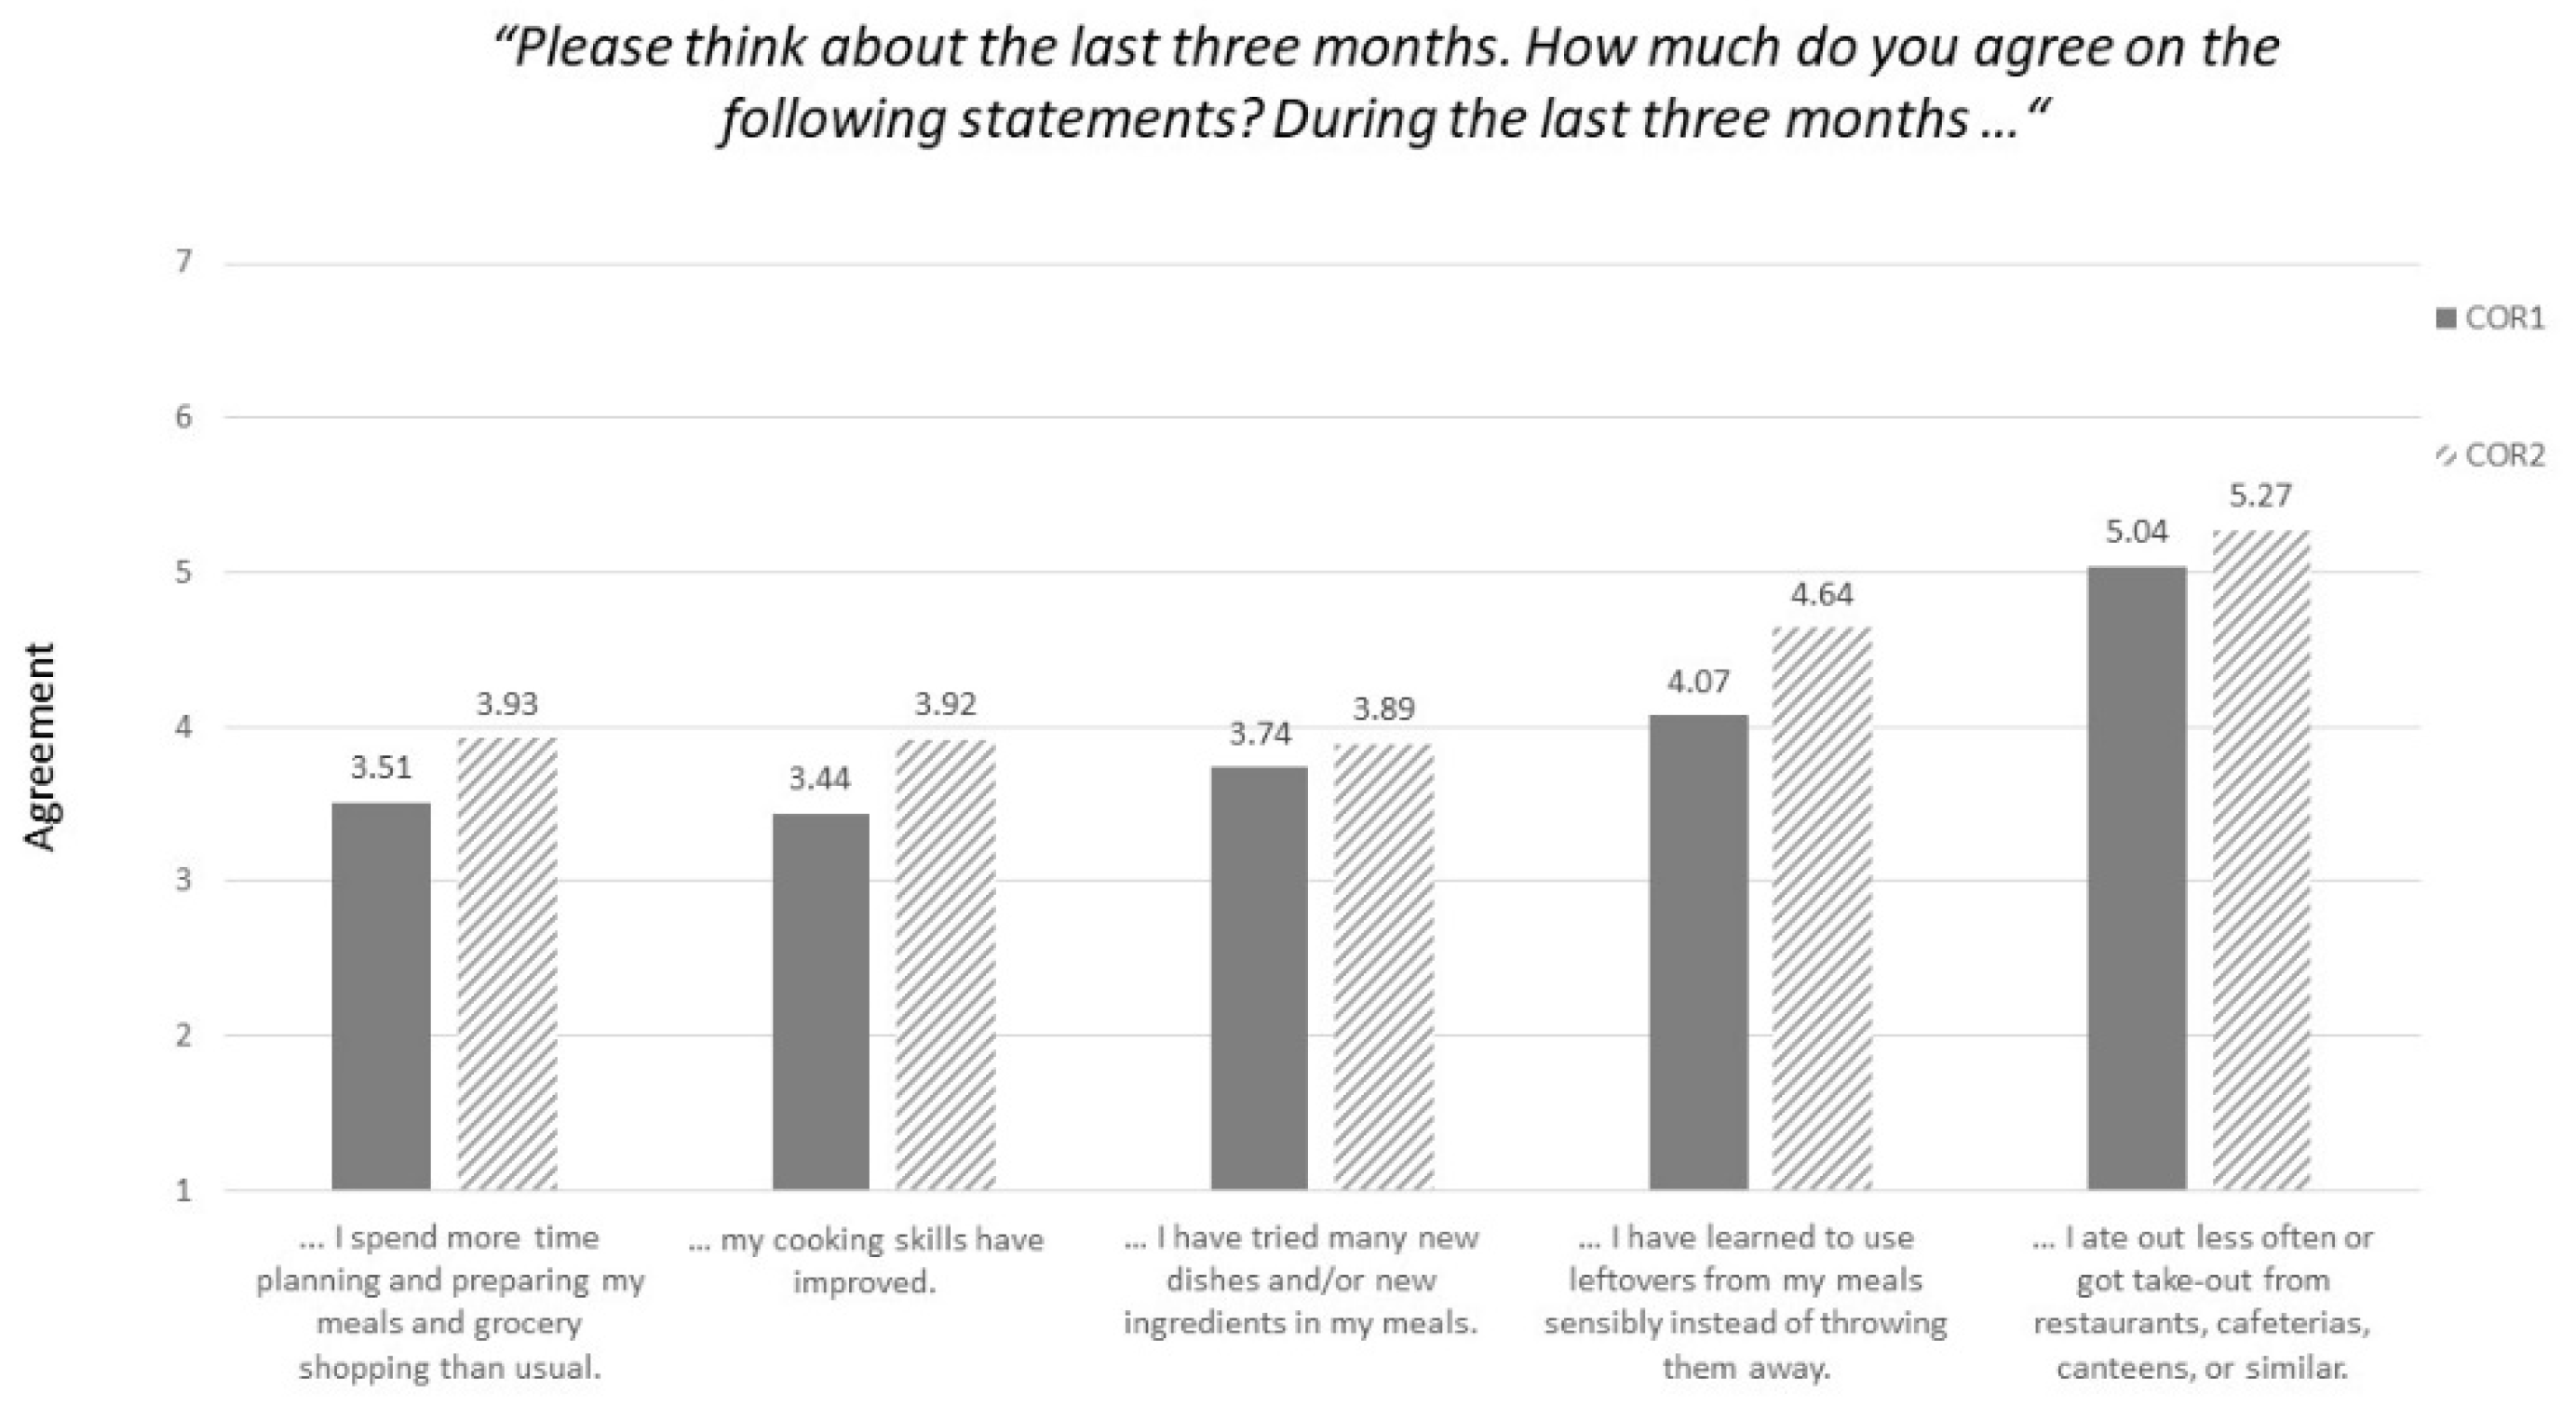
3.1. Consumers’ Self-Perceived COVID-19-Related Changes in Their Daily Food-Consumption Patterns and Their Food-Consumption-Related Beliefs (RQ1)
3.2. COVID-19-Related Changes in People’s Daily Food-Consumption Patterns (RQ2)
3.3. Durability of COVID-19-Related Behavioral Changes with Regard to the Post-COVID-19 Period (RQ3)
3.4. The Role of People’s Personal Climate-Protection Norms for COVID-19-Related Changes toward More Climate-Friendly Food Consumption and with Regard to the Post-COVID-19 Period
3.4.1. Data Analyses for the Identification of Linear Effects
Data Analyses with the COR1 Data
Data Analyses with the COR2 Data
3.4.2. Data Analyses with Regard to Possible Nonlinear Effects
Effects of Personal Norms on COVID-19-Related Changes toward More Climate-Friendly Food Consumption
Effects of Personal Norms with Regard to COVID-19-Related Changes in the Post-COVID-19 Period
4. Discussion
4.1. Evaluation of Results
4.1.1. Consumers’ Self-Perceived COVID-19-Related Changes in Their Daily Food-Consumption and Food-Consumption-Related Beliefs
4.1.2. COVID-19-Related Changes in People’s Food-Consumption Behavioral Patterns with Regard to Long-Term Changes in the Post-COVID-19 Period
4.1.3. Moderating Effects of Personal Climate-Protection Norms on COVID-19-Related Changes toward More Climate-Friendly Food Consumption
4.2. Practical and/or Policy Implications of Our Findings
4.3. Limitations and Implications for Future Research
4.3.1. Limitations for Conclusions about Causality
4.3.2. Limitations Referring to the Measures Used in the Present Study
4.3.3. Limitations Regarding the Generalizability of the Results
5. Conclusions
Author Contributions
Funding
Institutional Review Board Statement
Informed Consent Statement
Data Availability Statement
Acknowledgments
Conflicts of Interest
Appendix A
Appendix B

| Variable | Used in… | Number of Items | Items | Answer Options |
|---|---|---|---|---|
| Self-perceptions of COVID-19-related changes in participants’ daily food-consumption patterns during the period in which the COVID-19 restrictions were in place | COR1 and COR2 | 5 | Please think about the last three months. How much do you agree with the following statements? During the last three months …
| Completely disagree (1) to completely agree (7), I don’t know |
| Self-perceptions of COVID-19-related changes in participants’ food-consumption-related beliefs during the period in which the COVID-19 restrictions were in place | COR1 and COR2 | 5 | Please think about the last three months. How much do you agree with the following statements? On the basis of my experiences in the last three months …
| Completely disagree (1) to completely agree (7), I don´t know |
| Engagement in diverse climate-friendly food-consumption behaviors during the time period in which the COVID-19 restrictions were in place and in the pre-COVID-19 period (a) | COR1 | 1 | Meat consumption: Please think about the last 3 (12) months. How often did you consume meat in your main meal? | daily; six times a week; four to five times a week; two to three times a week; once a week or less; never |
| 1 | Consumption of organic food: Please think about the last 3 (12) months. How often did you engage in the following activities? I bought groceries from an establishment that guarantees controlled organic cultivation | Never (1) to always (6), I don´t know | ||
| 1 | Household food waste: Please think about the last 3 (12) months. How often did you throw food away at home in an average month? | Daily, several times a week, once a week, several times a month, once a month, never, I don’t know | ||
| COR2 | 3 | Meat consumption: Please think about the last 3 (12) months. How often did you consume meat in your main meal?
| Never (1), one day per week (2) to 6 or 7 days per week (7), I don’t know | |
| COR2 | 1 | Consumption of organic food: Please think about the last 3 (12) months. How often did you engage in the following activities? I bought groceries from an establishment that guarantees controlled organic cultivation. | Never (1) to always (7), I don´t know | |
| COR2 | 1 | Household food waste: […] Out of all the foods that you bought per week for your household—please estimate the amount of food that was spoiled and/or thrown out? | Nothing (1), less than 10% (2), 11–20% (3), 21–30% (4), 31–40% (5), 41–50% (6), more than 50% (7), I don’t know | |
| COR2 | 1 | Consumption of regionally produced food: Please think about the last 3 (12) months. How often did you engage in the following activities? I bought regionally produced food. | Never (1) to always (7), I don´t know | |
| COR2 | 1 | Consumption of in-season produced food: Please think about the last 3 (12) months. How often did you engage in the following activities? I bought in-season food. | Never (1) to always (7), I don´t know | |
| COR2 | 1 | Consumption of food with less plastic packaging: Please think about the last 3 (12) months. How often did you engage in the following activities? I bought less plastic packaging. | Never (1) to always (7), I don´t know | |
| COR2 | 1 | Consumption of ready-made meals: Please think about the last 3 (12) months. How often did you engage in the following activities? I bought ready-made meals. | Never (1), one day per week (2) to 6 or 7 days per week (7), I don´t know | |
| Personal climate-protection norms | COR1 and COR2 | 3 | To what extent do you agree with the following statements?
| Do not agree at all (1) to completely agree (7), I don´t know |
References
- Büchel, B.; Marra, A.D.; Corman, F. COVID-19 as a window of opportunity for cycling: Evidence from the first wave. Transp. Policy 2022, 116, 144–156. [Google Scholar] [CrossRef]
- Schmidt, K.; Sieverding, T.; Wallis, H.; Matthies, E. COVID-19—A window of opportunity for the transition toward sustainable mobility? Transp. Res. Interdiscip. Perspect. 2021, 10, 100374. [Google Scholar] [CrossRef]
- Krämer, A. Mobilität nach der Corona-Krise. Die Karten werden neu gemischt—Bestimmungsfaktoren für die Entwicklung der Gesamtmobilität sowie der relativen Wettbewerbsposition der Verkehrsträger. Int. Verk. 2020, 3, 89–93. [Google Scholar]
- Ivanova, D.; Stadler, K.; Steen-Olsen, K.; Wood, R.; Vita, G.; Tukker, A.; Hertwich, E.G. Environmental Impact Assessment of Household Consumption. J. Ind. Ecol. 2016, 20, 526–536. [Google Scholar] [CrossRef]
- Gerber, P.J.; Steinfeld, H.; Henderson, B.; Mottet, A.; Opio, C.; Dijkman, J.; Falcucci, A.; Tempio, G. Tackling Climate Change Through Livestock: A Global Assessment of Emissions and Mitigation Opportunities. Available online: https://www.fao.org/3/i3437e/i3437e.pdf (accessed on 10 February 2022).
- Intergovernmental Panel on Climate Change. Climate Change and Land. An IPCC Special Report on Climate Change, Desertification, Land Degradation, Sustainable Land Management, Food Security, and Greenhouse Gas Fluxes in Terrestrial Ecosystems. Available online: https://www.ipcc.ch/site/assets/uploads/2019/08/4.-SPM_Approved_Microsite_FINAL.pdf (accessed on 14 February 2022).
- Springmann, M.; Godfray, H.C.J.; Rayner, M.; Scarborough, P. Analysis and valuation of the health and climate change cobenefits of dietary change. PNAS 2016, 113, 4146–4151. [Google Scholar] [CrossRef] [PubMed] [Green Version]
- Piochi, M.; Buonocore, F.; Spampani, F.; Torri, L. Impact of COVID-19 lockdown on the perception of home meals and meal-related variables: A large-scale study within the Italian population during the acute phase of the pandemic. Food Qual. Prefer. 2021, 98, 104488. [Google Scholar] [CrossRef] [PubMed]
- Benker, B. Stockpiling as resilience: Defending and contextualising extra food procurement during lockdown. Appetite 2021, 156, 104981. [Google Scholar] [CrossRef] [PubMed]
- Lehberger, M.; Kleih, A.-K.; Sparke, K. Panic buying in times of coronavirus (COVID-19): Extending the theory of planned behavior to understand the stockpiling of nonperishable food in Germany. Appetite 2021, 161, 105118. [Google Scholar] [CrossRef]
- Wang, E.; An, N.; Gao, Z.; Kiprop, E.; Geng, X. Consumer food stockpiling behavior and willingness to pay for food reserves in COVID-19. Food Sec. 2020, 12, 739–747. [Google Scholar] [CrossRef]
- Jaeger, S.R.; Vidal, L.; Ares, G.; Chheang, S.L.; Spinelli, S. Healthier eating: Covid-19 disruption as a catalyst for positive change. Food Qual. Prefer. 2021, 92, 104220. [Google Scholar] [CrossRef]
- Jia, P.; Liu, L.; Xie, X.; Yuan, C.; Chen, H.; Guo, B.; Zhou, J.; Yang, S. Changes in dietary patterns among youths in China during COVID-19 epidemic: The COVID-19 impact on lifestyle change survey (COINLICS). Appetite 2021, 158, 105015. [Google Scholar] [CrossRef] [PubMed]
- Molina-Montes, E.; Uzhova, I.; Verardo, V.; Artacho, R.; García-Villanova, B.; Jesús Guerra-Hernández, E.; Kapsokefalou, M.; Malisova, O.; Vlassopoulos, A.; Katidi, A.; et al. Impact of COVID-19 confinement on eating behaviours across 16 European countries: The COVIDiet cross-national study. Food Qual. Prefer. 2021, 93, 104231. [Google Scholar] [CrossRef]
- Sato, K.; Kobayashi, S.; Yamaguchi, M.; Sakata, R.; Sasaki, Y.; Murayama, C.; Kondo, N. Working from Home and Dietary Changes during the COVID-19 Pandemic: A Longitudinal Study of Health App (CALO Mama) Users. Appetite 2021, 165, 105323. [Google Scholar] [CrossRef] [PubMed]
- Marty, L.; de Lauzon-Guillain, B.; Labesse, M.; Nicklaus, S. Food choice motives and the nutritional quality of diet during the COVID-19 lockdown in France. Appetite 2021, 157, 105005. [Google Scholar] [CrossRef] [PubMed]
- Palmer, K.; Bschaden, A.; Stroebele-Benschop, N. Changes in lifestyle, diet, and body weight during the first COVID 19 ‘lockdown’ in a student sample. Appetite 2021, 167, 105638. [Google Scholar] [CrossRef]
- Rahman, C.F.; Khan, S.; Kumar, R.; Chand, S.; Bardhan, D.; Dhama, K. Impact of COVID-19 pandemic and lockdown on the meat consumption pattern in India: A preliminary analysis. J. Exp. Biol. Agric. Sci. 2021, 9, 172–182. [Google Scholar] [CrossRef]
- Sulejmani, E.; Hyseni, A.; Xhabiri, G.; Rodríguez-Pérez, C. Relationship in dietary habits variations during COVID-19 lockdown in Kosovo: The COVIDiet study. Appetite 2021, 164, 105244. [Google Scholar] [CrossRef] [PubMed]
- Amicarelli, V.; Lagioia, G.; Sampietro, S.; Bux, C. Has the COVID-19 pandemic changed food waste perception and behavior? Evidence from Italian consumers. Socio-Econ. Plan. Sci. 2021, 101095. [Google Scholar] [CrossRef]
- Principato, L.; Secondi, L.; Cicatiello, C.; Mattia, G. Caring more about food: The unexpected positive effect of the Covid-19 lockdown on household food management and waste. Socio-Econ. Plan. Sci. 2020, 100953. [Google Scholar] [CrossRef]
- Filimonau, V.; Le Vi, H.; Beer, S.; Ermolaev, V.A. The COVID-19 pandemic and food consumption at home and away: An exploratory study of English households. Socio-Econ. Plan. Sci. 2021, 101125. [Google Scholar] [CrossRef]
- Kalra, S.; Dixit, S.; Lyall, B.W. ‘Health Halo’: A new opportunity for Organic Food in COVID upsurge. J. Univ. Shanghai Sci. Technol. 2021, 23, 113–119. [Google Scholar] [CrossRef]
- Li, S.; Kallas, Z.; Rahmani, D. Did the COVID-19 lockdown affect consumers’ sustainable behaviour in food purchasing and consumption in China? Food Control. 2022, 132, 108352. [Google Scholar] [CrossRef]
- Hempel, C.; Roosen, J. The role of life satisfaction and locus of control in changing purchase intentions for organic and local food during the pandemic. Food Qual. Prefer. 2022, 96, 104430. [Google Scholar] [CrossRef] [PubMed]
- Vermeir, I.; Weijters, B.; de Houwer, J.; Geuens, M.; Slabbinck, H.; Spruyt, A.; van Kerckhove, A.; van Lippevelde, W.; de Steur, H.; Verbeke, W. Environmentally Sustainable Food Consumption: A Review and Research Agenda From a Goal-Directed Perspective. Front. Psychol. 2020, 11, 1603. [Google Scholar] [CrossRef] [PubMed]
- Steg, L.; Norlund, A. Theories to explain environmental behaviour. In Environmental Psychology: An Introduction; Steg, L., van den Berg, A., de Groot, J.I.M., Eds.; Wiley-Blackwell: West Sussex, UK, 2018; pp. 217–227. [Google Scholar]
- Stoll-Kleemann, S.; Schmidt, U.J. Reducing meat consumption in developed and transition countries to counter climate change and biodiversity loss: A review of influence factors. Reg Env. Change 2017, 17, 1261–1277. [Google Scholar] [CrossRef] [Green Version]
- Zur, I.; Klöckner, C.A. Individual motivations for limiting meat consumption. Br. Food J. 2014, 116, 629–642. [Google Scholar] [CrossRef]
- Rees, J.H.; Bamberg, S.; Jäger, A.; Victor, L.; Bergmeyer, M.; Friese, M. Breaking the Habit: On the Highly Habitualized Nature of Meat Consumption and Implementation Intentions as One Effective Way of Reducing It. Basic Appl. Soc. Psychol. 2018, 40, 136–147. [Google Scholar] [CrossRef]
- Hunecke, M.; Blöbaum, A.; Matthies, E.; Höger, R. Responsibility and Environment: Ecological Norm Orientation and External Factors in the Domain of Travel Mode Choice Behavior. Environ. Behav. 2001, 33, 830–852. [Google Scholar] [CrossRef]
- Klöckner, C.A.; Matthies, E. How habits interfere with norm directed behavior—A normative decision-making model for travel mode choice. J. Environ. Psychol. 2004, 24, 319–327. [Google Scholar] [CrossRef]
- Matthies, E.; Klöckner, C.A.; Preißner, C.L. Applying a Modified Moral Decision Making Model to Change Habitual Car Use: How Can Commitment be Effective? Appl. Psychol. 2006, 55, 91–106. [Google Scholar] [CrossRef]
- Verplanken, B.; Roy, D. Empowering interventions to promote sustainable lifestyles: Testing the habit discontinuity hypothesis in a field experiment. J. Environ. Psychol. 2016, 45, 127–134. [Google Scholar] [CrossRef] [Green Version]
- Fujii, S.; Gärling, T.; Kitamura, R. Changes in Drivers’ Perceptions and Use of Public Transport during a Freeway Closure: Effects of Temporary Structural Change on Cooperation in a Real-Life Social Dilemma. Environ. Behav. 2001, 33, 796–808. [Google Scholar] [CrossRef]
- Lattarulo, P.; Masucci, V.; Pazienza, M.G. Resistance to change: Car use and routines. Transp. Policy 2019, 74, 63–72. [Google Scholar] [CrossRef]
- Statistisches Bundesamt (Destatis). Bevölkerung (ab 15 Jahren): Deutschland, Jahre, Geschlecht, Altersgruppen, Allgemeine Schulausbildung. Available online: https://www-genesis.destatis.de/genesis/online?operation=abruftabelleBearbeiten&levelindex=1&levelid=1597236231177&auswahloperation=abruftabelleAuspraegungAuswaehlen&auswahlverzeichnis=ordnungsstruktur&auswahlziel=werteabruf&code=12211-0040&auswahltext=&werteabruf=starten#abreadcrumb (accessed on 17 December 2020).
- Statistisches Bundesamt (Destatis). Bevölkerung nach Geschlecht und Staatsangehörigkeit. Available online: https://www.destatis.de/DE/Themen/Gesellschaft-Umwelt/Bevoelkerung/Bevoelkerungsstand/Tabellen/zensus-geschlecht-staatsangehoerigkeit-2019.html (accessed on 17 December 2020).
- Statistisches Bundesamt (Destatis). Durchschnittsalter Nach Geschlecht und Staatsangehörigkeit 2011 bis 2019. Available online: https://www.destatis.de/DE/Themen/Gesellschaft-Umwelt/Bevoelkerung/Bevoelkerungsstand/Tabellen/durchschnittsalter-zensus-jahre.html (accessed on 17 December 2020).
- Statistisches Bundesamt (Destatis). Nettoeinkommen Privater Haushalte nach Haushaltstyp. Available online: https://www.destatis.de/DE/Themen/Gesellschaft-Umwelt/Einkommen-Konsum-Lebensbedingungen/_Grafik/_Interaktiv/einnahmen-ausgaben-haushaltstypen.html (accessed on 31 March 2021).
- Gliem, J.A.; Gliem, R.R. Calculating, Interpreting, And Reporting Cronbach’s Alpha Reliability Coefficient For Likert-Type Scales 2003. Available online: https://scholarworks.iupui.edu/handle/1805/344 (accessed on 17 December 2020).
- Field, A. Discovering Statistics Using IBM SPSS Statistics; Sage: New York, NY, USA, 2013. [Google Scholar]
- Poelman, M.P.; Gillebaart, M.; Schlinkert, C.; Dijkstra, S.C.; Derksen, E.; Mensink, F.; Hermans, R.C.J.; Aardening, P.; de Ridder, D.; de Vet, E. Eating behavior and food purchases during the COVID-19 lockdown: A cross-sectional study among adults in the Netherlands. Appetite 2021, 157, 105002. [Google Scholar] [CrossRef] [PubMed]
- Caso, D.; Guidetti, M.; Capasso, M.; Cavazza, N. Finally, the chance to eat healthily: Longitudinal study about food consumption during and after the first COVID-19 lockdown in Italy. Food Qual. Prefer. 2022, 95, 104275. [Google Scholar] [CrossRef] [PubMed]
- Snuggs, S.; McGregor, S. Food & meal decision making in lockdown: How and who has Covid-19 affected? Food Qual. Prefer. 2021, 89, 104145. [Google Scholar] [CrossRef] [PubMed]
- Rodgers, R.F.; Lombardo, C.; Cerolini, S.; Franko, D.L.; Omori, M.; Linardon, J.; Guillaume, S.; Fischer, L.; Tyszkiewicz, M.F. “Waste not and stay at home” evidence of decreased food waste during the COVID-19 pandemic from the U.S. and Italy. Appetite 2021, 160, 105110. [Google Scholar] [CrossRef] [PubMed]
- Bauer, J.M.; Nielsen, K.S.; Hofmann, W.; Reisch, L.A. Healthy eating in the wild: An experience-sampling study of how food environments and situational factors shape out-of-home dietary success. Soc. Sci. Med. 2022, 299, 114869. [Google Scholar] [CrossRef] [PubMed]
- Roy, M.M.; Christenfeld, N.J.S.; McKenzie, C.R.M. Underestimating the Duration of Future Events: Memory Incorrectly Used or Memory Bias? Psychol. Bull. 2005, 131, 738–756. [Google Scholar] [CrossRef] [PubMed] [Green Version]
- Nederhof, A.J. Methods of coping with social desirability bias: A review. Eur. J. Soc. Psychol. 1985, 15, 263–280. [Google Scholar] [CrossRef]
- Matthies, E.; Sieverding, T.; Schmidt, K.; Wallis, H. Stärken die Corona-Maßnahmen den Dringend Notwendigen Wandel zu Einer Nachhaltigen Mobilität und Einer Stärker Regulierenden Klimaschutzpolitik? Eine Parallele Querschnittserhebung zu Mobilitätsverhalten und Politikunterstützung drei Monate nach Beginn der Krise. Available online: http://www.ipsy.ovgu.de/ipsy_media/umweltpsychologie/Matthies+et+al_+2020-p-3266.pdf (accessed on 17 December 2020).
- Shepherd, R.; Raats, M. The Psychology of Food Choice; CABI: Wallingford, UK, 2006; ISBN 9781845930868. [Google Scholar]
- Witek, L.; Kuźniar, W. Green Purchase Behavior: The Effectiveness of Sociodemographic Variables for Explaining Green Purchases in Emerging Market. Sustainability 2021, 13, 209. [Google Scholar] [CrossRef]
- Verain, M.C.D.; Dagevos, H.; Antonides, G. Sustainable food consumption. Product choice or curtailment? Appetite 2015, 91, 375–384. [Google Scholar] [CrossRef]
- Reisch, L.; Eberle, U.; Lorek, S. Sustainable food consumption: An overview of contemporary issues and policies. Sustain. Sci. Pract. Policy 2013, 9, 7–25. [Google Scholar] [CrossRef]
- WBW Beirat. Klimaschutz in der Land-und Forstwirtschaft Sowie den Nachgelagerten Bereichen Ernährung und Holzverwendung. Available online: https://www.buel.bmel.de/index.php/buel/article/download/149/Klimaschutzgutachten-05.pdf (accessed on 17 December 2020).

| COR1 Survey (N = 3092) | COR2 Survey (N = 300) | German Population | |||
|---|---|---|---|---|---|
| Age | M = 44.86 (SD = 14.39) | M = 51.91 (SD = 16.29) | M = 44.40 | ||
| Gender | Female | 50.5% | 51.2% | 50.6% | |
| Male | 49.2% | 48.8% | 49.4% | ||
| Highest level of education | Did not complete high school | 0.4% | 0.5% | 4.0% | |
| Completed high school | 31.5% | 13.5% | 29.6% | ||
| Secondary education | 30.8% | 36.6% | 23.3% | ||
| Higher-education entrance qualification | 37.2% | 39.9% | 32.5% | ||
| Income | <EUR 900 | 7.2% | <EUR 600 | 3.7 | M = EUR 3580 |
| EUR 900 to EUR 1300 | 8.0% | EUR 601–EUR 1500 | 13.3 | ||
| EUR 1301 to EUR 1500 | 5.4% | EUR 1501–EUR 3000 | 39.3 | ||
| EUR 1501 to EUR 2000 | 9.4% | EUR 3001–EUR 4500 | 32.0 | ||
| EUR 2001 to EUR 2600 | 14.4% | EUR 4501–EUR 6000 | 8.7 | ||
| EUR 2601 to EUR 4000 | 27.7% | >EUR 6000 | 3.0 | ||
| >EUR 4000 | 28% | ||||
| Size of household | 1 | 21.2 | 21.9 | 42.3 | |
| 2 | 39.9 | 41.8 | 33.2 | ||
| 3 | 19.6 | 19.1 | 11.9 | ||
| 4 | 14.1 | 17.2 (4 and more) | 9.1 | ||
| 5 or more | 5.2 | 3.5 | |||
| Self-Reported Changes in Food-Consumption Behavioral Patterns | Sample | N | M | SD |
|---|---|---|---|---|
| I spend more time planning and preparing my meals and grocery shopping than usual | Cor1 | 3030 | 3.51 | 2.12 |
| Cor2 | 296 | 3.93 | 1.97 | |
| My cooking skills have improved. | Cor1 | 2957 | 3.44 | 2.03 |
| Cor2 | 292 | 3.92 | 2.06 | |
| I have tried many new dishes and/or new ingredients in my meals. | Cor1 | 3045 | 3.74 | 2.02 |
| Cor2 | 297 | 3.89 | 1.93 | |
| I have learned to use leftovers from my meals sensibly instead of throwing them away. | Cor1 | 2988 | 4.07 | 2.08 |
| Cor2 | 294 | 4.64 | 1.98 | |
| I ate out less often or got take-out from restaurants, cafeterias, canteens, or similar. | Cor1 | 3013 | 5.04 | 2.16 |
| Cor2 | 297 | 5.27 | 1.99 |
| Self-Perceived Changes in Food-Consumption-Related Beliefs | Sample | N | M | SD |
|---|---|---|---|---|
| My cooking and eating habits have changed overall. | Cor1 | 3038 | 3.39 | 1.98 |
| Cor2 | 298 | 3.84 | 1.95 | |
| Overall, I have focused on my own diet more than before. | Cor1 | 3043 | 3.40 | 2.01 |
| Cor2 | 294 | 4.05 | 1.93 | |
| I view food as a more valuable resource than before. | Cor1 | 3015 | 3.99 | 2.05 |
| Cor2 | 297 | 4.68 | 1.77 | |
| I would be willing to pay higher prices for groceries than before. | Cor1 | 3013 | 3.65 | 1.94 |
| Cor2 | 297 | 3.84 | 1.86 | |
| It has become easier for me to stick with my self-determined diet. | Cor1 | 2958 | 3.72 | 1.93 |
| Cor2 | 293 | 4.25 | 1.79 |
| Sample | Type of Climate-Friendly Food Consumption | N | MCOVID-19 (SD) | MPRE (SD) | t | df | p |
|---|---|---|---|---|---|---|---|
| Cor1 | Meat consumption | 3061 | 3.09 (1.10) | 3.14 (1.09) | −5.822 | 3060 | 0.001 *** |
| Consumption of organic food | 2860 | 3.26 (1.37) | 3.20 (1.36) | 6.846 | 2859 | 0.001 *** | |
| Cor2 | Meat consumption | 297 | 2.54 (0.86) | 2.63 (0.87) | −3.395 | 296 | 0.01 ** |
| Consumption of organic food | 297 | 3.34 (1.64) | 3.34 (1.69) | −0.036 | 294 | 0.97 | |
| Household food waste | 297 | 1.98 (0.79) | 2.12 (0.82) | −4.686 | 299 | 0.001 *** | |
| Consumption of regionally produced food | 297 | 4.69 (1.26) | 4.56 (1.28) | 2.613 | 293 | 0.01 ** | |
| Consumption of in-season food | 297 | 5.03 (1.29) | 4.74 (1.26) | 6.000 | 291 | 0.001 *** | |
| Consumption of food with less plastic packaging | 297 | 4.57 (1.47) | 4.42 (1.52) | 2.913 | 283 | 0.01 ** | |
| Consumption of ready-made meals | 297 | 2.11 (1.28) | 2.20 (1.32) | −1.916 | 284 | 0.06 |
| Sample | Type of Climate-Friendly Food Consumption | N | MPOST (SD) | MPRE (SD) | t | df | p |
|---|---|---|---|---|---|---|---|
| COR1 | Meat consumption | 3029 | 2.91 (1.06) | 3.14 (1.09) | 21.591 | 3028 | 0.001 *** |
| Consumption of organic food | 2825 | 3.55 (1.43) | 3.22 (1.35) | −24.325 | 2824 | 0.001 *** | |
| COR2 | Meat consumption | 297 | 2.59 (0.95) | 2.63 (0.87) | 1.207 | 294 | 0.23 |
| Consumption of organic food | 297 | 3.70 (1.78) | 3.34 (1.69) | −7.323 | 292 | 0.001 *** | |
| Household food waste | 297 | 1.87 (0.62) | 2.12 (0.82) | 8.657 | 299 | 0.001 *** | |
| Consumption of regionally produced food | 297 | 4.97 (1.33) | 4.56 (1.28) | −7.637 | 293 | 0.001 *** | |
| Consumption of in-season food | 297 | 5.03 (1.31) | 4.74 (1.26) | −6.838 | 289 | 0.001 *** | |
| Consumption of food with less plastic packaging | 297 | 4.83 (1.58) | 4.43 (1.53) | −7.887 | 280 | 0.001 *** | |
| Consumption of ready-made meals | 297 | 2.05 (1.25) | 2.20 (1.33) | 4.319 | 279 | 0.001 *** |
| Dependent Variables | N | Explained Variance | Independent Variables | ß | p | |
|---|---|---|---|---|---|---|
| Changes toward climate-friendly food consumption during the COVID-19 restrictions compared with the pre-COVID-19 period | Reduced meat consumption | 3009 | 0.03% | Age | −0.01 | 0.56 |
| Gender | −0.01 | 0.77 | ||||
| Education | 0.03 | 0.14 | ||||
| Income | −0.04 | 0.05 * | ||||
| Personal climate-protection norms | 0.05 | 0.01 ** | ||||
| Increased consumption of organic food | 2826 | 0.02% | Age | 0.01 | 0.66 | |
| Gender | 0.01 | 0.53 | ||||
| Education | −0.04 | 0.08 | ||||
| Income | 0.04 | 0.08 | ||||
| Personal climate-protection norms | −0.04 | 0.04 * | ||||
| Changes toward more climate-friendly food consumption during the post-COVID-19 period compared with the pre-COVID-19 period | Intention to reduce meat consumption | 2980 | 0.2% | Age | −0.09 | 0.001 *** |
| Gender | −0.05 | 0.01 ** | ||||
| Education | 0.01 | 0.65 | ||||
| Income | 0.01 | 0.48 | ||||
| Personal climate-protection norms | 0.09 | 0.001 *** | ||||
| Intention to increase consumption of organic food | 2791 | 0.1% | Age | 0.10 | 0.001 *** | |
| Gender | 0.03 | 0.18 | ||||
| Education | 0.01 | 0.74 | ||||
| Income | 0.02 | 0.25 | ||||
| Personal climate-protection norms | −0.05 | 0.05 * | ||||
| Dependent Variables | N | Explained Variance | Independent Variables | ß | p | |
|---|---|---|---|---|---|---|
| Changes towards climate-friendly food consumption during the time period when the COVID-19 restrictions were in place compared with pre-COVID-19 period | Reduced meat consumption | 269 | −0.2% | Age | −0.00 | 0.25 |
| Gender | −0.02 | 0.70 | ||||
| Education | 0.01 | 0.42 | ||||
| Income | 0.00 | 0.89 | ||||
| Personal climate-protection norms | 0.02 | 0.20 | ||||
| Reduced household food waste | 272 | 3.9% | Age | −0.00 | 0.28 | |
| Gender | 0.17 | 0.01 ** | ||||
| Education | 0.01 | 0.60 | ||||
| Income | 0.07 | 0.02 * | ||||
| Personal climate-protection norms | −0.006 | 0.75 | ||||
| Reduced consumption of ready-made meals | 258 | 3.8% | Age | −0.01 | 0.01 ** | |
| Gender | 0.21 | 0.02 * | ||||
| Education | −0.00 | 0.98 | ||||
| Income | −0.04 | 0.38 | ||||
| Personal climate-protection norms | −0.01 | 0.67 | ||||
| Increased consumption of organic food | 269 | −1.2% | Age | 0.00 | 0.78 | |
| Gender | −0.02 | 0.83 | ||||
| Education | −0.03 | 0.34 | ||||
| Income | 0.01 | 0.82 | ||||
| Personal climate-protection norms | −0.02 | 0.49 | ||||
| Increased consumption of regionally produced food | 267 | 0.5% | Age | −0.00 | 0.51 | |
| Gender | −0.03 | 0.74 | ||||
| Education | −0.04 | 0.32 | ||||
| Income | 0.04 | 0.44 | ||||
| Personal climate-protection norms | −0.60 | 0.05 | ||||
| Increased consumption of in-season food | 266 | 0.01 | Age | −0.08 | 0.21 | |
| Gender | −0.05 | 0.44 | ||||
| Education | 0.04 | 0.56 | ||||
| Income | −0.10 | 0.14 | ||||
| Personal climate-protection norms | −0.13 | 0.04 * | ||||
| Increased consumption of food with less packaging | 259 | −1.7% | Age | 0.00 | 0.96 | |
| Gender | −0.05 | 0.63 | ||||
| Education | −0.01 | 0.87 | ||||
| Income | 0.00 | 0.95 | ||||
| Personal climate-protection norms | 0.02 | 0.52 | ||||
| Changes toward more climate-friendly food consumption during the post-COVID-19 period compared with the pre-COVID-19 period | Intention to reduce meat consumption | 268 | −0.7% | Age | −0.00 | 0.37 |
| Gender | −0.08 | 0.21 | ||||
| Education | 0.01 | 0.59 | ||||
| Income | −0.01 | 0.82 | ||||
| Personal climate-protection norms | 0.02 | 0.41 | ||||
| Intention to reduce household food waste | 272 | 10.8% | Age | −0.33 | 0.001 *** | |
| Gender | 0.12 | 0.04 * | ||||
| Education | 0.02 | 0.30 | ||||
| Income | 0.01 | 0.71 | ||||
| Personal climate-protection norms | −0.02 | 0.25 | ||||
| Intention to reduce consumption of ready-made meals | 254 | 5.0% | Age | −0.24 | 0.001 *** | |
| Gender | 0.05 | 0.45 | ||||
| Education | 0.03 | 0.22 | ||||
| Income | 0.01 | 0.73 | ||||
| Personal climate-protection norms | 0.01 | 0.60 | ||||
| Intention to increase consumption of organic food | 267 | 1.7% | Age | 0.13 | 0.05 * | |
| Gender | −0.19 | 0.06 | ||||
| Education | −0.03 | 0.51 | ||||
| Income | 0.03 | 0.63 | ||||
| Personal climate-protection norms | −0.02 | 0.52 | ||||
| Intention to increase consumption of regionally produced food | 268 | 1.0% | Age | −0.00 | 0.83 | |
| Gender | −0.27 | 0.02 * | ||||
| Education | −0.04 | 0.37 | ||||
| Income | 0.01 | 0.93 | ||||
| Personal climate-protection norms | −0.02 | 0.53 | ||||
| Intention to increase consumption of in-season food | 264 | 7.1% | Age | 0.12 | 0.06 | |
| Gender | −0.19 | 0.01 ** | ||||
| Education | −0.11 | 0.08 | ||||
| Income | −0.01 | 0.91 | ||||
| Personal climate-protection norms | −0.11 | 0.06 | ||||
| Intention to increase consumption of food with less packaging | 255 | 0.1% | Age | 0.00 | 0.80 | |
| Gender | −0.11 | 0.32 | ||||
| Education | −0.02 | 0.59 | ||||
| Income | 0.09 | 0.12 | ||||
| Personal climate-protection norms | −0.03 | 0.32 | ||||
| Sample | Type of Climate-Friendly Food Consumption | Group | N | M (SD)PRE | M (SD)COVID-19 | Time | Personal Norms | Interaction | |||
|---|---|---|---|---|---|---|---|---|---|---|---|
| F | p | F | p | F | p | ||||||
| COR1 | Meat consumption | Low | 1425 | 3.32 (1.08) | 3.30 (1.12) | 2.892 | 0.09 | 89.445 | 0.001 *** | 10.460 | 0.01 ** |
| High | 1584 | 2.97 (1.07) | 2.90 (1.06) | ||||||||
| Consumption of organic food | Low | 1291 | 2.71 (1.31) | 2.76 (1.32) | 2.824 | 0.09 | 355.786 | 0.001 *** | 3.486 | 0.07 | |
| High | 1535 | 3.61 (1.35) | 3.69 (1.25) | ||||||||
| COR2 | Meat consumption | Low | 158 | 2.63 (0.86) | 2.62 (0.89) | 0.964 | 0.33 | 0.068 | 0.79 | 7.903 | 0.01 ** |
| High | 151 | 2.64 (0.85) | 2.50 (0.86) | ||||||||
| Consumption of organic food | Low | 158 | 2.80 (1.57) | 2.79 (1.51) | 0.102 | 0.75 | 30.834 | 0.001 *** | 0.202 | 0.65 | |
| High | 151 | 3.79 (1.66) | 3.83 (1.56) | ||||||||
| Consumption of regionally produced food | Low | 156 | 4.22 (1.33) | 4.28 (1.34) | 0.061 | 0.81 | 24.054 | 0.001 *** | 0.340 | 0.56 | |
| High | 151 | 4.83 (1.21) | 5.00 (1.11) | ||||||||
| Consumption of in-season food | Low | 158 | 4.39 (1.32) | 4.60 (1.39) | 1.605 | 0.21 | 26.859 | 0.001 *** | 0.725 | 0.40 | |
| High | 149 | 5.03 (1.20) | 5.33 (1.17) | ||||||||
| Consumption of ready-made meals | Low | 153 | 2.35 (1.47) | 2.22 (1.42) | 2.333 | 0.13 | 1.325 | 0.25 | 0.727 | 0.39 | |
| High | 145 | 2.15 (1.32) | 2.06 (1.28) | ||||||||
| Consumption of food with less packaging | Low | 154 | 3.93 (1.52) | 4.15 (1.53) | 0.483 | 0.49 | 39.680 | 0.001 *** | 3.360 | 0.07 | |
| High | 145 | 4.88 (1.36) | 4.94 (1.33) | ||||||||
| Household food waste | Low | 160 | 2.14 (0.89) | 2.00 (0.82) | 3.881 | 0.05 * | 1.507 | 0.22 | 0.506 | 0.48 | |
| High | 152 | 2.05 (0.71) | 1.93 (0.74) | ||||||||
| Group | N | Difference between Household Food Waste Frequencies during the COVID-19 Restrictions—Frequencies during the Pre-COVID-19 Period | Z | p | |
|---|---|---|---|---|---|
| Number of Positive Differences | Number of Negative Differences | ||||
| Low | 1296 | 31 | 351 | −16.321 | 0.001 *** |
| High | 1476 | 32 | 469 | −19.479 | 0.001 *** |
| Sample | Type of Climate-Friendly Food Consumption | Group | N | M (SD)PRE | M (SD) POST | Time | Personal Norms | Interaction | |||
|---|---|---|---|---|---|---|---|---|---|---|---|
| F | p | F | p | F | p | ||||||
| COR1 | Meat consumption | Low | 1410 | 3.32 (1.08) | 3.15 (1.09) | 48.316 | 0.001 *** | 112.515 | 0.001 *** | 29.476 | 0.001 *** |
| High | 1570 | 2.98 (1.07) | 2.69 (0.98) | ||||||||
| Consumption of organic food | Low | 1268 | 2.73 (1.31) | 3.03 (1.41) | 66.023 | 0.001 *** | 365.775 | 0.001 *** | 8.773 | 0.01 ** | |
| High | 1523 | 3.62 (1.24) | 4.00 (1.28) | ||||||||
| COR2 | Meat consumption | Low | 158 | 2.63 (0.86) | 2.65 (0.95) | 1.468 | 0.23 | 0.275 | 0.60 | 1.660 | 0.20 |
| High | 150 | 2.65 (0.86) | 2.58 (0.98) | ||||||||
| Consumption of organic food | Low | 157 | 2.80 (1.58) | 3.10 (1.70) | 2.325 | 0.13 | 30.653 | 0.001 *** | 1.057 | 0.31 | |
| High | 150 | 3.80 (1.66) | 4.24 (1.68) | ||||||||
| Consumption of regionally produced food | Low | 156 | 4.22 (1.32) | 4.53 (1.43) | 0.478 | 0.49 | 24.762 | 0.001 *** | 1.194 | 0.28 | |
| High | 151 | 4.83 (1.21) | 5.281 (1.25) | ||||||||
| Consumption of in-season food | Low | 157 | 4.39 (1.32) | 4.59 (1.34) | 0.333 | 0.56 | 27.185 | 0.001 *** | 2.886 | 0.09 | |
| High | 148 | 5.03 (1.21) | 5.42 (1.23) | ||||||||
| Consumption of ready-made meals | Low | 153 | 2.34 (1.47) | 2.22 (1.39) | 3.414 | 0.07 | 2.164 | 0.14 | 0.439 | 0.51 | |
| High | 140 | 2.18 (1.34) | 1.98 (1.23) | ||||||||
| Consumption of food with less packaging | Low | 152 | 3.95 (1.55) | 4.28 (1.61) | 3.163 | 0.08 | 2.702 | 0.10 | 2.702 | 0.10 | |
| High | 143 | 4.92 (1.36) | 5.44 (1.27) | ||||||||
| Household food waste | Low | 160 | 2.14 (0.89) | 1.88 (0.70) | 6.712 | 0.01 ** | 1.288 | 0.26 | 1.830 | 0.18 | |
| High | 152 | 2.05 (0.71) | 1.83 (0.52) | ||||||||
| Group | N | Difference between Household Food Waste Frequencies during the Post-COVID-19 Period—Frequencies during the Pre-COVID-19 Period | Z | p | |
|---|---|---|---|---|---|
| Number of Positive Differences | Number of Negative Differences | ||||
| Low-norm | 1380 | 83 | 102 | −1.323 | 0.19 |
| High-norm | 1544 | 90 | 144 | −3.465 | 0.01 ** |
Publisher’s Note: MDPI stays neutral with regard to jurisdictional claims in published maps and institutional affiliations. |
© 2022 by the authors. Licensee MDPI, Basel, Switzerland. This article is an open access article distributed under the terms and conditions of the Creative Commons Attribution (CC BY) license (https://creativecommons.org/licenses/by/4.0/).
Share and Cite
Schmidt, K.; Wallis, H.; Sieverding, T.; Matthies, E. Examining COVID-19-Related Changes toward More Climate-Friendly Food Consumption in Germany. Sustainability 2022, 14, 4267. https://doi.org/10.3390/su14074267
Schmidt K, Wallis H, Sieverding T, Matthies E. Examining COVID-19-Related Changes toward More Climate-Friendly Food Consumption in Germany. Sustainability. 2022; 14(7):4267. https://doi.org/10.3390/su14074267
Chicago/Turabian StyleSchmidt, Karolin, Hannah Wallis, Theresa Sieverding, and Ellen Matthies. 2022. "Examining COVID-19-Related Changes toward More Climate-Friendly Food Consumption in Germany" Sustainability 14, no. 7: 4267. https://doi.org/10.3390/su14074267