1. Introduction
The world economy continues to be in an adjustment period after the financial crisis. Since 2010, the growth of the global economy has generally been in decline. After a weak rebound in 2017, it continued to decline in 2018. According to the forecast in October 2019 of the International Monetary Fund (IMF), the economic growth rate in 2019 was only 3.0%, which was lower than the expected 3.5% at the beginning of 2019 and 0.6% slower than that in 2018, which was a new low for the world financial crisis [
1].
Port development is an important driver for global economic growth. In 2019, the throughput of coastal ports was expected to reach 9.17 billion tons, with a year-on-year growth of 4.0% (foreign trade growth and domestic trade growth were paced at 4.8% and 3.2%, respectively), achieving the expected growth and slowing down by 0.3%, as compared to 2018 [
2]. In the second half of the year, driven by the import growth of coal, ore, crude oil, and other bulk goods, the trend increased and then decreased [
3]. According to an analysis of historical trends, the growth rate of the throughput of coastal ports gradually declined. The average growth rates of coastal ports in the 10th Five-Year Plan, the 11th Five-Year Plan, and the 12th Five-Year Plan were 18.5%, 13.5%, and 7.5%, respectively, and dropped to 4.5% in the first four years of the 13th Five-Year Plan. As the growth of coastal ports tends to be stable, transforming, upgrading, and accelerating the construction of world-class ports have become priorities in the high-quality and green development of ports.
At present, large-scale deep-water ports in China include the Shanghai Port, the Qingdao Port, the Tianjin Port, and the Ningbo Port. The Qingdao Port serves the Shandong, Henan, Hebei, Shanxi Provinces, etc., with a total area of 873,000 square kilometers and a population of 330 million. The five provinces of the interior have prominent resource advantages and are rich in various mineral resources. In 2018, the total coal output of the five provinces was 5.172 billion tons, accounting for 51.1% of the total national output, of which Shanxi Province provided 570 million tons and was the largest coal production and export base in China. Meanwhile, the five provinces are also important bases for the food and heavy chemical industries in China. In recent years, with the development of the heavy chemical industry, the demand for various raw and energy materials has risen, which has led to continuous improvements in port transportation.
Dongjiakou Port is an important part of the Qingdao port, a national hub and distribution center for domestic bulk cargo as well as an important energy storage and transportation facility in China. It has an average depth of 15 m; 1000 m away from the shore, the depth can reach up to 20 m, making it a rare natural deep-water port. In July 2006, the Ministry of Transport of the People’s Republic of China and the Shandong Provincial People’s Government planned Dongjiakou Port as a key port area in Qingdao. In March 2009, they further defined the functional orientation of Dongjiakou Port and the general layout in water and land areas. According to the latest planning, Dongjiakou Port will be developed into a fourth-generation international logistics trade port and international hub that will function as a link between the port and the city. Dongjiakou Port has become an important part of the Qingdao port infrastructure, as well as a strategic support base for national ocean development.
While this coastal port has transformational and development opportunities in its future, these changes must also contend with significant challenges [
1]. International maritime transport has also made regulation changes that involved higher requirements for port facilities [
4]. According to the relevant research, the majority of seaports have adopted a number of strategies and practices focused on sustainability, such as awareness and training programs, reporting for sustainable accountability, and sustainability initiatives and standards (e.g., Green Marine and ISO 14001 certification) [
5]. Researchers have often referenced seaport management (ranging from international legal cooperation to domestic strategies and national legislation), and they have conducted an assessment of the economic prospects for Arctic port development according to the latest data and trends in the field of logistics. They also provided a description of seaport developments, considering the global environmental agenda [
6].
At present, the overall capacity of China’s coastal ports is poor, while the demand for large deep-water berths is high. The channels for port transportation are not smooth, and the public facilities need to be improved [
7]. Therefore, accurate predictions of port development will benefit future planning so as to promote construction and innovation. It is also of practical significance to promote the sustainable development of coastal cities.
The research object of this paper, Dongjiakou Port, inherits many of the aforementioned issues troubling Chinese coastal ports (e.g., port transportation is not smooth and port construction needs to be improved). As a regional transportation infrastructure, Dongjiakou Port serves the needs of local economic development such as freight and fisheries. The coastal land area of Dongjiakou Port is very broad, with a significant amount of farmland close to the coast; furthermore, few industries, enterprises, and related facilities and residents are in the port area. At present, there is no railway access to the port, and the municipal infrastructure around the port is also weak. The planned Qinglian Railway will pass through the rear of the port area, and the Qingdao Binhai Highway is currently under construction, which will further develop the transportation system in the area and provide a foundation for the connection between the port and the hinterland. With the increase in port construction, further planning and the sustainable development of Dongjiakou Port are urgent. Therefore, based on systems engineering methods, this study integrated the data and the information that would impact the outcomes and implemented a variety of mathematical models to predict the cargo throughput of Dongjiakou Port. This research on the changes and development of the port’s cargo throughput may provide support and evidence for future sustainability projects for coastal ports and cities, as well as theoretical considerations for enterprises. Furthermore, through the analysis of the development of Dongjiakou Port, a more comprehensive and systematic understanding of port planning can be developed to improve predictive models and future innovations in the field.
2. Theory and Methodology
2.1. Grey System Theory
Grey system theory suggests that uncertainty exists between what information is known versus that which is unknown and how it impacts a relatively broad vision when addressing real-world problems in systematic research. It is an applied mathematics theory that studies the impacts of uncertainty when partial ambiguity will always be present. Traditional system theory studies systems with sufficient information. For some systems in which information cannot or is not known, the black box method has also been effective. However, particularly in systems where internal information cannot be identified or determined, this is not sufficient. Grey system theory approaches the problem of “small sample, poor information” with “clear extension and unclear connotation”. In the objective world, there are few completely white systems (all information is present) or black systems (little to no information is present); most systems are, instead, grey. Therefore, grey system theory assumes that information is missing, taking the resultant uncertainty as the research object, and further examines what can be known.
Grey system theory holds that the uncertainty of low-level systems corresponds to the certainty of high-level systems. The known information should be employed to reveal the rules of the system. In social and economic systems, for example, there are uncertain interference factors, and the existence of these factors can lead to difficulties in research; therefore, grey system theory can identify the irregular interference factors by using corresponding technology in systems processing.
In grey system theory, the use of grey numbers, grey equations, and grey matrices reflects the characteristics of a study object and removes the limitations to provide more in-depth understanding. Applying grey system theory to the study of social and economic systems allows a research team to define and quantify the issues, identify key factors even under complex conditions without clear causal relationships, and analyze the changes and developments accordingly.
2.2. Data Collection and Extraction
A traditional port having only a singular function no longer meets the needs of the shipping industry. Industrial demands require further improvements in the quality of Dongjiakou Port, particularly since it has been given the long-term goal of becoming one of the largest ports in Bohai Bay and meeting its sustainability goals. Therefore, the data collected included impact factors on port throughput from 2009 to 2020, including the port service capacity, number of berths, berth length, hinterland economy, total import and export trade, hinterland consumption, hinterland transport capacity, planning and construction, hinterland economy, and port throughput, all of which were used to construct a preliminary system. Combined with the principle of operability, the preliminarily constructed system was screened to ensure that the factor index system could obtain corresponding data or if it would be necessary to assign values. In this case, data quantification would be required, and some fuzzy indicators would have to be deleted. Under the principle of operability, six factors were derived through the screening and selection of preliminary indicators, namely foreign-trade volumes, import and export, turnover of freight traffic, fixed-asset investments, secondary industries, and berth numbers. Moreover, the research also collected data for port throughput from 2009 to 2020. According to the multivariable linear regression model, the data were extracted through analysis, and the constructed model was tested for feasibility.
2.3. Grey Prediction and Grey Model
“Grey prediction” refers to the process of forecasting the original data by using processing methods to establish a grey model, from which the rules of system development can be summarized and then used to predict the development trend of the system [
8,
9,
10,
11,
12].
Grey modeling is a core part of grey prediction and is constituted by either a sequence of differential equations or a prediction model built according to the hierarchy changes in the data, the grey number, and other methods. The selection of a grey prediction model must be influenced by its specific application. The selection of a model must also be determined through rigorous testing. Only corresponding testing can determine the specific model and predict the related system. Grey system theory determines the grey derivative and the grey differential equation on the basis of the associated space and smooth disperse function and builds the corresponding dynamic model of differential equations based on discrete data, which was the grey model (GM) of this system.
The model could be constructed directly from the original sequence. However, grey modelling assumes that the original data are irregular and transforms the original data into regular data. Since the grey model is the core and foundation of grey prediction, the original sequence (0) was composed of the original data, and sequence (1) was generated using a cumulative generation method. This weakened the randomness of the original data and assisted in delineating its characteristics. A differential equation model was established, namely a GM model, for the generated transformed sequence (1). The GM (1,1) model represented a first-order, single-variable differential equation. Among the GM (1,1) models, the metabolic model was considered the most ideal model. In the development process of any grey system, there will be some random disturbances and driving factors in each system, which will affect the development of each subsequent system. When a GM (1,1) model is used for prediction, only data from 1 to 2 after the origin data (0) (n) have high accuracy; that is, the farther away the prediction time is, the weaker the significance of the prediction. The premise of the metabolic GM (1,1) is that the closer the data are, the greater the impact they can have on the future. Therefore, by adding new data and removing older, insignificant information, the modeling sequence will more dynamically reflect the latest characteristics of the system, resulting in a dynamic prediction model. Moreover, in the prediction process, the researcher must fully understand the characteristics and methods of modelling, and the constructed grey model should have a suitable R-squared coefficient.
2.4. Demand Prediction of Port
In port development and planning, the relationship between logistics and supply chain development are proposed to reduce the transportation cost through mutual benefit so as to improve the competitiveness of the port and meet the diverse commercial demands [
13]. Some research has been focused on the formation of regional spatial structures of ports and analyzed the coordinated relationship between port planning and the surrounding hinterlands [
14,
15,
16,
17]. The demand prediction of a port should be the basis of future design and planning; it is also an important foundation for port enterprises and port management authorities to consider when evaluating the prospects of port economic development, formulating policies, preparing plans, making decisions, and carrying out scientific management [
18]. Researchers have used software and models to analyze the design and prediction of port development in order to simulate real-world conditions. Bates and Granger developed a combined prediction method, officially published in journals in 1989. At the same time, relevant cases were used to validate the results of its case prediction. In the research of analysis and prediction, some scholars made amendments and adjustments to combined prediction method and proposed a more accurate version. Specific working scenarios and network construction methods were proposed. On this basis, combined with the actual situation of the port, a service model of container planning was constructed.
In addition, demand prediction has also been foundational for appropriately organizing production and formulating policies. According to an analysis of data pertaining to port transportation markets, demand prediction found binding rules in the complex relationships among various factors and predicted the possibility and development trend of port cargo flow as well as the demand and development during a certain period of time using mathematical methods [
19]. This provided a scientific basis for planning. Case studies of ports have been of great significance for the prediction of demand and throughput. Li used a comprehensive method to analyze port development [
20]. Olba et al. [
21] focused on the network capacity of ship traffic as the research subject, proposed relevant indicators, and predicted and estimated the port capacity and the port design based on the estimation results, which were applicable to different situations. Hou [
22] selected the Yingkou Port in Liaoning Province as a research subject and constructed a comprehensive impact system for logistics demand prediction and established the corresponding prediction set in combination with the Yingkou Port. Moreover, the prediction studies of Shiwei Port in Jingjiang City were analyzed, and suggestions for the environmental management of this port were discussed [
23]. Li et al. [
20] focused on the Guangdong–Hong Kong–Macao Grand Bay Area and analyzed the status of Shenzhen Port container development, which was followed by an exponential smoothing model that was used to predict the container throughput at Shenzhen Port.
2.5. Prediction Model of Port Throughput
“Port throughput” refers to the total amount of goods exported by water, imported into the port area, and handled during a period of time. The unit of measurement is one ton or a twenty-foot equivalent unit (TEU; i.e., a standard 20-foot container). Port throughput can be divided into the cargo throughput and passenger throughput which is an important quantitative indicator reflecting the port production and operation, it is also the most important indicator for measuring the size of a port. Flow directions, quantitative compositions and physical classifications of port throughput are the key indicators of a port’s status and influence both the international and the regional water transportation chains, it also provides quantitative references for measuring the development of countries, regions and cities.
The factors that can affect port throughput are complex. Generally speaking, they can be divided into two types. The first includes regional factors, such as the size of the surrounding hinterlands, the level of production development, the development of an export-oriented economy, and the quantity of import and export commodities. The second includes the construction conditions of the port itself, including natural conditions and socioeconomic factors [
1]. Besides the above conditions, the labor organization and management, the number and technical level of loading and unloading machinery, ship type, vehicle model, hydrometeorological conditions, the seasonality of industrial and agricultural production, the balance of vehicles and ships, and the variety and quantity of goods loaded and unloaded through the port have been important factors indicating a port’s handling capacity [
24]. However, the most direct and critical factor is the berth capacity. The port throughput can clearly reflect the quantity of goods entering and leaving the port area by water, as well as loaded and unloaded during that period. This indicator reflects the port scale and capacity.
Software and models have been used for analysis of port design and prediction, and real-world situations are conducted using software and modeling. For example, computer simulation was used to predict and analyze the future development of a port (Tan et al. [
25]). Some research in port development has also suggested a “port general” model that has been widely applied and popularized in practice. Langenus and Dooms [
26] applied a virtual learning model to create an interorganizational network (ION) for sustainable development for improving the dimensions of sustainability, including economic, social, and ecological concerns, at the industry level. As previously mentioned in
Section 2.4, Fahdi et al. [
27] analyzed data using a machine-learning tool, a statistical regression analysis, to define the factors influencing the production and the degree of influence at the port of Casablanca. Fan and Yu [
28] adopted a nonlinear autoregressive (NARX) network model for prediction, selected external input factors of gross domestic product (GDP), and introduced them into the model, which was then used to predict the throughput at Shanghai Port and achieved good results. Wu [
29] suggested an automatic leading index model for the prediction of port handling capacity. The model used the relevant methods such as exponential smoothing to predict and analyze port throughput and concluded that the model had advantages in the prediction of short-term port throughput. Some researchers have also used a big-data governance model to analyze port logistics and sustainable development [
30,
31,
32,
33,
34].
2.6. Green Ports and Port Sustainability
Ports are not only a driving force in the growth of the global economy but also the main energy consumption and pollution source worldwide. Given the global energy crisis and environmental deterioration, the international port community has developed the concept of a “green port” [
35]. A green port is a sustainable port that achieves a balance between environmental protection and economic interests. Guided by ecologically sound principles, new port construction would consider environmental health, ecological protection, the reasonable utilization of resources, low energy consumption, and low pollution [
36]. Organically combining port development with careful resource utilization and environmental protection by prioritizing less energy consumption and less environmental pollution while allowing for expansive growth, a harmonious balance between port development and environmental protection could be achieved.
Some countries have made significant progress in the construction of green ports. For example, the San Pedro Bay Clean Air Action Plan was jointly implemented by the ports of Los Angeles and Long Beach; the Clean Air Initiatives and Harbor Air Management Plan were jointly implemented by the ports of New York and New Jersey; the Rijnmond Regional Air Quality Action Program was implemented in Rotterdam, the Netherlands; and the Green Port Guidelines were implemented by Sydney Port in Australia. These, and programs similar to these, have greatly improved the environmental quality and sustainability of their ports. Some researchers have focused on green port development. Schinas [
37] suggested an outline for applicable international and regional regulations concerning air emissions from ship operations and analyzed their impact on a port. The analysis also focused on effective solutions, especially those promoted by the port or terminal management. Meng [
38] discussed the role of peak carbon dioxide emissions and carbon neutrality in the green and sustainable development of ports. Taking a developing port area in Rizhao as a case study, the research compared ecological environmental protection and energy conservation and explored green port planning and design. By adjusting the functional layout of a port, increasing highway-to-railway transport, and developing dry bulk-container transport, the challenges between a port and city were alleviated, and the integrated development of port and city was achieved [
25]. The graded evaluation standard for green ports was analyzed to promote resource conservation and sustainable port development [
39,
40,
41]. The Chinese Government’s environmental regulations, port enterprises’ green port construction, and transportation enterprises’ choice of green port logistics transportation constituted an optimized strategy combination [
42].
We found additional research fields concerning the handling capacity of ports:
- (1)
The existing research has been focused on large ports that were already in operation, such as Tianjin Port, Guangzhou Port, and Shanghai Port. The prediction of port handling capacity in this research has been based on data accumulated during port development. For a new port, the handling capacity has not yet been predicted.
- (2)
According to the recent literature regarding factors that influence the prediction of port development, there has been little research conducted that included the impact of competition and cooperation on the handling capacity of a port. Some scholars have analyzed this from a qualitative point of view, but little quantitative analysis has been performed, to date.
Therefore, we proposed a throughput prediction method for port planning and design. Specifically, it employs an autoregressive distribution model to build the relevant structural model, designs, and plans for different scenarios through the prediction and the analysis of relevant variables. The model was used to analyze the port throughput and calculate a more accurate throughput, in combination with the real-world conditions of the port. Therefore, the research examined the data from Dongjiakou Port and applied the grey system theory and a grey prediction model of quantitative analysis; the port throughput was analyzed by selecting influencing factors and indicators so that the port planning for its handling capacity could be further studied.
3. Status Description of Port Area
Located in an important coastal city in China, the ports of Qingdao are of great significance. Dongjiakou Port is located in Langyatai Bay, southwest of Qingdao. The circular economy of Dongjiakou has developed rapidly due to this port’s location and importance. According to the master plans of this west coast region, the handling capacity of Dongjiakou Port will rank among the top three in the world, making it a “world-class” port. In terms of port scale, it is the equivalent of a second “Qingdao Port”.
An advantageous geographical location is a precondition for the development of the Dongjiakou Port area. This area plans to build a collection and distribution system combining shipping, a highway, and a railway and closely connecting the port area with the economic hinterland using the railway lines connected to the port and accelerating the establishment of a “dual-circulation” development pattern, in which the domestic economic cycle could play a leading role, while the international economic cycle would remain its extension and supplement. The port area is located within the Jiaodong economic circle, which may play an important role in China’s development as an influential marine country.
3.1. Natural Conditions of Port Area
The Dongjiakou Port area is located in the Langyatai Bay section of the bedrock cape, the second uplift belt in the east of the Jiaonan uplift of the new Cathaysia block and in the west of the southern Yellow Sea basin. Different water systems and landforms are distributed throughout the port area, forming a coastal and offshore plain. The average water depth offshore is −15 m, and the water depth 1000 m away from the shore can reach up to −20 m. The planning area of the port is 70 square kilometers, the planning area of the industrial area is 65 square kilometers, the length of the wharf coastline is approximately 35.7 km, and there are 112 berths in this port. The total handling capacity can reach 400 million tons.
Data from the Environmental Forecasting Center of the Beihai Branch of the National Marine Administration has shown that the ENE direction is the strongest wind direction in the region, with a maximum wind speed of 12.8 m/s, and the secondary strong wind direction in the region is in a NE direction, with a wind speed of 11.8 m/s. According to the measured data, the direction of the water is parallel to the shore, and the embankment direction is perpendicular.
3.2. Development Situation of Port Area
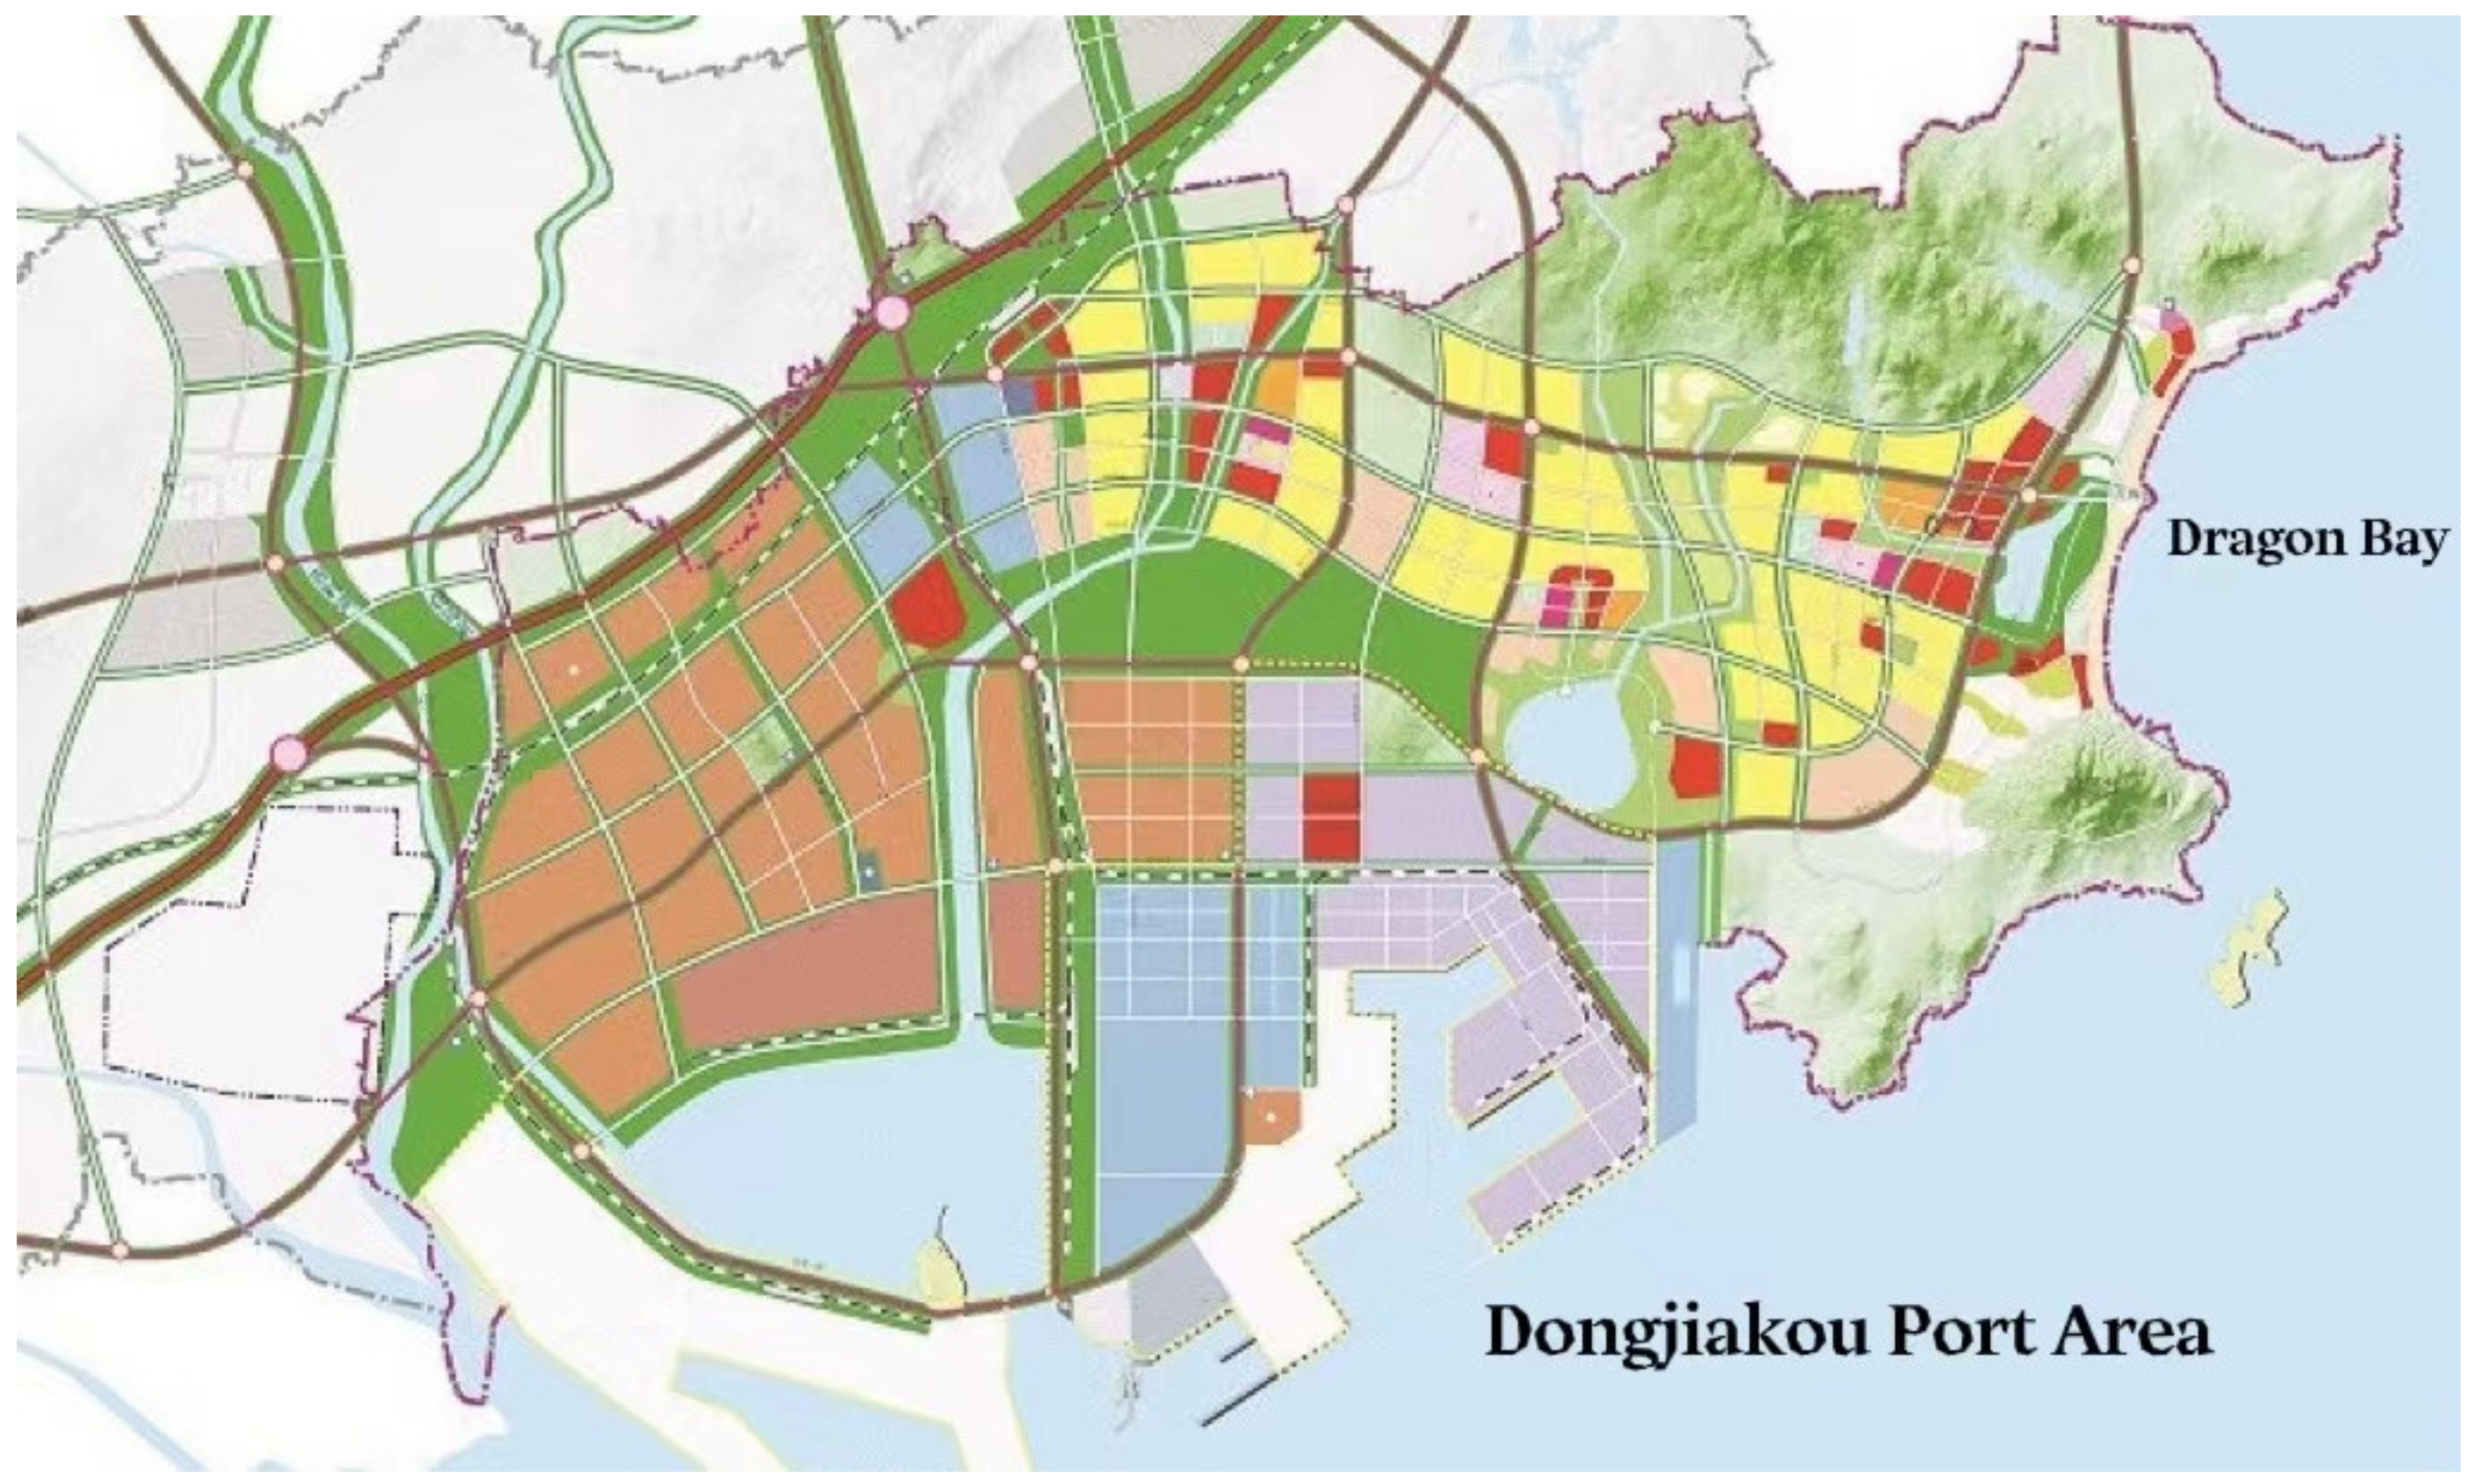
In terms of wharf facilities, Dongjiakou Port is a newly developed port area. In recent years, dozens of berths have been built along with a 400,000-ton ore wharf, with contracted business for the iron ore distributed and transported by Qingdao.
Regarding the collection and distribution channels, the Tongjiang–Sanya Conventional Expressway (G010) passes through the northwest of the Dongjiakou Port area. The Qingdao–Laiwu portion of the Qingdao–Lanzhou Expressway crosses north of Jiaonan City and has been opened for traffic. At present, there is no railway access in Dongjiakou Port. The planned Qingdao–Yancheng Railway will pass through the rear port area and is in the preliminary work stages.
Dongjiakou Port is vast, with a significant amount of farmland close to the coast. In terms of the water-area utilization, the natural coastline has some fishery and aquaculture facilities (
Figure 1).
3.3. Characteristics of the Port Area
The Dongjiakou Port area is surrounded by the sea on three sides and has a natural coastline approximately 29 km in length. Special geographical conditions and advantages make this port area suitable for port construction. There are rich natural resources and abundant land resources along the coastline that provide basic conditions and sufficient space for the development of the port area.
The natural water conditions are also suitable for port construction and planning. Within the port area, the tide is gentle, and the seabed is relatively stable. In addition, the sediment concentration is small, with stable geology, so it is suitable for infrastructure construction. In general, the Dongjiakou Port area has superior conditions for constructing a large deep-water port. Moreover, the convenient distribution and transportation is one of the most important characteristics of the port area.
3.4. Description of the Challenges Related to the Port Area
Weak municipal infrastructure and a lack of support for port construction are two major challenges for further development. The Dongjiakou Port area has little established infrastructure and few towns, industrial enterprises, and external resources. However, with the ongoing construction and development of the port, basic utilities such as power, communication, water supply and drainage, etc., have improved. In addition, the port has been connected to a main road, a highway, and a railway, laying a foundation for future development.
Another significant challenge to its sustainable development is the coordination of environmental and ecological resources. Port settlement and development could have severe consequences on the ecological features and have been associated with coastal engineering works [
43]. There are significant opportunities for tourism and a good ecological environment in the port area. However, the additional construction and development of the port and the surrounding area would increase the number of industries and traffic in and through the port, which could lead to an increase in emissions and overall pollution. Therefore, to develop a sustainable, green port, future plans for Dongjiakou Port should consider environmental concerns.
4. Analysis of Demand Prediction
4.1. Prediction Model of Port Throughput
4.1.1. Prediction Method
Grey prediction considers a data sequence as a grey quantity that can change over time. Before initiating grey modelling, it is necessary to integrate and process the irregular original data so as to obtain the rules established by the original data and prepare the foundation for modelling. From a theoretical point of view, the larger the original data set, the more reliable the results will be; however, the possibility remains that the model’s accuracy will be impacted due to the same irregular information. The most reliable key indicators can be selected from a large, detailed dataset.
In terms of its characteristics, grey prediction can be divided into different prediction types, including sequence prediction, which is a prediction method according to the development and changes of the eigenvalues on system behavior. The GM (1,1) model is a method often used for prediction. Based on the results of a qualitative analysis, an appropriate sequence is defined, and then the order sequence is applied to the operator. If is used for a large inertia sequence in the tolerable area, the corresponding GM model can be established, and then the model can be tested. After passing the accuracy test, the specific problems can be predicted. In some cases, it is difficult to use a single model to predict a complex system. Therefore, it may be necessary to establish a system model to predict the problem. The system prediction model is a system of differential equations composed of multiple models, such as GM (1, m + s) and GM (1,1).
4.1.2. Index System Construction
After the forecast index system was established by combining the port influencing factors and the preliminary influencing factors, the relevant data in each 5-year period were analyzed to obtain the original data by combining the quantifiable influencing factors. The rationality of the established index system for prediction had a direct impact on the prediction results of the port handling capacity, which required the corresponding principles to be followed in the extraction of indicators.
- (1)
Index construction
For index construction, the variable indices were extracted from the existing data pertaining to the port handling capacity, competitiveness evaluation, and supply and demand. As part of the process, we consulted experts for improving the rationality and the scientific considerations of this index selection. The index system is shown in
Table 1.
As shown in
Table 1, the index system was established by combining the research results and relevant literature as well as consulting with professionals in the field of port construction; afterwards, variable indicators that had a strong impact on port throughput, the supply–demand relationship, etc., were chosen. The study demonstrated the empirical rationality of the selected indicators in combination with the real-word conditions of the port to finally determine the key indicators.
- (2)
Primary indicators
Combined with the principle of operability, the preliminary system was screened, through which the corresponding data were obtained or assigned. In terms of data collection, it was necessary to comprehensively quantify the data and delete fuzzy indices. Using the principle of operability, six factors were derived through the selection of the preliminary indices.
- (3)
Correlation analysis and screening
The influencing factors were selected according to the principle of operability. After completing the selection, the correlation analysis was adopted to address the associated factors and further obtain the influencing factors.
The purpose of correlation analysis and screening was to reduce the high correlation between indices. For some influencing factors, different indices could be adopted; for instance, social fixed assets and GDP could be used to measure the economic influencing factors. High indices that had relatively high independence were obtained by the correlation analysis while the predictions of the index system were made. Through the selection and the processing of the indices, relatively large and overlapping indices were chosen so that the independence of the data could be ensured.
The formula for calculating the correlation coefficients of each index was as follows:
where
rkj is the correlation coefficient between the
k and
j indices, and
z and
are their average values, respectively.
In the process of index screening, L = 0.9 was determined as the critical value, so as to ensure that the influencing factors could obtain a high degree of correlation. Eviews 9.0 was used in the filter for our calculations, which are shown in
Table 2.
As shown in
Table 2, the calculated correlational degrees of GDP, total sales of consumer goods, tertiary industry, industrial added value above designated size, and secondary industry were 0.970, 0.929, 0.919, and 0.921, respectively, and the correlation degrees of the above indicators were all higher than 0.9. Therefore, it was calculated that the secondary industry represented the relevant information of the manufacturing industry, and the output was expressed in terms of goods transportation and turnover products. For the tertiary industry, most were related to the service industry, and there was overlapping information between GDP and total social consumer goods. According to the analysis results, the secondary industry was determined as the final index, and the other indices were deleted.
4.1.3. Establishment of Prediction Model
Combined with the research objectives of this paper, the principal component analysis and multiple linear regression models could better achieve the prediction. To establish a prediction model of port handling capacity, the principal component regression was performed, the influencing factors were obtained through the fitting analysis, and then the multiple linear regression analysis was conducted.
From the perspective of forecast cost and forecast technology, a relatively simple forecast method should be selected to ensure the accuracy of the forecast. A multiple linear regression has a high degree of fitting, and the current equation and nonlinear model had satisfactory predictions for the relationships between influencing factors and prediction targets.
- (1)
Principal component analysis
Principal component analysis (PCA) transforms multiple variables into a few independent variables through dimension reduction while retaining the data from the original variables to a large extent. Principal component regression (PCR) was used to establish a corresponding regression relationship with the principal components and the standardized variables in the regression analysis. Each principal component was independent of the others, so the adoption of principal component analysis improved the reliability of the analysis results. In this research, SPSS software was used to process the data in the regression prediction analysis. Firstly, the influencing factors obtained from the screening were standardized, and the results are shown in
Table 3.
Then, the feasibility of the obtained factors was tested, and the calculated KMO (Kaiser–Meyer–Olkin) value was 0.688 > 0.6, which was suitable for the principal component analysis (
Table 4).
The principal component analysis was conducted using the standardized data, and the extracted principal component results are shown in
Table 5.
In this research, the first two principal components (as shown in
Table 5) were extracted, and the rest were eliminated. The eigenvalues of the extracted two principal components Z
l and Z
2 were
= 4.658 and
= 0.679, respectively. According to the first two principal components extracted, the scores for each impact factor in each component are shown in
Table 6.
Table 6 describes the relationship between each impact factor and each component. Based on the eigenvalues
= 4.658 and
= 0.679 of each component, the normalized eigenvector was calculated as follows:
Then, we constructed the linear relationship between the original factors and the principal components, as follows:
- (2)
Multivariable linear regression model
Multivariable linear regression is a test of the relationship between factors and objects. Using the multivariable regression model, the confidence coefficient and the confidence interval were calculated, and the correlation between each impact factor and the prediction target was fully considered in the regression analysis, which significantly improved the reliability of the prediction. In the multivariable regression analysis, a large number of samples were needed. If multicollinearity existed among the various impact factors, the prediction results could be affected. Therefore, methods such as stepwise regression should be adopted to reduce multicollinearity, and heteroscedasticity was used for the multicollinearity test. In the analysis, the first 70 out of the 100 groups of data were selected to obtain the prediction model through data analysis, and the last 30 groups of data were used as test data to confirm whether the constructed model was valid.
The regression analysis method of ordinary least squares was used to perform the regression analysis on the principal component and central dependent variables; the regression coefficient, as shown in
Table 7, was obtained.
The goodness of fit of the regression analysis was 0.92, and the least square method had a good fitting effect. As can be seen from the regression coefficients,
, the constant terms in the regression results could be ignored, and then the principal component regression equation was expressed as follows:
The following calculation results were obtained by substitution,
According to
, as well as the average and standard deviation of each factor in
Table 8, the relational coefficients of the original variables were restored as follows:
According to the above analysis, if all else remained the same, the port handling capacity of Dongjiakou Port could increase by 192,900 tons if a port berth were added. Therefore, the port could improve the throughput by adding more berths. In addition, if the secondary industry were increased by CYN 100 million, the port throughput would increase by 15,200 tons; therefore, the development of the secondary industry was the key to improve the port throughput. For every CYN 100 million increase in total export–import volume, the cargo throughput would increase by 29,500 tons; if the fixed investment were increased by CYN 100 million, the added value of cargo throughput would be 11,200 tons; if the RFTK were increased by 1 km, the added value of cargo throughput would be 716 tons; if the foreign-trade cargo volume were increased by 10,000 tons, the cargo throughput of the port would increase by 300 tons.
After fitting the prediction model using the first 70 groups of data, the last 30 groups of data were used to verify the validity of the model construction. The test results are shown in
Table 9.
According to
Table 9, the average absolute value between the predicted value and the actual value was 3.60%, and the margin of error was small. Therefore, the constructed model was verified and could accurately predict the throughput of Dongjiakou Port.
4.2. Prediction of Impact Factors of Port Throughput Based on GM (1,1) Model
To predict the influencing factors, the grey model was used. After a series of analyses, we determined that the port throughput was influenced by six factors, namely foreign-trade freight volume, import and export, turnover of freight traffic, fixed-asset investment, secondary industry, and the number of berths. The research analyzed and predicted the fixed assets of the Dongjiakou Port area in 2021–2025 and obtained the prediction results based on the GM (1,1) model and using the MATLAB programming method.
Therefore, the GM (1,1) model was as follows:
The reduced value was determined as follows:
Whether the GM (1,1) model of fixed-asset investment could support subsequent predictions required verification. The following calculation results were obtained by subtracting the original data column and the predicted value sequence:
Level of model definition
As shown by the calculation results,, the model had high accuracy.
- (2)
Posterior variance test
The results of this test were calculated to be ; therefore, we concluded that the prediction model of GM (1,1) built for fixed assets in this research had a good accuracy. Therefore, this prediction model could be used to forecast the fixed assets of Dongjiakou Port during the period of 2021–2025.
- (3)
Predicted results
By using the forecasting formula
we concluded that the fixed-asset investment from 2021 to 2025 was CYN 86.54 billion, CYN 98.51 billion, CYN 112.14 billion, CYN 121.69 billion, and CYN 133.13 billion, respectively. Based on the same method, the foreign-trade freight volume from 2021 to 2025 is shown in
Table 10.
Based on the above models, this research predicted the throughput of Dongjiakou Port. In the analysis, the key impact factors were screened by qualitative and quantitative methods, and the magnitude relationship between the impact factors and the port throughput were analyzed by using a multiple regression equation. Next, a grey model was used to predict the impact factors, and finally the throughput of Dongjiakou Port was obtained.
The throughput equation that was set for Dongjiakou Port is as follows:
According to the predicted results, the predicted value of the impact factors was as follows:
By substituting the predicted values of the impact factors into the prediction equation, we acquired the following:
Therefore, the throughput of Dongjiakou Port area in 2025 would be 72.9 million tons. To show the order of our prediction, this article only shows the relevant calculation processes. As grey prediction is a basic prediction method, and the calculation process is relatively straightforward. The throughput prediction of the port was performed after the determination of the linear regression model, the determination of the six factors affecting the port throughput, and the speculation of the situational context of the six factors during the chosen time period. Combined with the prediction of the linear regression equation and the influencing factors, X3, X6, X9, X10, X15, and X16 were substituted into the original formula, and the prediction value for 2025 was achieved.
4.3. Comparison Analysis between the Throughput Prediction and Actual Value
According to the above formula, this research calculated the prediction value from 2014 to 2020 and compared the results with the actual values (
Table 11).
After the prediction and the analysis of the throughput of the Dongjiakou Port area from 2014 to 2020 using a grey model, the actual throughput in 2014 was 3.45 million tons, while the predicted throughput was 3.52 million tons; the deviation value was 2.02%. In 2018, the actual throughput was 24.33 million tons, while the predicted throughput was 25.1 million tons, with a deviation of 3.16%. Furthermore, the actual throughput in 2020 was 13.91, and the predicted throughput was 36.98, resulting in a deviation of 23.07%. The analysis indicated that the deviation was within an acceptable range. In addition to the positive and negative values, the deviation was greater in 2020 due to the influence of uncontrollable factors, such as the global COVID-19 pandemic. By comparing the actual throughput, the deviation values were within ±5%, except for 2020, indicating that the model prediction for the throughput of the Dongjiakou Port area in this research was valid.
Currently, the Dongjiakou Port area is still in the planning and construction stage. Based on the above calculations and analyses, the port throughput of 72.9 million tons in 2025 will overwhelm the existing infrastructure and functionality, especially the port handling capacity. Therefore, further planning and design for the port are urgently needed. The port planning and layout are critical to improve port throughput, and the actual throughput should be considered as a guide for the overall planning and layout, along with the future predictions, so that the development of Dongjiakou Port can meet the demands of the future.
5. Discussion
5.1. Findings
Based on the results, our research had several important findings.
First, the current demand of Dongjiakou Port could be accurately predicted. The prediction results showed that the overall planning and design layout of the port will not meet future requirements. Therefore, the overall design and layout of Dongjiakou Port must be reconsidered and redesigned including the operational areas based on the existing design and layout.
Second, when redesigning Dongjiakou Port, it will be necessary to redesign the five functional areas, including the main functional area, the wharf operation area, the logistics area, the comprehensive service area, and the reserved port development area, so as to ensure that the design will provide services for future growth.
Third, in modern economic development, the cooperation and the division of labor between ports has been a trend in future port economic development. The competition and cooperation between Dongjiakou Port and the surrounding ports have been key factors affecting the demand and throughput of Dongjiakou Port. Therefore, improving the cooperative relationships among the ports and their competitiveness should be considered as part of the collaborative development of Dongjiakou Port.
Fourth, the prediction of port throughput can promote further planning and sustainable development of the port. At the same time, it can drive the development of the local society and regional economy, as well as encourage the development of the coastal areas in eastern China and provide references for the construction of coastal ports. It may also have an overall impact on the ecosystem of relevant regions, watersheds, and sea areas, as well as on the development of peripheral enterprises and the lives of local residents. This study can also support policy creation and decision-making for local governments, as well as provide policy recommendations for other coastal countries like China. In addition, along with the recent fundamental changes in the port industry, ports must address formidable environmental challenges. It is important and often imperative to prioritize environmental concerns in their operation, planning, and development; to improve their environmental performance; and to make the transition to sustainable production and consumption patterns [
44,
45,
46]. The implementation of reasonable port planning would have a long-term impact on the protection of coastal ecological environments.
Moreover, with the growth of the global economy and the promotion of The Belt and Road policy in China, port construction and development have new opportunities. From the perspective of port design and construction in China, challenges remain in the prediction of port handling capacity. At present, China’s port prediction and research are still in the primary stage, which has led to a lack of theoretical guidance and theory in the process of port design and construction. Therefore, this research on the development of the Dongjiakou Port area may provide a reference to optimize port layouts and to accelerate economic development not only in Qingdao, but also for the construction and sustainable development of deep-water ports around the world.
5.2. Practical Application
According to our research and based on the development status and the trends of Dongjiakou Port, the following practical countermeasures were proposed for the demand of the port area.
- (1)
Continuously optimizing the structure of port cargo and strengthening the dominant cargos
As was found in our analysis results, deficiencies in the concentration of goods into Dongjiakou Port exist, and the integration of goods and the trends of diversification showed downward and upward trends, respectively. To some extent, these indicated that the trend of the diversification of goods in Dongjiakou Port has appeared in the development process. Through such diversification, the risks and impacts of a single-cargo type on the sustainable development of Dongjiakou Port will be avoided, and it could also play a positive role in the development capacity and profitability of the port. However, from another point of view, this diversification has led to an insufficient concentration of port cargo and a tendency towards equalization, which may lead to riskier blind imports in an effort to introduce new varieties of goods in future development. Therefore, the port will need to consider a large range of specific situations and combinations in any future development, such as the transport of containers, coal, crude oil, ore, and grain, as principal transactions, in order to enhance the port’s competitiveness and maintain its demand throughput. According to location theory, when the port area reaches a certain scale, it will promote local competition, which is necessary for the development of all regions. Therefore, the Dongjiakou Port area should cultivate its diversification of goods according to its own development requirements and implement risk dispersion on the basis of further improving market competitiveness.
- (2)
Strengthening port infrastructure construction and improving the adaptability of berth handling capacity
Dongjiakou Port has deficiencies in its handling capacity of containers and superior cargos. At present, the port has a relatively strong influx of coal cargo, which led to coal being the key cargo in planning and design. However, as compared to other ports, the transportation capacity of Dongjiakou Port has had some deficiencies in the development of its coal transport business in recent years, which will require the optimization of cargo handling to attract a larger supply of goods and further enhance the throughput needs of the port; at the same time, the developing trend of large-scale ships, networks of trunk lines and alliance operations, and the corresponding professional docks should be considered as well. To further improve demand and competitiveness, Dongjiakou Port also needs to strengthen economic cooperation with hinterland cities, expand their distribution network, and cultivate high-quality sources of goods through superior loading/unloading and transportation efficiency. Through the cultivation of relevant industries and goods, the influence of the port can be expanded.
- (3)
Layout of complementary port areas and functional improvements
Dongjiakou Port should consider its layout and the complementary functions of various areas when planning changes for the internal and external environment as well as the demand of port transportation services to further enhance the development potential and competitiveness of the port and improve its professional level. First of all, the port needs to be developed further. By studying the industrial chain, investment schemes, and operation plans, three directions of the port area with coal, crude oil, and ore as priorities should be further optimized. Secondly, it should develop other bulk groceries, moderately and in combination with the actual situation, and focus on becoming a comprehensive hub for the region, with a north–south echo that is coordinated with the location. Thirdly, the vigorously building and development of the distribution base of oil and chemical products in the port area would be a useful way to improve its logistics and service capability in the region. Finally, the port should focus on grain, steel, fertilizer, and other cargo, while giving consideration to clean, environmentally friendly cargos to realize sustainable development and the modernization of the port.
5.3. Limitations and Future Directions
Although our predictions and study of port throughput may provide suggestions for port handling capacity and the development of newly constructed ports, there were still several limitations that may provide direction for future studies.
- (1)
First, the development of ports is influenced by various internal and external factors. Although research has focused on the analysis of impact factors on new port throughput and planning, other factors have yet to be considered. Therefore, further research on the impact factors of port throughput is needed.
- (2)
Second, due to the influence of various factors, the prediction indicators we selected had limitations and would need to be continuously optimized for future studies.
- (3)
Third, certain assumptions should be taken as preconditions in the construction of a prediction model. However, if the assumption is too idealized, there will inevitably be deviations between the prediction results and the actual results. Therefore, the model should be further optimized in future research to improve the prediction accuracy and the prediction ability of the model.
Furthermore, future research should focus on grade evaluation standards for green ports, innovative port development, and sustainable port planning. The integration of the geographic spatial autocorrelation model and the grey model with GIS technology could support correlation analyses of port development and regional economic development. To meet their sustainable goals, the transformational development of ports must rely on each port’s distinct advantages and explore innovative concepts and designs that will meet current and predicted demands of the port and the surrounding area.
6. Conclusions
In light of the energy crisis and the deterioration of the ecological environment, emerging issues such as sustainable development have been a focus in international and domestic research. The Bohai Economic Rim is currently facing similar challenges concerning environmental pollution, a shortage of resources, etc. In order to answer these challenges, it is necessary to achieve sustainable development in the Bohai Economic Rim. China’s shipping industry is in a period of rapid development. The port industry, as a pillar of the shipping industry, is one of the critical elements. In today’s society, the rise and decline of the shipping industry directly affects the rise and fall of national trade, and the rise and fall of national trade will affect the economic development and even the international discourse power of China.
Qingdao, as the leading city in the coastal economic development of the Bohai Economic Rim, inevitably needs a comprehensive hub and international shipping center to support its economic status and improve its influence in the Bohai Economic Rim. Its economic development and resource conservation can promote sustainable and economic development in the area. This is the research significance of deep-water port demand prediction and development. As a rare deep-water port in the transportation center of Qingdao, Shandong Province, and the port circle of Northeast Asia, Dongjiakou Port has the potential to improve the comprehensive transportation and service capacities of Qingdao as a port city, but it can also enhance its competitiveness and consolidate its position as a key port in the western Pacific Ocean region.
The prediction of the demand and the throughput of Dongjiakou Port in this research can provide data to support the future planning and design of the port. In addition, based on our research of the relevant international literature, the grey model, principal component analysis, and other methods were used to predict the throughput of the Dongjiakou Port area from 2021 to 2025. To verify the feasibility of the model, the throughput of the port area from 2009 to 2020 was compared, and the effectiveness of the model was verified. Finally, we concluded that this model could calculate the future throughput of a newly built port, to a certain extent, and provide support for the development of a newly built port. In modern economic development, the cooperation and division between ports has been a trend in sustainable development, and the competition and cooperation between Dongjiakou Port and peripheral ports are also key factors affecting port throughput demand.
With the development of the Dongjiakou Port area, the port handling capacity of Qingdao Port will increase, which will form a multi-industry integration centered on port industries in order to drive regional economic growth. Research on demand prediction and the planning of deep-water ports can promote the value of Qingdao Port as an international trade hub. Meanwhile, due to the large trading volume of bulk goods and the high requirements of transportation time, the “last kilometer” of inland and coastal ports could be opened through demand prediction and targeted planning, which could significantly shorten transportation times and save on shipping costs. Therefore, it could also ease the challenges in transporting bulk goods to inland areas of China and other countries. In addition, the research on the demand prediction and planning of Dongjiakou Port could also promote the competitiveness and sustainability of other ports.


