Article

Prediction of China’s Industrial Solid Waste Generation Based on the PCA-NARBP Model

1
School of Transportation and Civil Engineering, Nantong University, Nantong 226019, China
2
Province Engineering Research Center of Aluminum Dross Solid Waste Harmless Treatment and Resource Utilization, Nantong 226019, China
3
School of Mechanical Engineering, Nantong University, Nantong 226019, China
*
Authors to whom correspondence should be addressed.
Sustainability 2022, 14(7), 4294; https://doi.org/10.3390/su14074294
Submission received: 16 February 2022 / Revised: 17 March 2022 / Accepted: 29 March 2022 / Published: 4 April 2022

Abstract

:
Industrial solid waste (ISW) accounts for the most significant proportion of solid waste in China. Improper treatment of ISW will cause significant environmental pollution. As the basis of decision-making and the management of solid waste resource utilization, the accurate prediction of industrial solid waste generation (ISWG) is crucial. Therefore, combined with China’s national conditions, this paper selects 14 influential factors in four aspects: society, economy, environment and technology, and then proposes a new prediction model called the principal component analysis nonlinear autoregressive back propagation (PCA-NARBP) neural network model. Compared with the back propagation (BP) neural network model and nonlinear autoregressive back propagation (NARBP) neural network model, the mean absolute percentage error (MAPE) of this model reaches 1.25%, which shows that it is more accurate, includes fewer errors and is more generalizable. An example is given to verify the effectiveness, feasibility and stability of the model. The forecast results show that the output of ISW in China will still show an upward trend in the next decade, and limit the total amount to about 4.6 billion tons. This can not only provide data support for decision-makers, but also put forward targeted suggestions on the current management situation in China.

1. Introduction

Human activities are inseparable from industrial production. Industrial production is one of the leading causes of carbon emission. According to the latest data from Carbon Emission Accounts and Datasets (CEADs) for 2020 (https://www.ceads.net.cn/ (accessed on 1 December 2021)), China’s total carbon emissions in 2020 was 10,550.67 mt, and industrial emissions were 4258.22 mt, accounting for 40.4% of the total amount. Therefore, carbon emission reduction in industrial production is significant for limiting national carbon emissions.
Industrial solid waste (ISW) is a necessary product of industrial production. According to the Law of the People’s Republic of China on the Prevention and Control of Environmental Pollution by Solid Waste, ISW is divided into general ISW and hazardous solid waste. Back in 1972, some scholars began to study the resource utilization of ISW [1]. ISW poses a huge potential threat to human health and the environment. The study shows that 93% of waste is still harmful after being treated by leaching and degradation for nearly 20 years. In addition, 66% of the waste is not suitable for direct use in urban land soils [2]. Therefore, only treatment of ISW to make it harmless can protect the ecological environment. Additionally, this requires the joint efforts and cooperation of all countries in the world, because we live on the same earth. Green sustainable development has become the consensus of all countries [3].
The research on the resource utilization of ISW mainly includes three parts: the recycling of ISW, the recycling management system of ISW, and the prediction of industrial solid waste generation (ISWG). First, the recycling of ISW might contribute the most considerable part to the circular economy. The exploitable value of ISW is not low. Compared with wastewater and gas, ISW is more accessible for resource utilization. At present, ISW such as tailings, metallurgical slag, fly ash, and other wastes can be applied to new civil engineering materials, porous environmental materials, agriculture, manufacturing, and other fields. Solid waste from the leather industry can be used as a nitrogen source for the growth of common legumes [4]. Pablos et al. [5] use ISW composed of foundry sand to make block bricks and decorative pieces. The industrial value added compound 2-phenylethanol (2-PE) can be produced from waste [6]. Recovering precious metals from tailings and industrial waste is a practical resource utilization measure [7]. Geopolymer concrete produced using GGBFS can be used in the steel industry and mining [8]. Paper sludge can also be used in the manufacture of concrete. The results show that specimens made at room temperature have significant early strength and can maintain sufficient structural concrete strength. However, the tests of mechanical properties, durability, and material properties need further verification [9]. China is in a period of rapid development, and industrial production activities are necessary, so it is inevitable to produce ISW.
A carbon peak by 2030 and carbon neutrality by the end of 2060 have become China’s national core mission. To achieve this goal, China needs to carry out the transformation of the energy structure and the green and low carbon transformation of the social economy. Low carbonization of solid waste will be a crucial part of China’s carbon neutral vision. First of all, ISW can be used locally after simple treatment, which can reduce carbon emission during transportation. Secondly, the recycling of ISW can reduce the exploitation of natural materials and carbon emission in the process of raw material production. Taking cement production as an example, when the solid recovered fuel (SRF) prepared from commercial and industrial waste (C&IW) replaces the traditional fuel in the proportion of 80%, the carbon emission can be reduced by 20%. In this case, the global carbon emission will be reduced by 0.7 to 1.5 billion metric tons (Mts) in a year, and the fuel of the global cement industry will need 0.9 billion Mts of C&IW [10,11]. ISW can be recycled into a sustainable renewable binding material (RBM). As it has better unconfined compressive strength, scouring resistance, and freeze–thaw resistance than ordinary Portland cement (OPC), it has been successfully applied in practical engineering [12]. This shows that the application of ISW in cement production not only greatly reduces carbon emission, but also greatly improves the resource utilization rate. To understand the future development trend of ISW in China, a mathematical model can be used for prediction because forecasting is an important decision-making tool and technology, which can provide a database for decision-makers, researchers, municipalities, and government agencies to make plans [13]. Secondly, it is very necessary to establish a complete ISW recycling management system. There are many analytical methods or tools applied in the ISW issue, such as analytic hierarchy process (AHP), multiple linear regression (MLR) analysis, life cycle assessment (LCA), technique for order preference by similarity to an ideal solution (TOPSIS), fuzzy comprehensive evaluation (FCE), and machine learning (ML) [14,15]. They all can be used to predict ISWG. In detail, AHP has often been used in many countries and regions. For example, Khuzestan province in south western Iran used AHP to rank industrial units according to their share of solid waste related environmental pollution and determine each unit’s share of the total solid waste pollution load. An integrated set of direct, indirect, and complementary projects is proposed for solid waste pollution control [16]. In Shams Abad, two analytical methods, AHP and network analysis, were used to carry out a technical, economic, and environmental evaluation of the industrial waste production process [17]. Meanwhile, AHP can also be used to establish a model for managing ISW and develop a comprehensive enterprise resource planning and management method, which achieved remarkable results [18]. With the development of science and technology, more and more industries are integrated into computer technology. Waste management systems are no exception. Management systems integrated with computer technology mainly include multilevel solid waste management systems, artificial intelligence waste management systems, waste recovery chain systems, SWAN platforms, and industrial waste transportation systems [19]. Artificial intelligence and geographic information systems were incredibly widely used. Abdallah et al. [20] used artificial intelligence to deal with ISW management problems. Fernandez et al. [21] used geographic information system (GIS) technology to plan the location of landfill sites. Countries such as Greece, Bulgaria, Albania, and Cyprus were using the SWAN platform to develop business models for recycling ISW [22]. Considering the garbage collection network, based on the mixed integer two objective optimization model, the CPLEX solver in GAMS software can be used to solve and analyze the industrial garbage transportation system [23].
Due to the unbalanced development between the east and the west of China, there are significant regional differences in the overall efficiency and sectoral efficiency between China’s coastal and inland areas [24]. There are still deficiencies in the collection, storage, transportation, utilization, and disposal of ISW. For example, the generation of general industrial waste in Shanxi province and Hainan province accounted for 11.6% and 0.2% of the total amount in China in 2019. However, the comprehensive utilization rate of Hainan Province is higher than that of Shanxi Province, 67.8% and 40.2%, respectively. As a renewable resource, China’s ISW not only lacks a scientific management mode but also has some problems, such as high consumption, massive waste, low recovery rate, severe pollution and so on. In terms of the national standard system, there are still some problems in the management scope and requirements of the standard treatment of solid waste. The technical specifications for the site selection, access, design, construction, operation, and closure of general ISW storage and disposal sites need to be revised urgently [25]. No matter what kind of management system, it needs known data as research support. Therefore, it is very necessary to predict the ISWG in China in the future.
Finally, the prediction of ISWG is the basis for the government to make plans. A literature survey shows that MLR model [26], RBF neural network [27,28], fuzzy regression method [29], autoregressive integrated moving average (ARIMA) model [30], multivariable regression model [31], system dynamics model [32], adaptive neuro-fuzzy inference system (ANFIS) [33], multivariate grey model (MGM) [34] and other methods have proven to be suitable for predicting solid waste generation. Based on the former researchers’ studies [13,35,36,37,38,39], an artificial neural network (ANN) model has been proven to be a suitable tool for solid waste generation prediction because of its strong fault tolerance and its suitability for describing the complex relationship between variables in a multivariable system. For example, Ayeleru et al. [13] used an ANN model to predict the amount of municipal solid waste (MSW) in Johannesburg, South Africa, and showed that ten neuron structures (ANN10) functioned best with the square of regression R values (R2) of 99.99%. This indicates that the ANN is not only suitable for predicting the quantity of solid waste but also has high accuracy. Principal component analysis (PCA) can reduce irrelevant, redundant and noise variables in the data set [40,41,42]. At the same time, it can be used for various purposes, such as waste management program convergence, cooperation between administrations, site selection and the optimization of waste treatment plants, and more general waste management decisions [43]. Furthermore, the nonlinear autoregressive (NAR) neural model can predict the future municipal waste generation of any city [44]. Moreover, the generation of solid waste is a nonlinear dynamic process.
According to the pieces of literature, it is found that the combined model usually has higher prediction accuracy than the single model and is suitable for solid waste prediction. For example, combining grey model (GM) with MLR, support vector machine (SVM) and partial least squares (PLS) method can be used to predict city domestic refuse [38]. A new hybrid prediction method based on variational mode decomposition (VMD), the exponential smoothing model (ESM), and the GM method (VMD-ESM-GM) can be applied to the volume prediction of electronic waste [45].
To sum up, the first mock exam or single model is adopted, or the factors are not taken into consideration in the actual situation, and the prediction accuracy needs to be improved. Therefore, this paper will use a new model, the principal component analysis nonlinear autoregressive back propagation (PCA-NARBP) combination model, for prediction, in order to improve prediction accuracy and practical operability. Due to the huge amount of ISW, taking the annual output of 4 billion tons of ISW as an example, the error of 40 million tons can be reduced every 1% increase in accuracy. Therefore, the improvement of accuracy can more effectively help the government make plans. In this study, the annual ISWG is collected from China Statistical Yearbook (http://www.stats.gov.cn/tjsj/ndsj/ (accessed on 20 December 2021)), 1985–2020. Although a back propagation (BP) neural network is suitable for large sample size prediction, the PCA-NARBP combination model weakens the influence of data volume. Therefore, based on the PCA-NARBP combination model, it is feasible for us to use the basic data of 36 years to predict the ISWG in China in the future. The research objectives are as follows:
(1)
In order to predict the ISWG of China in the next 10 years, a new PCA-NARBP combination model is proposed. The model can provide high precision prediction in combination with the actual national conditions and limited amount of data. Compared with BP and nonlinear autoregressive back propagation (NARBP) models, the accuracy and superiority of the combined model are highlighted.
(2)
Combined with China’s actual national conditions, the influencing factors of society, economy, environment and technology are added to the model. A new combination model is established in combination with NARBP model, which is of practical significance and convenient for the formulation of follow up plans. This paper is one of the few papers that combine the actual national conditions and establish a combination model to predict ISWG and realize the resource management of ISW.

2. Method

Due to the limited amount of data, a suitable prediction model was numbered. To combine the influence of influential factors on the ISWG, PCA could be used to select indicators. Then, the indicators work as input variables to predict the production volume. Therefore, combined with the actual national conditions of China and the current situation of data collection, this study constructed the PCA-NARBP model to predict the ISWG for the next decade. The optimal model was compared with the single BP model and NARBP model. In this way, the annual output of ISW could be more accurately predicted to provide a data basis for subsequent development.

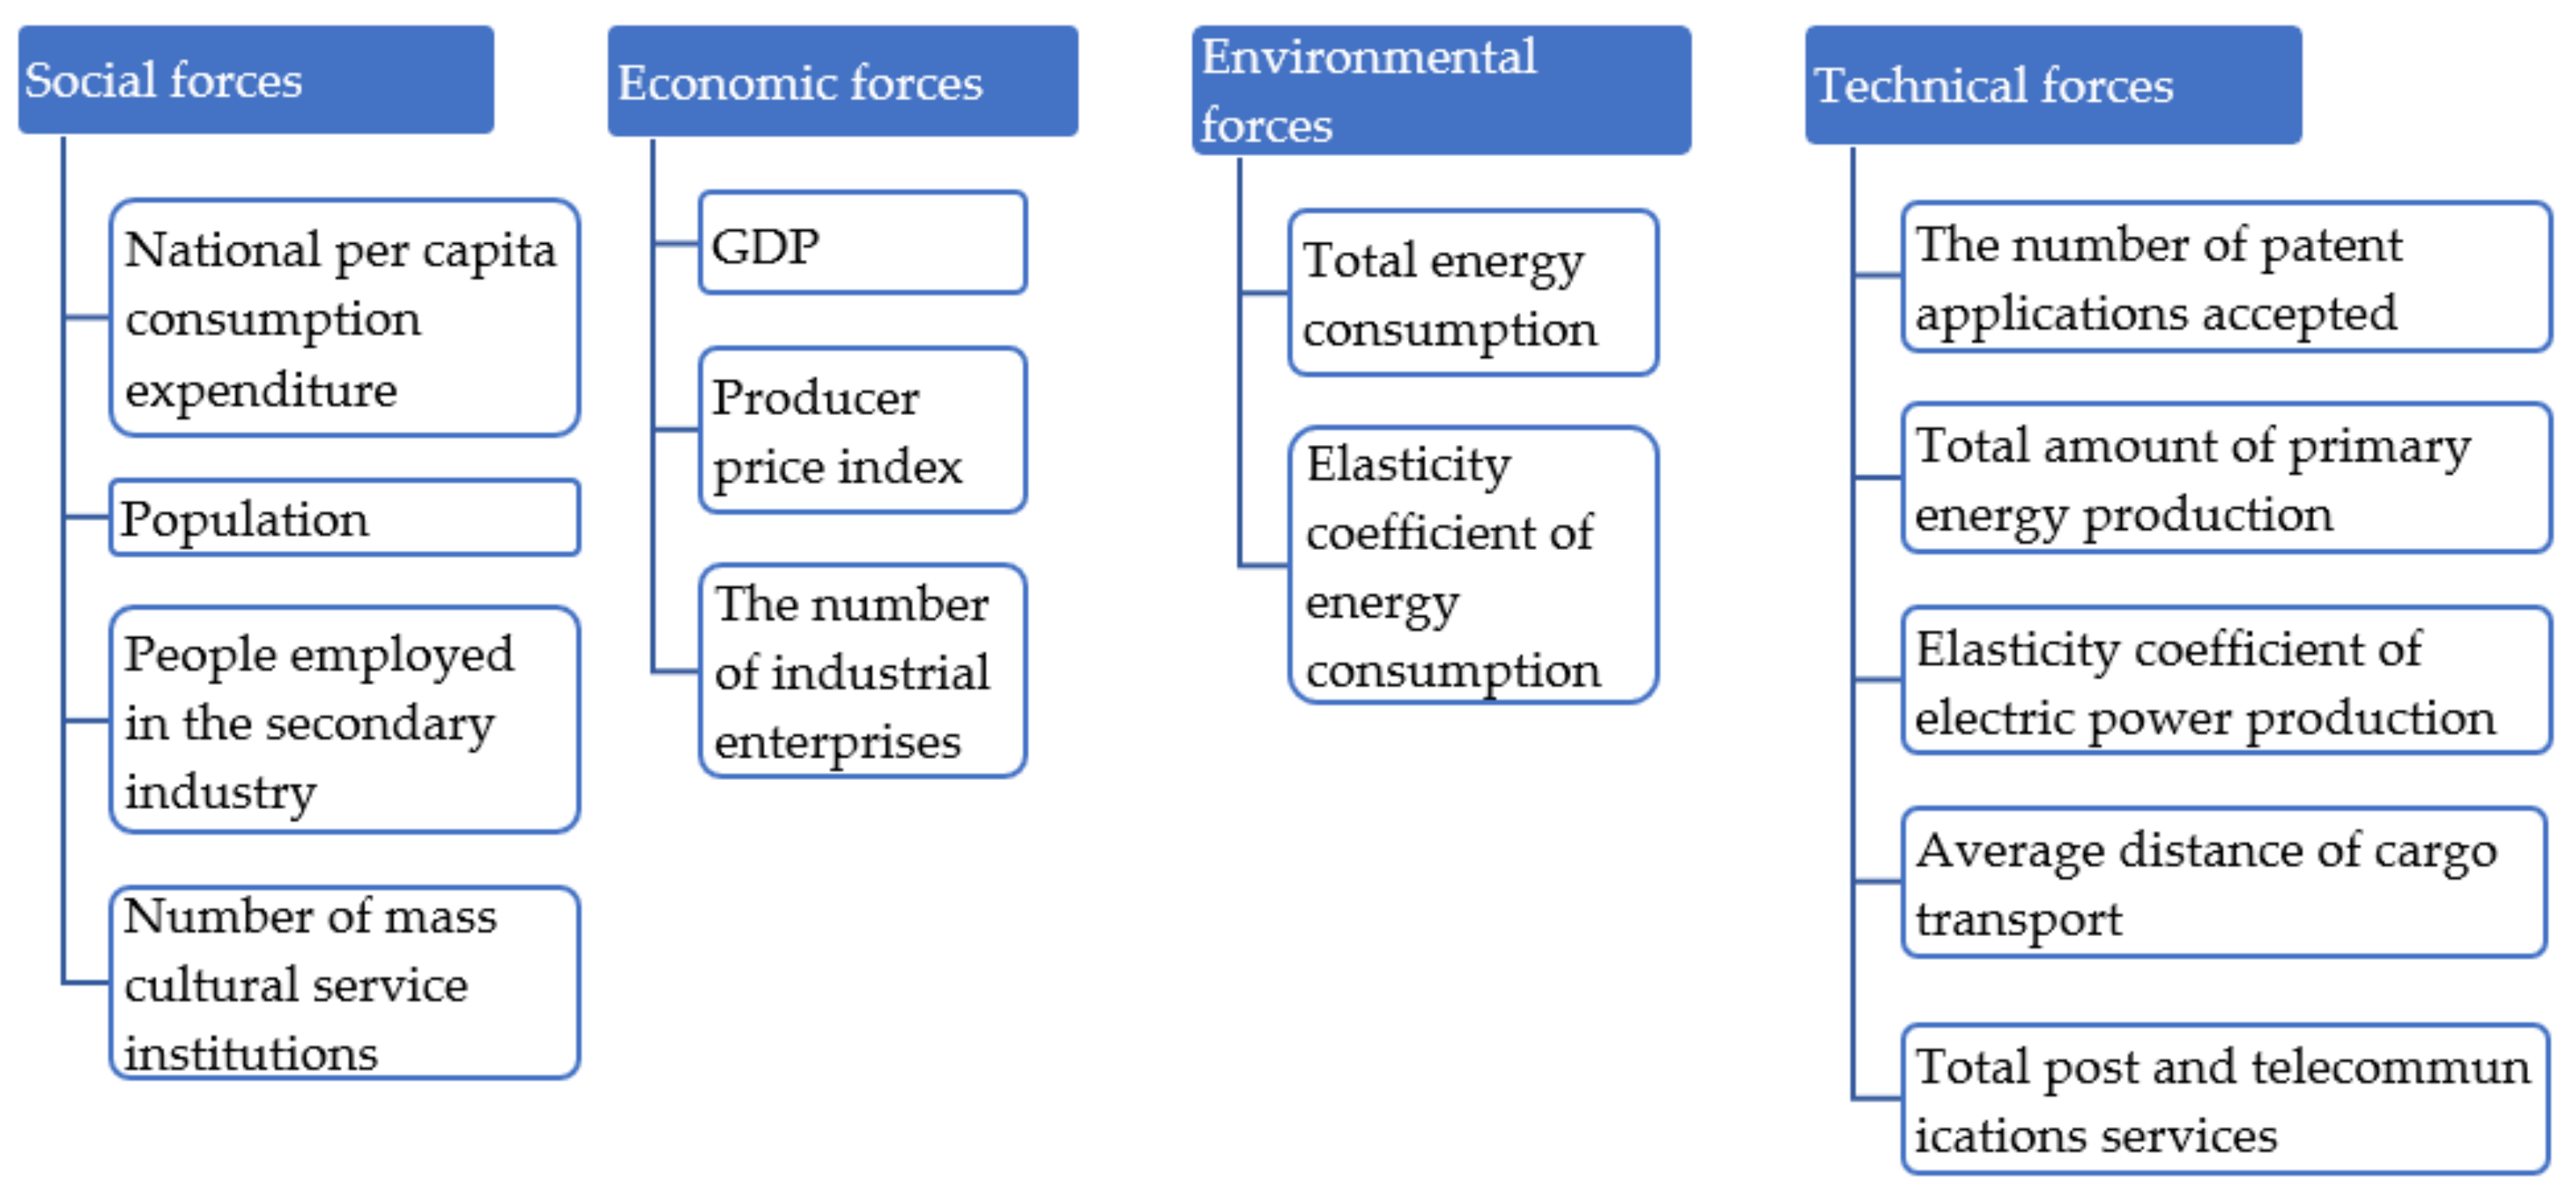
2.1. Data Collection

The study showed that ISW management was considered the most essential measure to reduce environmental pollution. Therefore, many scholars began to study the factors influencing ISWG. Zhang et al. [46] studied the impact of socio-economic driving factors on ISWG. The results showed that the reduction in economic expansion intensity could effectively slow down the growth trend of ISWG. Tsai et al. [47] proposed a set of attributes composed of four aspects using the fuzzy DEMATEL method, including social acceptability, environmental benefits, economic adequacy and technological integration, as well as 14 standards, namely, community concerns, legislation and policies, Coffey and Coad, resources efficiency, etc. The results showed that technology integration and social acceptability were the factors that promote MSW management. Nguyen et al. [48] used a model based on machine learning (ML) to predict the MSW generated in a region of Vietnam. The variables covered included urban population (Upo), total retail sales of consumer goods (Trs), per capita monthly income (Amipp), etc. The simulation results showed that urban population, monthly average consumption expenditure and total retail sales were the variables most influential on MSW. Li and Fan [49] selected the four indicators of GDP, total industrial output value, employed population in secondary industries and energy consumption to analyze ISWG. The results showed that energy consumption was the main factor affecting ISWG. Based on the above research and combined with the actual situation of China, the factors affecting the ISWG were extracted from four aspects: society, economy, environment, and technology. The specific forces screening process is shown in Figure 1.
Generally speaking, social forces referred to factors or elements in society, mainly including living conditions, population, employment level, and cultural level. This study selected the national per capita consumption expenditure (NPCCE) to represent the living conditions of residents. The total population (Pop) represented the resident population. The number of employed people could be used to measure the level of employment. The industrial structure was divided into primary, secondary, and tertiary industries. The primary industry mainly referred to agriculture, and the second related to industry and construction. The tertiary sector referred to other industries outside of the primary sector and the secondary industry. Common ones were transportation, catering, real estate, etc. Since the sector belonged to the secondary sector, the employed persons in the secondary sector (IPop) could represent the employment level of the industry. The cultural group could be expressed by the number of mass cultural service institutions (NCSI).
Economic forces referred to the macroeconomic situation of a country or region that affects enterprise marketing activities, mainly including economic development, product price, economic structure, and so on. This paper selected the gross domestic product (GDP) to represent China’s economic development. Product prices were expressed by the industrial producer price index (PPI). The number of industrial enterprises (NIE) represented the industrial economic structure.
Environmental forces mainly referred to energy, raw material consumption, and other related environmental problems. Total energy consumption (TEC) could reflect the energy problem. The elasticity coefficient of energy consumption (ECEC) could represent the consumption trend and change of industrial raw materials.
Technological forces referred to the results of technological changes in designing, producing, and selling products and services. The number of patent applications accepted (NPAA) was chosen to represent design capacity. The total amount of primary Energy production (TPEP) and the elasticity coefficient of electric power production (ECEPP) were selected to represent production capacity. The average distance of transportation (ADT) represented transportation capacity. Communication technology was characterized by total postal and telecommunications services (TPTS).
To sum up, a total of 14 influencing factors from four aspects were selected. The primary data were obtained from the National Bureau of Statistics of China (http://www.stats.gov.cn/tjsj/ndsj/ (accessed on 20 December 2021)). This study collected the data of ISWG and 14 related factors from 1985 to 2020. Among them, the data from 1999 to 2020 came from the China Statistical Yearbook published by China’s National Bureau of Statistics (http://www.stats.gov.cn/tjsj/ndsj/ (accessed on 20 December 2021)). The data from 1985 to 1998 came from the China Statistical Yearbook in the database of China National Knowledge Infrastructure (CNKI, https://navi.cnki.net/knavi/yearbooks/YINFN/detail (accessed on 2 October 2021)). The latest edition of China Statistical Yearbook, published in September 2021, contained statistical data for 2020. Therefore, the research data of this study was newer and more comprehensive than the data from 2006 to 2017 in [3].

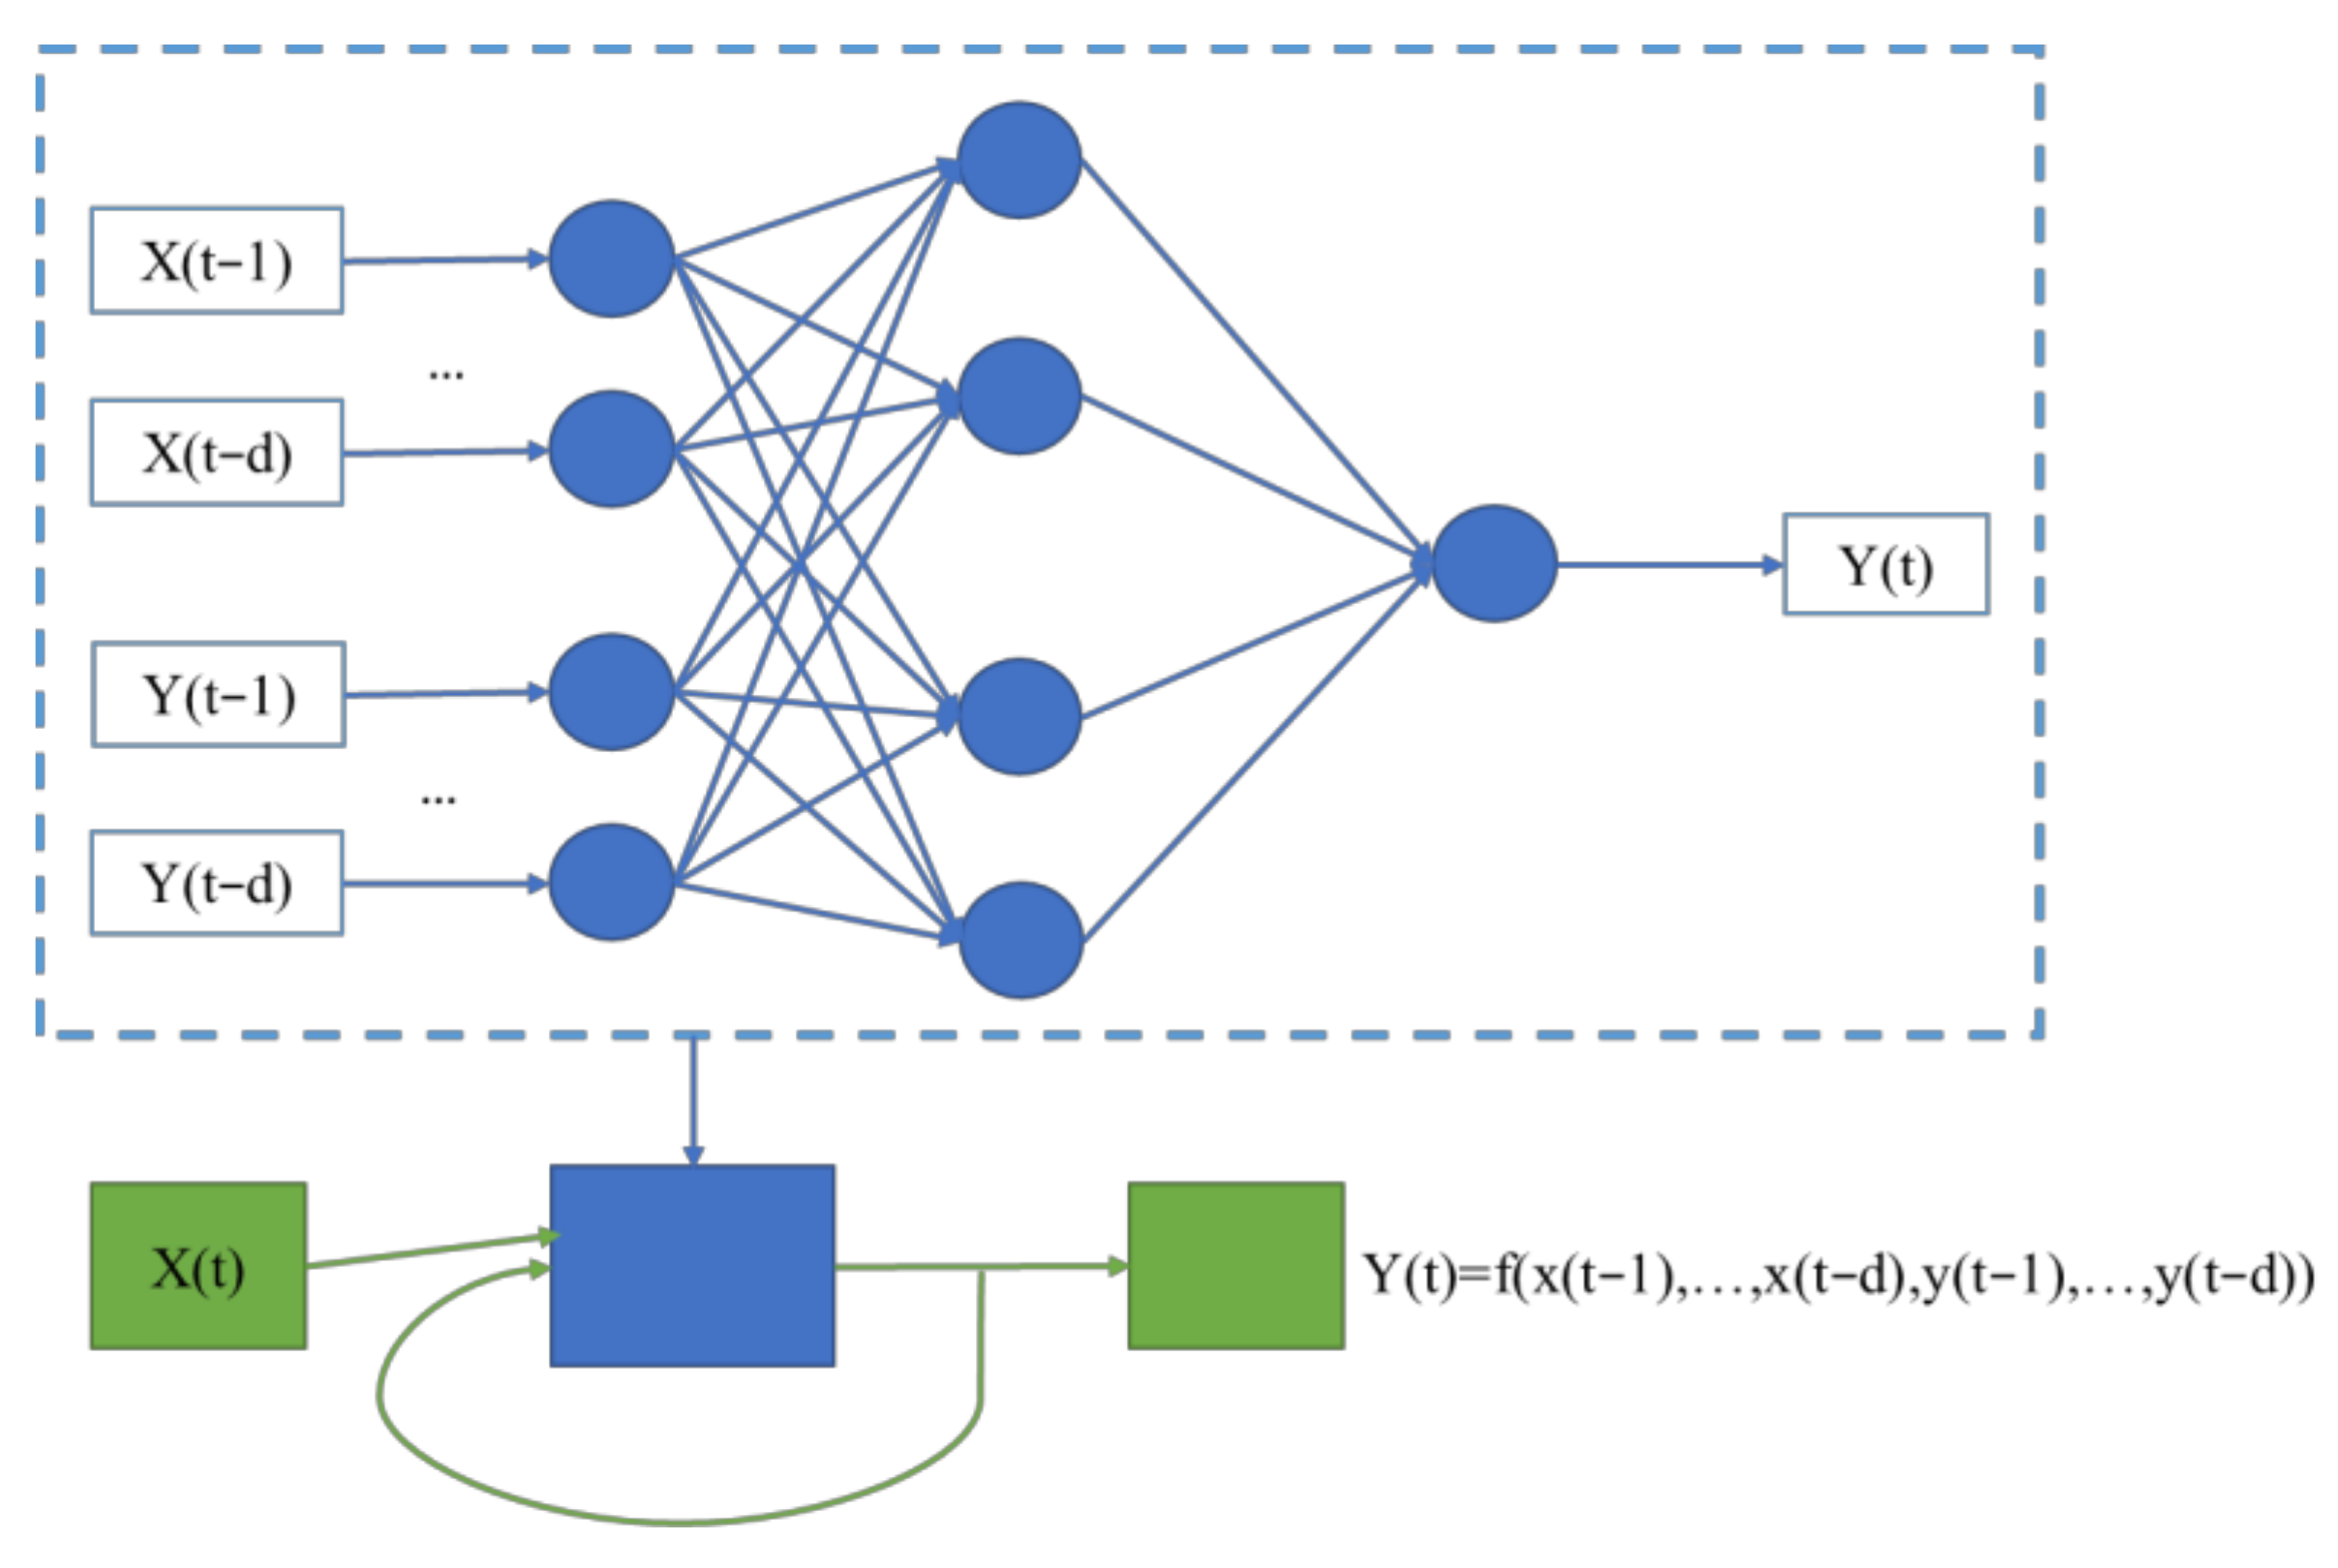
2.2. PCA-NARBP Combinatorial Model

In the mid-1980s, parallel distributed processing described the algorithm based on BP [50]. It can solve the problem of learning the connection weights of hidden layer neurons in multilayer networks, and some issues that could not be solved by a single perceptron before, which shows that ANN has powerful computing ability [51].
The original data of ISWG belong to nonlinear time series data. In this study, the prediction model of PCA-NARBP is constructed by integrating the order identification ability of the linear autoregressive model and the nonlinear processing ability of the neural network model.
This method is often used to solve nonlinear problems because of its advantages of reliable basis, rigorous derivation process, high precision, good versatility, and excellent self-learning ability. BP neural network is a kind of ANN widely used in waste production forecasting. In predicting solid waste production, a single hidden layer is usually sufficient, and the optimal number of hidden layer nodes is most likely from 4 to 20 [52,53]. Therefore, a PCA-NARBP neural network with a single hidden layer is established in the process. The universal number of hidden layer nodes is 10.
Firstly, the fundamental part of the model is composed of NARBP neural network. The NAR model is derived from the linear AR(P) model. The basic formula of the linear autoregressive (AR) model is as follows:
Y t A R = ϕ 1 Y t 1 + ϕ 2 Y t 2 + + ϕ p Y t p + e t
The nonlinear autoregressive model is:
Y t N A R = h ϕ 1 Y t 1 + ϕ 2 Y t 2 + + ϕ p Y t p + e t
In Equation (2), h is the unknown smooth function; E e t | Y t 1 , Y t 2 , , Y 1 = 0 , e t is zero mean, and has limited variance σ 2 . Under these conditions, a given Y t 1 , Y t 2 , , Y 1 minimum mean square error of state of average is Y t ^ .
Y t ^ = h Y t 1 , Y t 2 , , Y t p = h ϕ 1 Y t 1 + ϕ 2 Y t 2 + + ϕ p Y t p   t p + 1
In the BP algorithm, the forward propagation value, back propagation value, weight, and bias value are calculated in three steps. From Equation (4), Equation (5), and Equation (6), respectively.
Calculate the forward propagation value of the neural network.
n m = W m y m 1 + b m , m = 1 , 2 , , M M > 2 y m = f m n m y = y M
Calculate the back propagation value of neural network sensitivity.
s M = 2 F M ´ n M t y s m 1 = F m 1 ´ n m 1 W m T s m , m = M , , 2 , 1 M 2
Approximate gradient descent is used to update weights and bias values.
W m k + 1 = W m k η s m y m 1 T b m k + 1 = b m k η s m
Based on the above analysis, PCA is considered into NARBP neural network in this study, and we can build a PCA-NARBP prediction model with a hidden layer, as shown in Figure 2.
Figure 2 shows that the conditional mean value is:
Y t ^ = h ^ X t 1 , , X t d , Y t 1 , , Y t d = c i = 1 H ω i g j = 1 d X t j ω i t j + j = 1 d Y t j ω i t j + φ i + θ .
Here, X is the input variable, Y is the output variable, and g is the transfer function of the hidden layer, c is the transfer function of the output layer, ω i t j is the connection weight between neuron node t j and neuron node i , φ i   a n d   θ are thresholds.
In this model, 70% of samples were selected as training samples to train the model, and the remaining 30% of samples were used as test samples. All computations were performed in MATLAB (ver. MATLAB, R2020, The MathWorks) using in house functions based on existing algorithms.

3. Results

3.1. Correlation Discussion

According to the description in Section 2.1, this section considered the 14 influential factors, namely, NPCCE, Pop, IPop, NCSI, GDP, PPI, etc. The values of the correlation coefficients simply calculated by SPSS are shown in Table 1. Since it was more important to check the statistical significance of these coefficients than to calculate only the linear relationship between two variables, the critical correlation coefficient R c r i t must be calculated [54].
R c r i t = t c r i t d f + t c r i t 2
where d f = n k is the degree of freedom; n is the number of data sets and k is the number of explanatory variables; t c r i t is the threshold between retaining and rejecting null assumptions. If R c r i t is less than the correlation coefficient, it indicates that the correlation between the two variables is statistically valid. In this study, R c r i t , using a significance level of 0.05 (two-tailed tests), equals 0.4. It can be seen from Table 1 that the absolute value of the correlation coefficient between the number of industrial enterprises in China (NIE), energy consumption of elasticity coefficient (ECEC) and elasticity coefficient of electric power production (ECEPP) and ISWG is less than 0.4, indicating that there is no significant linear relationship between them and ISWG. Therefore, they are eliminated.
Table 1. The correlation coefficient between each influential factor and ISWG.
ForcesISWGForcesISWG
NPCCE0.988TEC0.975
Pop0.851ECEC−0.099
IPop0.869TPEP0.969
NCSI0.578ECEPP0.001
GDP0.989ADT0.779
PPI−0.428TPTS0.759
NIE−0.040NPAA0.962
As can be seen from Table 1, the correlation coefficient between NPCCE, POP, IPOP, NMCSI, GDP, TEC, TPEP, ADCT, PTNB, NPAA, and ISWG is positive, which means that ISWG will increase with the increase in any of these parameters. PPI has a negative correlation with ISWG, which shows that the higher the PPI, the lower the ISWG; the greater the change trend and range of exfactory prices when the products of industrial enterprises are sold for the first time, the more unstable the market and the less ISW.

3.2. Principal Component Analysis

In order to improve the function of the model, it is necessary to reduce the dimension of the input variables, so as to reduce the irrelevant or highly related attributes and redundant feature variables in the model [55,56]. In this way, many relevant variables can become a few representative variables through PCA. The calculation results are shown in Table 2. It includes the initial eigenvalue of each variable, the variance to the ISWG and the cumulative contribution rate.
In general, the principal components whose cumulative contribution rate reaches more than 85% after PCA can be used as input variables. To reflect the influence of the main components as much as possible, this paper selects the main components with a cumulative contribution rate of more than 95%. From Table 2, there are three central components with a cumulative contribution rate of more than 95%. Therefore, they are used in the follow-up study. From the composition matrix, it can be concluded that, among the three principal components, NCSI, PPI, and TEC account for a large proportion. This shows that residents’ educational and cultural level, economic stability, and energy consumption play a decisive role in ISWG.

3.3. Error Test

To verify the accuracy and superiority of the PCA-NARBP model, it is compared with the mean absolute percentage error (MAPE) and R2 of BP and NARBP prediction results [38,48], where MAPE is the average squared error difference between outputs and targets. Lower values are better. Zero means no error. R2 measures the correlation between outputs and targets. An R value of 1 indicates a close relationship, 0 a random relationship. The formulas of MAPE and R2 are shown in Equation (9) and Equation (10). As the weights in the BP network training are not fixed, resulting in the instability of the whole prediction network, it is necessary to carry out multiple trainings and predictions to extract the best group. This study was simulated ten times. The prediction results are shown in Table 3.
MAPE % = 1 n i = 1 n x t x ^ t x t × 100
R 2 = 1 i = 1 n x ^ t x t x ¯ t x t 2 2
Here, x t indicates the actual value, x ^ t indicates the expected value, and x ¯ t indicates the average value of the true value.
When MAPE is less than 10, it indicates that the model’s accuracy is high. As can be seen from Table 3 and Figure 3a, the MAPE of BP, NARBP and PCA-NARBP models are less than 10, and the prediction accuracy is high. This shows that the BP neural network can be used to predict ISWG. Among them, the maximal absolute error (MAE) of the short term prediction accuracy of ISWG by the BP model is 17.9%, the minimal absolute error is 0, and the MAPE is 3%. The maximal error was found in 2020. The MAE of the NARBP model for the short term prediction accuracy of ISWG is 13.8%, the minimal absolute error is 0, and the MAPE is 2.96%. The maximal error was in 1998. The MAE of the PCA-NARBP model for the short term prediction accuracy of ISWG is 16.9%, the minimal absolute error is 0, and the MAPE is 1.24%. The maximal error occurred in 1990. This proves that the prediction accuracy of the combined model is better than the single prediction model.
From Figure 3b, it is evident that, for the prediction from 2010 to 2020, the MAE of the BP model for the short term prediction accuracy of ISWG is 17.9%, the minimal absolute error is 0, and the MAPE is 5.81%. The maximal error appeared in 2020. The MAE of the NARBP model for the short term prediction accuracy of ISWG is 12.1%, the minimal absolute error is 0, and the MAPE is 2.32%. The maximal error was appeared in 2016. The MAE of the PCA-NARBP model for the short term prediction accuracy of ISWG is 4.02%, the minimal absolute error is 0, and the MAPE is 0.39%. The maximal error was found in 2013. The prediction results of the BP model and NARBP model show that the early prediction results are better than the PCA-NARBP model. However, the later developments showed that the PCA-NARBP model was better. Therefore, the error fluctuation ranges of BP and NARBP are extensive, while the error fluctuation range of PCA-NARBP is small, and the predicted value is more consistent with the true value. This proves that the PCA-NARBP model has better prediction potential and can be used for annual ISWG in China. Therefore, using PCA-NARBP to predict the ISWG in China from 2021 to 2030 should be the preferred way.

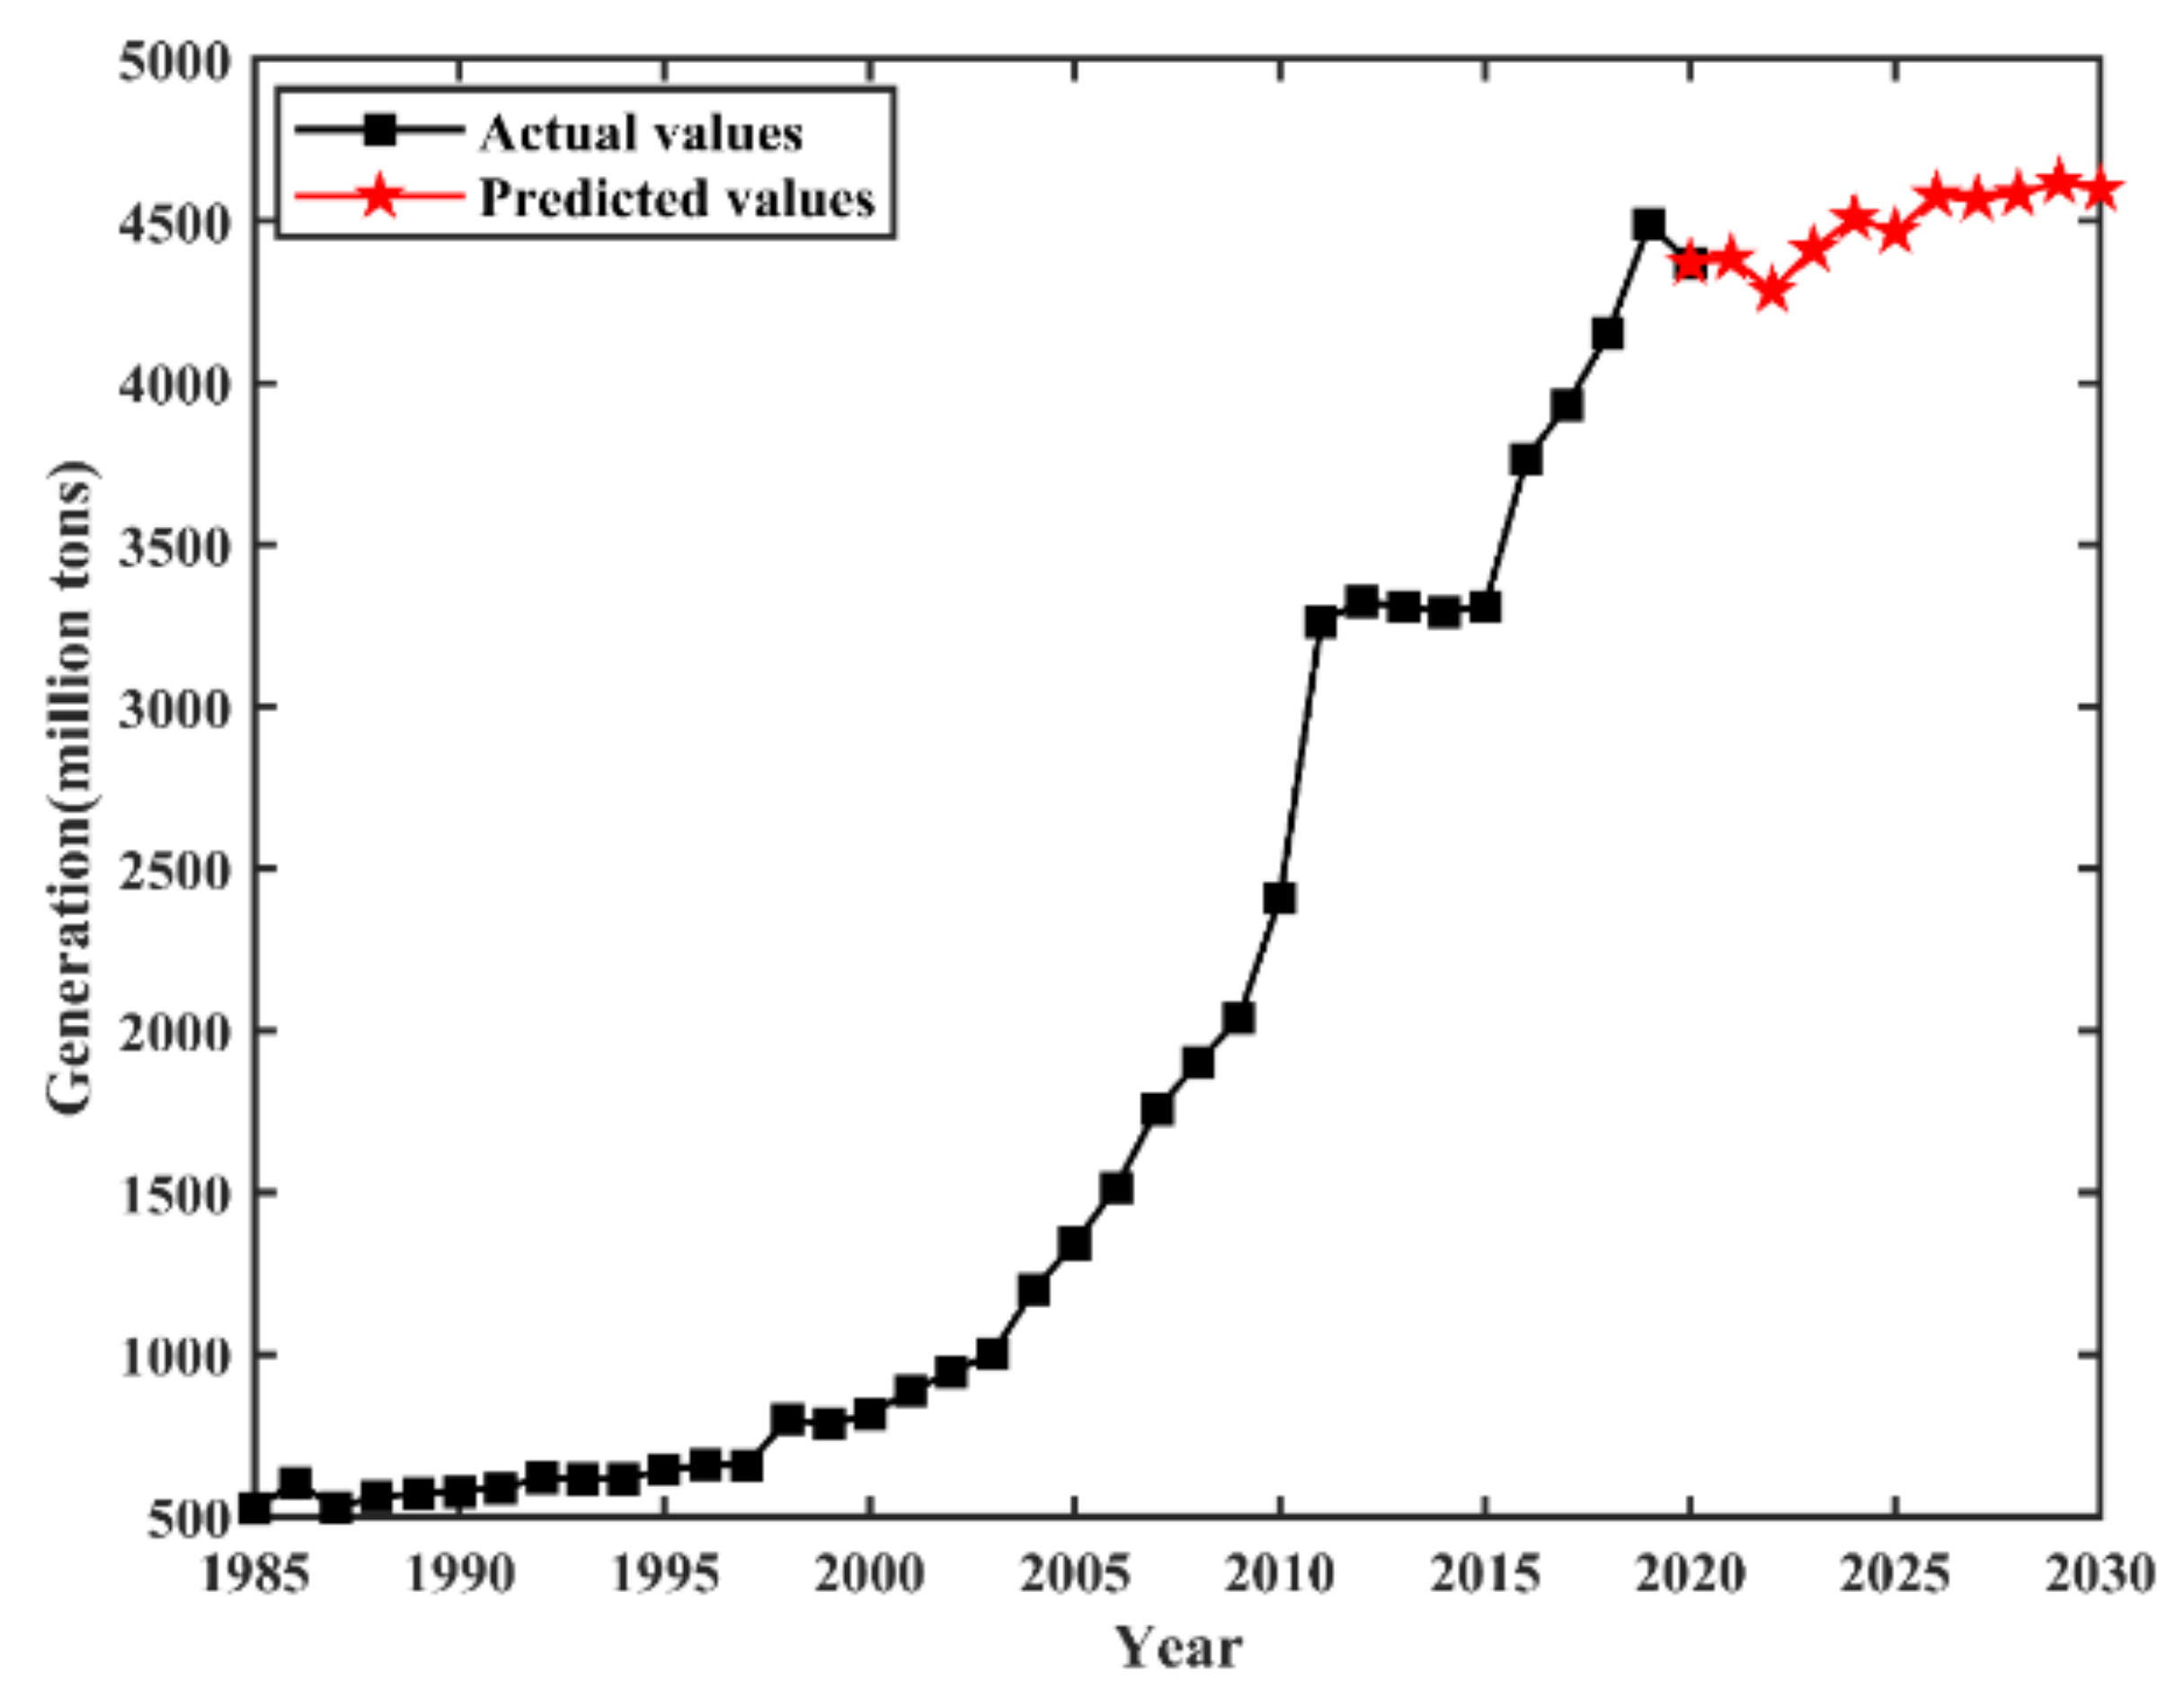
3.4. Forecast the ISWG in China in the Next Ten Years

Based on the PCA-NARBP model, this section uses the data of the past 36 years to predict the ISWG in the next decade. The prediction results are shown in Figure 4.
Figure 4 shows that the annual ISWG in China will still show an upward trend in the next 10 years. The maximal output is 4.62 billion tons in 2026, and the minimal output is 4.28 billion tons in 2022, the average annual output would be 4.5 billion tons. At the same time, the prediction results show that the total amount of ISW begins to establish a stable state. In addition, the annual ISW will be stable, at about 4.6 billion tons, in the next ten years. This means that China will always be committed to green and sustainable development and take corresponding measures to treat ISW.

4. Discussion

The resource utilization and management of ISW is of great significance to China’s sustainable development. Based on this motivation, this study uses the PCA-NARBP combined model to predict China’s ISW. In training the past data, the MAPE (%) of the three models are less than ten and R2 is more significant than 0.98. This shows that the accuracy of the three models is very high and verifies the conclusion that the ANN is suitable for predicting ISWG. This result is consistent with other studies [13,38]. Compared with the single BP model and single NARBP model, the PCA-NARBP model is more accurate. The single BP model predicts that the MAPE is 3.0019% and R2 is 0.9845. The NARBP model is 2.9622% and 0.9952. In comparison, the PCA-NARBP model is 1.2489% and 0.9993. More importantly, there is a small gap between the later prediction results of the PCA-NARBP model and the actual value. According to the prediction results from 2010 to 2020, the MAPE of the PCA-NARBP model is only 0.39%, compared with the 5.81% of the BP model and the 2.32% of the NARBP model. This proves that the PCA-NARBP model has better prediction potential and can be used to predict the annual ISWG. This proves that the first mock exam is more accurate than the single model. The result is also consistent with other people’s research [45]. Moreover, it is also proven that, when the amount of data is limited, combined with PCA and NAR, it can effectively reduce the uncorrelated, redundant and noise variables in the data set, and is very suitable for a nonlinear data set [43,44].
In addition, the ISWG of China from 2021 to 2030 shows a slow growth trend, which will be controlled between 4.28 billion tons and 4.62 billion tons. These predictions are lower than those obtained in [3]. According to the Annual Report of Ecological Environment Statistics released by the Ministry of Ecology and Environment of the People’s Republic of China, China’s ISWG was 4.41 billion tons in 2019. This is close to the result of this paper. Since the global outbreak of COVID-19 in 2019, industrial production has been restricted, so ISWG has decreased slightly, which is consistent with the actual situation.
According to the prediction of this paper, it is obvious that total ISWG is on the rise. In order to achieve the goal of sustainable development and carbon emission reduction, the government should introduce relevant policies. The key to achieving the goal lies in the implementation of enterprises’ and institutions’ and everyone’s efforts. All enterprises should produce and dispose of ISW in a reasonable and standardized manner in accordance with the policy requirements. Everyone should recognize the importance of recycling and supervise the whole process from solid waste generation to reuse. Putting the plan into action is an effective way to utilize industrial solid waste as a resource. At the same time, considering regional differences and ISW efficiency, local governments should adjust the implementation plan in combination with regional characteristics in a timely manner [24].

5. Conclusions

The MAPE value of the PCA-NARBP combined model is the lowest compared with the single BP and NARBP models. Based on the data of the past 36 years, the PCA-NARBP model predicts that the annual ISWG in China will be stable at about 4.6 billion tons in the next ten years. This result can provide data support for domestic policy-making. For example, based on the predicted value of 4.6 billion tons, the number of existing ISW disposal centers with an annual treatment capacity of 8 million tons is far from enough to complete the task of resource treatment. It is estimated that about 575 resource processing centers of the same scale are required. Although China has made great efforts to dispose of ISW, it still needs to make more tremendous efforts in the future. Simultaneously, the resource treatment of solid waste is conducive to a reduction in carbon emissions. Carbon neutralization is a consensus reached by mankind in response to global climate change. Countries all over the world should actively commit to achieving the goal of carbon neutralization. The ecological environment is related to human survival and sustainable development, which requires the unity and cooperation of all countries to jointly cope with the challenges.
To ensure the accuracy of the prediction results, the influencing factors mainly cover four aspects: society, economy, environment and technology. Among them, the leading factors are NCSI, PPI and TEC. This points to the fact that improving the educational and cultural level of residents, stabilizing economic development, and reducing energy consumption are effective means to control the generation of ISW. Considering the task requirements of carbon emission reduction, the government has issued relevant policies. The key to achieving carbon emission reduction lies in implementing enterprises’ and everyone’s efforts. All enterprises should produce and dispose of ISW in a reasonable and standardized manner. Everyone should recognize the importance of recycling and supervise the whole process from solid waste generation to reuse. Putting the plan into action is an effective way to utilize ISW as a resource.

Author Contributions

Conceptualization, H.-M.L. and H.-H.S.; data curation, R.G. and D.D.R.A.; formal analysis, H.-H.S.; funding acquisition, H.-M.L.; investigation, H.Y.; methodology, H.-H.S. and W.-M.H.; project administration, W.-M.H.; resources, R.G.; software, H.-H.S.; supervision, H.-M.L. and W.-M.H.; validation, H.-M.L.; visualization, D.W.; writing–original draft, H.-H.S.; writing–review and editing, H.-M.L. and W.-M.H. All authors have read and agreed to the published version of the manuscript.

Funding

This research was funded by the Doctoral Research Fund of Nantong University, grant number 2018-33 and the Graduate Student Research Innovation Project of Jiangsu Province of Jiangsu Education Department, grant number KYCX20_2832.

Institutional Review Board Statement

Not applicable.

Informed Consent Statement

Not applicable.

Data Availability Statement

Data will be made available from the corresponding authors on reasonable request.

Conflicts of Interest

The authors declare no conflict of interest. The funders had no role in the design of the study; in the collection, analyses, or interpretation of data; in the writing of the manuscript, or in the decision to publish the results.

References

  1. Sorg, T.J. Industrial solid waste management. J. Water Pollut. Control Fed. 1972, 44, 1107–1108. [Google Scholar]
  2. Nai, C.; Tang, M.; Liu, Y.; Xu, Y.; Dong, L.; Liu, J.; Huang, Q. Potentially contamination and health risk to shallow groundwater caused by closed industrial solid waste landfills: Site reclamation evaluation strategies. J. Clean. Prod. 2021, 286, 125402. [Google Scholar] [CrossRef]
  3. Yang, Z.; Chen, H.; Du, L.; Lu, W.; Qi, K. Exploring the industrial solid wastes management system: Empirical analysis of forecasting and safeguard mechanisms. J. Environ. Manag. 2021, 279, 111627. [Google Scholar] [CrossRef]
  4. Lima, D.Q.; Oliveira, L.C.A.; Bastos, A.R.R.; Carvalho, G.S.; Marques, J.G.S.M.; Carvalho, J.G.; de Souza, G.A. Leather Industry Solid Waste as Nitrogen Source for Growth of Common Bean Plants. Appl. Environ. Soil Sci. 2010, 2010, 703842. [Google Scholar] [CrossRef]
  5. Pablos, J.M.; Sichieri, E.P.; Izeli, R.L. Reuse of the industrial solid waste, consisting for foundry sands, in the confection of massive bricks and decorative pieces. J. Archit. Urban. 2009, 0, 112–125. [Google Scholar]
  6. Martinez-Avila, O.; Munoz-Torrero, P.; Sanchez, A.; Font, X.; Barrena, R. Valorization of agro-industrial wastes by producing 2-phenylethanol via solid-state fermentation: Influence of substrate selection on the process. Waste Manag. 2021, 121, 403–411. [Google Scholar] [CrossRef]
  7. Krishnan, S.; Zulkapli, N.S.; Kamyab, H.; Taib, S.M.; Din, M.F.B.M.; Majid, Z.A.; Chaiprapat, S.; Kenzo, I.; Ichikawa, Y.; Nasrullah, M.; et al. Current technologies for recovery of metals from industrial wastes: An overview. Environ. Technol. Innov. 2021, 22, 101525. [Google Scholar] [CrossRef]
  8. Krishna, R.S.; Mishra, J.; Meher, S.; Das, S.K.; Mustakim, S.M.; Singh, S.K. Industrial solid waste management through sustainable green technology: Case study insights from steel and mining industry in Keonjhar, India. Mater. Today Proc. 2020, 33, 5243–5249. [Google Scholar] [CrossRef]
  9. Mavroulidou, M.; Shah, S. Alkali-activated slag concrete with paper industry waste. Waste Manag. Res. 2021, 39, 466–472. [Google Scholar] [CrossRef]
  10. Khan, M.M.H.; Havukainen, J.; Horttanainen, M. Impact of utilizing solid recovered fuel on the global warming potential of cement production and waste management system: A life cycle assessment approach. Waste Manag. Res. 2021, 39, 561–572. [Google Scholar] [CrossRef]
  11. Viczek, S.A.; Aldrian, A.; Pomberger, R.; Sarc, R. Origins of major and minor ash constituents of solid recovered fuel for co-processing in the cement industry. Waste Manag. 2021, 126, 423–432. [Google Scholar] [CrossRef] [PubMed]
  12. Liu, Y.; Hu, X.; Luo, X.; Zhou, Y.; Wang, D.; Farah, S. Identifying the most significant input parameters for predicting district heating load using an association rule algorithm. J. Clean. Prod. 2020, 275, 122984. [Google Scholar] [CrossRef]
  13. Ayeleru, O.O.; Fajimi, L.I.; Oboirien, B.O.; Olubambi, P.A. Forecasting municipal solid waste quantity using artificial neural network and supported vector machine techniques: A case study of Johannesburg, South Africa. J. Clean. Prod. 2021, 289, 125671. [Google Scholar] [CrossRef]
  14. Christensen, T.H.; Damgaard, A.; Levis, J.; Zhao, Y.; Bjorklund, A.; Arena, U.; Barlaz, M.A.; Starostina, V.; Boldrin, A.; Astrup, T.F.; et al. Application of LCA modelling in integrated waste management. Waste Manag. 2020, 118, 313–322. [Google Scholar] [CrossRef]
  15. Guo, H.N.; Wu, S.B.; Tian, Y.J.; Zhang, J.; Liu, H.T. Application of machine learning methods for the prediction of organic solid waste treatment and recycling processes: A review. Bioresour. Technol. 2021, 319, 124114. [Google Scholar] [CrossRef]
  16. Karamouz, M.; Zahraie, B.; Kerachian, R.; Mahjouri, N.; Moridi, A. Development of a master plan for industrial solid waste management. Int. J. Environ. Sci. Technol. 2006, 3, 229–242. [Google Scholar] [CrossRef] [Green Version]
  17. Nouri, D.; Sabour, M.R.; GhanbarzadehLak, M. Industrial solid waste management through the application of multi-criteria decision-making analysis: A case study of Shamsabad industrial complexes. J. Mater. Cycles Waste Manag. 2016, 20, 43–58. [Google Scholar] [CrossRef]
  18. Mesa Fernandez, J.M.; Palacios, H.M.; Alvarez Cabal, J.V.; Martinez Huerta, G.M. Methodology for industrial solid waste management: Implementation to sludge management in Asturias (Spain). Waste Manag. Res. 2014, 32, 1103–1112. [Google Scholar] [CrossRef]
  19. Zhang, M.; Wang, Y.; Song, Y.; Zhang, T.; Wang, J. Manifest system for management of non-hazardous industrial solid wastes: Results from a Tianjin industrial park. J. Clean. Prod. 2016, 133, 252–261. [Google Scholar] [CrossRef]
  20. Abdallah, M.; Abu Talib, M.; Feroz, S.; Nasir, Q.; Abdalla, H.; Mahfood, B. Artificial intelligence applications in solid waste management: A systematic research review. Waste Manag. 2020, 109, 231–246. [Google Scholar] [CrossRef]
  21. Fernandez Nascimento, V.; Loureiro, A.I.S.; Andrade, P.R.; Guasselli, L.A.; Ometto, J.P.B. A worldwide meta-analysis review of restriction criteria for landfill siting using geographic information systems. Waste Manag. Res. 2021, 39, 409–426. [Google Scholar] [CrossRef] [PubMed]
  22. Angelis-Dimakis, A.; Arampatzis, G.; Pieri, T.; Solomou, K.; Dedousis, P.; Apostolopoulos, G. SWAN platform: A web-based tool to support the development of industrial solid waste reuse business models. Waste Manag. Res. 2021, 39, 489–498. [Google Scholar] [CrossRef] [PubMed]
  23. Ranieri, J.; Vincenzi, A.; Chebira, A.; Atienza, D.; Vetterli, M. Near-Optimal Thermal Monitoring Framework for Many-Core Systems-on-Chip. IEEE Trans. Comput. 2015, 64, 3197–3209. [Google Scholar] [CrossRef]
  24. Tang, J.; Wang, Q.; Choi, G. Efficiency assessment of industrial solid waste generation and treatment processes with carry-over in China. Sci. Total Environ. 2020, 726, 138274. [Google Scholar] [CrossRef] [PubMed]
  25. Liu, Y.; Guo, D.; Dong, L.; Xu, Y.; Liu, J. Pollution Status and Environmental Sound Management (ESM) Trends on Typical General Industrial Solid Waste. Procedia Environ. Sci. 2016, 31, 615–620. [Google Scholar] [CrossRef] [Green Version]
  26. Buenrostro, O.; Bocco, G.; Vence, J. Forecasting generation of urban solid waste in developing countries—A case study in Mexico. J. Air Waste Manag. Assoc. 2001, 51, 86–93. [Google Scholar] [CrossRef] [Green Version]
  27. Falamaki, A.; Shahin, S. Determination of Shear Strength Parameters of Municipal Solid Waste from Its Physical Properties. IJST T. Civ. Eng. 2018, 43, 193–201. [Google Scholar] [CrossRef]
  28. Giantomassi, A.; Ippoliti, G.; Longhi, S.; Bertini, I.; Pizzuti, S. On-line steam production prediction for a municipal solid waste incinerator by fully tuned minimal RBF neural networks. J. Process Control 2011, 21, 164–172. [Google Scholar] [CrossRef]
  29. Srivastava, A.K.; Nema, A.K. Forecasting of solid waste composition using fuzzy regression approach: A case of Delhi. Int. J. Environ. Waste Manag. 2008, 2, 65–74. [Google Scholar] [CrossRef]
  30. Yu, Y.; Huang, Q.P.; Ma, X.Y.; He, J.H. Prediction of Urban Waste Disposal Based on ARIMA Model. Appl. Mech. Mater. 2015, 768, 707–713. [Google Scholar] [CrossRef]
  31. Al-Salem, S.M.; Al-Nasser, A.; Al-Dhafeeri, A.T. Multi-variable regression analysis for the solid waste generation in the State of Kuwait. Process Saf. Environ. 2018, 119, 172–180. [Google Scholar] [CrossRef]
  32. Eleyan, D.; Al-Khatib, I.A.; Garfield, J. System dynamics model for hospital waste characterization and generation in developing countries. Waste Manag. Res. 2013, 31, 986–995. [Google Scholar] [CrossRef] [PubMed]
  33. Bingöl, D.; Inal, M.; Çetintaş, S. Evaluation of Copper Biosorption onto Date Palm (Phoenix dactylifera L.) Seeds with MLR and ANFIS Models. Ind. Eng. Chem. Res. 2013, 52, 4429–4435. [Google Scholar] [CrossRef]
  34. Intharathirat, R.; Abdul Salam, P.; Kumar, S.; Untong, A. Forecasting of municipal solid waste quantity in a developing country using multivariate grey models. Waste Manag. 2015, 39, 3–14. [Google Scholar] [CrossRef]
  35. Karaca, F.; Özkaya, B. NN-LEAP: A neural network-based model for controlling leachate flow-rate in a municipal solid waste landfill site. Environ. Model. Softw. 2006, 21, 1190–1197. [Google Scholar] [CrossRef]
  36. Shu, H.Y.; Lu, H.C.; Fan, H.J.; Chang, M.C.; Chen, J.C. Prediction for energy content of Taiwan municipal solid waste using multilayer perceptron neural networks. J. Air Waste Manag. Assoc. 2006, 56, 852–858. [Google Scholar] [CrossRef]
  37. Noori, R.; Karbassi, A.; Salman Sabahi, M. Evaluation of PCA and Gamma test techniques on ANN operation for weekly solid waste prediction. J. Environ. Manage. 2010, 91, 767–771. [Google Scholar] [CrossRef]
  38. Abbasi, M.; Abduli, M.A.; Omidvar, B.; Baghvand, A. Forecasting Municipal Solid waste Generation by Hybrid Support Vector Machine and Partial Least Square Model. Int. J. Environ. Res. 2013, 7, 27–38. [Google Scholar]
  39. Liang, G.; Panahi, F.; Ahmed, A.N.; Ehteram, M.; Band, S.S.; Elshafie, A. Predicting municipal solid waste using a coupled artificial neural network with archimedes optimisation algorithm and socioeconomic components. J. Clean. Prod. 2021, 315, 128039. [Google Scholar] [CrossRef]
  40. Zhang, Y.; Li, H.; Hou, A.; Havel, J. Artificial neural networks based on principal component analysis input selection for quantification in overlapped capillary electrophoresis peaks. Chemometr. Intell. Lab. 2006, 82, 165–175. [Google Scholar] [CrossRef]
  41. Zhang, Y.X. Artificial neural networks based on principal component analysis input selection for clinical pattern recognition analysis. Talanta 2007, 73, 68–75. [Google Scholar] [CrossRef]
  42. Noori, R.; Abdoli, M.A.; Ghasrodashti, A.A.; Jalili Ghazizade, M. Prediction of municipal solid waste generation with combination of support vector machine and principal component analysis: A case study of Mashhad. Environ. Prog. Sustain. Energy 2009, 28, 249–258. [Google Scholar] [CrossRef]
  43. Hatik, C.; Gatina, J.C. Waste production classification and analysis: A PCA-induced methodology. In Proceedings of the 4th International Conference on Energy and Environment Research ICEER 2017, Porto, Portugal, 17–20 July 2017. [Google Scholar]
  44. Sunayana; Kumar, S.; Kumar, R. Forecasting of municipal solid waste generation using non-linear autoregressive (NAR) neural models. Waste Manag. 2021, 121, 206–214. [Google Scholar] [CrossRef]
  45. Wang, F.; Yu, L.; Wu, A. Forecasting the electronic waste quantity with a decomposition-ensemble approach. Waste Manag. 2021, 120, 828–838. [Google Scholar] [CrossRef] [PubMed]
  46. Zhang, X.; Zhou, M.; Li, J.; Wei, L.; Dong, Y.; Hou, H.; Chen, C.; Wang, Z. Analysis of driving factors on China’s industrial solid waste generation: Insights from critical supply chains. Sci. Total Environ. 2021, 775, 145185. [Google Scholar] [CrossRef] [PubMed]
  47. Tsai, F.M.; Bui, T.-D.; Tseng, M.-L.; Wu, K.-J. A causal municipal solid waste management model for sustainable cities in Vietnam under uncertainty: A comparison. Resour. Conserv. Recycl. 2020, 154, 104599. [Google Scholar] [CrossRef]
  48. Nguyen, X.C.; Nguyen, T.T.H.; La, D.D.; Kumar, G.; Rene, E.R.; Nguyen, D.D.; Chang, S.W.; Chung, W.J.; Nguyen, X.H.; Nguyen, V.K. Development of machine learning-based models to forecast solid waste generation in residential areas: A case study from Vietnam. Resour. Conserv. Recycl. 2021, 167, 105381. [Google Scholar] [CrossRef]
  49. Li, J.S.; Fan, H.M. Analysis and Prediction of Waste Discharge in Liaoning Industrial Areas. Adv. Mater. Res. 2012, 599, 560–565. [Google Scholar] [CrossRef]
  50. Rumelhart, D.E.; Mcclelland, J.L. Parallel Distributed Processing: Explorations in the Microstructure of Cognition; MIT Press: Cambridge, MA, USA, 1986; pp. 45–76. [Google Scholar]
  51. Sadeghi, B.H.M. A BP-neural network predictor model for plastic injection molding process. J. Mater. Process. Technol. 2000, 103, 411–416. [Google Scholar] [CrossRef]
  52. Hoque, M.M.; Rahman, M.T.U. Landfill area estimation based on solid waste collection prediction using ANN model and final waste disposal options. J. Clean. Prod. 2020, 256, 120387. [Google Scholar] [CrossRef]
  53. Xu, A.; Chang, H.; Xu, Y.; Li, R.; Li, X.; Zhao, Y. Applying artificial neural networks (ANNs) to solve solid waste-related issues: A critical review. Waste Manag. 2021, 124, 385–402. [Google Scholar] [CrossRef] [PubMed]
  54. Azadi, S.; Karimi-Jashni, A. Verifying the performance of artificial neural network and multiple linear regression in predicting the mean seasonal municipal solid waste generation rate: A case study of Fars province, Iran. Waste Manag. 2016, 48, 14–23. [Google Scholar] [CrossRef] [PubMed]
  55. Cai, J.; Luo, J.; Wang, S.; Yang, S. Feature selection in machine learning: A new perspective. Neurocomputing 2018, 300, 70–79. [Google Scholar] [CrossRef]
  56. Kang, L.; Du, H.L.; Zhang, H.; Ma, W.L. Systematic Research on the Application of Steel Slag Resources under the Background of Big Data. Complexity 2018, 2018, 6703908. [Google Scholar] [CrossRef] [Green Version]
Figure 1. Distribution of influential forces.
Sustainability 14 04294 g001
Figure 2. PCA-NARBP Neural network model.
Sustainability 14 04294 g002
Figure 3. Actual and predicted values (a) and comparison of prediction error (b).
Sustainability 14 04294 g003
Figure 4. Forecast results of 1985–2030.
Sustainability 14 04294 g004
Table 2. The contribution rate of each influential factor to ISWG.
ComponentsInitial EigenvalueVariance %Cumulative Contribution Rate %
18.61578.32078.320
21.26011.45189.771
30.6255.68095.450
40.2532.29697.746
50.1601.45399.199
60.0490.44399.642
70.0300.27599.917
80.0050.04899.965
90.0030.02899.993
100.0010.00599.998
1100.002100
Table 3. Comparison of the MAPE and R2 of the prediction results.
BPNARBPPCA-NARBP
MAPE (%) R2MAPE (%) R2MAPE (%) R2
16.8116 0.9734 5.7042 0.9917 6.0663 0.9897
215.2841 0.9628 11.7965 0.9074 5.3662 0.9813
36.9571 0.9717 4.6802 0.9951 36.8035 0.9357
43.9722 0.9925 3.7646 0.9950 26.1795 0.9643
57.6976 0.9866 3.7899 0.9930 1.2489 0.9993
64.2080 0.9896 2.9622 0.9952 7.2723 0.9708
73.1744 0.9722 4.5277 0.9948 9.2783 0.9840
826.1407 0.9562 3.5017 0.9930 8.9505 0.9200
95.0257 0.9847 3.2902 0.9960 11.5263 0.9835
103.0019 0.9845 21.4254 0.9264 19.3492 0.9752
Results3.0019 0.9845 2.9622 0.9952 1.2489 0.9993
Publisher’s Note: MDPI stays neutral with regard to jurisdictional claims in published maps and institutional affiliations.

