Article

Perceived Consumer Effectiveness and Willingness to Pay for Credence Product Attributes of Sustainable Foods

by
Ildiko Kovacs
1 and
Eva Reka Keresztes
2,*
1
Department of Marketing, Faculty of International Management and Business, Budapest Business School, University of Applied Sciences, 1165 Budapest, Hungary
2
Department of Methodology for Social Studies, Faculty of International Management and Business, Budapest Business School, University of Applied Sciences, 1165 Budapest, Hungary
*
Author to whom correspondence should be addressed.
Sustainability 2022, 14(7), 4338; https://doi.org/10.3390/su14074338
Submission received: 14 March 2022 / Revised: 30 March 2022 / Accepted: 1 April 2022 / Published: 6 April 2022

Abstract

:
While perceived consumer effectiveness has consistently been linked to socially conscious attitudes, such as sustainable consumption decisions, the concept appears to have been confounded with other related constructs in the empirical studies measuring its effects on consumer buying intentions and consumer behaviour. A sustainable food consumer evaluation is based on product values and credibility to health, origin, environment, and ethical concerns. The research aimed to examine if sustainability-related perceived consumer effectiveness has an impact on purchase intention and willingness to pay for sustainable food products, in order to provide information on the pricing of sustainable foods. The study was carried out using a quantitative approach on a sample of 1204 young consumers using a self-administered online questionnaire. The results indicated a significant positive relationship between perceived consumer effectiveness and consumers’ willingness to pay a premium price for sustainable food attributes. Based on this willingness to pay a premium price for food products, a WTP Index was developed. The findings revealed that perceived effectiveness has a strong connection with the buying intention of food products with sustainable attributes.

1. Introduction

The changes in sustainable food consumption patterns and behaviours are the highlight of business practice and academic research, because of the high importance and relevance in reaching Sustainable Development Goal 12 (SDG12) of the United Nations (UN). In 2021, New Nutrition Business [1] identified ten megatrends for 2022 in food, nutrition and health, of which sustainability was ranked fifth, preceded by: 1. naturally functional; 2. fragmentation of health beliefs; 3. weight wellness; and 4. snackification at the heart of strategy. The relevance of perceived consumer effectiveness for Sustainable Development Goal 12 (SDG12) is reported to be significant in the European Union, where representative population surveys indicate that many people, amongst them young consumers, are already concerned about sustainability issues and willing to personally contribute to sustainable development [2,3,4,5,6,7]. Based on their summary study, Hanss and Doran [8] concluded that such beliefs concerning one’s ability to carry out positive, or indeed, a less negative impact through consumption are varied in different demographic segments.
Among the large set of food credence attributes, food sustainability concern is increasingly highlighted due to the sustainability goals related to climate change. The primary causes of greenhouse gas (GHG) emissions in the atmosphere are energy production and use, including transport (accounting for nearly three-quarters of total emissions in 2015), followed by agriculture (12% in 2015), and the remaining 13%, in decreasing order, is made up of industrial processes, waste, international transport (aviation and marine), land-use changes, and forestry. GHG emissions are mainly realized by burning fossil fuels and solid waste, and changes in land use. Since the industrial revolution, these activities have been significantly increasing and, therefore, their amplified effects have resulted in serious consequences today. Because of the environmental effects of climate change, more health and social problems have arisen due to heat- or cold-related illnesses and deaths [9,10,11].
In the academic literature, drivers of food choices have been investigated by different authors, revealing that credence attributes play an important role in consumers’ purchase decisions [12,13,14,15,16,17,18,19,20]. According to SDG12, the Food and Agricultural Organization (FAO) of the UN specifically focuses on developing sustainable food and agriculture management because agricultural activities, including forestry, fisheries, and livestock production, generate one-fifth of the total amount of GHGs in the world. Thus, a climate-smart agriculture (CSA) approach is needed to provide sustainable food security. Not only international organizations, but countries, cities, and companies have also realized the importance of tackling climate change; therefore, action is needed on national, regional, and global levels. Facing the problem of growing consumption [21], sustainable supply chains are being formed and various industries—including food companies—have made climate goals a priority in their strategies, and therefore gain operational efficiency by participating in a circular, greener economy [22]. According to Sarkar [23], sustainability is not only ‘an internal reform movement’, but it also provides a better quality of life for current and future generations [24]; thus, environmental damage can be minimized while securing economic benefits [25] and sustainable goods should be accepted in favour of SDG goals [26]. According to the Sustainability Barometer [27] in FMCG (Fast-Moving Consumer Goods) purchases, consumers typically select two or more attributes related to sustainability. These priorities often lean towards packaging considerations, as do consumers’ concerns. Young consumers are even more aware of sustainable consumption [28,29] and change their consumption patterns [30]. Sustainable consumption choices are more likely if consumers perceive sustainable effectiveness through their consumer behaviour. Consumers’ food choices are increasingly influenced by credence cues, and other links of trust and direct relations with the producers have vanished within the globalised food system [31]. In the case of young consumers, price affordability and willingness to pay (WTP) are key factors when it comes to choosing food products. Willingness to pay for products with organic and natural ingredients was found in 42% of the population globally and in 47% of millennials in 2016 [32]. Consumers’ willingness to pay fluctuates over time. The purpose of this study was to identify factors affecting consumers’ willingness to pay a price premium for sustainable food products.
This paper is organised as follows: Section 1 discusses the definitions of relevant concepts widely dealt with in the literature. Section 2 discusses the methodology of the study. Section 3 presents the description and discussion of results where we intend to further elaborate and connect the ideas of perceived consumer effectiveness, sustainable credence food attributes, and consumers’ willingness to pay for them.

2. Discussion of Concepts

A methodical study of the relevant research databases was carried out to identify the sources of literature that can provide us with useful guidance in terms of the issues of concern for experts dealing with the problem of sustainability. The relevant concepts, such as perceived consumer effectiveness, sustainable credence food attributes, and willingness to pay for sustainable food, have been discussed in the literature.

2.1. Perceived Consumer Effectiveness

Perceived consumer effectiveness (PCE) is generally defined as the consumer’s confidence in his or her ability to achieve the outcomes that he or she personally values and has set as a goal. Perceived consumer effectiveness is defined by Hanss and Doran [8] (p.1) as an assessment of the consumer’s ability to value certain sustainable development outcomes and to contribute to their achievement through certain consumer behaviours. PCE is mostly attributed to the psychological factors of consumer behaviour; however, cultural, social, and personal factors also play an important role in the formulation of PCE. [8].
The influence of perceived efficacy on intentions has been examined in previous studies highlighting the impact on consumer behaviour [8,33,34,35,36,37].
Heo and Muralidharan [38] say the effects of PCE on environmentally conscious consumer behaviour (ECCB) have received much attention in academia. Academic research findings are mixed, with some studies finding significant predictors of environmentally conscious consumer behaviour. Demographic characteristics may determine the level of perceived effectiveness, with younger generations wanting their contribution to be more effective in terms of sustainability. Previous research has shown that PCE differs between demographic groups [39,40,41,42], and former results show that it is more pronounced in younger age groups [19].
The findings of d’Astous and Legendre [43] reveal that PCE positively correlated with relative green behaviours. Webb et al. [44] have also reported that PCE is a key determinant of socially responsible consumption. In their study, Heo and Muralidharan [38] found, based on previous studies, that PCE is an important predictor of pro-environmental behaviour, but the data are largely based on the separate effects of environmental variables. A consumer may be very concerned about a particular societal problem and at the same time feel helpless to contribute to solving that problem through his or her own behaviour. For instance, within the European Union (EU) large numbers of people are alarmed by global climate change [2]; there is a sentiment that there is not much that individuals can personally do about the problem. This can be an obstacle to individual commitment to climate change [45]. When modelling the impact of perceived consumer effectiveness on consumer behaviour, several studies have stated the direct and indirect impact on buying intention [46,47,48,49,50,51,52,53,54,55,56]. Vermeir and Verbeke [12] also found that PCE was positively correlated with attitudes towards purchasing sustainable dairy products, and thus with purchase intention.

2.2. Sustainable Credence Food Attributes

The sustainable marketing strategies are progressing towards a relational mindset that involves emphasizing experiential attributes and credence values of a product, thereby creating more valuable experiences for consumers.
The consumer decision-making process involves a number of stages that are influenced by personal and environmental factors. The decision-making process is not only about satisfying needs from an economic perspective, but also about psychological, sociological (person-related), and cultural (environmental) aspects [57]. Engel et al. [58] emphasize the economic aspect, but also agree that non-rational factors related to food decision behaviour must also be studied. Steenkamp [59] underlines that the food decision process is mainly influenced by social and emotional factors. The factors that influence food choices have been studied by different authors. Attributes related to sustainability are assigned to the different aspects of sustainable food consumption. Credence attributes are a category of food attributes that refer to a variety of intangible elements that cannot be verified by consumers (e.g., environmental safety, food health, product origin, production conditions, social benefits) [60].
Credibility and its impact on consumers’ purchasing behaviour [31] has classified credence attributes into seven main categories identified in the literature: (a) health, (b) organic food, (c) origin, (d) brand, (e) production methods, (f) ethics, and (g) descriptive food names and ingredients.
Some food attributes aspects particularly involve the quality attributes defined in the literature as ‘credence’ [61] that are not directly verifiable by the consumer either before or after purchase, and which include environmental, social, and ethical attributes of the product [62]. Food-related credence attributes play an important role in the sustainable food marketing system, as consumers’ food choices are increasingly influenced by credibility elements related to sustainable and internal food attributes. Further studies show that credence attributes play an important role in consumer purchasing decisions [12,63].
Organic foods fall into the credence category because a variety of attributes make it difficult for consumers to evaluate the quality of organic food. By focusing on two credibility attributes of organic food (food safety and environmental friendliness), Lee and Hwang [60] found that these attributes have effects on perceptions of food quality. Previous research used experimental methods to determine consumers’ willingness to pay for ‘high-quality’ food [64].

2.3. Willingness to Pay for Sustainable Food Attributes

Pricing plays a key role in consumer perception of overall product quality. Willingness to pay (WTP) can be defined as the maximum price a buyer is willing to pay for a given set of goods or services [65]. Whether or not consumers are willing to pay for a certain product feature is based on personal values, buying contexts, and other factors. Li and Kallas’ [20] meta-analysis research of consumers’ willingness to pay for sustainable food products highlighted that gender, region, sustainable attributes, and food categories influence the WTP estimate, and there are significant differences between global regions. According to their results, the overall average willingness to pay a surcharge for sustainability in percentage terms is 29.5%. Additionally, the WTP value of an organic attribute is higher than the other sustainable attributes. Molinillo et al. [66] and Coderoni and Perito [67] also emphasized the impact of organic attributes on sustainability behaviour. Although there is a continuous increase in the number of studies dealing with consumers’ willingness to pay price premiums for sustainable food products, we found a lack of studies examining young consumers’ perspectives.
Dolgopolova and Teuber [68] in 2018 summarised the former research on consumers’ willingness to pay for health benefits in food products: a meta-analysis stated that health benefits in foods indicate heterogeneous marginal willingness to pay (MWTP) for health benefits and differences in food product categories. Former studies have emphasized the importance of organic labelling [69,70]. Focusing primarily on product-related factors, Krystallis and Chryssohoidis [71] found different levels of WTP for premium prices in organic food categories. Zhao et al. [72] studied consumers’ perception, purchase intention, and willingness to pay for carbon-labelled products and found that consumers indicated their intention to buy carbon-labelled products, but the level of product premium was low. Zhang et al. [73] studied consumers’ perceptions, purchase intention, and willingness to pay a premium price for safe vegetables. Their findings revealed that healthy, nutritious, environmentally friendly, green, sustainable and clean product trademarks were attributes that two-thirds of consumers identified as safe vegetables via certification labels on the vegetable packages, and consequently 65.8% of them would pay a premium price to buy safe vegetables. Regarding fair trade food products, this attribute is relatively new and unknown, and limited products are sold under this label [17,74,75]; therefore, it has little impact on consumer behaviour. Yin et al. [76] examined consumer preference for organic foods and on consumers’ willingness to pay (WTP) for organic labels from dissimilar countries or certifiers. Determining distinct preferences for organic labels from various sources and countries can be a valuable reference for manufacturers or international certification service providers.
According to Katt and Meixner [65], product attributes such as perceived quality play an important role in willingness to pay for products with sustainable credence attributes. Their results show significant differences in demographic characteristics of consumers such as education and gender. Printezis et al. [77] studied the literature on willingness to pay for the attribute ‘local’, and found that methodological approach and the country analysed can have a significant impact on local WTP.
After reviewing the literature, we discovered a research gap in specific WTP-related journal content. Scopus and ProQuest abstract searches were conducted in July 2021 to explore the scope of scientific research on the topic. With the combination of the given search terms, only European-related peer-reviewed articles published between 2018 and 2021 were considered. The results of the secondary data explored showed that there were scarcely any published articles on consumers’ willingness to pay for organic/local/sustainable food focused on gender or younger generations. In Scopus and ProQuest abstracts with search terms ‘WTP’ and ‘organic food’, 38 pieces of research were found; for ‘WTP’ and ‘local food’, 7 pieces of research; for ‘WTP’, ‘organic food’ and ‘young consumer’, 6 former studies; and with search terms ‘WTP’, ‘credence attributes’ and ‘young consumers’, 4 former studies were found.
Based on former academic literature, the following research questions were formulated:
Research question 1 (RQ1). What is the proportion of the different segments of perceived consumer effectiveness among young consumers?
Research question 2 (RQ2). To what extent does perceived consumer effectiveness have an influence on willingness to pay?
Research question 3 (RQ3). Does perceived consumer effectiveness on sustainability have an impact on purchasing intent?
Research question 4 (RQ4). In the case of which sustainable product attributes is willingness to pay outstanding?
The research questions aimed to link the following concepts (See Figure 1.):

3. Methodological Approach

To achieve the research objective, a structured survey was conducted in April 2021. The survey consisted of several research themes, focusing on perceived effectiveness on sustainable consumption, purchase intention, and willingness to pay for food with sustainability-related attributes. A 5-point Likert type scale was used to measure consumers’ purchase intentions and a 4-point scale was used to measure perceived consumer efficiency. The measurement scales used in this study were adapted from previous research [17]. The willingness-to-pay scale was developed and tested in a study by Kovacs [19]. For demographic constructs, ordinal and nominal scales were applied. The data cleaning procedure included checking for missing data and respondent bias. In the final database of 1204 respondents, the proportion of missing data at each scale point was less than five percent. Data were processed and analysed employing descriptive and multivariate statistical methods using SPSS Statistics 27.0.
Respondents to the survey were adults aged 18–39 years. A quota method using public statistical data was applied to determine the sample structure. Of the participants, 62% were women and 38% were men. Regarding the type of settlement, 53% of respondents lived in the capital city or a city, while 47% lived in smaller towns or villages. The respondents aged between 18 and 39 were divided into three age categories: 18–24 (54% of respondents), 25–34 (25%), and 35–39 (22%). In terms of educational attainment, 66% of respondents held a high school diploma or lower, while 34% held a university degree.
Research was limited by demographic, age group, and geographical constraints. The study of WTP raises unresolved methodological questions, as there is a lack of uniform survey methodology in the scientific literature. Moreover, researchers face the problem that consumers tend to overestimate WTP [65].

4. Description and Discussion of Results

The findings are presented below in subsections in line with the research questions.

4.1. Preference of Food Attributes

When it comes to buying choices, qualities such as freshness (95.3%), healthy product (80.3%), and the intrinsic properties (76.2%) of the food appeared in the TOP 2 response categories (very important, rather important) among the most important product attributes for more than three-quarters of respondents, along with low prices (79.9%) and ease of obtaining food (78.1%).
Environmental protection during production, non-GMO products, traditional local foods and consideration of animal welfare were considered important by more than half of the respondents, while a relatively higher proportion of respondents considered these attributes ‘rather important’.
The product attributes related to sustainable consumption were highlighted in the survey research questions. The adaptability of food to special diets did not appear among the important attributes. The importance of traditional local foods was marked by a much higher proportion of members of the 35–39 age group (70% important or very important) while the proportion of other age groups (25–34 53%, 18–24 47%) was significantly lower, mainly giving ‘indifferent’ as an answer. For local food, there was also a significant difference (Gamma = 0.234 p = 0.000), with 62% of the 35-39 age group indicating ‘important’ or ‘very important’, 48% of the 25–34 age group indicating ‘important’ or ‘very important’, while only 31% of the 18–24 age group indicating ‘rather important’ and only 7% ‘very important’. There was no significant difference in the case of environmental protection during production, with 21% of the 18–24 age group, 22% of the 25–34 age group and 27% of the 35–39 age group indicating ‘very important’, and between 40 and 43% of all three age groups choosing ‘important’. The proportion of responses that were ‘not important’ was below 10% in all three groups. Consideration of animal welfare (e.g., free-range) was the most important response for ‘neutral’ or ‘rather important’ in all three groups (62% for both groups) with 35–39-year-olds falling into the ‘important’ category (57% TOP 2) and only 25% being ‘indifferent’. The importance of non-GMO products was significantly higher (Gamma = 0.123 p = 0.000) in the 35–39 age group (37% very important, 36% important) and only 17% were ‘indifferent’, while in the 25–34 age group 24% were ‘indifferent’, while 33% thought this was ‘important’ and 32% ‘very important’. In the youngest age group, 18–24, 23% were ‘indifferent’, 35% considered it ‘rather important’ and 27% believe it to be ‘very important’. Table 1 shows the results of the descriptive statistics of consumer preferences for particular attributes of sustainable food products.
The most important product attribute categories were, in order, freshness and healthiness, followed by the product elements related to purchase, such as price and availability, then sustainability-related attributes: environmental protection during production, and non-GMO food. In a former study of Moser et al. [78] consumer preferences for fruit and vegetables also highlighted the food characteristic ‘fresh’ as the most preferred credence attribute.
Sustainability attributes were of high importance, but at the same time high price sensitivity was clearly visible; 35% claimed price availability to be ‘very important’, and 45% ‘rather important’; discounted price was ‘very important’ for 26% and ‘rather important’ for 46%. Affordable price was ‘not important’ for 10%, and neither was the possibility to buy at a discounted price for 6% of respondents. The results were in accordance with those of the IRI [79], which found that local and organic attributes were important, but not primary, and ‘local’ may be a distinctive call to action among the age group studied.
Former research by Arora et al. [80] also reveals that, for the majority of young consumers, price, trust and positive attitudes towards organic food influence their purchasing decisions. Our results also highlight price sensitivity when it comes to food products. Our results corroborate those of Dahlhausen et al. [81], who analysed a partially similar preference structure underlying purchase intentions for foods products labelled with credence attributes. They found local and animal welfare attributes to be the most prominent. Organic labelling appeared to be less preferred in our sample of young consumers.

4.2. Perceived Consumer Effectiveness

Perceived consumer effectiveness (PCE) was measured using a four-point scale with a total of four items assessing the degree of perceived belief in the ability to influence sustainable development. In the sample, the distribution of PCE segments was as follows: 15% did not know much about sustainable development; 5% did not think they could do anything about it, so they did not care. These two groups were combined to form the PCE1 segment, which accounted for 20% in total. The next segment, PCE2 comprised the 46% of respondents who thought they could not do much but were trying to do what was possible. Finally, the PCE3 segment included the 34% of respondents who were doing all they could to be sustainable.
Considering young consumers’ views on sustainable development, our results showed significant differences between the age groups. Twenty per cent of 18–24-year-old respondents ‘do not know about it’ or ‘do not think they can do anything about it, so they do not bother’. Fifty percent of the young consumers ‘do not think they can do anything about it but do what they can’ and 30% ‘do what they can’. The 25–34 age group was divided in the following format: 20% PCE1; 44% PCE2; 36% PCE3. For the 35–39 age group: 19% PCE1; 41% PCE2; and 40% PCE3. (Gamma value = 0.097, p = 0.025) For the PCE1 group, there was no significant difference between the distributions for each age group. In contrast, the PCE2 group had a higher distribution of 18–24-year-olds (50%) compared to older age groups (44% and 41%). For the PCE3 group, we measured the opposite distributions for each age group, for example, the oldest age group in the study (35-39 years) had the highest proportion (40%), while the proportion of 18–24-year-olds was only 30%, which meant that we had to reject our null hypothesis for the age groups studied.
In the case of educational attainment, we obtained the result expected from the results of other academic studies: a higher proportion of respondents with higher educational attainment were in the PCE3 group, indicating a higher level of commitment to sustainable development. In the PCE1 group, the share of respondents with less than a high school education was 35% compared to 17% of respondents with higher education. In PCE3, as expected, the distribution was the opposite, with 40% of respondents with tertiary education compared to only 21% of respondents with less than A-levels.
The gender gap showed that women were more likely to be in PCE3 (37%) than men (29%). In contrast, the share of PCE1 was higher for men (23%) than for women (17%).

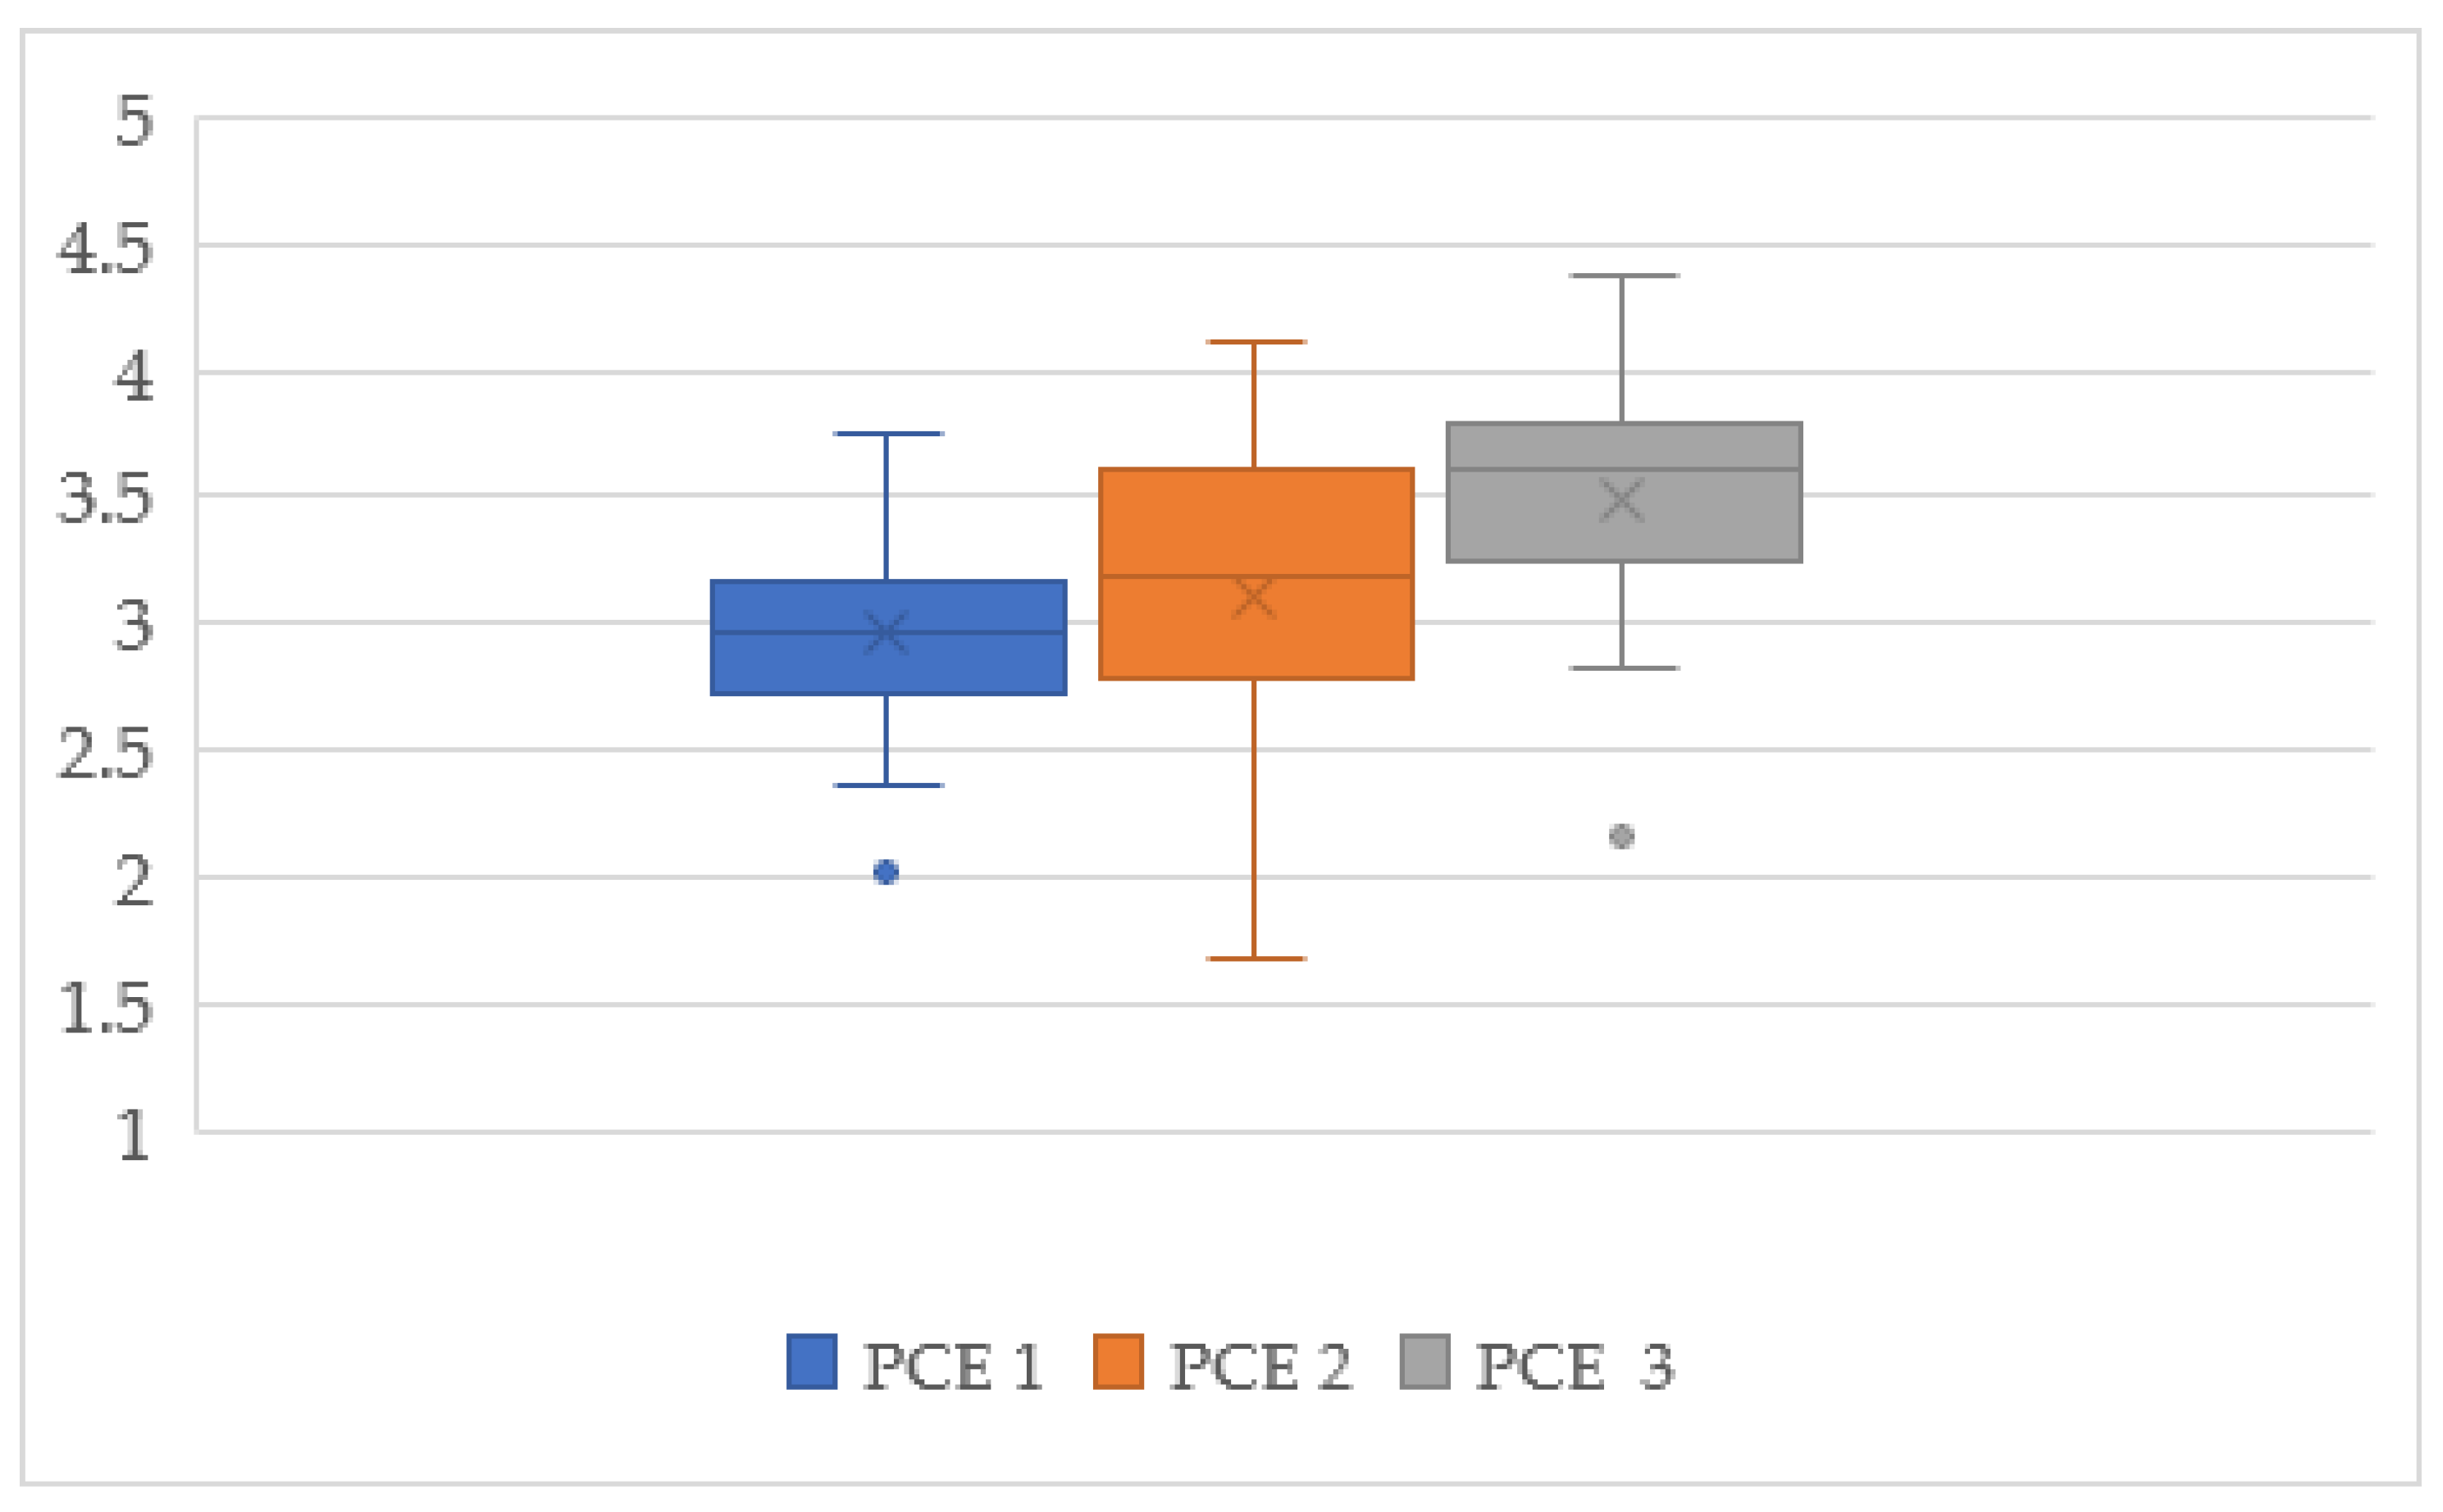
4.3. Differences between the PCE Segments and Intention to Buy

Seventy-five percent of the respondents reported that this was ‘very typical’ (42%) or ‘rather typical’ (33%) in coming to a purchasing decision to increase their consumption of fruit and vegetables, especially in high season. The second most outstanding purchasing intention was reducing food waste and loss, with more than 60% of the respondents reporting it ‘rather or very typical’. In terms of other preferences, in third place were seasonal foods, followed by shopping at a nearby or local grocery store, with more than 60% in TOP2. Locally produced and processed food had over 40% in the ‘typical’ and ‘very typical’ segments, and there was even less intention to shop at local markets and farmers’ markets. Fairtrade products had the highest proportion of ‘do not know’, indicating that there is little information available about fairtrade products.
Least of all preferred were vegetarian (vegan, ovo, lacto, ovo-lacto, semi vegetarianism) diets (58% answering ‘not at all’, 20% ‘rather not’), reducing consumption of meat and dairy products (28% ‘not at all’ 28% ‘rather not’), and striving to buy organic food (20% ‘not at all’ and 29% ‘rather not’). The average values of the PCE segments can be seen in Table 2.
There was a significant difference between the age groups surveyed in terms of intention to buy organic food (Gamma = 0.143 p = 0.003), intention to buy free-range animal products (eggs, milk, meat) (Gamma = 0.235 p = 0. 000), shopping at a local market, farmers’ market, or fair (Gamma = 0.247 p = 0.000), reducing the purchase of food and beverages with low nutritional value (Gamma = 0.412 p = 0.000), reducing food waste and loss (Gamma = 0.432 p = 0.000).
For the age group of 35–39 years, the characteristic of conscious food consumption was more prevalent in ‘increase consumption of fruit and vegetables, especially in high season’, as 83% of them chose this option as more or ‘very typical’, and 73% as seasonal. Buying animal products that meet animal welfare standards was also ‘typical’ or ‘very typical’ for 60% of them.
‘Typical’ and ‘very typical’ responses indicated that seasonal food was preferred by 59% of the younger respondents aged 18–24. Some 60% of this age group preferred to shop at a nearby or local store, while the same proportion was in favour of reducing food waste and loss. A large number of the respondents of the 18–25 age group (77%) advocated the consumption of fruit and vegetables, especially in high season. In terms of their willingness to buy, they underperformed the other two age groups in terms of the sustainability-related issues examined.
Consumer segments based on perceived consumer effectiveness towards sustainable development showed significant differences in aggregated indicator items. Young consumers with higher relative perceived consumer effectiveness had higher intention in terms of the items examined and reported higher buying intention on sustainable food products (Figure 2).
In examining the differences between the three groups, we highlighted the responses to the questions on organic and ecological, local products, and animal welfare. It can be concluded that PCE influenced purchase intentions, especially for questions related to sustainability. The perceived consumer effectiveness level and the intent of buying sustainable food seemed to be significantly correlated with each other in the cases of local, animal welfare, and organically grown products. The latter product attributes were more likely chosen by consumers who belonged to the PCE2 group. The most significant differences across segments were in terms of shopping at local markets, farmers’ markets, fairgrounds, ‘reducing food waste and loss’, and the consideration of animal welfare.
Particularly in the PCE3 segment, the results showed a difference compared to the other two groups in terms of buying organic food, taking animal welfare into account, shopping at local markets, farmers’ markets and fairgrounds, trying to reduce food waste, and avoiding products from distant countries.
Green purchase intention of young consumers and the effects of perceived consumer effectiveness depended on the sensitivity to social and environmental issues [82]. Our results emphasised the differences between credence attribute preferences and their association with the level of perceived consumer effectiveness.

4.4. Consumer Segments Based on Perceived Consumer Effectiveness and Their Willingness to Pay a Premium Price

For all examined product attributes, willingness-to-pay a price premium increased with the level of perceived consumer effectiveness. It was most pronounced for preservative-free/non-preservative products, organic products, and local products. In consideration of animal welfare during production, there were no significant differences, only between segments 1 and 2. For organic products, the highest percentage was 5–15%, but 14% would pay a premium of up to 15–25% and 7% even higher. Similar high premiums would be paid for products free of preservatives/colouring. For local products and artisanal products, premiums of between 5 and 15% would be paid by members of groups PCE2 and PCE3 at a rate of over 40% (Figure 3).
On average, consumer acceptable mark-ups seemed to be between 5 and 15% for products with sustainable food attributes of organic, local, traditional, hand-crafted and those that considered animal welfare during production.
The results of the ANOVA test indicate that, among the PCE segments, there was a significant difference in the importance of locally produced and processed foods (p = 0.000), organic products (p = 0.000), and buying animal products that meet animal welfare standards (p = 0.000). In addition, the measurement of association indicated a significant but weak connection between PCE segments and local (r = 0.234), organic (r = 0.224), and animal welfare attributes (r = 0.235), respectively.

4.5. Demographic Differences in Willingness to Pay a Premium Price

Although the figures showed a higher proportion of respondents from older age categories (25–34 and 35–39) who were willing to pay higher prices (6–15%, 16–25% and more), in some segments (for example, local food, animal welfare and handcrafted products such as artisanal handicraft products), there were no significant differences between the age categories in terms of WTP. Approximately one-fifth of the respondents from all three age categories were willing to pay 16–25% more for handcrafted products; therefore, this category proved to be the most popular choice among the generations, followed by preservative/colouring-free, and traditional food. The least popular category was gluten- or lactose-free characteristic products: 62% of respondents from age group 18–24, 58% of age group 25–34, and 55% of age group 35–39 would pay only 0–5% for them (Figure 4.). In addition, the difference between the age groups for modified (low carbohydrate, low sugar, high fat) foods was that women would typically pay a higher price, 6–15%, 39%, 16–25%, 39%, but 6% overall would pay a higher price. For men, 10% would pay only 16–25% more, and only 4% would pay more. Moreover, 39% of women would pay 0–5% more and 55% of men would pay 0–5% more.
Overall, we can observe that the higher the WTP category, the lower the proportion of people willing to pay a premium price. In terms of gender, there was a difference in willingness to pay a premium price. On average, 48% of men and 40% of women would pay 0–5% more for credence attributes, while 36% of men and 40% of women would pay 6–15% more. Even lower than the previous numbers, 11% of men and 15% of women were willing to pay 16–25% more. The proportion of men and women who were willing to pay more than 25% for the product attributes was more balanced (on average 5%–15% each). Our findings showed that women were more willing to pay for products with sustainable attributes and there were differences between gender in willingness to pay for the vast majority of product attributes. A higher rate of women would pay 6–15% more (except for local food) and 16–20% more for each attribute (Figure 5.). Our results also confirmed the results of Bonanno et al. [83], which showed that systematically higher pricing can be applied to credence product attributes. The majority of consumers would consider a markup between 6 and 15% to be appropriate.
To explore the extent of willingness to pay for credence product attributes of sustainable food, WTP indices were compiled by multiplying the proportion of respondents in each WTP category by the relevant mean WTP value, then summing up the products. The following formula was developed to calculate the WTP indices:
W = i = 1 n w * p
where W is WTP index; p is proportion of respondents of WTP category; w is mean WTP weight of category; and n is number of WTP categories.
Thus, the results indicated the order of preferences for the credence attributes of males, females, young (aged 18–24) consumers, and total. According to the overall index, which indicates the general preferences of all consumers, handcrafted/local products (0.104), preservative/colouring-free food (0.095), and food considering animal welfare (0.093) were among the top preferred categories, while gluten- or lactose-free food was the least preferred attribute (0.070). Comparing genders, women had higher index scores than men in five categories out of the nine, and in three categories they were equal. Considering young consumers, their indices were higher than the main index in the cases of animal welfare and modified food. All the above-referred indices show the priority of handcrafted/local products, with figures 0.104 and 0.103. Among the top categories were preservative/colouring-free attributes, with index scores of 0.101 for women, 0.089 for men, and 0.090 for the youngest age category (aged 18–24) (Table 3).

5. Conclusions

This research contributes to the growing literature on sustainable food consumption and enriches the current knowledge on young consumers’ purchase intentions regarding sustainability attributes. This study aimed to fill the research gap on young consumers’ perceived effectiveness on sustainable consumption and willingness to pay for sustainable product attributes.
In conclusion, the majority of young consumers are aware of the benefits of sustainable food consumption. Thirty percent of young consumers do their best to achieve sustainable decisions, a segment that can be considered a considerable market mass. Perceived consumer effectiveness has a significant impact on willingness to pay in the case of locally produced and processed foods, organic products, and animal products that meet animal welfare standards.
Innovative marketing strategies could increase consumer intention to purchase sustainable food. Marketers increasingly need to focus on the growing resonance of ‘local’ in the case of young consumers. Consideration for the environment during production and animal welfare were also attractive trigger words. Marketing communications are of particular importance in influencing purchasing intentions towards sustainable consumption, such as shopping at a local or nearby store, buying free-range animal products (eggs, milk, meat), reducing food waste and loss, buying branded foods, products from fair trade sources, animal products that meet animal welfare standards, and preference for locally produced and processed foods.
Our research findings are connected to the hedonic price framework, as our results indicate that manufacturers offer more credence attributes in their portfolios. However, in terms of willingness to pay a premium, a high price sensitivity was found in the segments analysed. Pricing such products systematically at higher price points through innovative marketing strategies could address consumer acceptance, as Bonanno et al. [83] reported. Affordable prices were important for more than three-quarters of the respondents, while availability of the discounted prices was important for more than eighty percent. The findings highlight the willingness to pay a price premium for handcrafted, preservative/colouring-free, traditional, modified, organic foods and ‘0 km’ foods, and products considering animal welfare. However, there was reluctance by over half of those surveyed to pay more, particularly for locally sourced and organic products.
Our findings have further implications for marketers and food brands. The younger generations surveyed are increasingly becoming the largest consumer market for nutritious and sustainable food. The outcomes of this study provide a basis for developing proper pricing strategies to achieve higher profits. As a methodological contribution, willingness-to-pay indices have been developed to explore the consumer preferences of the targeted segments. WTP indices can be used for comparative analysis in future research.
This study has two limitations: a geographical one, as only Hungarian consumers were surveyed; and a demographic one, as only the 18-39 age group was considered.

Author Contributions

Conceptualization, I.K.; methodology, I.K. and E.R.K.; software, I.K. and E.R.K.; validation, I.K. and E.R.K.; formal analysis, I.K. and E.R.K.; investigation, I.K. and E.R.K.; resources, I.K. and E.R.K.; data curation, I.K. and E.R.K.; writing—original draft preparation, I.K.; writing—review and editing, I.K. and E.R.K.; visualization, E.R.K.; supervision, I.K. and E.R.K.; project administration, I.K. and E.R.K.; funding acquisition, I.K. and E.R.K. All authors have read and agreed to the published version of the manuscript.

Funding

The APC was funded by Budapest Business School.

Institutional Review Board Statement

The study was conducted in accordance with the Declaration of Helsinki.

Informed Consent Statement

Informed consent was obtained from all subjects involved in the study.

Data Availability Statement

Not applicable.

Acknowledgments

This work was supported by Budapest Business School, IMPACT project 2021. The authors would like to acknowledge support received from Katalin Kollath, Gabor Valko, and the Budapest Business School’s Sustainable Consumption Research Group, Judit Beke and Marietta Lendvai.

Conflicts of Interest

The authors declare no conflict of interest.

References

  1. New Nutrition. 10 Key Trends in Food, Nutrition & Health. 2022. Available online: New-nutrition.com (accessed on 22 July 2021).
  2. European Commission. Eurostat. Sustainable Development in the European Union: 2015 Monitoring Report of the EU Sustainable Development Strategy: 2015 edition. Publ. Office. 2015. Available online: https://data.europa.eu/doi/10.2785/544357 (accessed on 28 July 2021).
  3. European Commission. Eurostat. Sustainable Development in the European Union: Monitoring Report on Progress Towards the SDGs in an EU Context: 2017 Edition. Publ. Office. 2018. Available online: https://data.europa.eu/doi/10.2785/842104 (accessed on 24 January 2022).
  4. European Commission. Directorate-General for Communication. Towards a Sustainable Europe by 2030: Reflection Paper. Publ. Office. 2019. Available online: https://data.europa.eu/doi/10.2775/647859 (accessed on 2 February 2022).
  5. Cho, Y.-N.; Soster, R.L.; Burton, S. Enhancing Environmentally Conscious Consumption through Standardized Sustainability Information. J. Consum. Aff. 2017, 52, 393–414. [Google Scholar] [CrossRef]
  6. Yarimoglu, E.; Binboga, G. Understanding sustainable consumption in an emerging country: The antecedents and consequences of the ecologically conscious consumer behavior model. Bus. Strat. Environ. 2018, 28, 642–651. [Google Scholar] [CrossRef]
  7. Lendvai, B.M.; Kovács, I.; Beke, J. A Z generáció helyi élelmiszer termékekkel kapcsolatos észlelései. Generation Z’s percep-tions of local food products. In Proceedings of the Georgikon Conference, Keszthely, Hungary, 7 October 2021. [Google Scholar]
  8. Hanss, D.; Doran, R. Perceived Consumer Effectiveness. In Responsible Consumption and Production; Springer: Berlin/Heidelberg, Germany, 2020; pp. 535–544. [Google Scholar]
  9. United Nations. Introduction to Science. United Nations Climate Change. Available online: https://unfccc.int/topics/science/the-big-picture/introduction-science (accessed on 14 April 2021).
  10. United States Environmental Protection Agency. Climate Change Indicators: Global Greenhouse Gas Emissions. Available online: https://www.epa.gov/climate-indicators/climate-change-indicators-global-greenhouse-gas-emissions#ref2 (accessed on 3 April 2021).
  11. EPA, U.S. Environmental Protection Agency. Available online: https://www.epa.gov/climate-indicators (accessed on 8 February 2022).
  12. Vermeir, I.; Verbeke, W. Sustainable food consumption among young adults in Belgium: Theory of planned behaviour and the role of confidence and values. Ecol. Econ. 2008, 64, 542–553. [Google Scholar] [CrossRef]
  13. Dentoni, D.; Tonsor, G.T.; Calantone, R.J.; Peterson, H.C. Disentangling direct and indirect effects of credence labels. Br. Food J. 2014, 116, 931–951. [Google Scholar] [CrossRef]
  14. Moor, U.; Moor, A.; Põldma, P.; Heinmaa, L. Consumer preferences of apples in Estonia and changes in attitudes over five years. Agric. Food Sci. 2014, 23, 135–145. [Google Scholar] [CrossRef]
  15. Cembalo, L.; Caracciolo, F.; Lombardi, A.; Del Giudice, T.; Grunert, K.G.; Cicia, G. Determinants of Individual Attitudes Toward Animal Welfare-Friendly Food Products. J. Agric. Environ. Ethic 2016, 29, 237–254. [Google Scholar] [CrossRef]
  16. D’Amico, M.; Di Vita, G.; Monaco, L. Exploring environmental consciousness and consumer preferences for organic wines without sulfites. J. Clean. Prod. 2016, 120, 64–71. [Google Scholar] [CrossRef]
  17. Kovacs, I.; Lehota, J.; Komaromi, N. Analysis of the characteristics of the sustainable food consumption in Hungary. EMOK XXII. National Conference. In Proceedings of the Credibility and Value Orientation in Marketing, Debrecen, Hungary, 23 November 2016. [Google Scholar]
  18. Del Giudice, T.; Cavallo, C.; Vecchio, R. Credence attributes, consumers trust and sensory expectations in modern food market: Is there a need to redefine their role? Int. J. Food Sys. Dyn. 2018, 9, 307–313. [Google Scholar] [CrossRef]
  19. Kovács, I. Sustainable food consumption intentions related to food safety among young adults. Analecta Technol. Szeged. 2020, 14, 26–34. [Google Scholar] [CrossRef]
  20. Li, S.; Kallas, Z. Meta-analysis of consumers’ willingness to pay for sustainable food products. Appetite 2021, 163, 105239. [Google Scholar] [CrossRef]
  21. Di Giulio, A.; Fuchs, D. Sustainable Consumption Corridors: Concept, Objections, and Responses. GAIA—Ecol. Perspect. Sci. Soc. 2014, 23, 184–192. [Google Scholar] [CrossRef]
  22. Food and Agriculture Organization of the United Nations. What-We-Do | Climate Change | UN FAO. 2021. Available online: http://www.fao.org/climate-change/our-work/what-we-do/en/ (accessed on 22 July 2021).
  23. Sarkar, A. Green Branding and Eco-innovations for Evolving a Sustainable Green Marketing Strategy. Asia-Pacific J. Manag. Res. Innov. 2012, 8, 39–58. [Google Scholar] [CrossRef]
  24. Fernando, Y.; Jabbour, C.J.C.; Wah, W.-X. Pursuing green growth in technology firms through the connections between environmental innovation and sustainable business performance: Does service capability matter? Resour. Conserv. Recycl. 2019, 141, 8–20. [Google Scholar] [CrossRef]
  25. Radojević, N. Innovating (a Lot) With a Little: High-Tech Innovation in Southeast Europe. Manag. Sustain. Bus. Manag. Solutions Emerg. Econ. 2021. [Google Scholar] [CrossRef]
  26. Yamane, T.; Kaneko, S. Is the younger generation a driving force toward achieving the sustainable development goals? Survey experiments. J. Clean. Prod. 2021, 292, 125932. [Google Scholar] [CrossRef]
  27. Mintel Sustainability Barometer. Mintel.com. 2021. Available online: https://www.mintel.com/consumer-sustainability-barometer (accessed on 12 May 2021).
  28. Lee, K. Opportunities for green marketing: Young consumers. Mark. Intell. Plan. 2008, 26, 573–586. [Google Scholar] [CrossRef]
  29. Peattie, K.; Collins, A. Guest editorial: Perspectives on sustainable consumption. Int. J. Consum. Stud. 2009, 33, 107–112. [Google Scholar] [CrossRef]
  30. Staniškis, J.K. Sustainable consumption and production: How to make it possible. Clean Technol. Environ. Policy 2012, 14, 1015–1022. [Google Scholar] [CrossRef]
  31. Fernqvist, F.; Ekelund, L. Credence and the effect on consumer liking of food—A review. Food Qual. Prefer. 2014, 32, 340–353. [Google Scholar] [CrossRef] [Green Version]
  32. Deloitte. (February 18, 2018). Consumers’ Willingness to Pay (WTP) for Organic and Natural Ingredient Product Attributes Worldwide as of 2016, by Generation [Graph]. In Statista. Available online: https://www.statista.com/statistics/862185/global-consumers-willingness-to-pay-for-organic-natural-attributes-by-generation/ (accessed on 20 January 2022).
  33. Ellen, P.S.; Wiener, J.L.; Cobb-Walgren, C. The Role of Perceived Consumer Effectiveness in Motivating Environmentally Conscious Behaviors. J. Public Policy Mark. 1991, 10, 102–117. [Google Scholar] [CrossRef]
  34. Berger, I.E.; Corbin, R.M. Perceived Consumer Effectiveness and Faith in Others as Moderators of Environmentally Responsible Behaviors. J. Public Policy Mark. 1992, 11, 79–89. [Google Scholar] [CrossRef]
  35. Antonetti, P.; Maklan, S. Feelings that Make a Difference: How Guilt and Pride Convince Consumers of the Effectiveness of Sustainable Consumption Choices. J. Bus. Ethic 2014, 124, 117–134. [Google Scholar] [CrossRef]
  36. Hanss, D.; Böhm, G.; Doran, R.; Homburg, A. Sustainable Consumption of Groceries: The Importance of Believing that One Can Contribute to Sustainable Development. Sustain. Dev. 2016, 24, 357–370. [Google Scholar] [CrossRef] [Green Version]
  37. Alam, S.; Ahmad, M.; Ho, Y.-H.; Omar, N.; Lin, C.-Y. Applying an Extended Theory of Planned Behavior to Sustainable Food Consumption. Sustainability 2020, 12, 8394. [Google Scholar] [CrossRef]
  38. Heo, J.; Muralidharan, S. What triggers young Millennials to purchase eco-friendly products?: The interrelationships among knowledge, perceived consumer effectiveness, and environmental concern. J. Mark. Commun. 2016, 25, 421–437. [Google Scholar] [CrossRef]
  39. Akehurst, G.; Afonso, C.; Gonçalves, H.M. Re-examining green purchase behaviour and the green consumer profile: New evidences. Manag. Decis. 2012, 50, 972–988. [Google Scholar] [CrossRef]
  40. Palacios-González, M.; Chamorro-Mera, A. Analysis of Socially Responsible Consumption: A Segmentation of Spanish Consumers. Sustainability 2020, 12, 8418. [Google Scholar] [CrossRef]
  41. Jaiswal, D.; Kaushal, V.; Singh, P.K.; Biswas, A. Green market segmentation and consumer profiling: A cluster approach to an emerging consumer market. Benchmarking Int. J. 2020, 28, 792–812. [Google Scholar] [CrossRef]
  42. Torres, A. For Young Consumers Farm-to-fork is Not Organic: A Cluster Analysis of University Students. HortScience 2020, 55, 1475–1481. [Google Scholar] [CrossRef]
  43. D’Astous, A.; Legendre, A. Understanding Consumers’ Ethical Justifications: A Scale for Appraising Consumers’ Reasons for Not Behaving Ethically. J. Bus. Ethic 2008, 87, 255–268. [Google Scholar] [CrossRef]
  44. Webb, D.J.; Mohr, L.A.; Harris, K.E. A re-examination of socially responsible consumption and its measurement. J. Bus. Res. 2008, 61, 91–98. [Google Scholar] [CrossRef]
  45. Lorenzoni, I.; Nicholson-Cole, S.; Whitmarsh, L. Barriers perceived to engaging with climate change among the UK public and their policy implications. Glob. Environ. Chang. 2007, 17, 445–459. [Google Scholar] [CrossRef]
  46. Zhao, H.-H.; Gao, Q.; Wu, Y.-P.; Wang, Y.; Zhu, X.-D. What affects green consumer behavior in China? A case study from Qingdao. J. Clean. Prod. 2014, 63, 143–151. [Google Scholar] [CrossRef]
  47. Ellen, P.S. Do we know what we need to know? Objective and subjective knowledge effects on pro-ecological behaviors. J. Bus. Res. 1994, 30, 43–52. [Google Scholar] [CrossRef]
  48. De Pelsmacker, P.; Janssens, W.; Mielants, C. Consumer values and fair-trade beliefs, attitudes and buying behaviour. Int. Rev. Pub. Nonprof. Mark. 2005, 2, 50–69. [Google Scholar] [CrossRef]
  49. De Pelsmacker, P.; Janssens, W. A Model for Fair Trade Buying Behaviour: The Role of Perceived Quantity and Quality of Information and of Product-specific Attitudes. J. Bus. Ethic 2007, 75, 361–380. [Google Scholar] [CrossRef]
  50. Lee, M.-Y.; Jackson, V.; Miller-Spillman, K.A.; Ferrell, E. Female consumers׳ intention to be involved in fair-trade product consumption in the U.S.: The role of previous experience, product features, and perceived benefits. J. Retail. Consum. Serv. 2015, 23, 91–98. [Google Scholar] [CrossRef]
  51. Han, H.; Yoon, H.J. Hotel customers’ environmentally responsible behavioural intention: Impact of key constructs on decision in green consumerism. Int. J. Hosp. Manag. 2015, 45, 22–33. [Google Scholar] [CrossRef]
  52. Hoek, A.C.; Malekpour, S.; Raven, R.; Court, E.; Byrne, E. Towards environmentally sustainable food systems: Decision-making factors in sustainable food production and consumption. Sustain. Prod. Consum. 2020, 26, 610–626. [Google Scholar] [CrossRef]
  53. Wang, J.; Nguyen, N.; Bu, X. Exploring the Roles of Green Food Consumption and Social Trust in the Relationship between Perceived Consumer Effectiveness and Psychological Wellbeing. Int. J. Environ. Res. Public Health 2020, 17, 4676. [Google Scholar] [CrossRef]
  54. Zralek, J.; Burgiel, A. Prospects for a Sustainable Future: Mapping Sustainable Behaviors According to Consumer Perceptions. R. Bus. 2020, 40. [Google Scholar]
  55. Taufique, K.M.R.; Islam, S. Green marketing in emerging Asia: Antecedents of green consumer behavior among younger millennials. J. Asia Bus. Stud. 2021, 15, 541–558. [Google Scholar] [CrossRef]
  56. Follows, S.B.; Jobber, D. Environmentally responsible purchase behaviour: A test of a consumer model. Eur. J. Mark. 2000, 34, 723–746. [Google Scholar] [CrossRef]
  57. Chisnall, P.M. Consumer Behaviour; McGraw-Hill: London, UK, 1995; p. 416. [Google Scholar]
  58. Engel, J.F.; Blackwell, R.D.; Miniard, P.W. Consumer Behavior, 8th ed.; Dryden Press: Chicago, IL, USA, 1995; p. 951. [Google Scholar]
  59. Steenkamp, J.-B.E.M. Dynamics in Consumer Behavior with Respect to Agricultural and Food Products. In Agricultural Marketing and Consumer Behavior in a Changing World; Springer: Berlin/Heidelberg, Germany, 1997; pp. 143–188. [Google Scholar]
  60. Lee, H.-J.; Hwang, J. The driving role of consumers’ perceived credence attributes in organic food purchase decisions: A comparison of two groups of consumers. Food Qual. Prefer. 2016, 54, 141–151. [Google Scholar] [CrossRef]
  61. Darby, M.; Karni, E. Free Competition and the Optimal Amount of Fraud. J. Law Econ. 1973, 16, 67–88. [Google Scholar] [CrossRef]
  62. Vecchio, R.; Annunziata, A. Willingness-to-pay for sustainability-labelled chocolate: An experimental auction approach. J. Clean. Prod. 2015, 86, 335–342. [Google Scholar] [CrossRef]
  63. Migliore, G.; Borrello, M.; Lombardi, A.; Schifani, G. Consumers’ willingness to pay for natural food: Evidence from an artefactual field experiment. Agric. Food Econ. 2018, 6, 21. [Google Scholar] [CrossRef]
  64. Botelho, A.; Dinis, I.; Lourenço-Gomes, L.; Moreira, J.; Pinto, L.C.; Simões, O. The effect of sequential information on consumers’ willingness to pay for credence food attributes. Appetite 2017, 118, 17–25. [Google Scholar] [CrossRef]
  65. Katt, F.; Meixner, O. A systematic review of drivers influencing consumer willingness to pay for organic food. Trends Food Sci. Technol. 2020, 100, 374–388. [Google Scholar] [CrossRef]
  66. Molinillo, S.; Vidal-Branco, M.; Japutra, A. Understanding the drivers of organic foods purchasing of millennials: Evidence from Brazil and Spain. J. Retail. Consum. Serv. 2019, 52, 101926. [Google Scholar] [CrossRef]
  67. Coderoni, S.; Perito, M.A. Approaches for reducing wastes in the agricultural sector. An analysis of Millennials’ willingness to buy food with upcycled ingredients. Waste Manag. 2021, 126, 283–290. [Google Scholar] [CrossRef] [PubMed]
  68. Dolgopolova, I.; Teuber, R. Consumers’ Willingness to Pay for Health Benefits in Food Products: A Meta-Analysis. Appl. Econ. Perspect. Policy 2017, 40, 333–352. [Google Scholar] [CrossRef]
  69. Ouyang, Y.; Sharma, A. Consumer-citizen willingness to pay for healthy eating messages. Int. J. Contemp. Hosp. Manag. 2019, 31, 890–909. [Google Scholar] [CrossRef]
  70. Limnios, E.M.; Schilizzi, S.; Burton, M.; Ong, A.; Hynes, N. Willingness to pay for product ecological footprint: Organic vs. non-organic consumers. Technol. Forecast. Soc. Chang. 2016, 111, 338–348. [Google Scholar] [CrossRef]
  71. Krystallis, A.; Chryssohoidis, G. Consumers’ willingness to pay for organic food. Br. Food J. 2005, 107, 320–343. [Google Scholar] [CrossRef]
  72. Zhao, R.; Geng, Y.; Liu, Y.; Tao, X.; Xue, B. Consumers’ perception, purchase intention, and willingness to pay for carbon-labeled products: A case study of Chengdu in China. J. Clean. Prod. 2018, 171, 1664–1671. [Google Scholar] [CrossRef]
  73. Zhang, B.; Fu, Z.; Huang, J.; Wang, J.; Xu, S.; Zhang, L. Consumers’ perceptions, purchase intention, and willingness to pay a premium price for safe vegetables: A case study of Beijing, China. J. Clean. Prod. 2018, 197, 1498–1507. [Google Scholar] [CrossRef]
  74. Didier, T.; Lucie, S. Measuring consumer’s willingness to pay for organic and Fair Trade products. Int. J. Consum. Stud. 2008, 32, 479–490. [Google Scholar] [CrossRef]
  75. Konuk, F.A. Consumers’ willingness to buy and willingness to pay for fair trade food: The influence of consciousness for fair consumption, environmental concern, trust and innovativeness. Food Res. Int. 2019, 120, 141–147. [Google Scholar] [CrossRef]
  76. Yin, S.; Han, F.; Wang, Y.; Hu, W.; Lv, S. Ethnocentrism, Trust, and the Willingness to Pay of Chinese Consumers for Organic Labels from Different Countries and Certifiers. J. Food Qual. 2019, 2019, 13. [Google Scholar] [CrossRef] [Green Version]
  77. Printezis, I.; Grebitus, C.; Hirsch, S. The price is right!? A meta-regression analysis on willingness to pay for local food. PLoS ONE 2019, 14, e0215847. [Google Scholar] [CrossRef] [Green Version]
  78. Moser, R.; Raffaelli, R.; Thilmany, D.D. Consumer preferences for fruit and vegetables with credence-based attributes: A review. Int. Food Agrib. Mgmt. Rev. 2011, 142, 121–142. [Google Scholar] [CrossRef]
  79. IRI European Shopper Insights Survey. Available online: Iriworldwide.com (accessed on 1 January 2022).
  80. Arora, A.; Rani, N.; Devi, C.; Gupta, S. Factors affecting consumer purchase intentions of organic food through fuzzy AHP. Int. J. Qual. Reliab. Manag. 2021. [Google Scholar] [CrossRef]
  81. Dahlhausen, J.L.; Rungie, C.; Roosen, J. Value of labeling credence attributes-common structures and individual preferences. Agric. Econ. 2018, 49, 741–751. [Google Scholar] [CrossRef]
  82. Kabadayı, E.T.; Dursun, I.; Alan, A.K.; Tuğer, A.T. Green Purchase Intention of Young Turkish Consumers: Effects of Consumer’s Guilt, Self-monitoring and Perceived Consumer Effectiveness. Procedia Soc. Behav. Sci. 2015, 207, 165–174. [Google Scholar] [CrossRef] [Green Version]
  83. Bonanno, A.; Bimbo, F.; Costanigro, M.; Lansink, A.O.; Viscecchia, R. Credence attributes and the quest for a higher price—a hedonic stochastic frontier approach. Eur. Rev. Agric. Econ. 2018, 46, 163–192. [Google Scholar] [CrossRef] [Green Version]
Figure 1. Research model.
Sustainability 14 04338 g001
Figure 2. The average value of buying intention scale items across PCE segments. PCE 1 segment—’I don’t know much about it’ and ‘I don’t think I can do anything about it’. PCE 2 segment—’I do not think there is much I can do, but I will try to do what I can’. PCE 3 segment—’I will do my best to achieve this’. Source: Authors’ own calculations, 2022. N = 1204.
Sustainability 14 04338 g002
Figure 3. The percentage of respondents and their willingness to pay for specific product attributes based on perceived consumer effectiveness and product category. PCE 1 segment—’I do not know much about it, and I do not think I can do anything about it’. PCE 2 segment—’I do not think there is much I can do, but I will try to do what I can’. PCE 3 segment—’I will do my best to achieve this’. Source: Authors’ own calculations, 2022. N = 1204.
Sustainability 14 04338 g003
Figure 4. The percentage of respondents and their willingness to pay for specific product attributes per segment and age categories. Source: Authors’ own calculations, 2022. N = 1204.
Sustainability 14 04338 g004
Figure 5. The difference between genders in willingness to pay for food product attributes (in the percentage of respondents). Source: Authors’ own calculations, 2022. N = 1204.
Sustainability 14 04338 g005
Table 1. Consumer preferences of sustainable food attributes: frequency of scale items, TOP2, mean, median, and standard deviation.
Not important at all-1Rather not important-2Indifferent-3Rather important-4Very important-5I don't knowTOP 2MeanMedianStd. Deviation
Fresh food.0.51.02.923.871.50.395.34.6650.64
Healthy food (e.g. vitamin and mineral content. antioxidants)1.33.413.746.734.10.880.84.1140.868
Affordable price of food.0.85.613.145.034.90.679.94.140.887
Conveniently available.1.44.215.946.731.40.478.14.0440.885
The intrinsic properties of the food (e.g. nutrients. vitamins. energy content)1.85.115.844.731.51.376.24.0340.94
I can buy it at a discounted price.2.36.719.046.025.60.371.63.8740.96
Environmental protection during production.3.15.024.642.922.41.965.33.8240.998
The product should be free from genetic modification.3.76.421.634.330.93.165.23.9141.112
Traditional. local food.6.78.229.639.814.90.854.73.541.077
Consideration of animal welfare. (e.g. free range)5.88.827.935.518.33.853.83.6341.161
Local food.6.310.535.137.09.81.346.83.3731.048
Branded (producer/trade) products.7.012.733.236.79.21.245.93.3231.072
The packaging should be attractive.11.214.937.128.96.81.135.73.0831.117
Food adaptability to special diets (paleo. vegan. etc.)21.214.529.318.913.92.332.82.9631.393
Source: Authors’ own calculations, 2022. N = 1204. Source of the scale: Kovacs et al. [17].
Table 2. The mean values of young consumers’ consumption intention scale items across PCE segments; 1-5 Likert scale, 1= ‘not at all’, 5=‘totally agree’.
AspectPCE 1PCE 2PCE 3
I strive to increase my consumption of fruit and vegetables, especially in high season.3.754.114.38
I strive to shop at a local or nearby store.3.173.664.16
I strive to cook food for several people for several days.3.383.653.94
I tend to favour seasonal foods.3.613.683.86
I tend to buy free-range animal products (eggs, milk, meat).3.173.333.79
I strive to reduce food waste and loss.3.133.363.76
I strive to reduce my intake of foods and drinks of low nutritional value.3.463.613.72
I strive to buy more and more branded foods (both from retailers and manufacturers).2.973.183.71
I strive to buy food from fair trade sources.2.943.213.67
I strive to buy animal products that meet animal welfare standards.2.953.323.6
I strive to reduce my consumption of bottled mineral water.3.023.053.57
I strive to cook food in an energy-efficient way.2.942.933.51
I prefer locally produced and processed foods.2.722.883.3
I tend to shop at the local market, farmers’ market or fairground.2.782.753.26
I will strive reduce the purchase of food from distant countries.3.033.013.24
I strive to reduce my food consumption.2.382.42.97
I strive to buy organic food.2.622.782.96
I strive to reduce consumption of meat and dairy products.2.362.272.82
I strive to follow a vegetarian (vegan, ovo, lacto, ovo-lacto, semi-vegetarian) diet.2.021.692.17
PCE 1 segment—’I don’t know much about it, and I don′t think I can do anything about it’. PCE 2 segment—’I don’t think there is much I can do, but I will try to do what I can’. PCE 3 segment—’I will do my best to achieve this’. Source: Authors’ own calculations, 2022. N = 1204. Source of the scale: Kovacs et al. [17].
Table 3. WTP indices presenting the order of preferences for credence attributes.
Product CategoryOverall IndexMen
Index
Women Index18–24 Index
Handcrafted product0.1040.1040.1040.103
Preservative/colouring-free0.0950.0890.1010.090
Animal welfare0.0930.0840.1030.095
Traditional0.0920.0930.0920.087
Modified0.0880.0780.0990.091
Local food0.0870.0870.0870.081
Organically grown0.0860.0810.0900.083
Gluten- or lactose-free0.0700.0590.0810.069
Source: Authors’ own calculations, 2022. N = 1204.
Publisher’s Note: MDPI stays neutral with regard to jurisdictional claims in published maps and institutional affiliations.

