Article

Ridesharing as a Potential Sustainable Transportation Alternative in Suburban Universities: The Case of Najran University, Saudi Arabia

Architectural Engineering Department, College of Engineering, Najran University, Najran 66462, Saudi Arabia
Sustainability 2022, 14(8), 4392; https://doi.org/10.3390/su14084392
Submission received: 18 February 2022 / Revised: 24 March 2022 / Accepted: 5 April 2022 / Published: 7 April 2022
(This article belongs to the Special Issue Shared Mobility and Sustainable Transportation)

Abstract

:
In Saudi Arabia, car ownership rates are considered comparatively high due to the lack of other alternatives, cheap fuel and car registration costs, and higher income. The population relies mainly on automobiles for their daily trips and primarily commutes alone, contributing to many negative consequences. Therefore, ridesharing is a transportation mode that is a suitable approach in such an area, since it can increase the occupancy rates and reduce single-occupant driving, which in turn can cut vehicle emissions, contribute to a reduction in vehicle ownership and vehicle miles traveled, alleviate traffic congestions and accidents, and decrease the need for parking spaces. Suburban universities are considered major trip generators and attractors. They also can offer a niche market for ridesharing programs. Thus, data was obtained from a survey performed at Najran University to investigate the ridesharing behavior among the university population. Following a descriptive analysis of the commuter survey data, a binary logistic regression model was adopted to investigate the interest in ridesharing. The estimation results show being female and non-Saudi, as well as being students and faculty members in general (versus staff), along with the presence of fixed (regular) work or class schedules, increase the likelihood of ridesharing. Since the probability of most of the university population (i.e., students and faculty members) toward ridesharing is high, the number of automobiles needed by commuters will be reduced, resulting in a higher transition to environmentally sustainable urban mobility. In addition, the university has many motivators that can positively affect the propensity to rideshare, such as the lack of public transportation, fixed schedules, a longer distance to campus, and a similar social background among attendees; therefore, universities or other large employers can take these motivators into account when planning ridesharing services.

1. Introduction

The transportation sector is one of the most problematic sectors for public policy, particularly regarding the negative externalities associated with widespread motor vehicle use (e.g., traffic congestion, accidents, and greenhouse gases emissions (GHGs)). The efforts to reduce the negative effects of automobile dependency are challenged by the inflexibility of the existing transportation infrastructure, especially considering it is projected that automobiles worldwide will increase to 2.8 billion and emissions from roads will double by 2050 [1].
In Saudi Arabia, the oil boom in the 1970s caused extensive urban growth, urbanization, and a dramatic increase in car ownership [2]. The spread-out, built environment that characterizes many Saudi cities and suburbs also results in overdependence on the private vehicle; Saudi cities offer neither adequate public transportation nor integrative infrastructure for pedestrians and cyclists. In other words, diversified transportation modes for daily commuting are not common, and most of the population relies mainly on automobiles for their daily trips [3]. Moreover, fuel prices and car registration fees in Saudi Arabia are among the cheapest worldwide, and roads are highly developed [4]. This makes the car ownership rate one of the highest in the world. For example, according to the General Authority for Statistics [5], 95% of Saudi households own cars; specifically, 65% own one car, 23% own two cars, and 12% own three cars or more; the average car ownership in Saudi Arabia is around 1.69 cars per household.
Furthermore, 95% of work and school trips in Saudi Arabia are made by private cars, creating an overdependence on private cars and less sustainable travel patterns, which are associated with many negative environmental, social, and economic consequences. In 2017, road transportation in Saudi Arabia was responsible for 28% of total Saudi Arabian GHG emissions, second only to the electricity sector [6]. Therefore, it is important to recognize the significant role of light-duty vehicles in emissions production when suggesting transportation demand management (TDM) strategies that can offer commuters options for single-occupant driving and reduce the number of automobiles in the streets. One of the more cost-effective alternatives is ridesharing (i.e., carpooling and vanpooling). It is the most successful approach in areas that are not well served by public transportation and are not ready for walking or biking [7]. Furthermore, this program does not keep commuters from their automobiles, but increases the occupancy rate, making it a distinctive policy [8].
According to the UN-Habitat [9], the average occupancy rate of private vehicles is well below two passengers per car, while most of them have at least four seats for passengers and the driver. Commuting alone continues to account for many car trips. For example, the occupancy rate for work trips in the United States is 1.59 people per car [10], 1.45 in Europe [11], and 1.2 people per car in Saudi Arabia [12]. In addition, many employees drive alone to work. In the UK, 86% of commuters drove alone to work in 2012 [13]; in the US, solo drivers accounted for 76% of all work trips [14]. In Saudi Arabia, 92.3% of employees drive alone to work [15]. This is unsurprising, since solo driving can provide more flexibility and privacy over destinations and schedules, while ridesharing entails sacrifices in these areas [16].
Considering that the capacity of a standard passenger car is around five to six persons, this means about 75% is unused capacity. Therefore, the ridesharing policy yields an efficient use of the capacity of passengers’ automobiles. The appeal of ridesharing programs lies in their leveraging of existing infrastructure, and those programs require relatively little investment for implementation [17]. These programs are also intermediate modes between riding transit and driving alone. They offer numerous environmental, economic, and social benefits, since reduced car use is associated with suppressing single-occupied vehicles, reducing emissions, alleviating traffic congestions and accidents, decreasing the need for parking spaces, generating commuter cost savings, and raising the mobility level of the carless [18,19].
Studies of ridesharing have mainly focused on ridesharing in urban communities rather than on a specific segment. Few studies are known about ridesharing determinants, demand, aspects, consumption, and personal attributes of the population of the same place, particularly the same university, although universities are considered trip generators and attractors. University campuses can offer a niche market for ridesharing [20], especially suburban universities that lack public transportation services and do not have adequate pedestrian and bike infrastructure. A university population is usually more receptive to ridesharing [21] than the city population at large. In addition, more of the university population are already members of TDM programs than the population at large [22] and thus, are more likely to be responsive to ridesharing for daily commutes to campus [19]. Furthermore, university campuses present excellent application opportunities for carpooling and vanpooling, since they accommodate a significant number of the population (faculty members, staff, and students) who are from many different origins with a single destination and similar behaviors and preferences, such as common mode shifts and route choices. Many college and university planners found that ridesharing programs were very popular among faculty members, staff, and students who value inexpensive, convenient alternatives to driving alone every day [23].
For these reasons, this study investigates ridesharing potential among the suburban university population. The author analyzed the data collected from the Najran University (NU) population on transportation patterns of commuters, with a specific emphasis on ridesharing, particularly carpooling and vanpooling. In Najran city, the average car ownership rate is 1.5 cars per household, and around 94% of people commute alone to work [24]. This city lacks most alternatives to private automobiles; it has neither public transportation services nor a taxi or ride-hailing business model, such as Uber or Lyft. This paper also seeks to alleviate negative transportation externalities by better understanding factors affecting the decision to carpool or vanpool. This deeper understanding of ridesharing can help city and campus planners develop policies, strategies, and programs to reduce driving alone to/from campus, which is one of the main sources of GHGs and many other social and economic concerns.
To the best of my knowledge, there are very few studies that have investigated factors affecting ridesharing programs in suburban universities. Many of these universities are built away from residences, amenities, city centers, and services, which results in a longer commuting time and distance to campuses and therefore, negative environmental, economic, and social consequences, especially in areas where travelers rely mainly on automobiles [25]. This means there are still huge gaps in the literature in this area. This study aims to fills the gap by exploring and evaluating the important determinants and characteristics of commuting behaviors to/from a suburban university—in this case, Najran University—especially regarding ridesharing behavior.
After the introduction is addressed in this section, the paper is organized as follows: in the next section, the literature review describing ridesharing is covered, followed by introducing the study data, study area, and adopted research methodology. Next, descriptive statistics, main outcomes obtained, and the interpretation of the results are presented. Finally, the last section discusses the findings and draws some conclusions, with directions for future research.

2. Literature Review

The purpose of ridesharing is to persuade commuters to share mobility with a number of commuters, while trying not to restrict their vehicle-use demands [8]. It is reasonable to consider ridesharing an appropriate strategy as an alternative mode choice, since it is a mediating force between the reduced negative externalities of transportation and the inclination toward retaining an automobile.
Among researchers, the term ridesharing still has a certain level of ambiguity in its use and definitions [8,26]. The US Department of Transportation [27] defines ridesharing programs as the practices of sharing rides, especially in the form of carpooling and vanpooling. Others added that ridesharing is applied to vehicles that carry multiple commuters when making trips with similar destinations and times [23,28]. According to Shaheen et al. [29], carpooling includes some forms of sharing a ride, such as casual (or informal) carpooling where no money exchanges hands, or where commuters pay a nominal amount to reimburse drivers for actual travel expenses (e.g., tolls, fuel), and they use vehicles interchangeably. In vanpooling, 7 to 15 passengers usually share the cost of a van or a minibus from different locations to a similar destination [29]. However, some authors have used ridesharing as a general term for various shared-ride practices, including carpooling, carsharing, and the use of taxis and bicycles [30].
For the purpose of the current study, the author adopted the term of ridesharing to include two different practices. This study considered the most common practices in Saudi Arabia: carpooling, or what is called non-household carpools, where two or more individuals not living in the same household commute together in a private vehicle owned by one of them (or two or more vehicles to be used interchangeably); it is acquaintance-based and usually for free. The second type is vanpooling, where a private driver owns a minibus or van and picks up commuters from multiple locations to the same final destination for a fee.
Extensive research has covered factors and motivators affecting commuters’ decisions to share rides, especially in urban communities, while few studies concerned ridesharing behavior in academic institutes. The authors found that some factors could increase ridesharing in urban communities, while others decrease the likelihood of ridesharing. Neoh et al. [16] used meta-analysis to synthesize 22 existing empirical studies about non-household carpooling and found that females, single people, companies with a higher number of employees, the existence of fixed (regular) work schedules, and living in urban areas are associated positively and significantly with carpooling. However, age had zero impact on carpooling, and the intention to reduce traffic congestion indicates a small effect. Kaufman [31] reported that workplaces with many employees have a large pool of potential ridesharers.
Others found that, in urban communities, a higher income of the commuters [16,32,33], higher education [34], younger age of commuters [16,35], professionally employed commuters [33], being non-citizen residents or immigrants [32,36,37] and being male [32,34,38] increase the likelihood of ridesharing. Some authors assert that women are less likely to carpool than men because of household commitments resulting in inflexibility with their schedules [34], but this view is challenged in current studies [39]. Shaheen [40] added that as carsharing program costs, walking distance to the reserved car, or car ownership increased, carsharing decreased.
Some studies added that situational factors could influence ridesharing patterns. For instance, carpooling is attractive in locations that lack public transportation [41]; also, there is disagreement on whether longer travel distances encourage or discourage carpooling, but many found ridesharing trips tend to be longer than SOV ones [16,41]. Furthermore, Tezcan [8] confirmed that ridesharing programs tend to encompass relatively long commutes, resulting in major mileage and cost reductions. However, Concas et al. [42] studied the Puget Sound region (Washington) and found that vanpool demand became inelastic for longer distances (i.e., more than 60 miles), while offering vanpooling subsidies doubled the vanpooling demand.
One of the prominent ridesharing motivators is the incentive to save traveling costs (e.g., fuel price and the cost of owning a car) [39,43], especially given that there is a growing cost of traveling in single-occupied vehicles (SOV) [44]. It is a lucrative opportunity for the university population, particularly students, since it can eliminate several costs associated with commuting to campuses, such as fuel and car ownership costs and wear and tear on vehicles. Another motivator is the intention to reduce traffic congestion [19,28,45], but Neoh et al. [16] found that this factor has a small positive effect. The attitudes regarding negative environmental issues increase the acceptance of ridesharing [33,40,43]. For instance, Park et al. [46] showed that in the UK, 55% of the respondents admit they would reduce car use due to environmental reasons. The Federal Transit Administration has identified vanpooling programs as the greenest motorized mode in cities, and it is an effective way to tackle GHG emissions [47]. However, Zhou et al. [48] found that environmental issues are not the key factor in predicting the willingness to use carsharing services; instead, program cost, reliability, and convenience were found to be the most important factors.
Acquaintanceship is a major factor in the success of carsharing and vanpooling agreements [49], while ride matching either by location or time can be a major barrier to ridesharing programs [28,50]. Some other researchers linked ridesharing to the desirability to socialize, but not with strangers [51]. Social differences, differences in values [52], and differences in races and ethnicities of other prospective partners [44] can be potential barriers for ridesharing. However, Saudi society overall enjoys getting to know others and making friends. The Saudi people are by nature hospitable and want to form social relations; this in turn helps to increase ridesharing practices.
Other important factors that can be salient in ridesharing decision-making processes, perhaps even more important than sociodemographics, are psychological factors [51]. Perceiving convenience is a very important factor in increasing ridesharing [53]; Ozanne and Mollenkopf [54] added that as commuter attitudes (i.e., personal relative advantage and compatibility) increase, the desire to rideshare increases as well. Lower privacy and personal space can put people off from ridesharing [55].
In academic institutes, Zheng et al. [21] found that the University of Wisconsin, Madison, is a niche market for carsharing compared to the general market of carsharing. They reported that undergraduate, graduate students, and foreign residents are more likely to carshare than retired persons, faculty members, and staff; increased car ownership decreases the likelihood of becoming a carsharer, while income does affect carsharing participation. University members who do not use private vehicles for personal errands and who care about fuel costs are more likely to join carsharing plans. Easy access to a shared vehicle significantly increases the likelihood of carsharing. In addition, this study found that women are more likely to carshare than men. However, at Ohio State University, 40% of the university members would be interested in a carpooling program; no difference was found between gender regarding the interest in carpooling, but the likelihood increased with distance, being a graduate student, higher fuel costs, a guaranteed ride home, and a variety of pick-up and drop-off times. However, the probability of carpooling decreases with an irregular schedule, commuting with unknown partners, and wasting time waiting for other participants [56]. Zhou et al. [48] showed that higher car ownership rates and income, being a part-time student or worker, and employment density all reduce the likelihood of participating in the carsharing program at the University of Texas at Austin.
Another study by Zhou [57] investigated the carsharing of UCLA employees. The results revealed that the university campus is a niche market for carsharing, and that carsharing rates increase among employees who use alternative modes other than driving alone, employees whose income is lower than the median income, and female employees. In addition, the participation of the university employees is lower than that of the students. The other study by Zhou [19] concluded that carsharing is the most popular among UCLA students, female employees, and bus commuters. Michigan State University’s employee commuting patterns were also investigated by Kaplowitz and Slabosky [53], who found only 8.3% of them carpool or vanpool to the campus. The authors also examined factors that may affect carpooling and found a longer distance, lower parking costs for carpoolers, and knowing potential partners greatly affected carpooling. Khattak et al. [58] examined the travel patterns of students in four universities in Virginia, U.S., and found students’ shared rides were lower than the general population by 11 to 16%. In addition, they found mode shares are different among the four universities, depending on personal preference, the built environment of the campus, availability and accessibility of public transportation, the weather, and the employment situations of the students.
University members familiar with carsharing are more likely to carshare than those not familiar with these programs [40]. Ridesharing programs are more also useful at universities, since commuters can benefit from cutting the incremental cost of fuel and parking, increased social interactions, stress alleviation, reduced traffic congestion, accidents, and GHG emissions; additionally, they are a sustainable way to commute [28,45,59]. Zheng et al. [21] added that university campuses are one of the major markets for ridesharing programs, since they offer an amenity to the university population, project a progressive, environmentally conscious image, and, most importantly, decrease on-campus parking demand. Akar et al. [56], however, added that the lower level of ridesharing in universities could be attributed to irregular or constrained schedules, lost time waiting for other passengers, and dependence on others who are not known, while other factors can encourage carpooling behavior including fuel cost, a variety of pick-up and drop-off times, and a guaranteed ride home.
Applying a carpooling program at the University of California, Davis, that offers a 60% discount on parking passes, provides reserved parking spaces at premium locations, and offers drawings for prizes, increased carpooling by 30% for faculty members and 25% among staff [60]. Likewise, in Indonesia, around 60% of Petra Christian University students are interested in joining carpooling programs, and the major factors that influence these students are cost-savings and attractive facilities [23]. PIRG’s ridesharing program was applied at Cornell University, removing around 2000 cars from the roads in six months [60]. Stasko et al. [61] revealed that each carsharing vehicle reduced 15.3 personal vehicles at the Cornell University and Ithaca College campuses. In addition, Setiawan [23] showed that implementing carpooling programs at Petra Christian University led to a 25.3% (796 cars) reduction in car usage every day.
Drawing from the previous sections, ridesharing interventions could be planned according to the commuters’ motivations. Collura [62] shows that workplaces are an appropriate environment for applying ridesharing programs, by the fact that both employers and employees are motivated to reduce parking pressures, employers can act as facilitators, and there are numerous potential participants. Furthermore, the same regular work schedule can be a major motivator for ridesharing, especially with increased convenience due to commuting with co-workers or classmates [63]. Habib et al. [64] also found that flexible schedules can increase ridesharing if the commuter has already included ridesharing as a choice in their traveling decision. However, Morency [52] noted that inflexibilities in commuters’ schedules are seen to deter ridesharing.
To overcome concerns about the inconvenience of ridesharing, many studies found that some employers reimburse travel expenses to the ridesharer if they have to leave for home outside the pre-determined time [65,66,67]. Another useful intervention regarding the ridesharing market is applying transportation strategies that emphasize the cost of driving alone; this was found to be effective in switching commuters to ridesharing programs [68]. Cash incentives were also found to be more attractive and effective to carpoolers than parking discounts [69], as were preferential parking for carpoolers when there is a shortage of parking [43], High Occupancy Vehicle priority (e.g., HOV highway lanes), and awards and financial incentives (e.g., cash payment to carpooler employees) [28,70]. Another very important intervention is a ridesharing matching service; finding partners is a key factor in the formation of ridesharing [16].
Another important concept is familiarity; being familiar with and having information about ridesharing plays a major role in its ongoing expansion and development [71]. For example, offering information and encouragement about ridesharing programs typically attracts 5% to 15% of commuters, and including financial incentives in those programs (e.g., HOV priority and parking cash-out) attracts 10% to 30% of commuters [72].
In summarizing the literature, the ridesharing field is rich in urban community studies, while few studies concern ridesharing behavior at academic institutions. Thus, doubts remain about the generalizability of the results, making it difficult for policy and decision-makers to translate the findings into practice, especially at universities. The results of previous studies agreed that a university campus is a niche market for ridesharing practices, and many factors can increase or decrease ridesharing activities, while other factors have mixed results, and others do not seems to have any impact. In terms of demographic factors and their relationship with ridesharing, almost all studies found younger commuters, those who are more highly educated and professionally employed, non-citizens, and immigrants who live in urban areas are positively associated with ridesharing.
The results regarding gender and income are mixed; some found females are more likely to rideshare compared to men, while other studies found the opposite. Similar results were found with income, and some studies found income does not affect participation. Students are more likely to rideshare than faculty members and staff. However, being married, owning more vehicles, and social differences in either race or ethnicity are associated negatively with ridesharing.
Regarding judgmental factors, probably all of them are positively associated with ridesharing. In other words, commuters who intend to reduce traffic congestion or the negative impact of commuting or who care about fuel costs or parking costs are more likely to rideshare, while higher carsharing program costs reduce the likelihood of becoming a ridesharer. Some situational factors increase the probability of ridesharing, while others do not. Fixed work and class schedules, long travel distances, a higher number of employees, reliability, familiarity, convenience, and knowing the potential partners are likely to increase ridesharing behavior; however, lower privacy and personal space, wasting time waiting for other participants, and unknown partners can deter ridesharing. Useful intervention regarding the ridesharing market can play a major role in ridesharing, such as lower parking costs for carpoolers, a guaranteed ride home, ride-matching services by either location or time, HOV lanes, and a variety of pick-up and drop-off times.

3. Data and Study Area
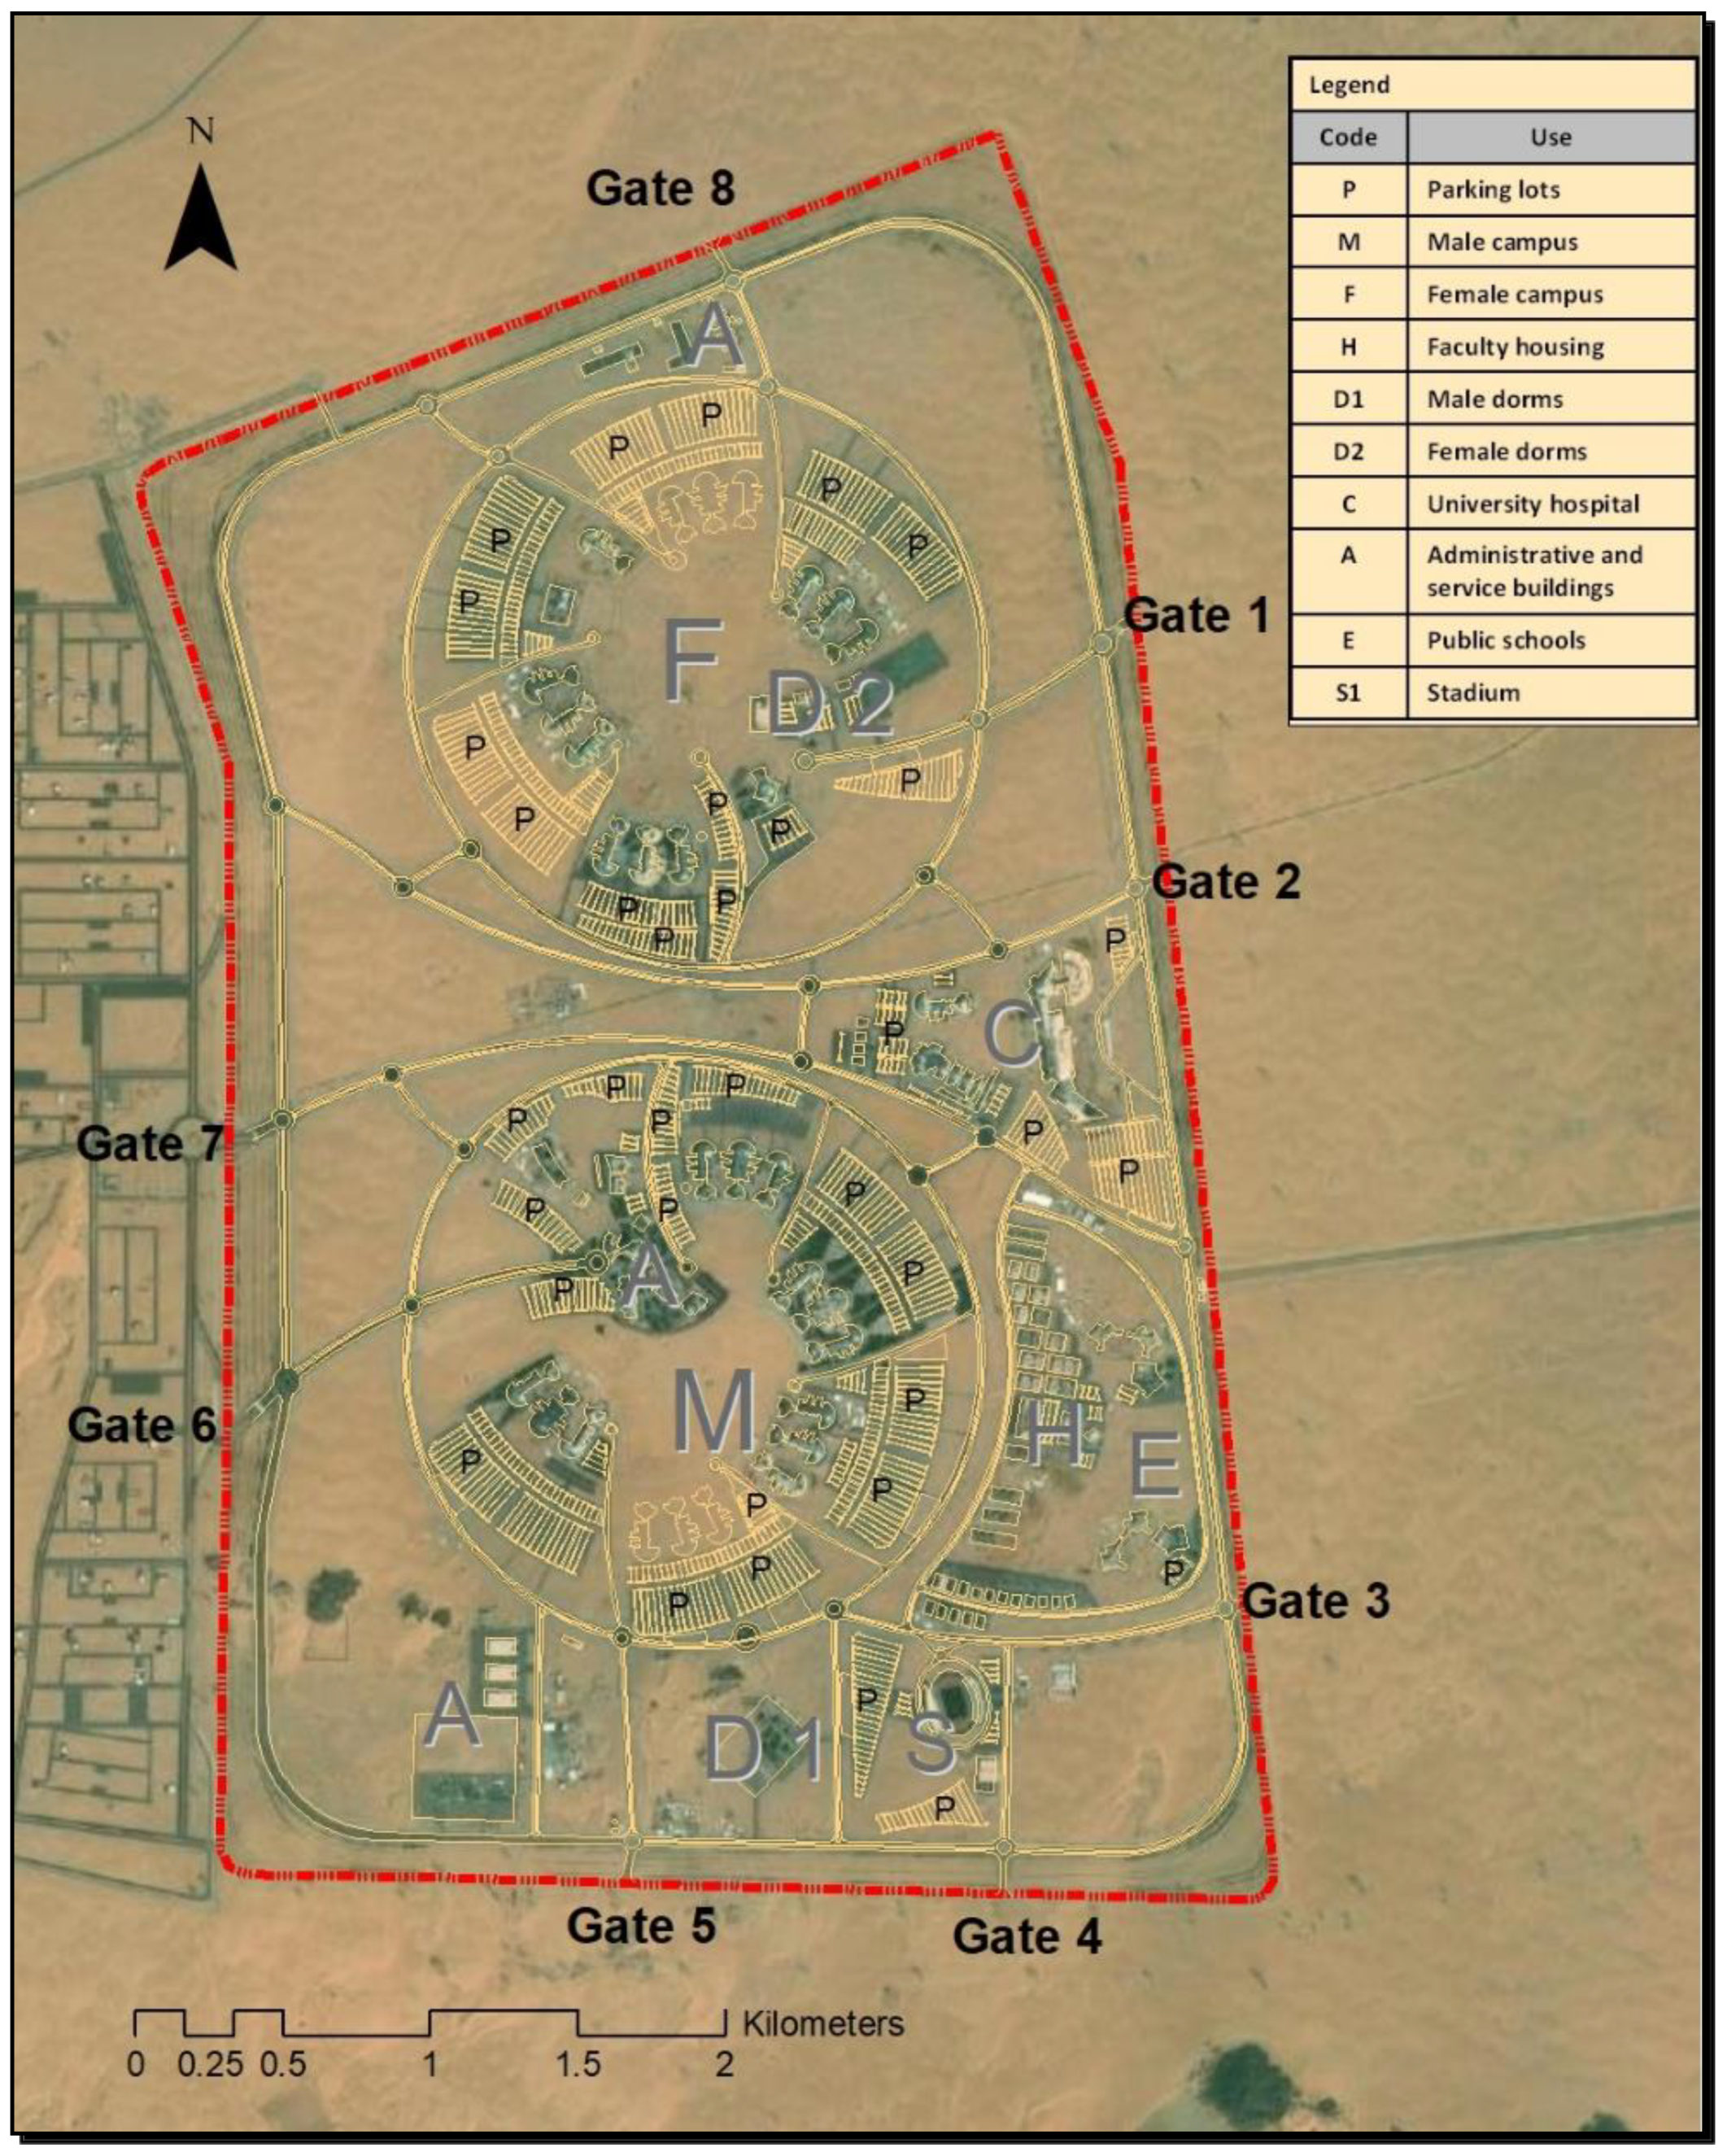
3.1. Study Area

Najran University is the largest university in Saudi Arabia; it is a public university situated on 18 km2, and it is gender-segregated with two major campuses [73]. The university also contains many facilities (e.g., administrative buildings, support deanships, a university hospital, sports and entertainment centers, public school buildings, and housing for students and faculty members), as shown in Figure 1 [73]. The university population is growing fast, currently consisting of around 12,204 students (4860 males, 7344 females). There are 1365 faculty members (900 males, 465 females) and 661 staff (489 males, 172 females) [73]. All of these are full-time members; the staff work hours and students’ classes are mostly between 8:00 a.m. to 2:15 p.m., so the rush hours are from 7:30 to 8:30 a.m. and from 1:30 p.m. to 3:00 p.m. The number of university students are expected to increase rapidly, which will require more staff and faculty members. As shown in Figure 1, the campus has eight gates; only two are in use, and the main transportation infrastructure is composed of main ring roads surrounding NU. There are two rings, one for the male campus and the other for the female campus, as shown in Figure 1.
There are around 39,750 parking spaces on the campus, meaning around three parking spots for each person; this increases the dependency on private vehicles, especially given that Najran city has neither public transportation, taxi services, nor carsharing programs. NU does provide free bus services for female students; however, this service is limited for many reasons. Thus, many female students do not prefer commuting by university buses.

3.2. Data Collection and Survey Design

No available data was found regarding the commuting behavior of the Najran University population. Therefore, there is a need to collect this information. One of the most common approaches for collecting data is a survey [74]. For this study, the author prepared the manual questionnaire survey based on the research aims and questions, and it was designed to help identify the rideshare market potential at Najran University, as opposed to the current observed market.
The questionnaire consists of questions relating to sociodemographic and economic information, commuting patterns, and times to and from the campus. Then, the author assessed the questionnaire’s validity and reliability. The questionnaire survey was available online and was conducted on the main campus of NU between 20 April 2018, and 5 May 2018. It was sent to all NU students, faculty, and staff through text message. Two weeks later, a reminder was also sent to them through email and text message. The target population consisted of all NU faculty, staff, and students (14,114 persons). The author was willing to increase the sample size to ensure that the responses truly reflect the population. The author’s larger confidence level is 99% and lower confidence interval (margin of error) is ±4%, so the sample size required is 969 responses. Throughout this period, a total of 1145 responses were completed, resulting in a response rate of around 8.1% of the campus population. The response rate was greater than the expectation, meaning that the confidence level was (99%), and the margin of error became ±3.65%. The respondents were reasonably well-diversified, since there are many responses from all university members. Therefore, we can say that this sample is comprehensive and representative of the university population.

3.3. Method

Ridesharing studies have used a range of analytical methods that mainly depend on the focus of the study. To investigate the determinant of interest in using ridesharing, researchers have typically compared ridesharing participants to a control group to attribute commuting pattern differences between groups, specifically regarding ridesharing systems. To better understand how ridesharing programs are different from other modes, and to analyze and predict the relationship between some factors (e.g., demographic, social, economic, travel behavior) and ridesharing usage, we need to use some statistical modeling. In this study, the author adopted the binary logistic regression model to predict the questionnaire respondents’ likelihood of ridesharing when commuting to campus. In other words, it can analyze the determinants of interest to use ridesharing by controlling for other factors such as distance between campus and home, car ownership, nationality, gender, age, job, arrival and departure time, marital status, and educational qualifications. A better understanding of determinants of interest in using ridesharing helps planners develop policies, strategies, and programs to reduce driving alone to/from campus.
Based on the utility theory, it has been assumed that the decision maker selects the alternative that provides the maximum utility attainable for them [75]. In this study, the choice set is binary, and it is based on the ridesharing to the university campus context: being a ridesharer (i.e., carpooler or vanpooler) to/from campus versus commuting alone to/from campus. Being a commuter alone to campus is set as the base case. The probability [P] of being a ridesharer for traveler [n] is given by the following:
P n ( i ) = P r ( U n ( i )   U n ( j ) )
where [U] represents the utility of given, alternative, and [i] and [j] correspond to the choices of being a ridesharer or not. Equation (2) represents the utility [ U n ( i ) ] of being a ridesharer for traveler [n]. In this study, there are two alternatives: [i] being a ridesharer and [j] driving alone to campus:
U n ( i ) = β i x n i + ε n i
where [ U n ( i ) ] and [ U n ( j ) ] represent the utility function [ x n i ] is the observed variable that related to the individual; [ β i ] is a vector of unknown coefficients; and [ ε n i ] is the random error. The binary logistic function can be written as follows:
P n ( i ) = 1 1 + e I _ ( x n j x n i )

4. Results and Discussion

4.1. Survey Results

As stated earlier, this study uses the most common practices of ridesharing in Saudi Arabia: carpooling and vanpooling. Ridesharing programs in Saudi Arabia are not organization-based. Almost all carpooling practices are acquaintance-based, where two or more individuals (e.g., workers, faculty members, university students) not living in the same household commute together in a private vehicle owned by one of them (or two or more vehicles to be used interchangeably). The second type is vanpooling, where a private driver or a retired person owns a minibus or van and picks up commuters (primarily for women, either students or staff) from multiple locations to the same final destination for a fee. All vanpooling practices are solo attempts by individuals who want more income.
During the survey, women were still not allowed to drive in Saudi Arabia due to some cultural and religious factors, which strongly affected travel behavior characteristics. However, a decree was issued allowing women to drive as of May 2018. Table 1 provides the basic descriptive statistics for the survey sample. Chi-square tests were utilized to compare the means of ordinal and categorical variables, while one-way ANOVA tests were used for continuous variables. All variables show statistically significant differences between the means of members who commuted alone and who carpooled or vanpooled. The survey results showed that 722 (63%) of the respondents commuted alone to campus, and 423 (37%) carpooled or vanpooled. The proportion of members commuting as groups can be considered high, since many females were not allowed to drive, and they commuted with others. The survey showed that 64.2% of females and 17.4% of males carpooled or vanpooled to campus. Around 45.1% of single members and 28% of married members carpooled or vanpooled to the campus; the low percentage of married members who rideshare can be attributed to other trips they do on their way to the campus, such as dropping off or collecting children from schools, using cars for other personal business, or because of personal security or general convenience.
Surprisingly, the proportion of Saudi members who rideshared to the campus was greater than the non-Saudi members, despite non-Saudis exhibiting lower car ownership and lower income and living in similar neighborhoods. Around half of the members aged 16 and 29 rideshared to campus, while around 75% of members above 30 years old commuted alone to campus; this is likely because most older members had some duties to accomplish on their way to campus and because of more general convenience and security. Of the respondents, around 46% of the students, 34% of the faculty members, and only 18% of the staff rideshare to the campus; this is similar to what was found in most studies, that students rideshare more than faculty and staff members, and they are best suited to participate in ridesharing commuting patterns to/from universities [19,21,57].
Around 46% of members who had high school diplomas (most of them undergraduate students) and 31% of members having bachelor’s degrees or higher carpooled or vanpooled. Probably because of fixed (regular) work and class schedules and it being more convenient to carpool or vanpool with co-workers or classmates, 38% of respondents coming to campus before 9 a.m. and 42% of respondents departing between 12 and 3 p.m. carpooled or vanpooled. Finally, the average distance between home and campus for respondents driving alone was 39 km and 44.2 km for carpoolers and vanpoolers.

4.2. Predictive Modeling

As stated above, the binary logistic regression model was used to identify significant explanatory variables while controlling for other variables. The process went as follows: Independent variables were entered sequentially in groups, as displayed in Table 2. Categorical and ordinal variables have separated coefficients and odds ratios for each value; zero was the reference category. Some of the insignificant variables were eliminated except those that literature suggested were important to be retained in the model.
The model produces some interesting and surprising findings. The marital status variable was not significant in the model, and the sign of married was negative, meaning being married decreases the likelihood of becoming a carpooler or vanpooler. As stated by Zheng et al. [21], married people usually drop off or take children from schools, have errands to run, and may have shopping trips, which decreases the likelihood of them becoming ridesharers. Furthermore, the distance from campus to home variable was not found to be significant. This is an unexpected result, but the lack of significance is likely caused by the fact that as the distance from the campus increases, commuter locations may disperse to a massive area, and finding a carpool or vanpool partner may become more challenging; from the survey results, university members live in 29 out of 80 districts within Najran city. In almost all of the previous studies, a longer distance is associated positively with ridesharing [16,53,56].
Many other variables were significant, however. Female and non-Saudi members were positively associated with being carpoolers or vanpoolers. Although the statistical significance of the coefficient for many variables in the model is strong, the magnitude of the female coefficient is the largest in the model. Females had 7.1 times the odds of being carpoolers or vanpoolers than male members; those who are non-Saudis had about 1.6 times the odds of being carpoolers or vanpoolers. The positive association of female members was because females were prohibited from driving cars, so they commuted as groups with either a male member of the family or by having a private driver; even now, most females still rideshare, even after being allowed to drive, since most of the women cannot own cars, and they require a long period of time to learn how to drive. This finding is consistent with some previous studies investigating university populations [16,19,21], while it is inconsistent with others, e.g., [32,34,38,40]. However, some studies found that ridesharing results are similar for men and women [38]. Despite the popularity of ridesharing among women, they may be less likely to rideshare due to the fear of strangers and physical harm [76]. For instance, a study in Bangladesh found that as ridesharing services become more widespread, security concerns also increase, since many women commuters face problems related to reckless driving, bullying, threats, and robbery [77]. Almost all of the previous studies found foreign or immigrant commuters are more likely to rideshare than citizen commuters; this result is consistent with many of the previous study results, such as [21,32,36,37]. Non-Saudi commuters to campus are faculty members or international students, so they prefer not to own cars, since they have temporary accommodations and can commute with their friends or classmates who own cars. Despite ridesharing benefits for foreign students and faculty members, Sarriera et al. [76] stated that one of the major disadvantages of ridesharing is that many ridesharers harbored feelings of prejudice toward commuters of different classes and races; this, in turn, can discourage ridesharing practices.
One of the surprising results of the study is that the coefficient of car ownership was positive and statistically significant, presenting a higher probability of being a carpooler or vanpooler. A one-point increase in car ownership was associated with 1.15 times the odds of carpooling and vanpooling. This is the opposite of most of the literature findings, where most studies found ridesharing decreases as car ownership increases [21,33,48,78]. Almost 94% of the university members have a car, so this probably would not affect the ridesharing market, since the commuters may want to reduce VMT, GHG, and the cost of gasoline and maintenance; they may also want to increase convenience, social interaction, and productivity. Thus, it is a good opportunity to apply acquaintance-based carpooling. However, other factors associated with a higher rate of car ownership can affect ridesharing programs negatively. For example, some commuters prefer to commute in a quiet environment, avoid strangers or rude passengers, are worried about irresponsible drivers, or prefer more privacy, so they drive alone to campus; ridesharing programs might not be suitable for those commuters.
As expected, those who leave campus between 2 and 3 p.m. are more likely to rideshare than those who leave before 2 p.m.; those who leave after 2 p.m. are twice as likely to be ridesharers as those who leave campus before 2 p.m. This may result from the fact that fixed schedules can be a motivator to encourage commuters to carpool and vanpool. Many studies found fixed schedules have a major positive impact on ridesharing behavior [16,56,79]. Fixed student and worker schedules are among the most important factors for successful ridesharing, so that commuters can go to and leave the campus simultaneously. However, ridesharing takes a lot of freedom or flexibility away from ridesharers [80]. Since passengers commute together, they usually have to go and leave work at the same time, so it will be more difficult to do errands, leave work earlier, or go out for lunch because the passenger has to wait for other commuters [81].
Conversely, those who are staff, aged between 30 and 39 years, hold a master’s or Ph.D., or arrive at campus between 9 a.m. and 12 p.m. are significantly less likely to carpool or vanpool to campus. This indicates that those variables carry a negative OR. Being staff decreases the odd of carpooling or vanpooling by 41.2%. Staff members are less likely to rideshare compared to students. This difference may be because most university staff live in different districts located far from campus, so they cannot find a partner, and most of them own cars and are married. As stated in many studies, one major drawback of ridesharing is that rideshare crew should live nearby, or the driver might have a hard time finding carpoolers or vanpoolers. Finding ridesharers results in additional vehicle miles traveled and traffic congestion, leading to a rise in more GHG emissions and accidents [82]. In addition, the tardiness of a passenger can be another drawback of ridesharing; the unreliable passengers may cause problems for all ridesharers, since all of them will get to work or university campus late [83]. A longer commuting distance and waiting time involve more vehicle wear and tear and more fuel consumption, which usually ends up costing drivers more money; it is also difficult.
As stated in several of the previous studies, students are more likely to rideshare than other groups [19,21]. Being a university member aged 30 to 39 years decreases the odds of carpooling or vanpooling by 43.7%; in other words, those members are less likely to rideshare compared to members aged 16 to 19 years. This result is consistent with the findings of Gärling et al. [35] and Neoh et al. [16], where younger members have a higher probability of ridesharing than older commuters. However, irresponsible drivers can be a major problem negatively affecting ridesharing. The driver is responsible for his passengers, so he has to drive carefully in order to avoid accidents [83], and he has to make sure all passengers get to their destination on time to avoid being late [81].
In addition, coming to campus between 9 a.m. and 12 p.m., having a master’s degree, and holding a Ph.D. decreased the odds of carpooling or vanpooling by 53.5%, 59.5%, and 65.6%, respectively. In other words, respondents coming to campus between 9 a.m. and 12 p.m. were less likely to become ridesharers, compared to those who come to campus before 8 a.m. This probably means that the members had irregular schedules, including some students and faculty members; this is consistent with Akar et al.’s [56] findings that irregular schedules hinder ridesharing at universities. Meanwhile, respondents with a master’s degree or holding a Ph.D. are less likely to carpool or vanpool to campus than those who have a high school diploma. Many of the university population who have a master’s degree or hold a Ph.D. are faculty members or are professionally employed, so they have a higher income and thereby, are more likely to own a car, or they do not have a fixed schedule, resulting in reduced ridesharing since they did not find ridesharers who match their schedules. When the magnitudes of the two coefficients (a master’s degree or Ph.D.) are compared, respondents having a master’s degree play a stronger role. Moreover, some commuters refrain from ridesharing because they do not like their colleagues at work, or they are concerned about spreading diseases (e.g., viruses and colds).
However, being a faculty member was positively associated with the choice to carpool or vanpool; the odds of faculty members carpooling or vanpooling to campus were 1.85 times higher than for those who were students. In NU, faculty members most often come to the campus daily and have regular schedules. As stated by Tezcan [8], frequent campus commuters are more likely to share rides to campus. The higher coefficient and statistical significance of the coefficient for the variable may be an indicator of environmental, vehicle maintenance, and traffic congestion concerns, as well as the desire for social interaction and convenience. Shaheen and Rodier [33] reported that highly educated members were more likely to participate in ridesharing.
Other variables, including arriving to campus between 8 and 9 a.m., departing campus after 3 p.m., being aged 20 to 29 years or 40 to 59 years, and holding a diploma or bachelor’s degrees did not have a significant association with ridesharing plans. To conclude, the main factors that can affect the interest in the use of ridesharing include being female, being single, being a student, being foreign, having fixed class or work schedules, and showing a high rate of car ownership.

5. Conclusions

This research examined the ridesharing behavior of the population of a suburban university, Najran University, through the use of survey data. This research adds to the existing literature on commute trip reduction strategies, particularly on university campuses. The major results of this study show that many university members commute as groups, especially females and non-married members. Around 50% of the university population who were younger than 30 years old rideshared to the campus, and many of them were students. As the education level increases, rideshare interest decreases; however, staff in general are less likely to rideshare than students and faculty members. Fixed schedules have a major positive impact on ridesharing behavior. A higher likelihood of using ridesharing is in line with higher sustainability. In other words, as the interest in the use ridesharing increases, the numbers of vehicles on the roads and VMT will decrease, resulting in a lower level of pollution and CO2 emissions associated with vehicle use. Even though ridesharing programs have countless benefits, they have downsides as well. There remains the issue of the distance between ridesharers’ residences; passengers who are willing to rideshare to a similar destination should live in proximity to each other; if they live in remote areas, it will result in additional VMT and traffic jams, which are associated with some negative impacts, such as increasing GHG emissions and accidents. This also increases the costs to drivers.
This research indicates that NU offers a niche market for ridesharing because of the presence of many motivators that facilitate applying rideshare-oriented strategies. These factors can reduce commuting alone to campus, thereby mitigate the issues related to traffic congestion, accidents, and pollution, while decreasing the need for parking spaces and saving on commuting costs. For example, a lack of public transportation in the city, fixed schedules for most university members, and the long distance to the campus are very important motivators that can be considered unique factors in encouraging the implementation of ridesharing policies. However, tardiness of one commuter can affect the entire ridesharing crew traveling in the same vehicle; they may all get to work late. Thus, implementing ridesharing programs requires that passengers to be responsible and reliable, or ridesharing programs can be quite annoying and may affect passengers negatively.
In addition, other major ridesharing motivators are that most of the university population are students who are low income, single, and from similar social backgrounds, and most of them know their potential partners. In addition, increased car ownership is associated positively with ridesharing; this can be a major motivation that can encourage the university population to apply acquaintance-based carpooling. Even though women now are allowed to drive, many of them still commute as groups with friends or coworkers, since they cannot own cars and they need more time to learn to drive; this is a great motivator to apply ridesharing programs. On the other hand, carpoolers and vanpoolers may commute with strangers (where some of them are rude, have mental issues, or may be racists), reckless drivers, sick passengers or drivers, and unpleasant coworkers or classmates, causing problems in the long run and thereby reducing the safety of shared mobility.
Recognizing unique factors affecting potential ridesharing at universities and large employers and knowing the variables that can be strong influencers in encouraging or discouraging the university population to rideshare will help transportation practitioners plan policies that improve ridesharing participation.
From a policy perspective, the university needs to adopt several useful interventions regarding ridesharing programs. The university should discourage solo driving trips to campus and incentivize ridesharing trips; thus, several policy implications can be based on the results. The university may carefully consider parking policies by providing parking incentives such as lower parking costs and priority parking for carpoolers and vanpoolers and adding parking fees for SOV trips, considering that these trips are now free, and in light of the fact that Najran University is a gated campus. The university also needs to coordinate with Najran Municipality to allocate some parcels as park and ride facilities, especially in wards with a greater number of commuters to the campus, and may also allocate special lanes for carpoolers and vanpoolers (HOV lanes). This action is easy to implement, especially given that Najran city is currently not ready for a public transportation system. In addition, the university needs to work on the negative effects or disutility of the implementation of ridesharing to discover solutions or alternative options for the successful integration of ridesharing.
Last but not least, utilitarian incentives do not guarantee a mode switch by commuters; if interventions are to be effective, their needs and goals must be understood by the commuters. For example, authorities need to explain the benefits of ridesharing in regards to reducing traffic accidents, congestion, carbon emissions, and commuting costs. This can be done through training courses or in classes.
Despite the previously discussed findings and concerns, future studies can be improved by collecting more information that is expected to be significant, such as information about income, traveling cost savings, environmental awareness, the reduction of congestion and pollution, and locating potential partners, moving away from variables found by most previous studies to have an insignificant impact on ridesharing decisions. Although our study compared ridesharers to those who commute alone to campus, future studies can include a parallel survey of members of another university or community college as a control or comparison group for this study. Control and comparison groups can help describe how ridesharing services are received and used across different groups. Furthermore, future studies should compare ridesharing patterns of women in this study, who were not yet allowed to drive, and those of the same women after being granted driving privileges. In addition, it would be interesting for further studies to develop some indicators for assessing the effectiveness of ridesharing programs in reducing the number of vehicles on the road, traffic congestion, and GHG emissions levels. Additional research should further explore the impact of the current ridesharing program on other modes of transportation (e.g., driving alone, walking, biking) and compare it to future studies after applying ridesharing policies. Finally, some future studies should focus on negative variables (disutility) that can affect the probability of implementing ridesharing programs in order to overcome barriers and discover solutions or alternative options.

Funding

This research was funded by [Deanship of Scientific Research at Najran University] grant number [NU/NRP/SERC/11/20] and the APC was funded by [the author].

Institutional Review Board Statement

The study was conducted in accordance with the Declaration of Helsinki, and approved by Ethics Committee of Najran University (protocol code 443-43-54684-DS and date of approval is 4-5-2020).

Informed Consent Statement

Informed consent was obtained from all subjects involved in the study.

Data Availability Statement

The data presented in this study are available on request from the corresponding author. The data are not publicly available due to privacy.

Acknowledgments

The authors are thankful to the Deanship of Scientific Research at Najran University for funding this work under the National Research Priorities funding program, grant code (NU/NRP/SERC/11/20).

Conflicts of Interest

The authors declare no conflict of interest.

References

  1. Meyer, I.; Kaniovski, S.; Scheffran, J. Scenarios for regional passenger car fleets and their CO2 emissions. Energy Policy 2012, 41, 66–74. [Google Scholar] [CrossRef]
  2. Aljoufie, M. Spatial analysis of the potential demand for public transport in the city of Jeddah, Saudi Arabia. WIT Trans. Built Environ. 2014, 138, 113–123. [Google Scholar] [CrossRef] [Green Version]
  3. Assi, K.; Gazder, U.; Al-Sghan, I.; Reza, I.; Almubarak, A. A Nested Ensemble Approach with ANNs to Investigate the Effect of Socioeconomic Attributes on Active Commuting of University Students. Int. J. Environ. Res. Public Health 2020, 17, 3549. [Google Scholar] [CrossRef] [PubMed]
  4. Rahman, S.M.; Khondaker, A.; Hasan, A.; Reza, I. Greenhouse gas emissions from road transportation in Saudi Arabia—A challenging frontier. Renew. Sustain. Energy Rev. 2017, 69, 812–821. [Google Scholar] [CrossRef]
  5. The General Authority for Statistics. Housing Survey. 2017. Available online: https://www.stats.gov.sa/sites/default/files/housing_survey2017_ar_0.pdf (accessed on 10 January 2021).
  6. International Energy Agency. World CO2 Emissions from Fuel Combustion, Paris. 2019. Available online: https://www.iea.org/data-and-statistics/charts/world-co2-emissions-from-fuel-combustion-by-fuel-1971-2019 (accessed on 18 December 2021).
  7. Dehghanmongabadi, A.; Hoşkara, Ş. Challenges of Promoting Sustainable Mobility on University Campuses: The Case of Eastern Mediterranean University. Sustainability 2018, 10, 4842. [Google Scholar] [CrossRef] [Green Version]
  8. Tezcan, H.O. Potential of Carpooling among Unfamiliar Users: Case of Undergraduate Students at Istanbul Technical University. J. Urban Plan. Dev. 2016, 142, 04015006. [Google Scholar] [CrossRef]
  9. UN Habitat III. Urban Services and Technology; UN: Quito, Ecuador, 2016. [Google Scholar]
  10. Federal Highway Administration. Summary of Travel Trends—2009 National Household Travel Survey. Available online: http://nhts.ornl.gov/2009/pub/stt.pdf (accessed on 18 December 2021).
  11. European Environment Agency. Occupancy Rates of Passenger Vehicles. 2010. Available online: http://www.eea.europa.eu/data-and-maps/indicators/occupancy-rates-of-passenger-vehicles/occupancy-rates-of-passenger-vehicles-1 (accessed on 10 January 2021).
  12. Dua, R. Commentary Estimating the Size and Efficiency of the Saudi Vehicle Fleet; Kapsarc: Riyadh, Saudi Arabia, 2020. [Google Scholar]
  13. Department of Transport. National Travel Survey: 2012, London. 2013. Available online: https://assets.publishing.service.gov.uk/government/uploads/system/uploads/attachment_data/file/243957/nts2012-01.pdf (accessed on 10 January 2021).
  14. McKenzie, B.; Rapino, M. Commuting in the United States: 2009. Available online: https://www2.census.gov/library/publications/2011/acs/acs-15.pdf (accessed on 10 January 2021).
  15. Al-Fouzan, S. The main characteristics of work trips in Ar-Riyadh city. Dirasat 2010, 37, 122–136. [Google Scholar]
  16. Neoh, J.G.; Chipulu, M.; Marshall, A. What encourages people to carpool? An evaluation of factors with meta-analysis. Transportation 2015, 44, 423–447. [Google Scholar] [CrossRef]
  17. Garrison, W.; Wellar, B.; MacKinnon, R.; Black, W.; Getis, A. Increasing the flexibility of legacy systems. Int. J. Appl. Geospatial Res. 2011, 2, 39–55. [Google Scholar] [CrossRef]
  18. Gärling, T.; Steg, L. Threats from Car Traffic to the Quality of Urban Life: Problems, Causes, and Solutions; Elsevier: Amsterdam, The Netherlands, 2007. [Google Scholar]
  19. Zhou, J. An analysis of university employee car-sharers in Los Angeles. Transp. Res. Part D Transp. Environ. 2012, 17, 588–591. [Google Scholar] [CrossRef]
  20. Transportation Research Board. Car-Sharing: Where and How It Succeeds; Transportation Research Board: Washington, DC, USA, 2005. [Google Scholar] [CrossRef]
  21. Zheng, J.; Scott, M.; Rodriguez, M.; Sierzchula, W.; Platz, D.; Guo, J.Y.; Adams, T.M. Carsharing in a University Community. Transp. Res. Rec. J. Transp. Res. Board 2009, 2110, 18–26. [Google Scholar] [CrossRef]
  22. Zhou, J.; Wang, Y.; Schweitzer, L. Jobs/housing balance and employer-based travel demand management program returns to scale: Evidence from Los Angeles. Transp. Policy 2012, 20, 22–35. [Google Scholar] [CrossRef]
  23. Setiawan, R. Reducing car use through carpool program. In International Civil Engineering Conference Towards Sustainable Civil Engineering Practice; Universitas Kristen Petra Surabaya: Surabaya, Indonesia, 2006; pp. 139–146. [Google Scholar]
  24. Najran Municipality. Preparing the Local and Detailed Plan for Najran City; Najran Municipality: Najran, Saudi Arabia, 2019.
  25. AlQuhtani, S. Commuting Mode Choice of Suburban University Population and Potential Sustainable Transportation Systems: The Case of Najran University. J. Urban Plan. Dev. 2022, 148, 05022001. [Google Scholar] [CrossRef]
  26. Vanoutrive, T.; Van De Vijver, E.; Van Malderen, L.; Jourquin, B.; Thomas, I.; Verhetsel, A.; Witlox, F. What determines carpooling to workplaces in Belgium: Location, organisation, or promotion? J. Transp. Geogr. 2012, 22, 77–86. [Google Scholar] [CrossRef] [Green Version]
  27. U.S. Department of Transportation. Ride Sharing Programs. 2015. Available online: https://www.transportation.gov/mission/health/ride-sharing-programs (accessed on 1 August 2021).
  28. Victoria Transport Policy Institute. 2018. Available online: https://www.vtpi.org/tdm/tdm34.htm (accessed on 1 August 2021).
  29. Shaheen, S.; Cohen, A.; Bayen, A. The benefits of carpooling. UC Berkely Transp. Sustain. Res. Cent. 2018, 1–32. [Google Scholar] [CrossRef]
  30. Handke, V.; Jonuschat, H. Flexible Ridesharing: New Opportunities and Service Concepts for Sustainable Mobility; Springer: Berlin/Heidelberg, Germany, 2013; Volume 9783642113. [Google Scholar]
  31. Kaufman, S. Why People (Don’t) Carpool and Change for the Better: A Social Capital Framework for Investigating Environmental Behaviour; RMIT: Melbourne, VIC, Australia, 2002. [Google Scholar]
  32. Cervero, R.; Tsai, Y.-H. City CarShare in San Francisco, California: Second-Year Travel Demand and Car Ownership Impacts. Transp. Res. Rec. J. Transp. Res. Board 2004, 1887, 117–127. [Google Scholar] [CrossRef]
  33. Shaheen, S.; Rodier, C. Travel Effects of a Suburban Commuter Carsharing Service: CarLink Case Study. Transp. Res. Rec. J. Transp. Res. Board 2005, 1927, 182–188. [Google Scholar] [CrossRef]
  34. Ferguson, E. Demographics of carpooling. Transp. Res. Rec. 1995, 1496, 142–150. [Google Scholar]
  35. Gärling, T.; Gärling, A.; Johansson, A. Household choices of car-use reduction measures. Transp. Res. Part A Policy Pract. 2000, 34, 309–320. [Google Scholar] [CrossRef]
  36. Blumenberg, E.; Smart, M. Getting by with a little help from my friends…and family: Immigrants and carpooling. Transportation 2010, 37, 429–446. [Google Scholar] [CrossRef] [Green Version]
  37. Cline, M.; Sparks, C.; Eschbach, K. Understanding Carpool Use by Hispanics in Texas. Transp. Res. Rec. J. Transp. Res. Board 2009, 2118, 39–46. [Google Scholar] [CrossRef]
  38. Buehler, R. Determinants of transport mode choice: A comparison of Germany and the USA. J. Transp. Geogr. 2011, 19, 644–657. [Google Scholar] [CrossRef]
  39. SDeLoach, S.B.; Tiemann, T.K. Not driving alone? American commuting in the twenty-first century. Transportation 2011, 39, 521–537. [Google Scholar] [CrossRef]
  40. Shaheen, S. Dynamics in Behavioral Adaptation to a Transportation Innovation: A Case Study of Carlink–A Smart Carsharing System. Inst. Transp. Stud. 1999, 1–473. Available online: http://escholarship.org/uc/item/87n6958h#page-2 (accessed on 1 August 2021).
  41. Eriksson, L.; Friman, M.; Gärling, T. Stated reasons for reducing work-commute by car. Transp. Res. Part F Traffic Psychol. Behav. 2008, 11, 427–433. [Google Scholar] [CrossRef]
  42. Concas, S.; Winters, P.L.; Wambalaba, F.W. Fare Pricing Elasticity, Subsidies, and Demand for Vanpool Services. Transp. Res. Rec. J. Transp. Res. Board 2005, 1924, 215–223. [Google Scholar] [CrossRef]
  43. Canning, P.; Hughes, S.; Hellawell, E.; Gatersleben, B.; Fairhead, C. Reasons for participating in formal employer-led carpool schemes as perceived by their users. Transp. Plan. Technol. 2010, 33, 733–745. [Google Scholar] [CrossRef]
  44. Charles, K.K.; Kline, P. Relational Costs and the Production of Social Capital: Evidence from Carpooling. Econ. J. 2006, 116, 581–604. [Google Scholar] [CrossRef] [Green Version]
  45. Cohen, A.; Shaheen, S. Planning for Shared Mobility. 2016. Available online: https://www.planning.org/publications/report/9107556/ (accessed on 1 August 2021).
  46. Park, A.; Clery, E.; Curtice, J.; Philips, M. British Social Attitudes: The 29th Report; NatCen Social Research: London, UK, 2012; Available online: www.bsa-29.natcen.ac.uk (accessed on 1 August 2021).
  47. U.S. Department of Transportation. Transportation’s Role in Reducing U.S. Greenhouse Gas Emissions; U.S. Department of Transportation: Washington, DC, USA, 2010.
  48. Zhou, B.; Kockelman, K.M. Opportunities for and Impacts of Carsharing: A Survey of the Austin, Texas Market. Int. J. Sustain. Transp. 2011, 5, 135–152. [Google Scholar] [CrossRef] [Green Version]
  49. Ferguson, E.; Hodge, K.; Berkovsky, K. Psychological benefits from vanpooling and group composition. Transportation 1994, 21, 47–69. [Google Scholar] [CrossRef]
  50. Cherry, C.; Pidgeon, N. Is sharing the solution? Exploring public acceptability of the sharing economy. J. Clean. Prod. 2018, 195, 939–948. [Google Scholar] [CrossRef]
  51. Gardner, B.; Abraham, C. What drives car use? A grounded theory analysis of commuters’ reasons for driving. Transp. Res. Part F Traffic Psychol. Behav. 2007, 10, 187–200. [Google Scholar] [CrossRef]
  52. Morency, C. The ambivalence of ridesharing. Transportation 2007, 34, 239–253. [Google Scholar] [CrossRef]
  53. Kaplowitz, S.A.; Slabosky, A. Trying to Increase Carpooling at a Major U.S. University: A Survey and an Intervention. Sustainability 2018, 11, 74–80. [Google Scholar] [CrossRef] [Green Version]
  54. Ozanne, L.; Mollenkopf, D. Understanding Consumer Intentions To Carpool: A Test of Alternative Models; New Zealand Marketing Academy: Wellington, New Zealand, 1999. [Google Scholar]
  55. Correia, G.; Viegas, J.M. Carpooling and carpool clubs: Clarifying concepts and assessing value enhancement possibilities through a Stated Preference web survey in Lisbon, Portugal. Transp. Res. Part A Policy Pract. 2011, 45, 81–90. [Google Scholar] [CrossRef]
  56. Akar, G.; Flynn, C.; Namgung, M. Travel Choices and Links to Transportation Demand Management. Transp. Res. Rec. J. Transp. Res. Board 2012, 2319, 77–85. [Google Scholar] [CrossRef]
  57. Zhou, J. Study of Employee Carsharing on the University Campus. J. Urban Plan. Dev. 2013, 139, 301–310. [Google Scholar] [CrossRef]
  58. Khattak, A.; Wang, X.; Son, S.; Agnello, P. Travel by University Students in Virginia. Transp. Res. Rec. J. Transp. Res. Board 2011, 2255, 137–145. [Google Scholar] [CrossRef]
  59. Chan, N.D.; Shaheen, S.A. Ridesharing in North America: Past, Present, and Future. Transp. Rev. 2012, 32, 93–112. [Google Scholar] [CrossRef]
  60. Schmitt, A. Five Ways Colleges Are Coaxing Students Out of Their Cars, Streetsblog USA; Streetsblog USA: New York, NY, USA, 2014; p. 2. [Google Scholar]
  61. Stasko, T.H.; Buck, A.B.; Gao, H.O. Carsharing in a university setting: Impacts on vehicle ownership, parking demand, and mobility in Ithaca, NY. Transp. Policy 2013, 30, 262–268. [Google Scholar] [CrossRef]
  62. Collura, J. Evaluating Ride?Sharing Programs: Massachusetts’ Experience. J. Urban Plan. Dev. 1994, 120, 28–47. [Google Scholar] [CrossRef]
  63. Kalina, R.N.; Soltys, K.; Bui, R.; Habel, C.; Lanyon, R. Catching a ride on the information super-highway: Toward an understanding of internet-based carpool formation and use. Transportation 2010, 37, 849–873. [Google Scholar] [CrossRef]
  64. Habib, K.M.N.; Tian, Y.; Zaman, H. Modelling commuting mode choice with explicit consideration of carpool in the choice set formation. Transportation 2011, 38, 587–604. [Google Scholar] [CrossRef]
  65. Rye, T. Employer attitudes to employer transport plans: A comparison of UK and Dutch experience. Transp. Policy 1999, 6, 183–196. [Google Scholar] [CrossRef]
  66. Menczer, F.T.A.W.B. Guaranteed Ride Home Programs: A Study of Program Characteristics, Utilization, and Cost. J. Public Transp. 2007, 10, 131–149. [Google Scholar] [CrossRef]
  67. Kingham, S.; Dickinson, J.; Copsey, S. Travelling to work: Will people move out of their cars. Transp. Policy 2001, 8, 151–160. [Google Scholar] [CrossRef]
  68. Meyer, M.D. Demand management as an element of transportation policy: Using carrots and sticks to influence travel behavior. Transp. Res. Part A: Policy Pr. 1999, 33, 575–599. [Google Scholar] [CrossRef]
  69. DShoup, D.C. Evaluating the effects of cashing out employer-paid parking: Eight case studies. Transp. Policy 1997, 4, 201–216. [Google Scholar] [CrossRef] [Green Version]
  70. Ziemke, P.; McCarthy, J.E. The control of mRNA stability in Escherichia coli: Manipulation of the degradation pathway of the polycistronic atp mRNA. Biochim. Biophys. Acta Gene Struct. Expr. 1992, 1130, 297–306. [Google Scholar] [CrossRef]
  71. Shaheen, S.; Cohen, A.; Roberts, J. Carsharing in North America: Market Growth, Current Developments, and Future Potential. Transp. Res. Rec. J. Transp. Res. Board 2006, 1986, 116–124. [Google Scholar] [CrossRef]
  72. National Academies of Sciences, Engineering and Medicine. Traveler Response to Transportation System Changes Handbook, 3rd ed.; Vanpools and Buspools; The National Academies Press: Washington, DC, USA, 2005; Chapter 5. [Google Scholar]
  73. Najran University. Annual Report 2017–2018; Najran University: Najran, Saudi Arabia, 2018. [Google Scholar]
  74. Sisiopiku, V.; Ramadan, O. Understanding Travel Behavior and Mode Choice of Urban University Campus Employees; Department of Civil, Construction, and Environmental Engineering University of Alabama at Birmingham: Birmingham, AL, USA, 2017. [Google Scholar]
  75. Train, K. Properties of discrete choice models. In Discrete Choice Methods with Simulation; Cambridge University Press: Cambridge, UK, 2010; pp. 15–37. [Google Scholar]
  76. Sarriera, J.M.; Álvarez, G.E.; Blynn, K.; Alesbury, A.; Scully, T.; Zhao, J. To Share or Not to Share. Transp. Res. Rec. J. Transp. Res. Board 2017, 2605, 109–117. [Google Scholar] [CrossRef] [Green Version]
  77. Cynthia, S.T.; Majumder, M.; Tabassum, A.; Khanom, N.N.; Tuhin, R.A.; Das, A.K. Security concerns of ridesharing services in Bangladesh. In Proceedings of the ICAITI 2019—2nd International Conference on Applied Information Technology and Innovation: Exploring the Future Technology of Applied Information Technology and Innovation, Bali, Indonesia, 21–22 September 2019; pp. 44–50. [Google Scholar] [CrossRef]
  78. Erdogan, S.; Cirillo, C.; Tremblay, J.-M. Ridesharing as a Green Commute Alternative: A Campus Case Study. Int. J. Sustain. Transp. 2014, 9, 377–388. [Google Scholar] [CrossRef]
  79. Larsen, K.; Buliung, R.N.; Faulkner, G. Safety and School Travel. Transp. Res. Rec. J. Transp. Res. Board 2013, 2327, 9–18. [Google Scholar] [CrossRef]
  80. Ting, K.H.; Lee, L.S.; Pickl, S.; Seow, H.-V. Shared Mobility Problems: A Systematic Review on Types, Variants, Characteristics, and Solution Approaches. Appl. Sci. 2021, 11, 7996. [Google Scholar] [CrossRef]
  81. Regoli, N. 6 Advantages and Disadvantages of Carpooling; ConnectUs: Calgary, AB, Canada, 2016; p. 1. [Google Scholar]
  82. Roukouni, A.; Correia, G.H.D.A. Evaluation Methods for the Impacts of Shared Mobility: Classification and Critical Review. Sustainability 2020, 12, 10504. [Google Scholar] [CrossRef]
  83. Iagnemma, K. 24 Main Pros & Cons of Carpooling; Global Awareness UG: Munich, Germany, 2020. [Google Scholar]
Figure 1. Najran University Site Plan. Satellite image source: Esri, Maxar, GeoEye, Earthstar Geographics, CNES/Airbus DS, USDA, USGS, AeroGRID, IGN, and the GIS User Community.
Sustainability 14 04392 g001
Table 1. Descriptive Statistics for the Survey Sample.
Commuting AloneRidesharingNp-Value
Sample7224231145
Status (job) 0.000
Student304254558
Faculty15234186
Staff266135401
Nationality 0.052
Saudi548342890
Non-Saudi17481255
Gender 0.000
Male551116667
Female171 *307478
Age (years) 0.000
16–19434891
20–29309248557
30–3921862280
40–499946145
50–59501666
60 or more336
Marital status 0.000
Single330271601
Married392152544
Educational Qualification 0.000
High school254215469
Diploma572380
Bachelor’s15574229
Master’s9246138
Doctorate16465229
Arrival time to campus 0.000
Before 8 a.m.307229536
Between 8 and 9 a.m.353183536
Between 9 a.m. and 12 p.m.621173
Departing time from campus 0.000
Before 2 p.m.13395228
Between 2 and 3 p.m.387278665
After 3 p.m.20250252
Avg. car ownership1.602.09 0.000
Avg. distance to campus (km)3944.21 0.001
* They were driven alone with relative or private driver.
Table 2. Binary Logistic Regression Results for Najran University Commuters.
Intercept BExp(B)
Explanatory variables (categorical)
NationalitySaudi = 0
Non-Saudi = 10.485 *1.625
GenderMale = 0
Female = 11.960 ***7.101
Marital statusSingle = 0
Married = 1−0.2660.766
Explanatory variables (continuous or ordinal)
Distance to campus-0.0011.001
Car ownership-0.138 *1.148
Arrival time to campusBefore 8 a.m. = 0
Between 8 and 9 a.m. = 1−0.1950.823
Between 9 a.m. and 12 p.m. = 2−0.766 **0.465
Departure time from campusBefore 2 p.m. = 0
Between 2 and 3 p.m. = 10.682 ***1.977
After 3 p.m. = 20.0571.058
JobStudent = 0
Staff = 1−0.530 *0.588
Faculty = 20.616 **1.852
Age16–19 year = 0
20–29 year = 1−0.1240.884
30–39 year = 2−0.574 *0.563
40–49 year = 3−0.1890.828
50–59 year = 4−0.0720.931
60 or more = 51.398 **4.047
Educational qualificationHigh school = 0
Diploma = 1−0.2960.744
Bachelor’s = 2−0.2620.770
Master’s = 3−0.903 **0.405
Doctorate = 4−1.068 **0.344
N = 1145. Nagelkerke R2 = 0.553. * significant at the 0.10; ** significant at the 0.05 level; *** significant at the 0.01 level zero is the reference category.
Publisher’s Note: MDPI stays neutral with regard to jurisdictional claims in published maps and institutional affiliations.

