Article

Electrical and Mechanical Characteristics Assessment of Wind Turbine System Employing Acoustic Sensors and Matrix Converter

by
Thiyagarajan Rameshkumar
1,*,
Perumal Chandrasekar
1,
Raju Kannadasan
2,
Venkatraman Thiyagarajan
3,
Mohammed H. Alsharif
4 and
James Hyungkwan Kim
5,*
1
Department of Electrical and Electronics Engineering, Vel Tech Rangarajan Dr. Sagunthala R&D Institute of Science and Technology, Chennai 600062, India
2
Department of Electrical and Electronics Engineering, Sri Venkateswara College of Engineering, Sriperubudur 602117, India
3
Department of Electrical and Electronics Engineering, Sri Sivasubramaniya Nadar (SSN) College of Engineering, Chennai 603110, India
4
Department of Electrical Engineering, College of Electronics and Information Engineering, Sejong University, Seoul 05006, Korea
5
Lawrence Berkeley National Laboratory, 1 Cyclotron Road, Berkeley, CA 94720, USA
*
Authors to whom correspondence should be addressed.
Sustainability 2022, 14(8), 4404; https://doi.org/10.3390/su14084404
Submission received: 21 February 2022 / Revised: 1 April 2022 / Accepted: 4 April 2022 / Published: 7 April 2022
(This article belongs to the Section Energy Sustainability)

Abstract

:
Permanent magnet synchronous generator (PMSG)-based wind turbine systems have a wide range of applications, notably, for higher-rated wind energy conversion systems (WECS). A WECS involves integrating several components to generate electrical power effectively on a large scale due to the advanced wind turbine model. However, it offers several glitches during operation due to various factors, notably, mechanical and electrical stresses. This work focuses on evaluating the mechanical and electrical characteristics of the WECS using two individual schemes. Firstly, wind turbines were examined to assess the vibrational signatures of the drive train components for different wind speed profiles. To apply this need, acoustic sensors were employed that record the vibration signals. However, due to substantial environmental impacts, several noises are logged with the observed signal from sensors. Therefore, this work adapted the acoustic signal and empirical wavelet transform (EWT) to assess the vibration frequency and magnitude to avoid mechanical failures. Further, a matrix converter (MC) with input filters was employed to enhance the efficiency of the system with reduced harmonic contents injected into the grid. The simulated results reveal that the efficiency of the matrix converter with input filter attained a significant scale of about 95.75% and outperformed the other existing converting techniques. Moreover, the total harmonic distortion (THD) for voltage and current were examined and found to be at least about 8.24% and 3.16%, respectively. Furthermore, the frequency and magnitude of the vibration signals show a minimum scale for low wind speed profile and higher range for medium wind profile rather than higher wind profile. Consolidating these results from both mechanical and electrical characteristics, it can be perceived that the combination of these schemes improves the efficiency and quality of generated power with pre-estimation of mechanical failures using acoustic signal and EWT.

1. Introduction

1.1. Background

Due to continuous technological and population growth, the electricity demand is augmenting day by day, and this affects the environmental conditions significantly because of the higher proportion of the fossil-fuel-based power production adapted globally [1,2]. Notably, coal- and oil-based energy productions are worsening the situation, and it is essential to find a path to diminish their scales extensively at present and zero-scale in the future [3,4]. Globally, nations have perceived these concerns recently, and assessment has been carried out to increase renewable power generation rather than fossil fuel [5,6,7]. Several renewable sources are utilized around the globe, including wind, solar, hydro, and biomass. Among them, wind sources are employed significantly using wind energy conversion systems (WECS) and attract investors powerfully due to advanced technological feasibility (advanced-power electronic devices, turbines, and generators). Based on the WWEA report, the total installed capacity across the globe is about 600 GW as of 2018, which is just 6% of global demand [8]. Contemporarily, wind power generation was promoted by global nations and emphasized to install more wind farms with higher-rated power generation in the future. Consequently, wind farmhouse lucrativeness should be augmented by guaranteeing that turbines need to function at maximum capacity. However, appropriate operation and maintenance (O&M) is crucial for exploiting the wind farm investment revenues by adapting an advanced monitoring system and sophisticated converting schemes [9].

1.2. Need for Current Research

Based on the above inferences, it is imperative to sense abnormalities in the wind turbine by aiming for reduced downtime and improved availability using advanced condition monitoring. It is imperative to detect the abnormalities of the system to execute predictive (condition-based) maintenance on wind farm units [10,11,12,13,14]. Much evidence from the wind farm shows that the wind energy conversion scheme frequently affects premature turbine mechanism failures. This is due to the exposure of extremely inconstant punitive meteorological conditions. Additionally, this system requires a higher intensity of maintenance to warrant a safe, cost-effective, and stable energy harvest as it is commissioned at remote and inaccessible locations. Furthermore, the complexity of maintenance and operation happens due to continuous changes in loading conditions by means of time varying [15]. Due to advanced and higher-rated wind turbines, several mechanical stresses occur in the overall system and its output. Furthermore, nature’s unpredictable and fluctuating wind behavior offers several issues in the WECS [16]. Several schemes are adapted to assess the turbine’s condition; however, vibrational measurement is one of the supreme consistent methods because the vibrational frequency and its magnitude measurement are significant parameters to evaluate mechanical stress and fatigue of the mechanisms [17]. The mechanical characteristics play a significant role, and must be monitored intensively using sophisticated schemes and managed to maintain the vibration production of the system within the optimal level [18,19].
Further, recent massive industrial growth has augmented with the widespread application of regulated speed drives, digital computers, and microprocessor-based electronic loads. This exacerbates the power quality issue, specifically, at the distribution side of the grid. The presence of harmonic content and voltage fluctuation becomes more harmful to the power grid; it also causes severe losses in the system with unstable grid behavior. For instance, the immense dissemination of switched power loads in low-voltage networks raises a huge concern by means of power quality [20,21,22,23]. Furthermore, the recent penetration of distributed generation using renewable sources still worsens the power quality due to their continuous variable feed to the grid. Owing to this, both transmission and distribution networks become vulnerable to power-quality discrepancy. Significantly, wind turbines are highly variable energy sources that cause severe problems to the existing grids. To solve these concerns, the researchers introduce various converting topologies; however, harmonic content and efficiency of the overall system still need noticeable improvement. Therefore, this requires effective converting topologies to manage higher evacuated power from the WECS that should meet the grid code of the utility with the least total harmonic distortion (THD) with higher efficiency [9].

1.3. Existing Works Done

Considering the above backgrounds, this work aimed to study the existing works already demonstrated by the researchers relating to converting techniques and vibrational assessments. Therefore, a robust literature survey was carried out and is illustrated in Table 1.
Consolidating the inferences and limitations of the literature report, it can be perceived that the power-quality concerns and efficiency of the converting techniques need a sophisticated model. Furthermore, evaluation of mechanical stress needs further investigation to warrant the reliable operation of the WECS.

1.4. Objectives

The converting techniques studied from the literature survey show limited assessment. Based on the inferences from the literature report, there are research gaps in condition monitoring of wind turbine systems, notably, vibration analysis and converting techniques for power evacuation into the grid. Therefore, this work aims to execute the following objectives to improve the overall performance of the WECS both mechanically and electrically:
  • To measure the frequency of the vibration signal extracted from acoustic sensors using empirical wavelet transform.
  • To assess the magnitude of the vibration of WECS for various wind speed profiles.
  • To improve the efficiency of the converter employed for WECS.
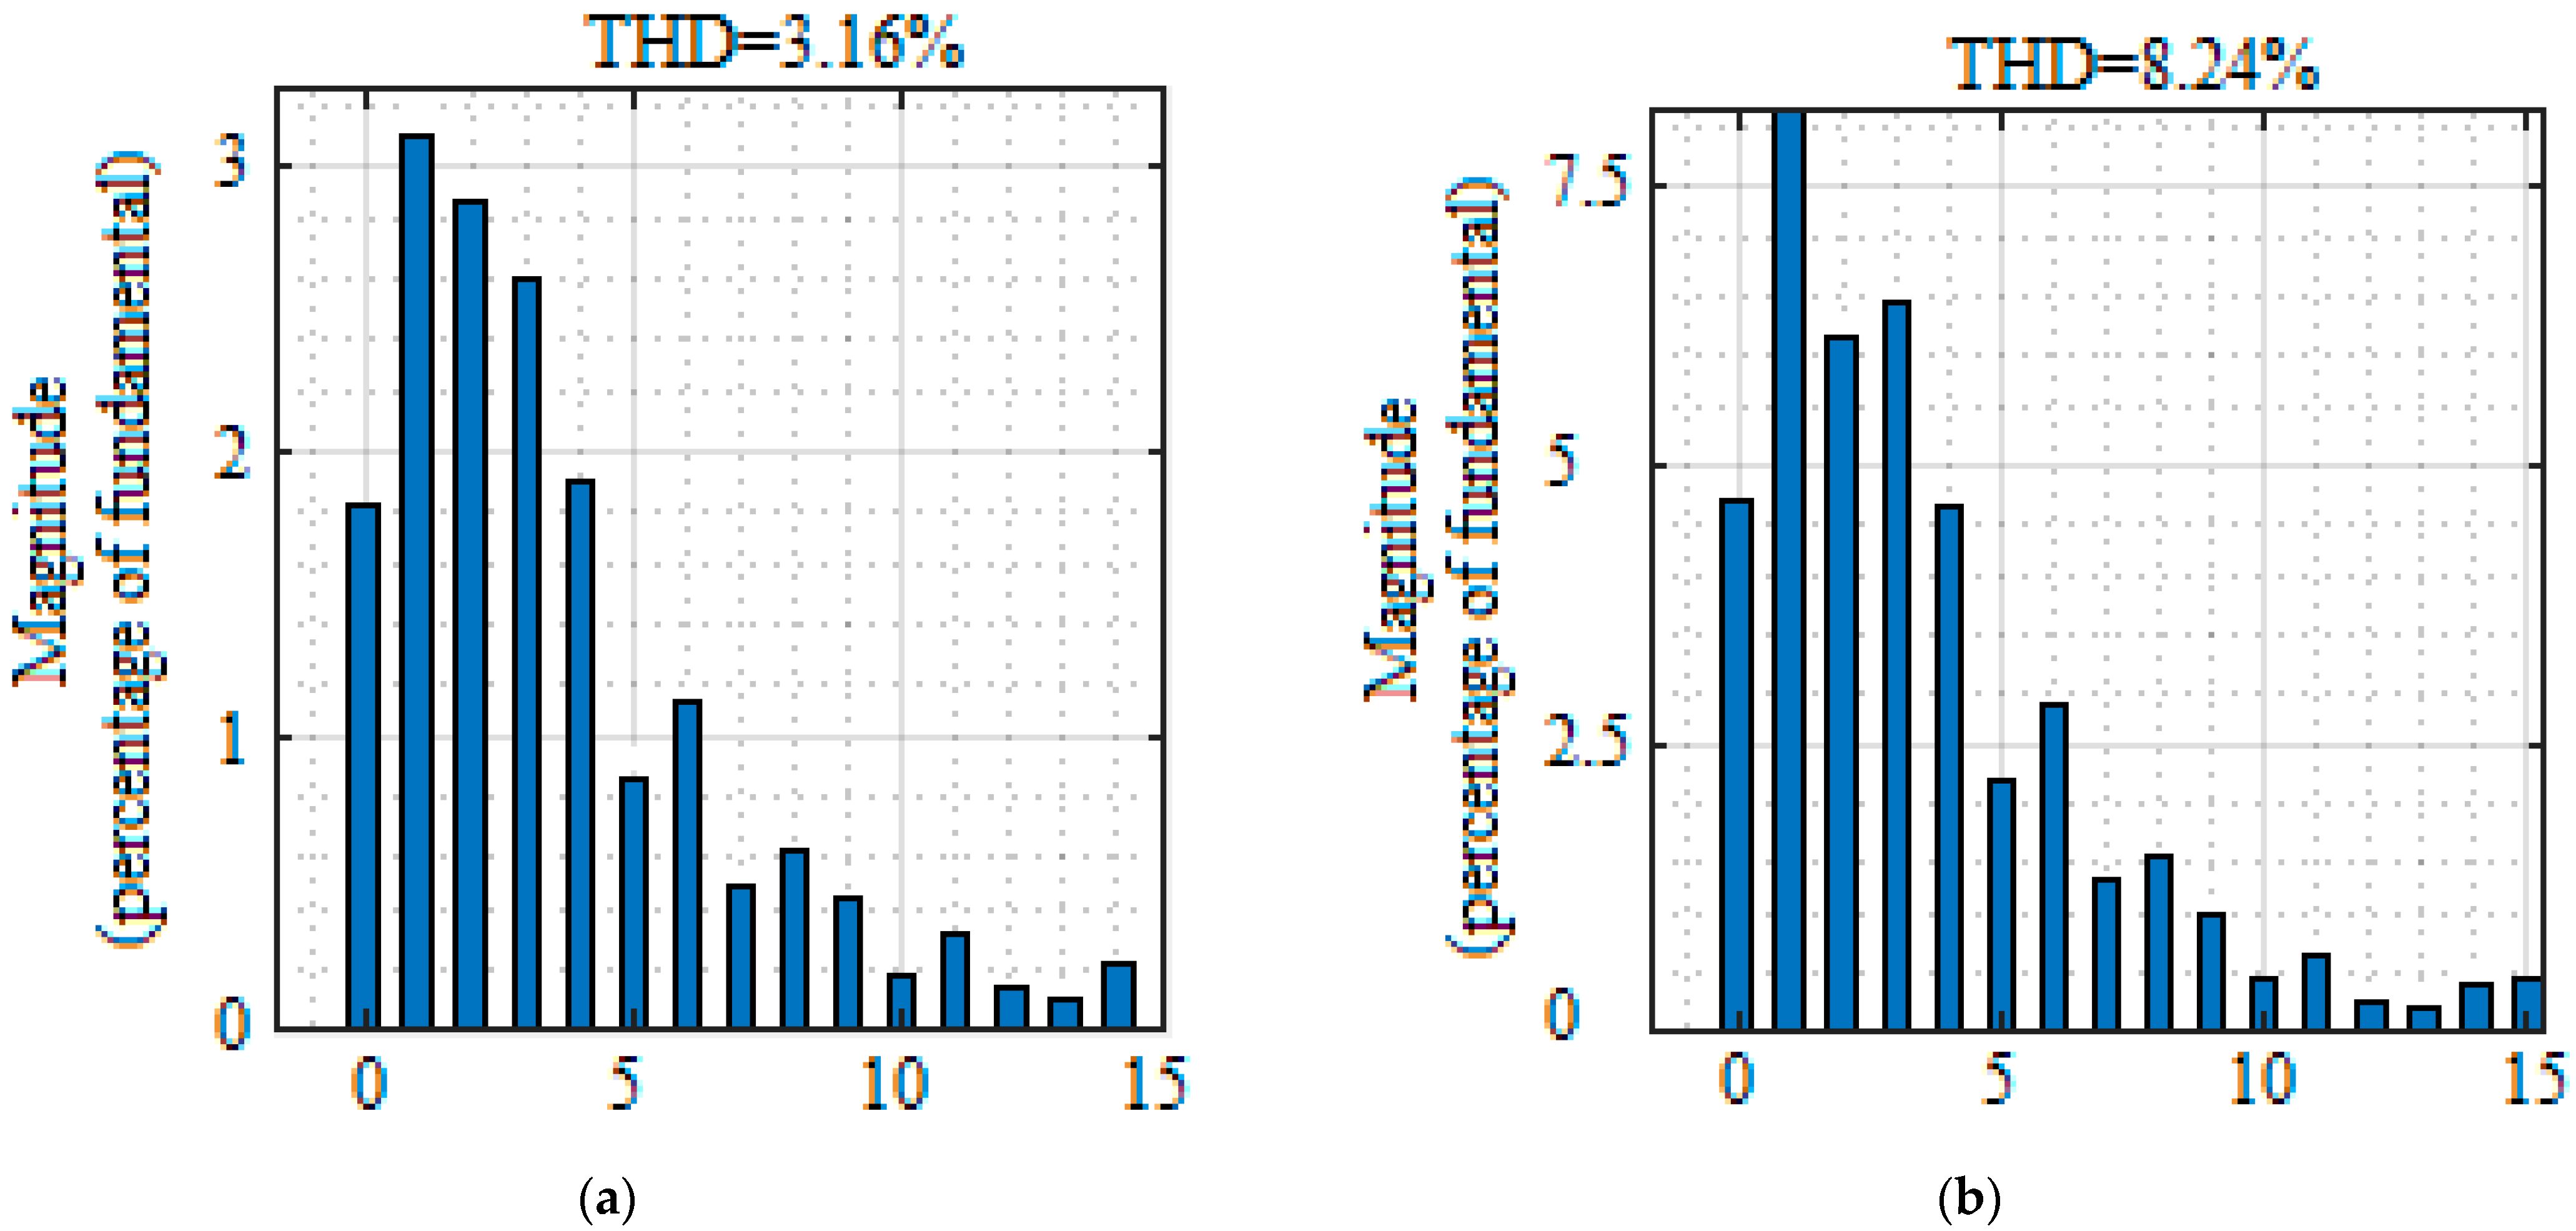
  • To reduce the THD of both voltage and current components to ensure the power quality of the generated power by WECS.

1.5. Organization of the Work

The rest of the article is organized as follows. Section 2 illustrates the modeling of the wind energy conversion system, which involves a wind turbine and permanent magnet synchronous generator; Section 3 demonstrates the proposed methodology, consisting of vibration analysis using empirical wavelet transform and a matrix converter with input filter; Section 4 describes the results and discussion of the considered system using the proposed methodology; Section 5 concludes the work based on the attained results.

2. Modelling of WECS

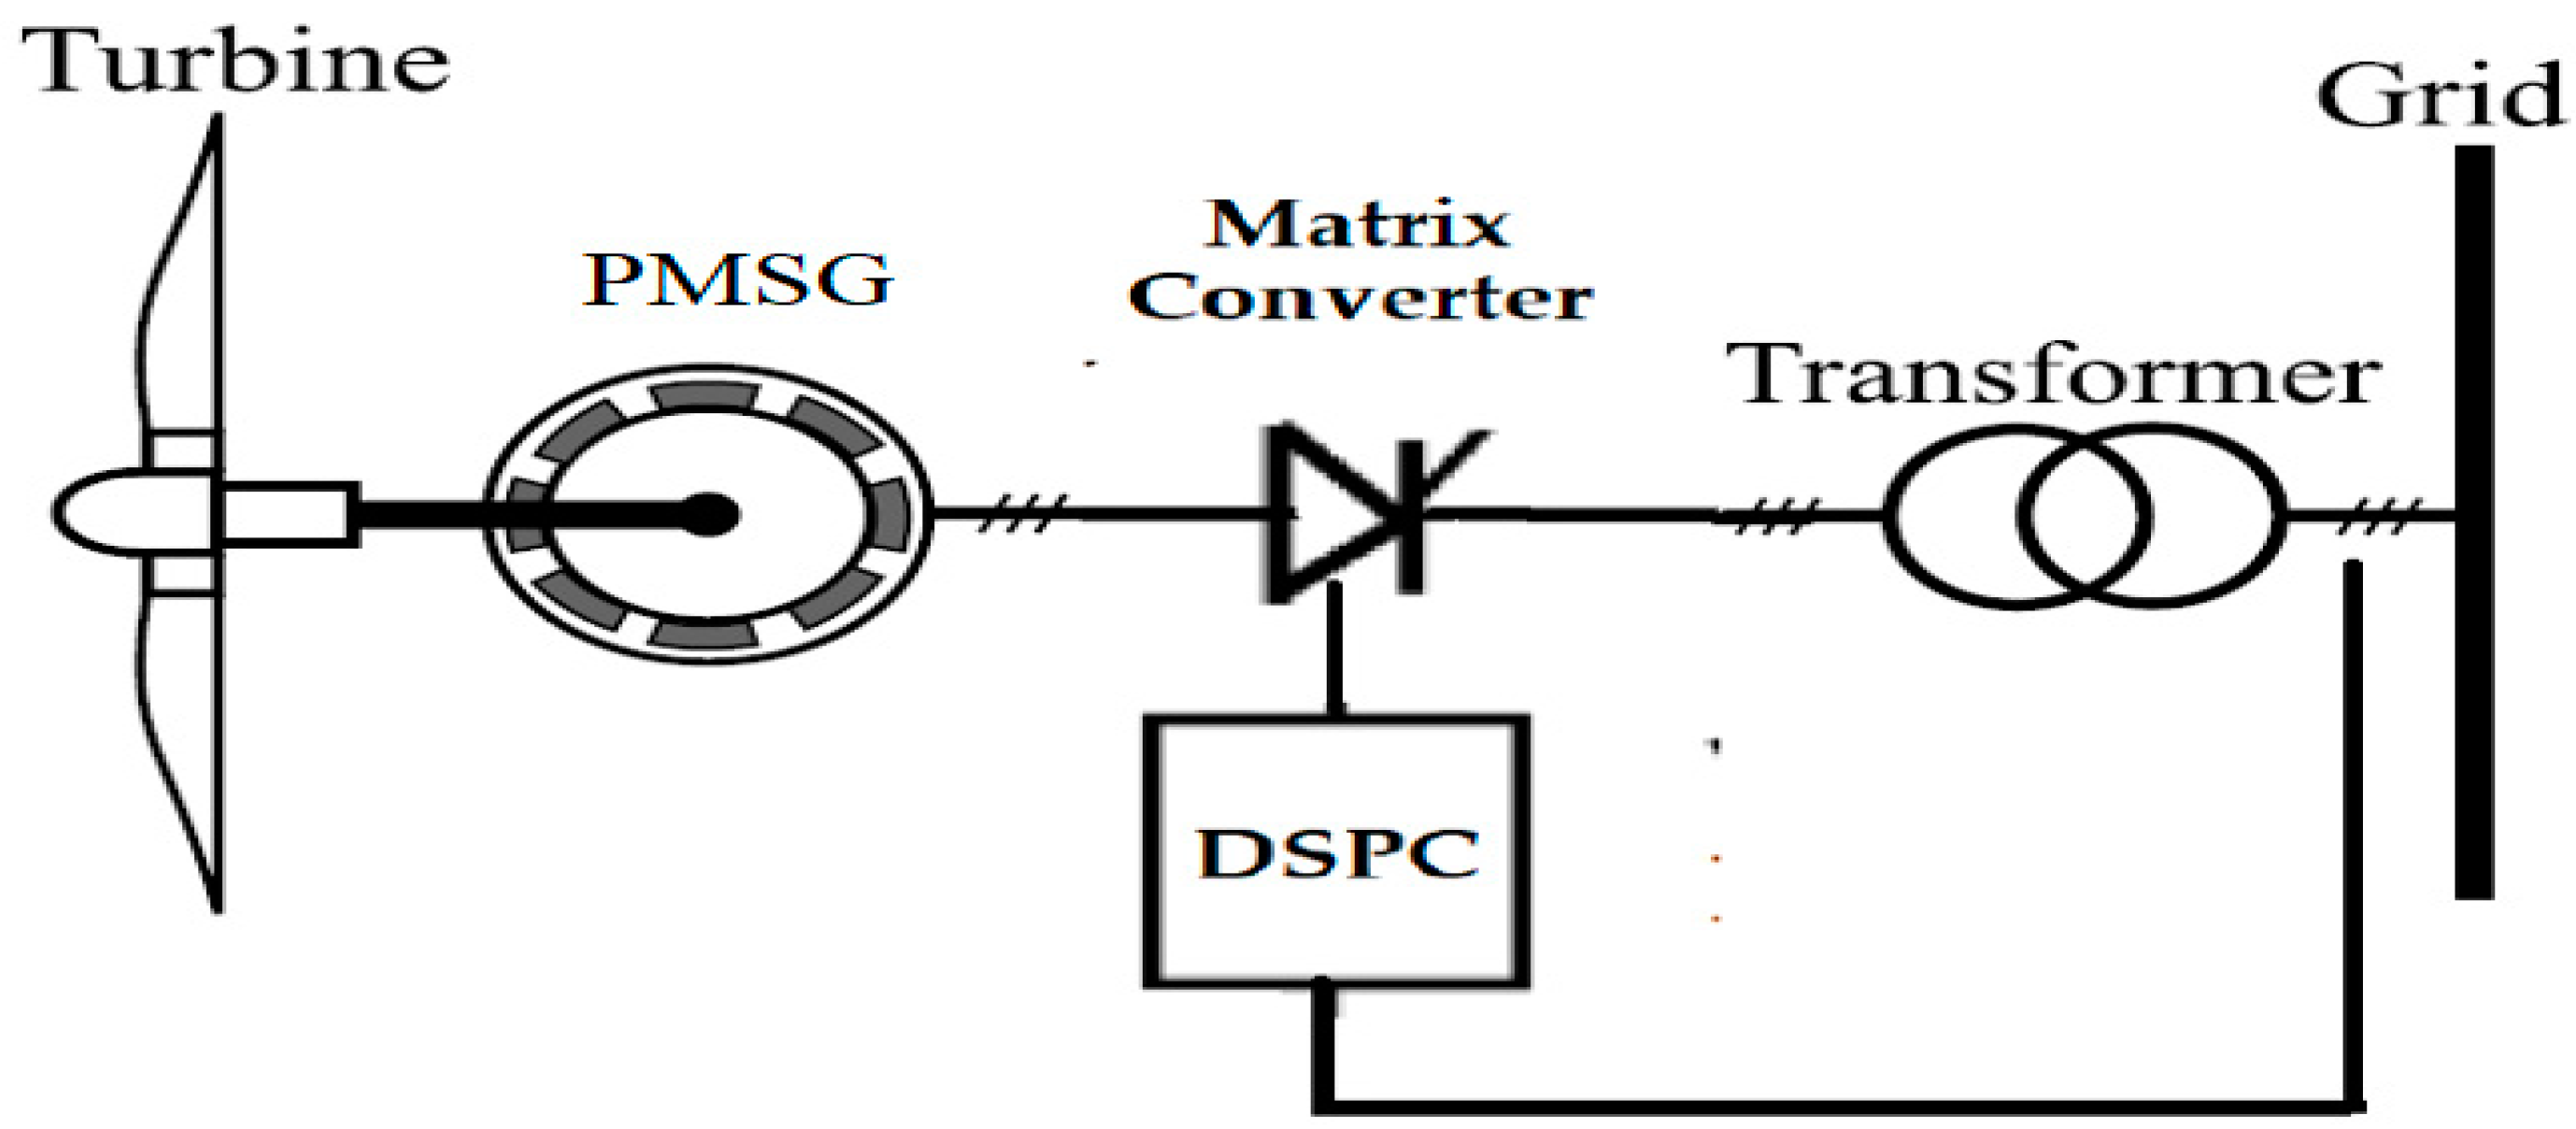
2.1. Wind Turbine Configuration with PMSG

A wind energy conversion system comprises several components such as turbine, generator, converter, controller, transformer, and grid [38]. The integrated arrangement of the complete system is illustrated in Figure 1. The primary process begins with generating torque by the wind turbine utilizing the wind. Then, the generated torque is transported to the generator rotor through the shaft, and the generator generates electrical torque. The generated electrical energy is fed into the three-phase converting system, which pulses the electrical quantity through control schemes and energizes the power transformer tied with the grid system. To attain the optimum control scheme for the converting element, a digital signal processing system is used.

2.2. Wind Turbine Model

The primary function of a WT is to convert wind energy to mechanical energy. The fundamental relationship to computing the mechanical power (Pm) of the aerodynamic wind turbine power is derived as follows:
P m = 0.5 × ρ × A × u 3 × C p ( λ × β )
Then, the power coefficient (λ, β) can be evaluated using the below equation:
C p ( λ × β ) = 0.22 ( 116 λ 0.4 × β 5 ) × ( 12.5 γ )
1 γ = 1 λ 0.089 0.035 β 3 + 1
Tip-speed ratio (λ) of the system is defined as the ratio of wind and rotor speed, and derived as follows:
λ = R × ω u
Mechanical torque (Tm) on the shaft can be computed using the below equation.
T m = P m ω
where: ρ denotes the air density,
  • A = π × R2 represents the turbine’s blade swept,
  • V is the speed of the wind,
  • (λ, β) signifies the power coefficient of the turbine,
  • λ is the tip speed ratio,
  • β terms the pitch angle,
  • ω denotes the blades angular velocity,
  • R defines the rotor radius.
Based on these formulas, it can be concluded that the wind’s velocity can generate mechanical torque according to the wind characteristics. It is evident that the role of power coefficient is essential for wind energy conversion systems, and the sample plot for a wind turbine power coefficient (0.8) is presented for better understanding in Figure 2.

2.3. PMSG Modeling

PMSG is modeled using dq coordinates in a virtual platform, and there are no AC-states for the developed model. It is modeled using DC parameters, for instance, voltages and currents in a rotor-fixed revolving coordinate arrangement. The fundamental derivations to evaluate the d -axis and q -axis currents are described in the below equations:
d i s d d t = R s a L s d i s d + ω s L s q L s d i s q + 1 L s d u s d
d i s q d t = R s a L s q i s q ω s ( L s d L s q i s d + 1 L s q φ p ) + 1 L s q u s q
Then, the electromagnetic torque generated form the rotor is derived as follows:
T e = 1.5 P 2 [ φ p i s q + i s d i s q ( L s d L s q ) ]
where: i s d is the d-axis current,
  • i s q is the q-axis current,
  • u s d is the d-axis voltage,
  • u s q is the q-axis voltage,
  • ω s is the angular frequency (electrical) of the generator,
  • L s d is the d-axis inductance of generator,
  • L s q is the q-axis inductance of generator,
  • φ p denotes the permanent flux,
  • R s a represents the stator resistance,
  • P indicates the number of poles.
The complete parameter description of the WECS considered for this study is illustrated in Table 2.

3. Proposed Methodology

This section illustrates two different approaches; the first scheme describes a method to evaluate the vibration magnitude of the wind turbine system and the other approach provides a detailed description of the converter modeling to enhance the electrical parameter of the WECS. The complete description of the proposed model is shown in Figure 3.

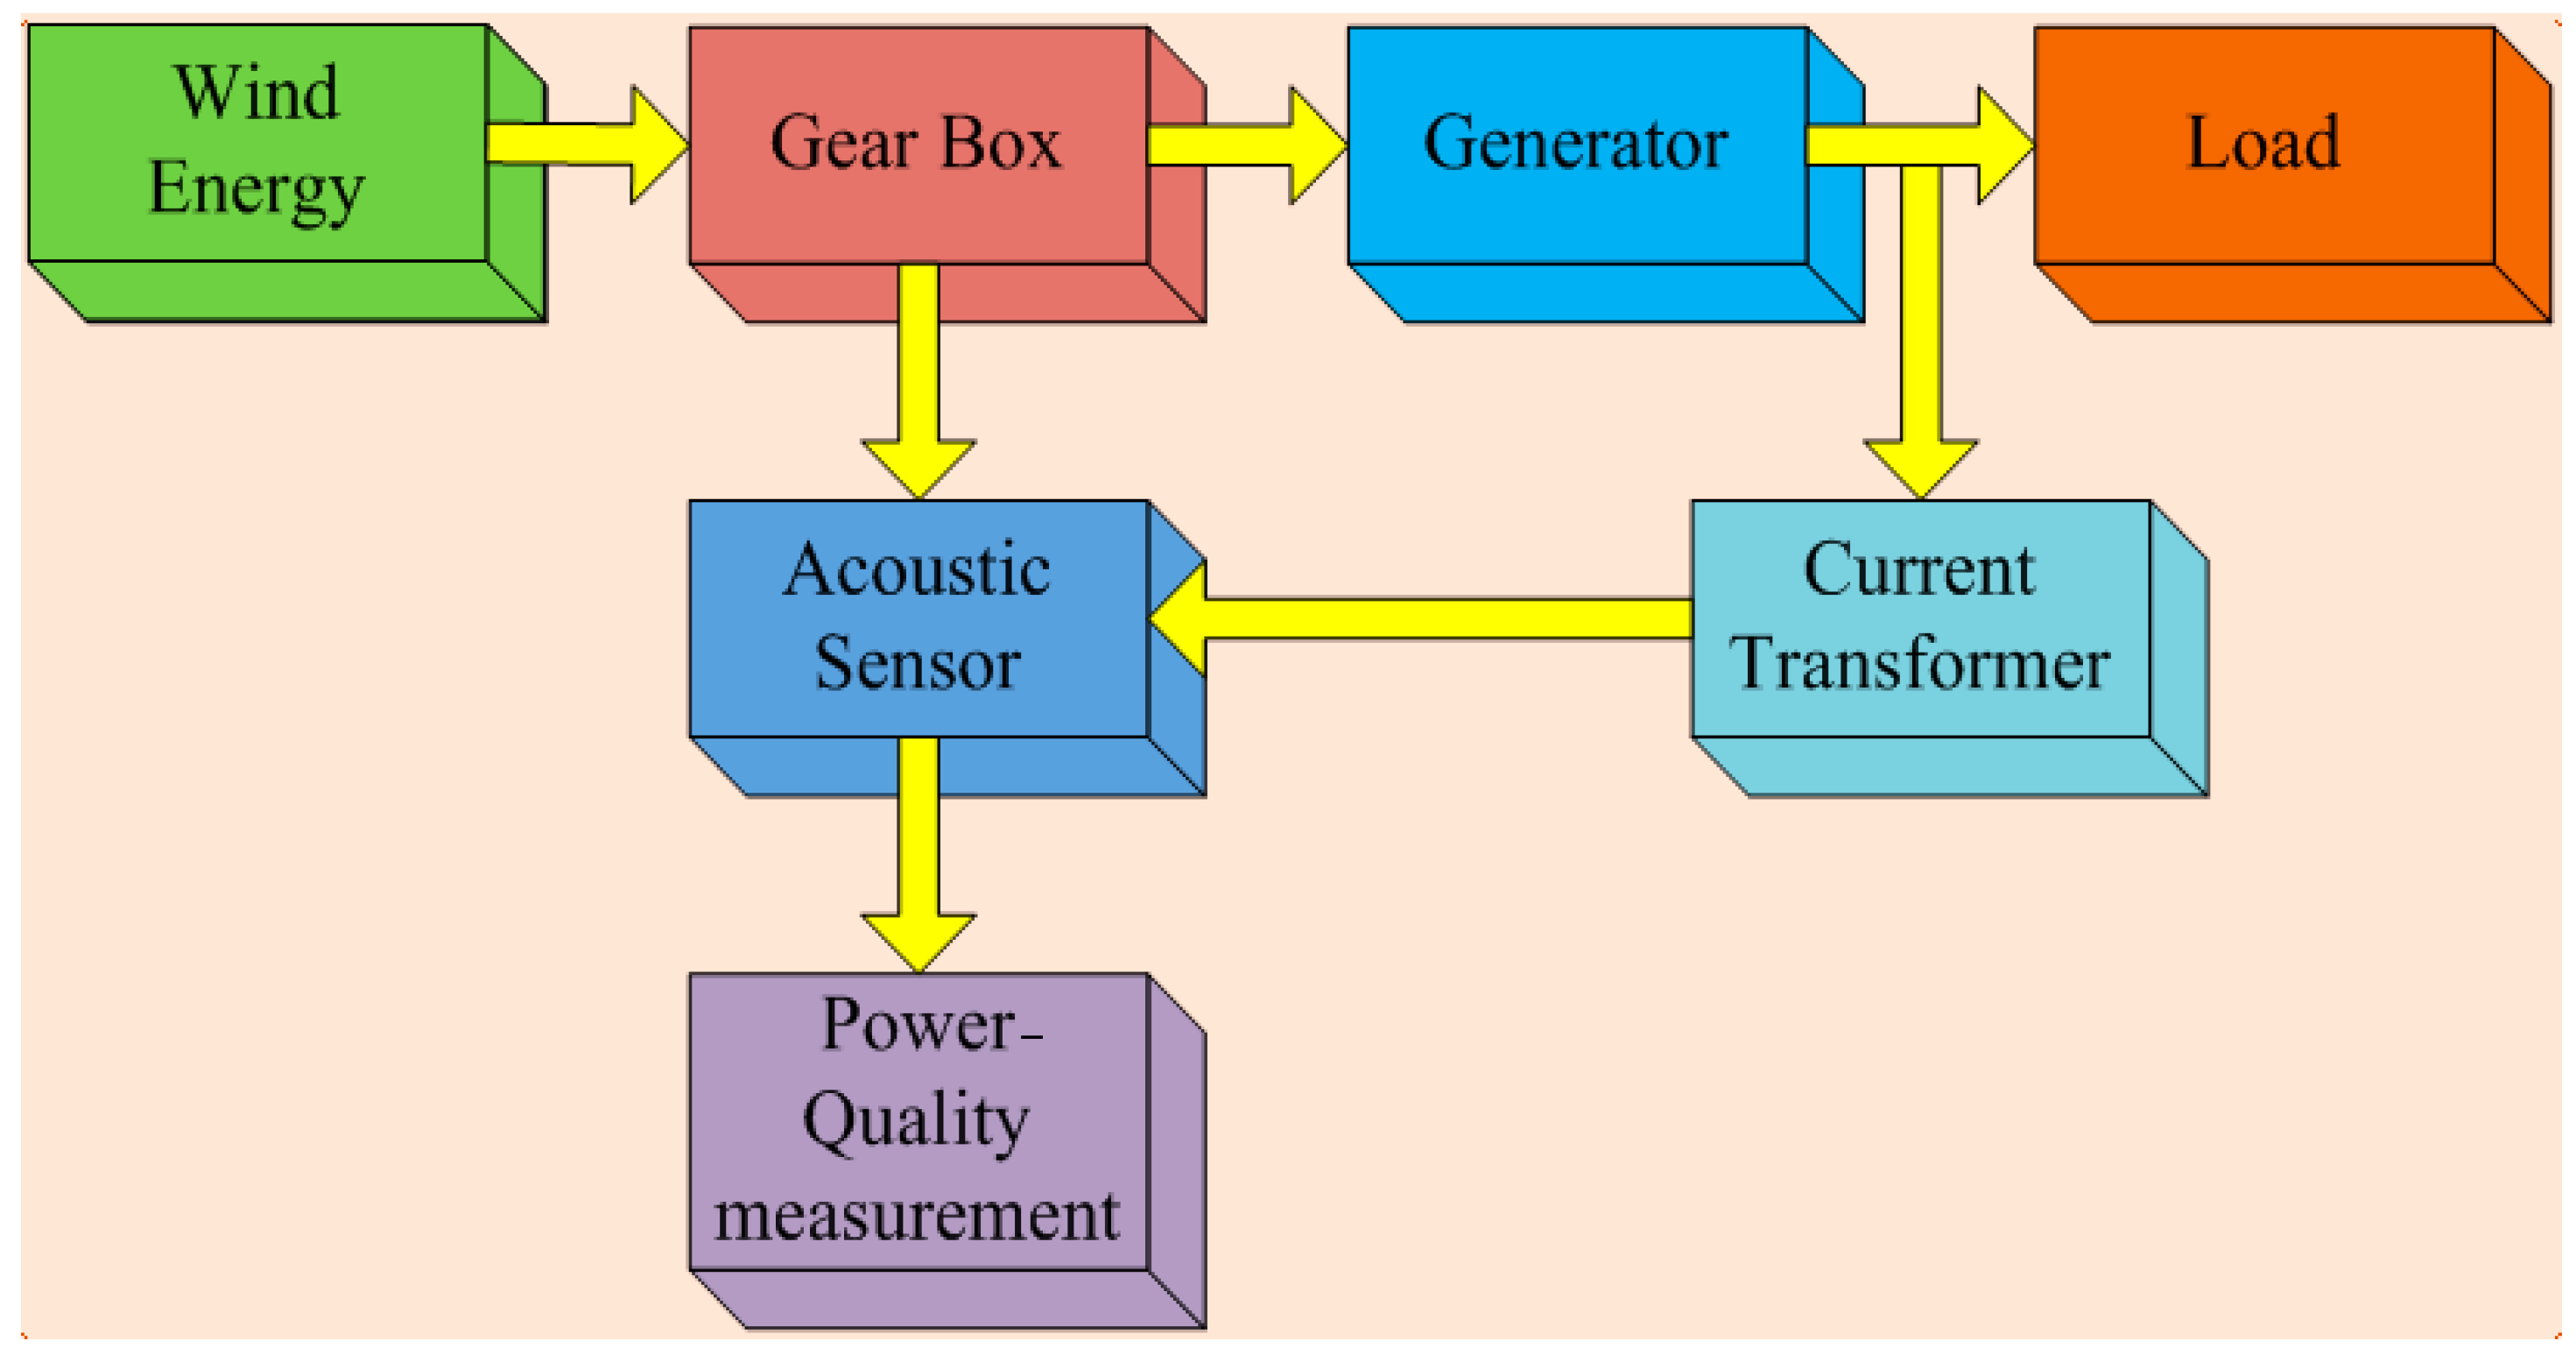
3.1. Vibration Analysis Model

Faults in the WECS can be identified at earlier stages by observing the operational settings of the turbine system unceasingly; the occurrence of substantial deviations in the system helps for pragmatic maintenance. Several analyses can be carried out, such as vibration evaluation, acoustic emission analysis, and oil and temperature monitoring. Among these evaluations, vibration analysis is a vital part in the condition monitoring system of the WECS. It is an effective evaluation due to its direct measurement of machine dynamics and helps to diagnose the faults incurred in the system. The possible reasons for vibration generation in WECS are the surface wear and misalignments of rotating parts. The complete evaluation process to estimate the vibration is illustrated in Figure 4.
It is known that the recent advancements in sensors allow generation of more reliable data acquisition. For WECS, acoustic sensors are installed on the WT drive train that computes the vibration signal. It is an electronic component, and it could measure the vibration signals through sound levels produced by the generator. It can be mounted over the surface of a material/generator. During the operating time, if the sensor observes variations in the features of the traveling path, it generates the amplitude and/or velocity of the signals. Then, this observed feature is transformed into an output signal employing transducers. These deviations are supervised by assessing the frequency/phase features of the acoustic sensor.

3.1.1. Empirical Wavelet Transform

The empirical wavelet transforms the process algorithm to evaluate the vibration using acoustic sensors. The following steps are essential to assess the vibration of the WECS:
Step 1: Find out the frequency instruments of the input signal using FFT.
Step 2: Segmentation needs to be carried out for different modes by Fourier signal.
Step 3: Employ scaling and wavelet functions matching each detected region.
Further, it is essential to perform segmentation of the Fourier spectrum, and it offers better adaptability to the considered signal. For instance, frequency (fs) samples the discrete signal x (k). Then, it employs the FFT and accepts the frequency band, regulates the set of maxima (M = {Mi} i = 1, 2, …,), and decreases their associated frequency (ωi).
Again, maxima are matched with a set of frequencies (ω = {ωi} i = 1, 2, …, M) and accept the boundaries Ωn of all distinct sections as the midpoint of two consecutive maxima.
Ω i = ω i + ω i + 1 2
where ωn+1 signifies the frequencies; M represents the number of frequency instruments presented in the actual signal; Ωn denotes the matching boundary and the respective set is Ω = {Ωi} i = 1, 2, …, M−1.
The derivation for Fourier transform for the empirical wavelets and scaling function is:
φ ( ω ) = { 1 i f ( 1 + γ ) Ω i | ω | ( 1 γ ) Ω i + 1 c o s ( π 2 β ( γ , Ω i + 1 ) ) i f ( 1 γ ) Ω i + 1 | ω | ( 1 + γ ) Ω i + 1 s i n ( π 2 β ( γ , Ω i ) ) i f ( 1 γ ) Ω i | ω | ( 1 + γ ) Ω i 0 o t h e r w i s e }
and
Ø ( ω ) = { 1 i f | ω | ( 1 γ ) Ω i c o s ( π 2 β ( γ , Ω i ) ) i f ( 1 γ ) Ω i | ω | ( 1 + γ ) Ω i 0 o t h e r w i s e }
β ( γ , i ) = β ( 1 2 γ i ( [ ω ] ) ( 1 γ ) i )
where γ is an overlap between the two back-to-back transitions areas and (x) is an arbitrary function and derived as follows:
β ( γ , i ) = { 0 i f   x 0 1 i f   x 0 β ( x ) + β ( 1 x ) = 1 i f   x ε [ 0 , 1 ] }
The estimated coefficients of wavelet transform are taken by the internal product of the applied signal (x), with the empirical scaling function as follows:
W x ( 1 , t ) = x , 1 =   x   ( τ ) 1 ( τ t ) d τ
W x ( i , t ) = x , φ i =   x   ( τ ) φ i ( τ t ) d τ

3.1.2. Acoustic Recording Modes

Recording schemes are required to observe the regular and anomalous situations of the WECS. This arrangement covers a wide range of data, from hundreds of samples per cycle to several minutes. To perform these functions, the signal’s waveform needs to be sampled. These recording schemes are arranged in various types using acoustic sensors with recording feasibility that can monitor a variety of faults or power quality. Two vital classifications are transient and speed-disturbance recording.
Transient signal recording:
̶
Records voltage and current samples recognized from sampling rate to the acoustic sensor.
̶
The typical sampling level is 128 samples/cycle. This mode is generally utilized for the verification of transient signal analysis.
̶
It can also trigger low-and high-speed disturbance with different operating settings.
Speed-disturbance recording:
̶
Low-, medium-, and high-speed disturbance recording can be carried out on the complete system in this recording scheme.
̶
The observed results are updated every quarter of a cycle or one cycle.
̶
The user could sample the recorded disturbances through maximum, minimum, and average values.

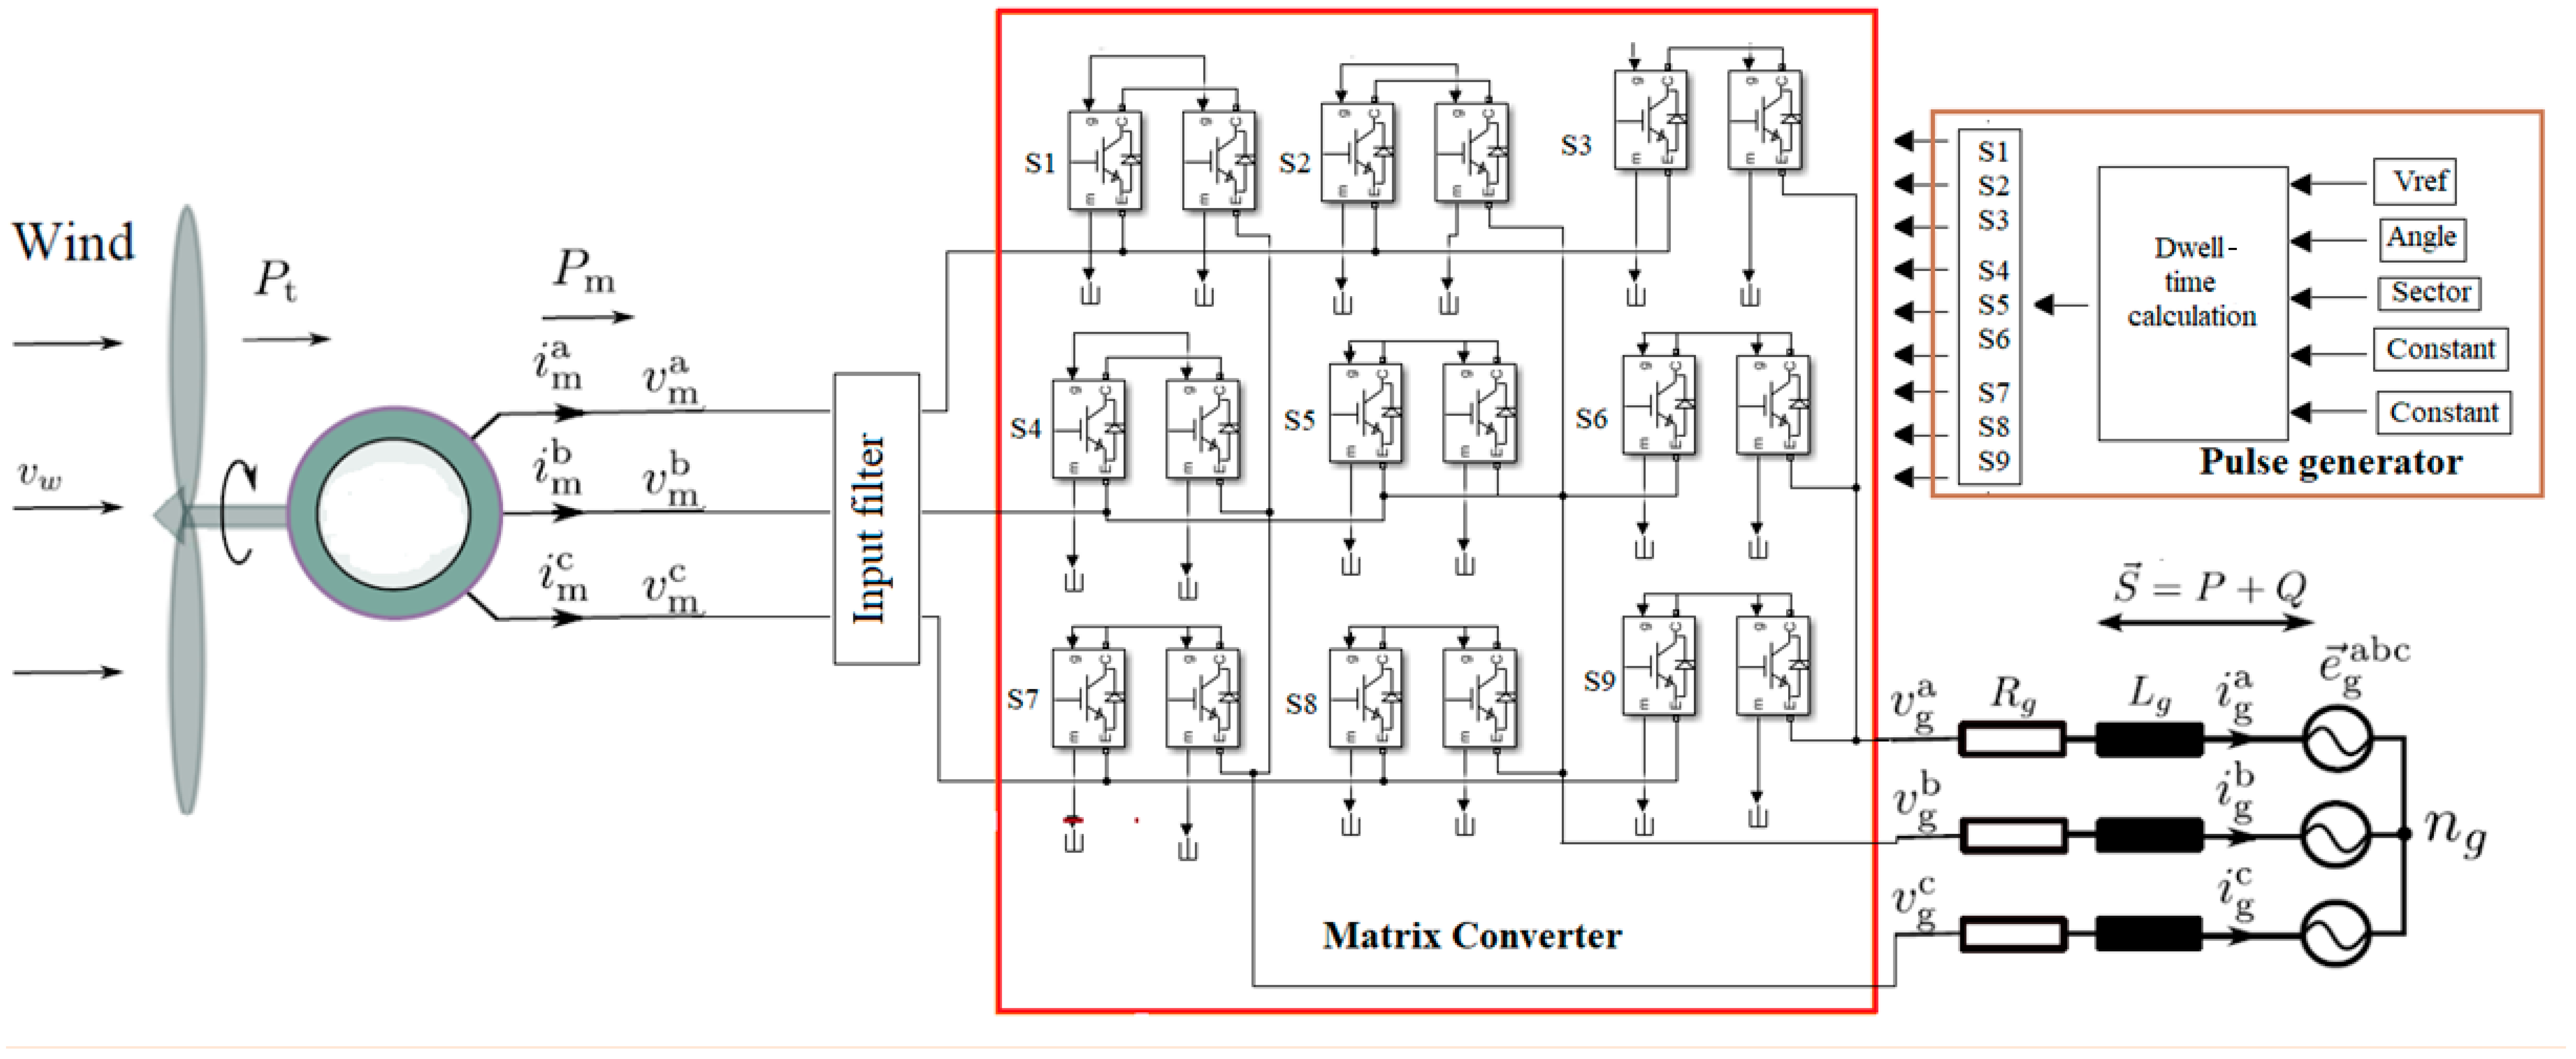
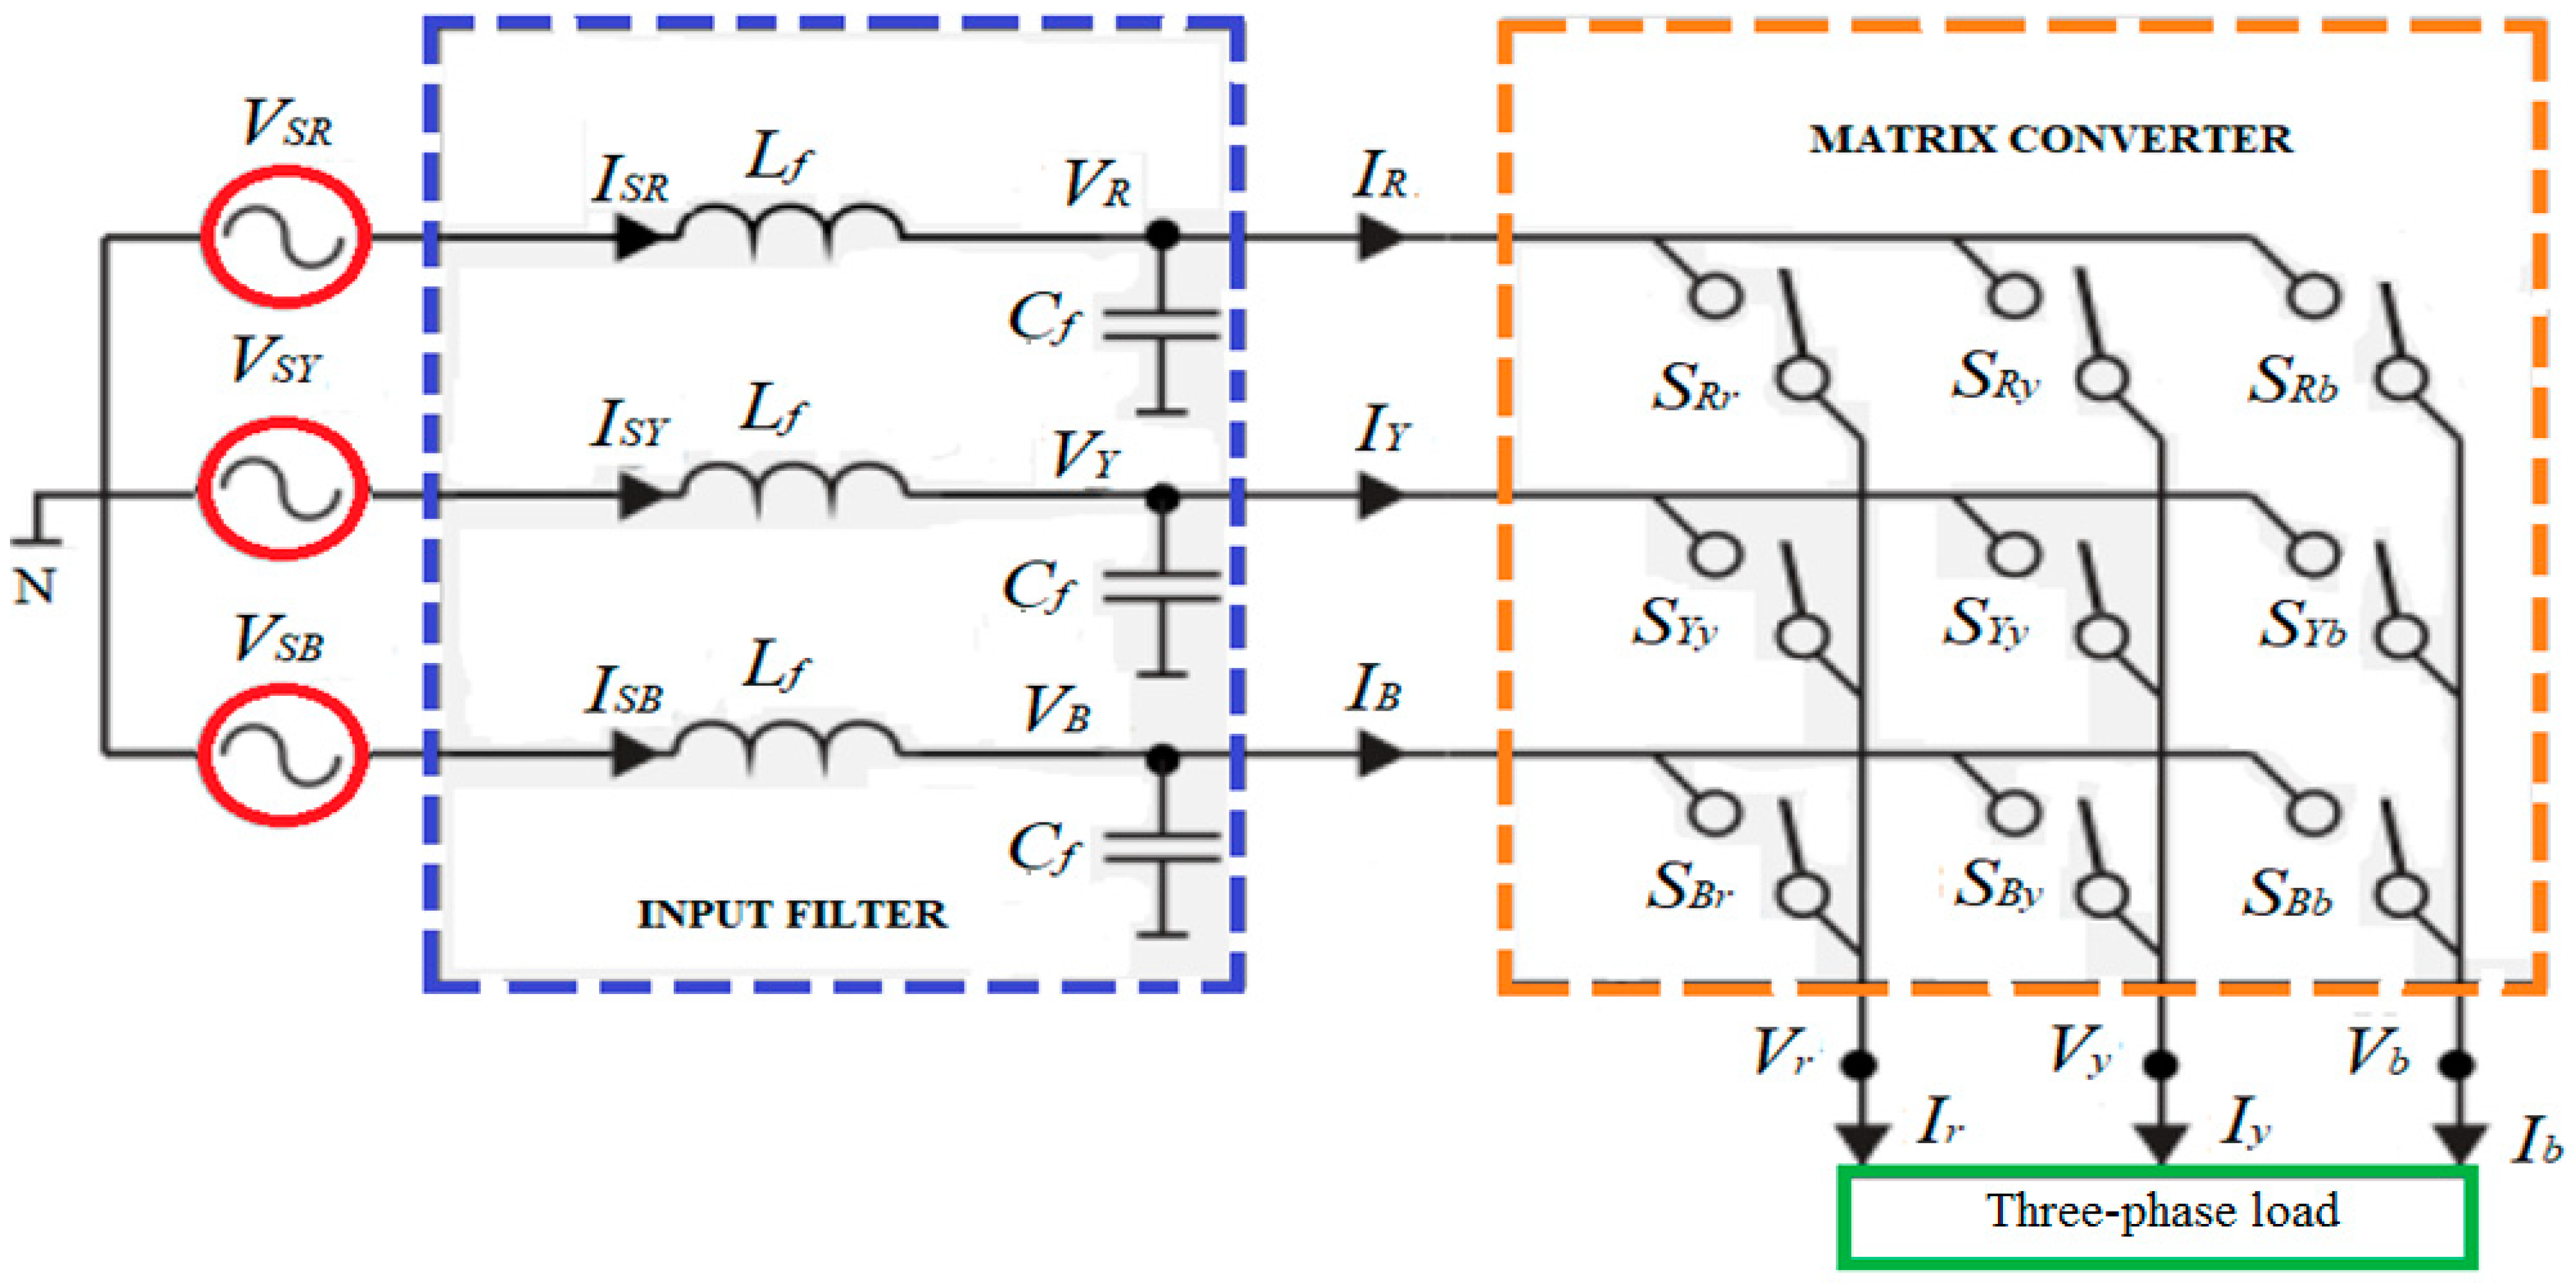
3.2. Proposed Matrix Converter

A matrix converter with an input filter circuit incorporated with WECS delivers power to the grid through a power transformer. The comprehensive sketch of the recommended matrix converter and input filter is presented in Figure 5. It injects alternating voltage and current to the grid, and they can be computed using the expression mentioned below [39]:
V 0 = [ V r V y V b ] = [ S R r S Y r S B r S R y S Y y S B y S R b S Y b S B b ]   ×   [ V R V Y V B ] = S × V i
I i = [ I R I Y I B ] = [ S R r S R y S R b S Y r S Y y S Y b S B r S B y S Y b ]   ×   [ I r I y I b ] = S T × I 0
where ST denotes a transpose of matrix S, and states of each bidirectional switch are represented as Sab (x indicates R, Y, and B and y denotes a state r, y, and b) that can be derived as follows:
S a b = { 0               i f             S a b           i s           o p e n 1               i f             S a b           i s           c l o s e
This converter is designed with a space vector modulation (SVM) control algorithm; it characterizes the three-phase voltage and current on the vector plane. Then, the state of different switches is provided for every output phase that can be fed as an input to the stage. Significantly, to restrict abnormal operations, namely, open and short circuits, twenty-seven switching states are permissible using the above functions. Different combinations are considered with three clusters depending on the output phases involving the corresponding input phases.
SVM parameters decide the output of the matrix converter, notably, instantaneous current and voltage, and input phase angle ( i ) and output phase angle ( 0 ). Furthermore, the desired output voltage and frequency scale associated with the converter hinge on the duty period for each switching operation. The switching times associated with two-phase angles are computed based on the following equations:
δ 1 + = 2 3 T s q sin ( α 0 + π 6 ) sin ( π 3 α i )
δ 3 = 2 3 T s q sin ( α 0 + π 6 ) sin ( α i )
δ 4 = 2 3 T s q sin ( π 6 α 0 ) sin ( π 3 α i )
δ 6 + = 2 3 T s q sin ( π 6 α 0 ) sin ( α i )
δ 1 + + δ 3 + δ 4 + δ 6 +     T s
Further, the MC input current and the output voltage are estimated using the below equations.
V 0 = 2 3 ( V r + a · V y + a 2 · V b ) = V 0   m a x · e j 0
I i = 2 3 ( I R + a · I Y + a 2 · I B ) = I i   m a x · e j β i
where V 0 represents the output voltage of the matrix converter,
I i denotes the input current of the matrix converter,
a’ is the operator, and it can be represented as e j ( 2 π 3 ) ,
V r   a n d   I r are the output voltages and input currents of the matrix converter, respectively,
V 0   m a x and I i   m a x represent the output voltage and input current, respectively, and
0 and β i denote the voltage and current angles.
Additionally, parameters capacitor (Cf), inductor (Lf), and resistor (Rs), are employed to design the input filter circuit, and the equivalent model is exemplified in Figure 6.
The output current and voltage of the filter circuit are derived below:
I i ( s ) = 1 R f C f + 1 L f C f s 2 + s R f L f + 1 L f C f I M C ( s ) | V i ( s ) = 0
V c f ( s ) = R f s 1 L f C f s 2 + s R f L f + 1 L f C f I M C ( s ) | V i ( s ) = 0
Then, the canonical illustration of the above equations is stated as:
a ( s ) = ω n 2 s 2 + 2 ξ ω n s + ω n 2 b ( s )
c ( s ) = s ω n α ξ + ω n 2 s 2 + 2 ξ ω n s + ω n 2 b ( s )  
ω n = 1 L f C f , ξ = R f 2 C f L f , Q = 1 R f L f C f  
where ω n , ξ , and Q signify the natural frequency, damping factor, and quality factor, respectively. This can be derived using a DSP-based control scheme, as illustrated in Figure 1. Furthermore, different switching states that provide the associated output voltage and the input current are exemplified in the below table (Table 3).

4. Results and Discussions

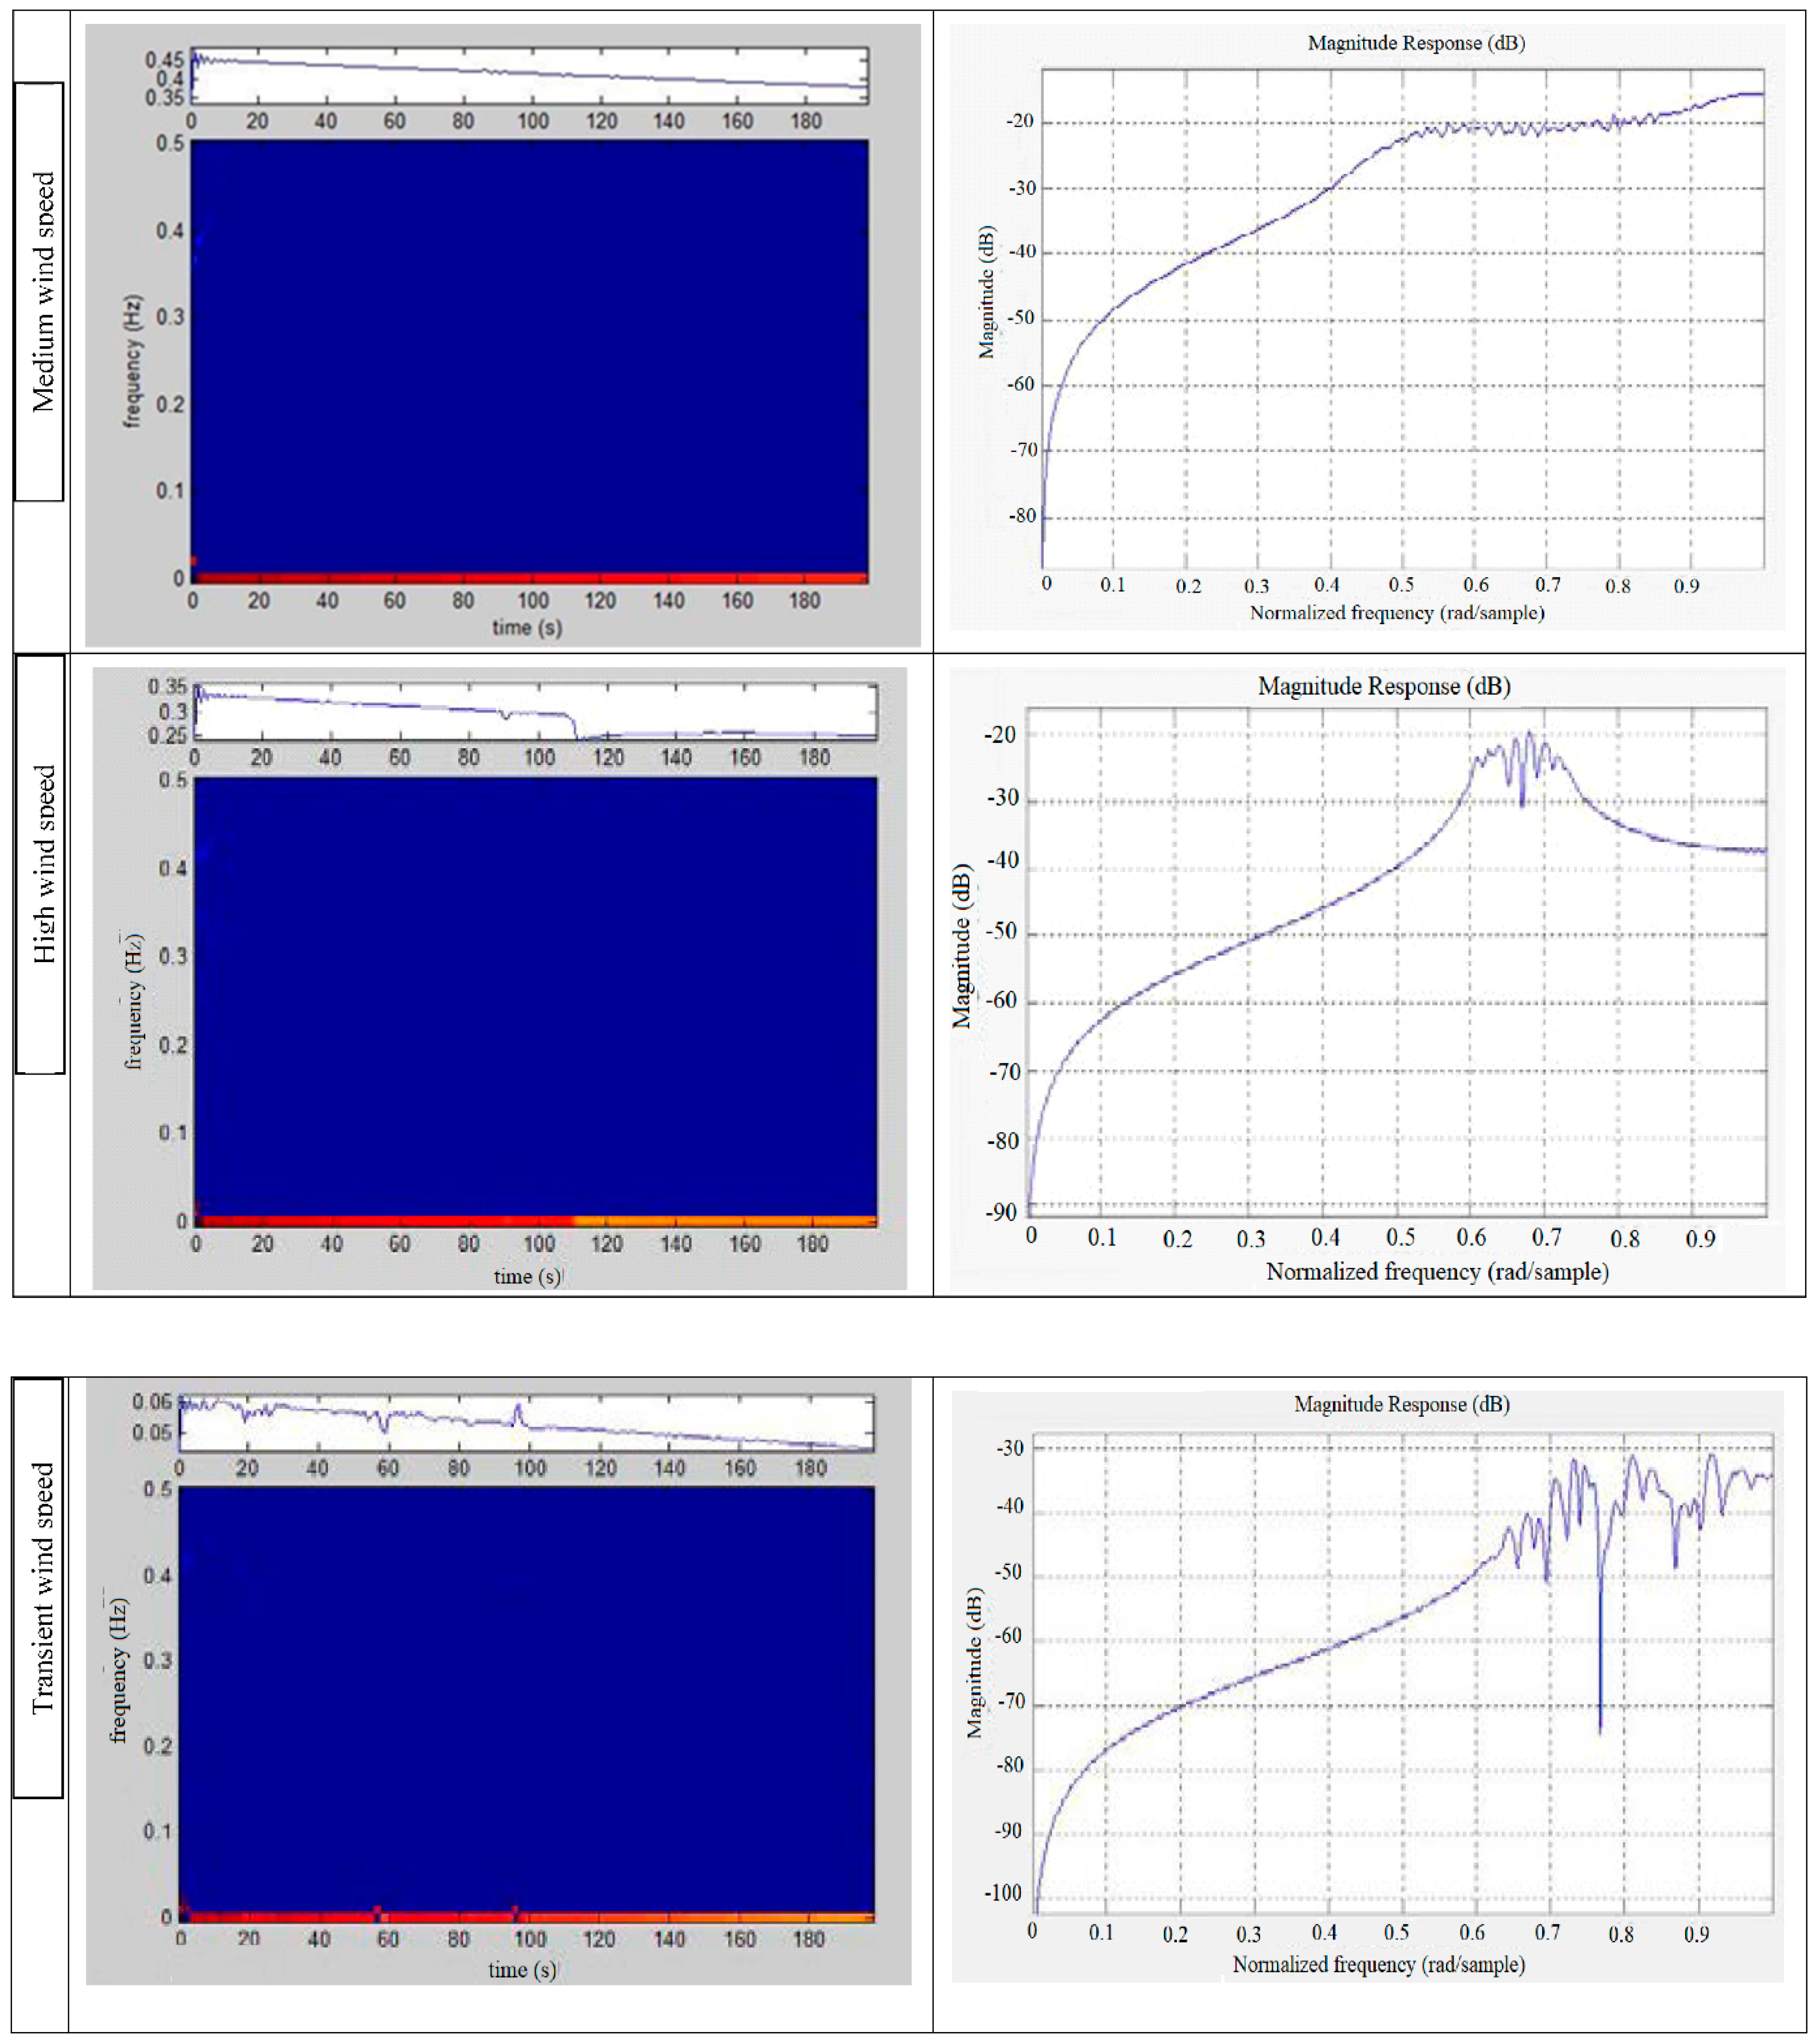
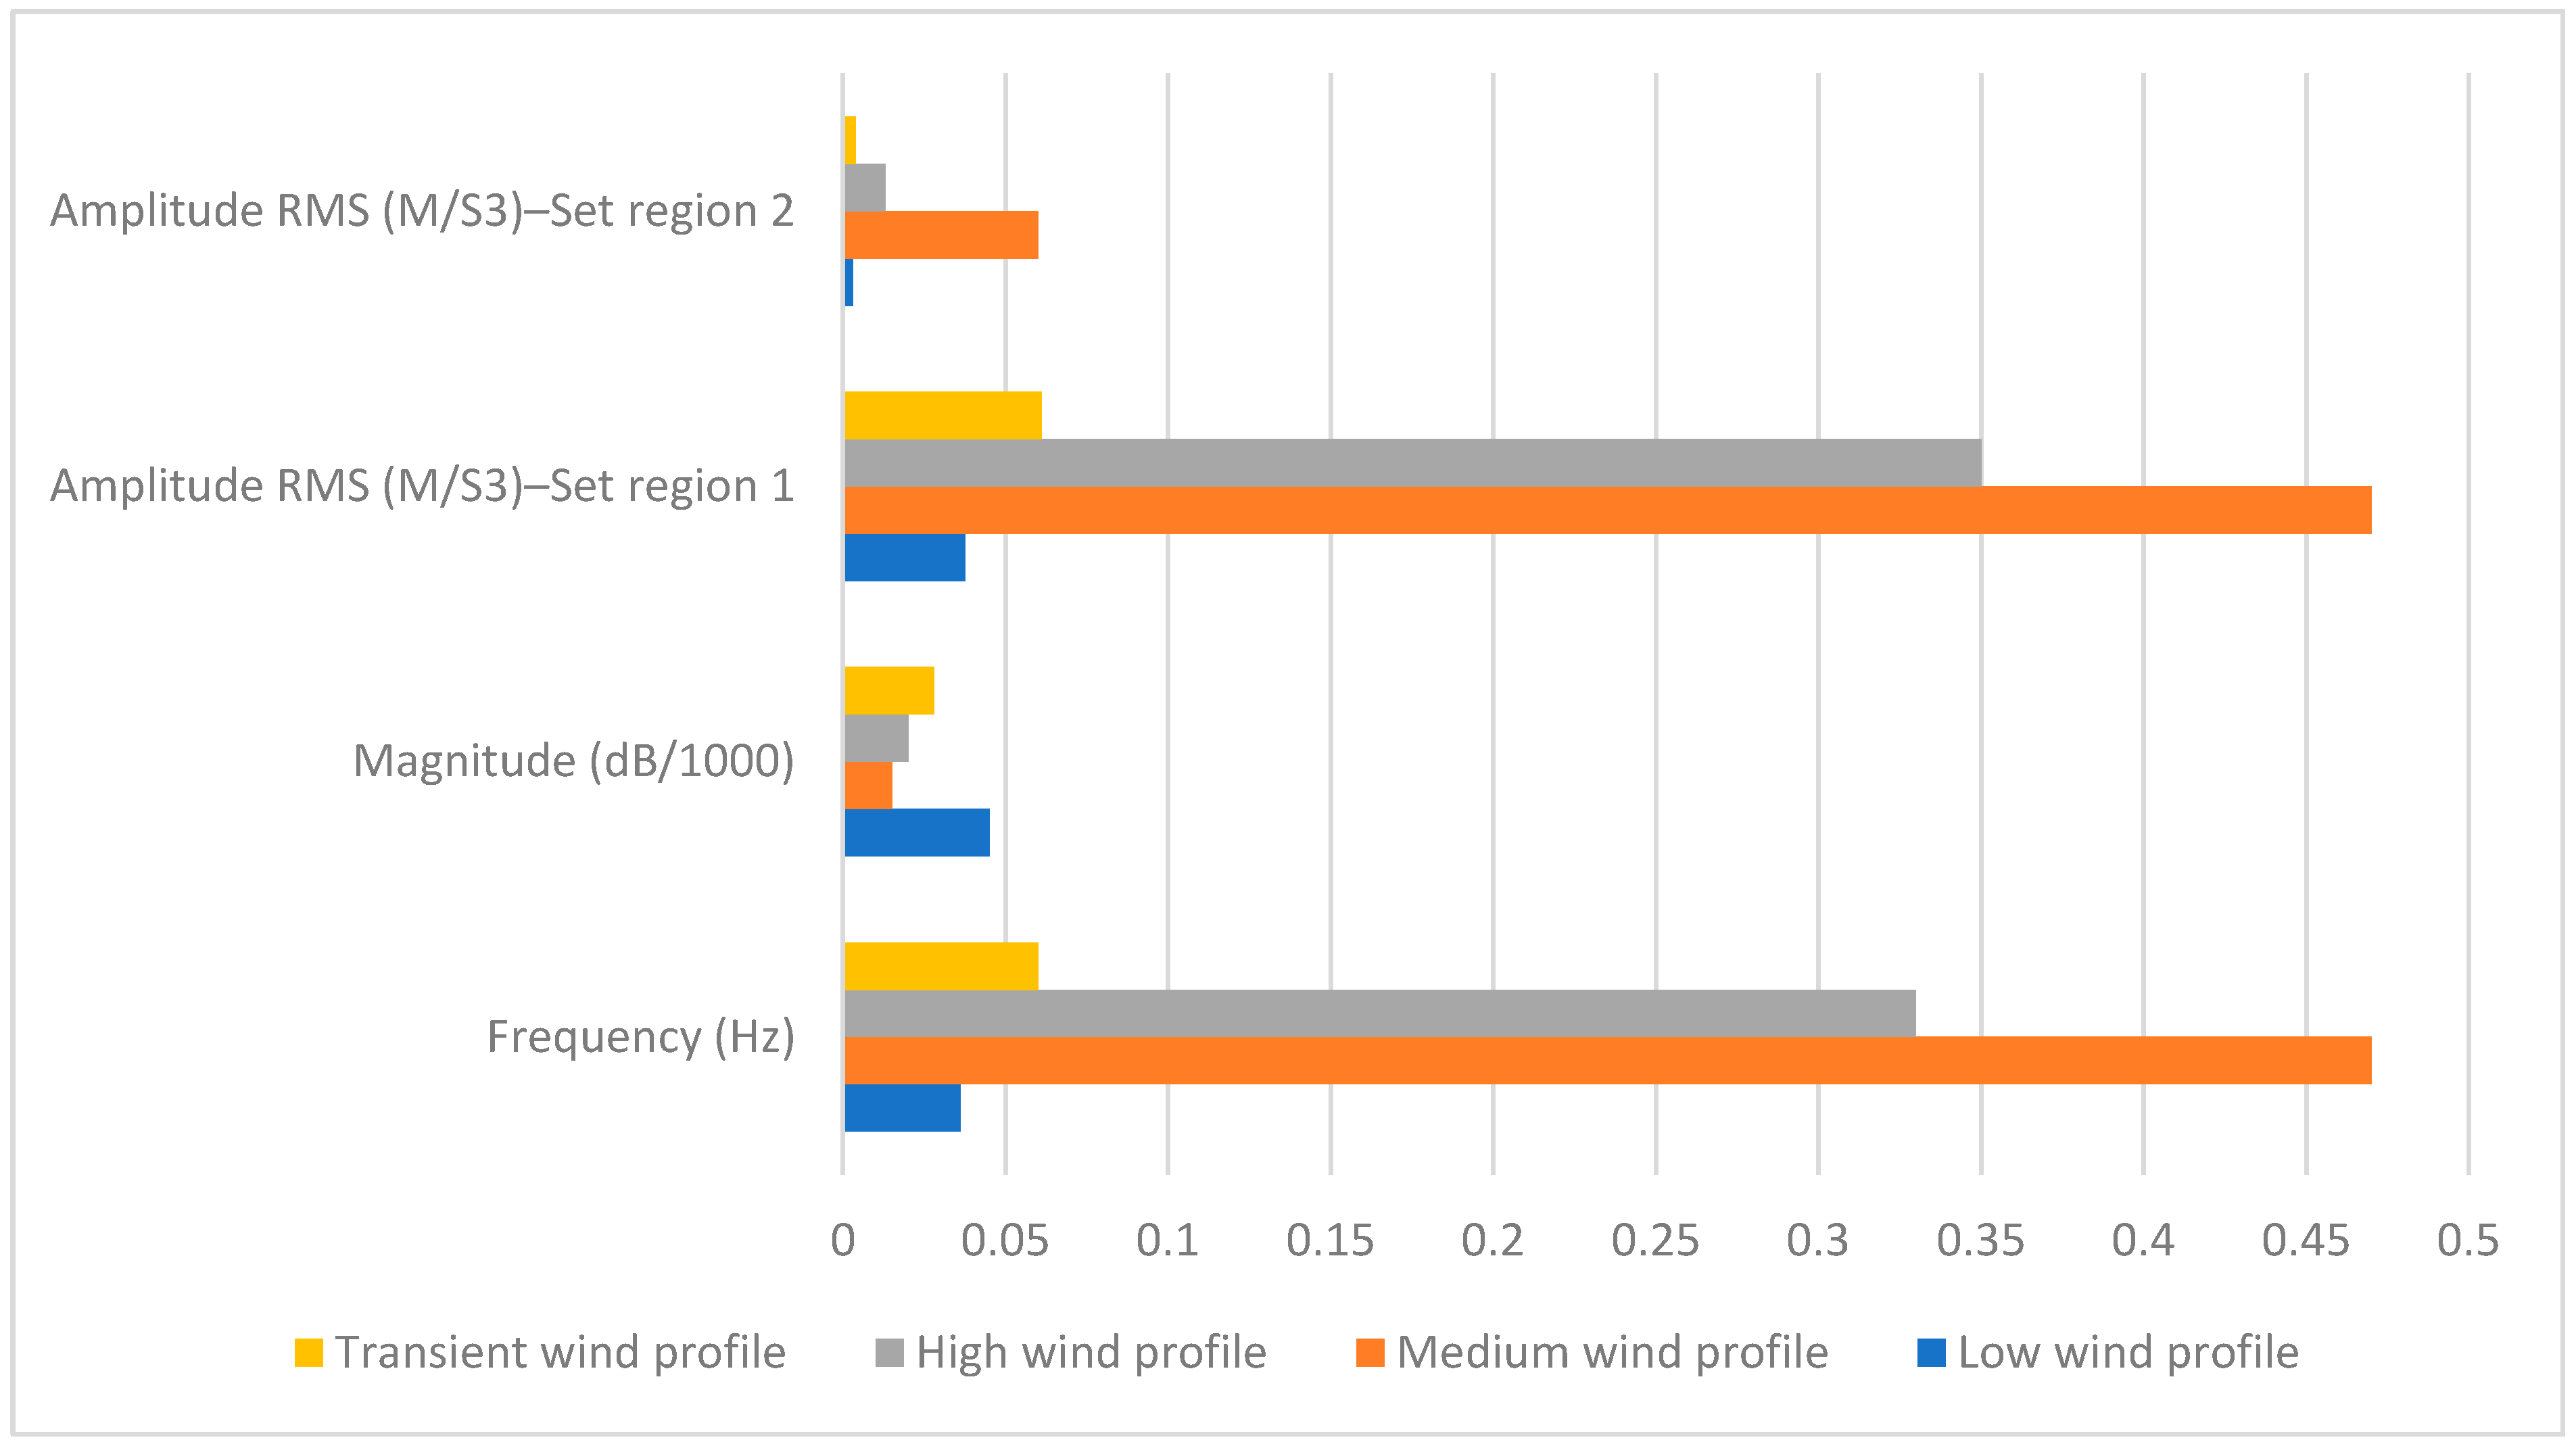
4.1. Vibration Assessment

As mentioned earlier, three different modes of recording can be carried out, and these can be modeled in the Sigview software, which could routinely sample and store the disturbance records. For some scenarios, these recording modes are employed to find the power quality of the prototypes employed for dynamic or steady-state short-circuits studies. This evaluation allows the users to find the varied range of fault voltages and current with time which is usually not considered for performance evaluation. In this work, four different modes of vibration assessment are carried out as follows:
̶
Low-speed system,
̶
Medium-speed system,
̶
High-speed system,
̶
Transient signal system.
The simulated outputs of all four systems are illustrated in Figure 7 and Figure 8. It comprises different plots, namely, frequency versus time, magnitude versus normalized frequency, the amplitude of vibration versus time for the first set region, and amplitude of vibration versus time for the second set region.
From the plots, it is perceived that the low wind speed generates a lesser rate of vibration frequency of about 0.036 Hz as maximum attainment, which is much less than medium (0.47 Hz), high (0.33 Hz), and transient (0.06 Hz) wind speed. It is also noted that the vibrational frequency of a medium wind speed profile is more significant than a higher wind speed profile.
Moreover, the magnitude of the vibration against the normalized frequency shows similar trends across frequency plots. Low wind speed profile shows a magnitude scale of about −45 dB; on the other hand, medium, high, and transient wind profiles offer about −15 dB, −20 dB, and −28 dB, respectively.
Further, the vibration amplitude for the first set regions is noted for low, medium, high, and transient wind profiles. Again, low wind profile offers the least scale of amplitude, of about 0.0375 RMS (m/s3), which is comparatively less than other wind profiles. It is observed that the medium wind speed profile generates a larger scale of about 0.47 RMS (m/s3).
Furthermore, the second set region sensor also shows a similar trend to the first set region but with different magnitude scales. The amplitude of low wind profile provides trivial scale of about 0.003 RMS (m/s3), which is better than medium (0.06 RMS (m/s3)), high (0.013 RMS (m/s3)), and transient (0.0038 RMS (m/s3)) wind profile. The overall comparison of the inferences is illustrated in Figure 9.
Consolidating the inferences, it is observed that the medium wind profile generates more vibration frequency and amplitudes compared with high, low, and transient wind profiles. The EWT technique effectively extracted the vibrational frequency and magnitude by creating a multi resolution analysis of an observed signal using an adaptive wavelet subdivision scheme. It starts with a breakdown of the signal’s spectrum and provides a perfect reconstruction of the input signal. Therefore, EWT can be used for large-scale WECS effectively compared with other existing schemes.

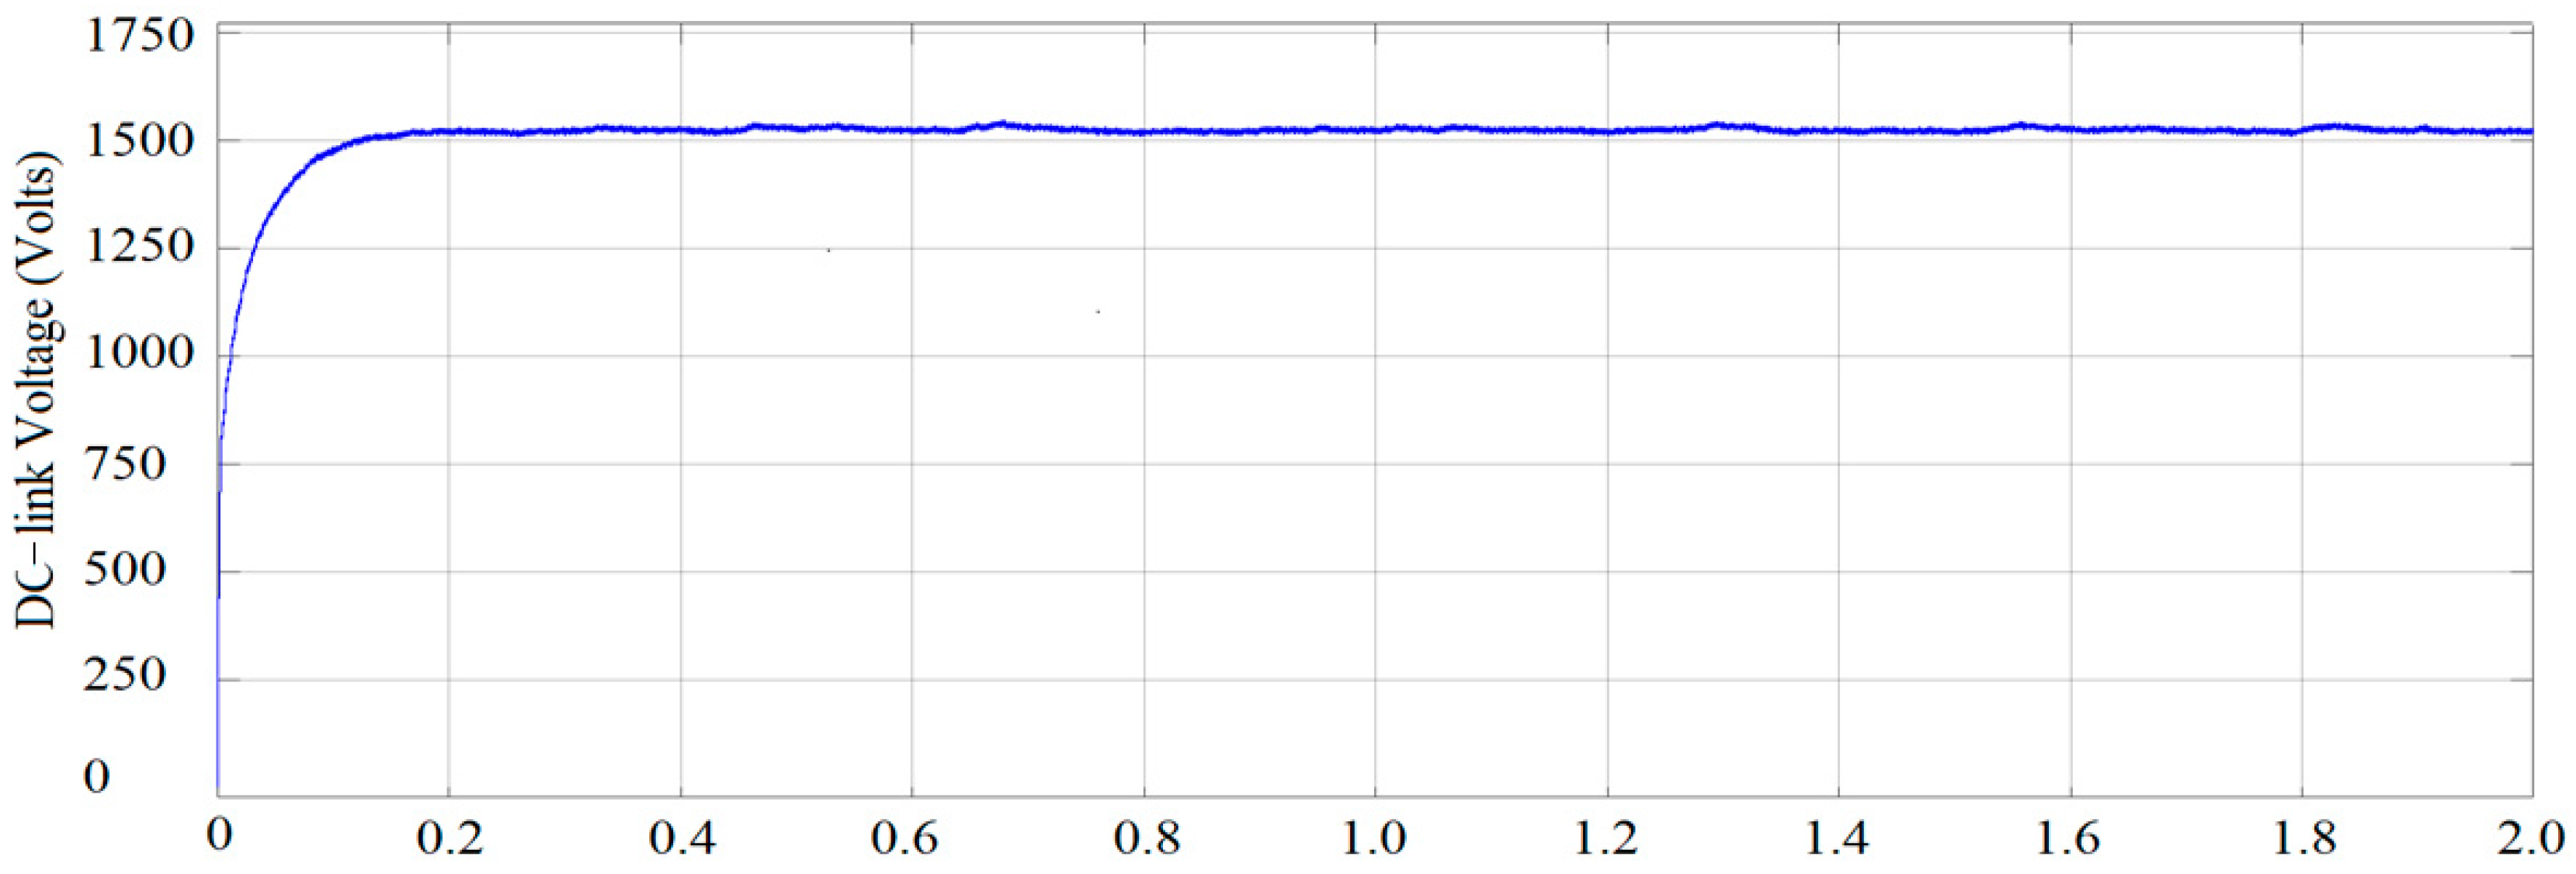
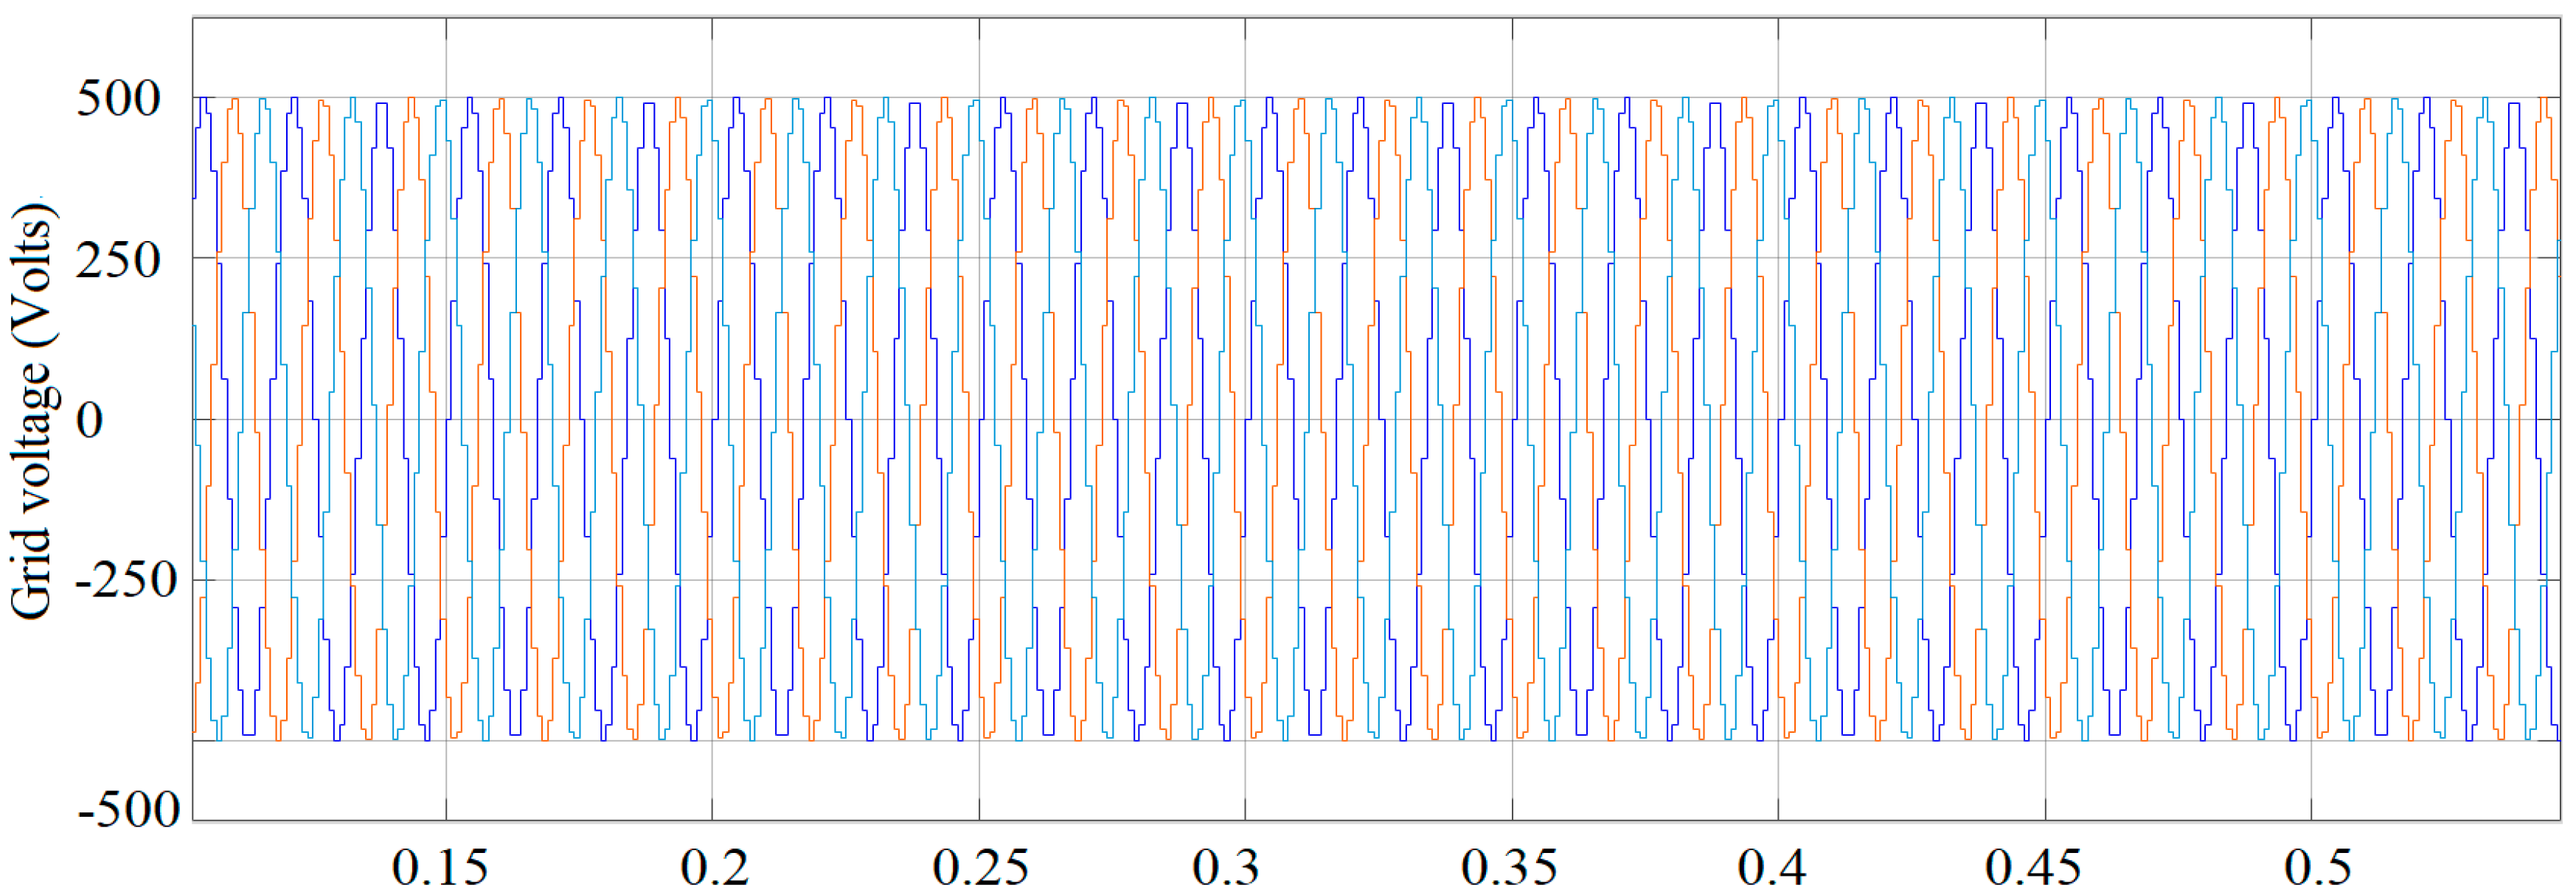
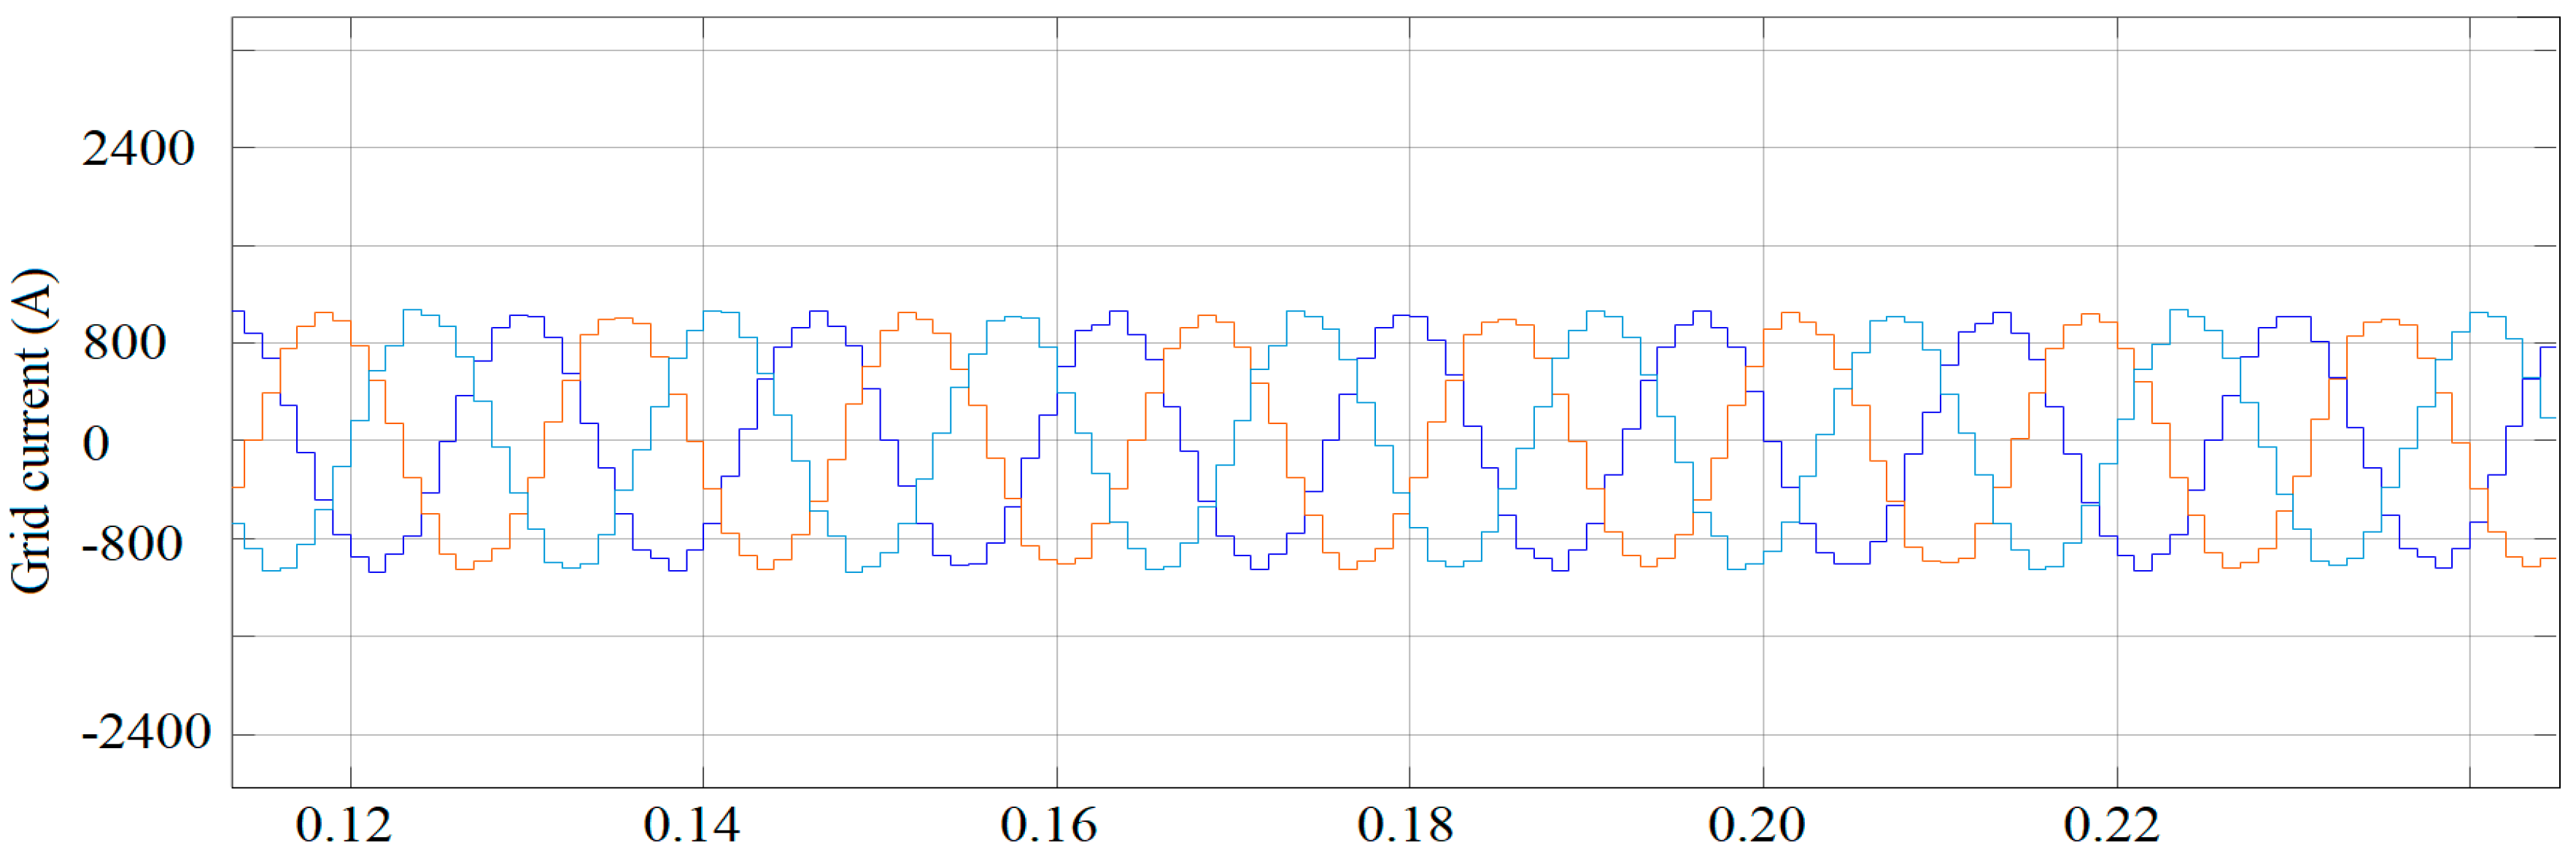
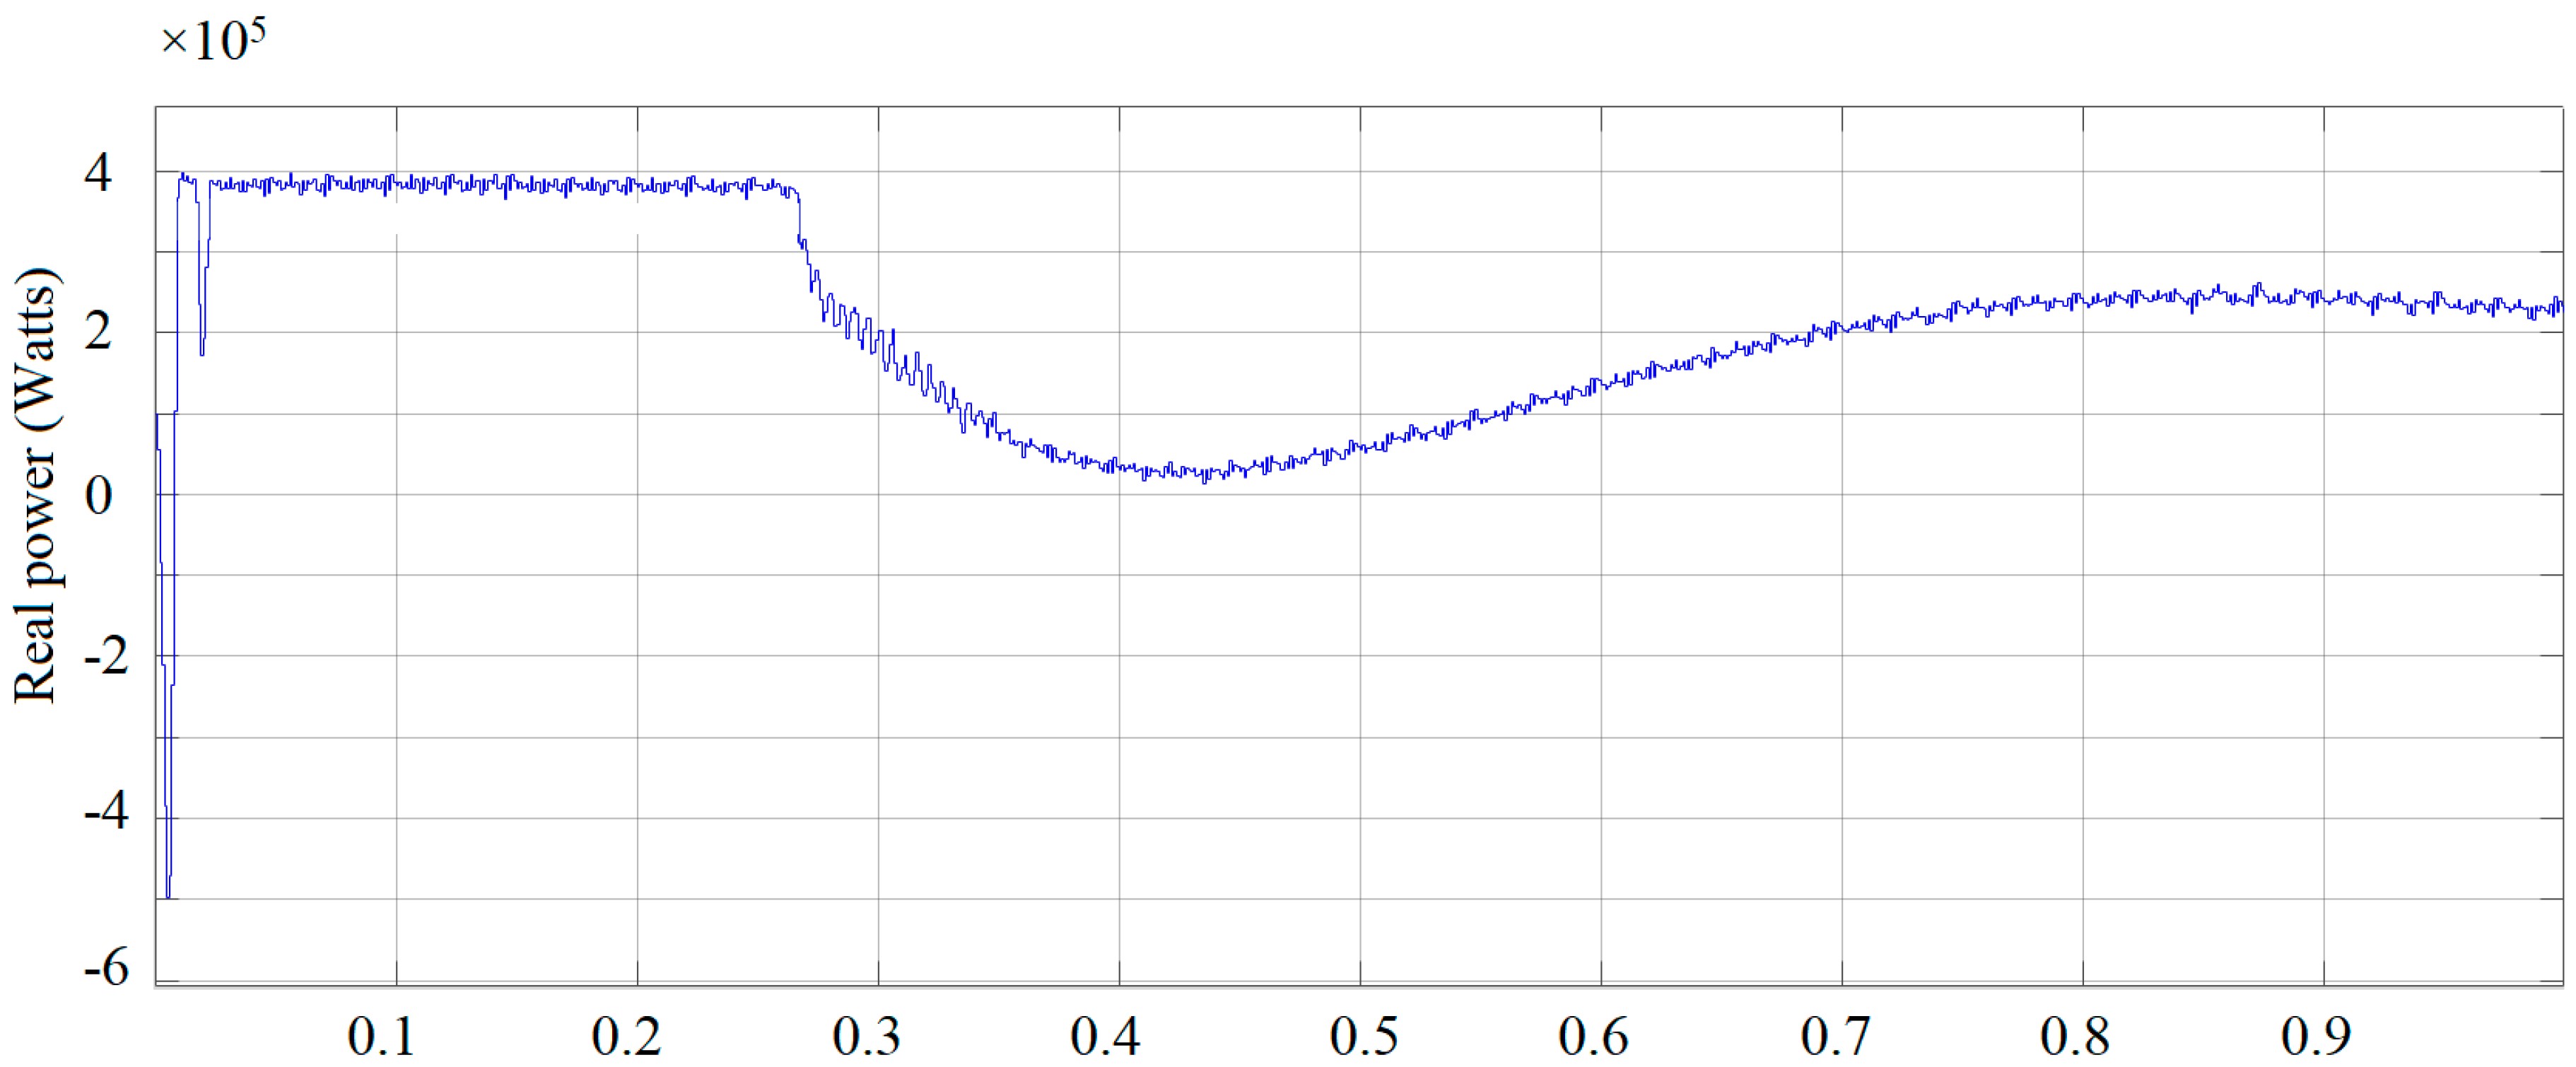
4.2. Performance of Proposed Converter with WECS

The proposed model is designed in the MATLAB Simulink platform based on the parameters depicted in Table 2. The concept of the subsystem mask is adapted for some components such as control schemes, pulse generators, and filter circuits. To measure the output from the various configurations, scope and display blocks are used at appropriate locations. The WECS model accomplishes the wind speed during the simulation process based on the input data that give reference speed to the control scheme optimally.
The proposed system accomplishes the optimal speed of PMSG when the speed of the wind reaches 12 m/s. Furthermore, it is essential to obtain optimal tip-speed ratio and power co-efficient, and this is accomplished at 8 m/s and 0.4, respectively, with the help of pitch-angle controller and MPPT. The matrix converter functioned with a duty cycle ( δ ) rate of 0.68 at a switching frequency of 500 Hz that generates the output. The simulated results show that the waves of DC-link voltage maintained by the inverter offer smooth output and attain stable operation, as illustrated in Figure 10. It is also perceived that DC voltage is controlled well and stably without significant distortion, with a magnitude of 1496 V.
Moreover, the voltage and current at the grid side are observed and illustrated in Figure 11 and Figure 12, respectively. The voltage magnitude is maintained at a good scale of about 505 V, and the current scale is noted to be 994 A. Lastly, the real and reactive power of the inverter at the output side is evaluated (Figure 13 and Figure 14) and found to be 0.383 MW and 0.52 MVAR, respectively. Further, the total harmonic distortion (THD) is performed using Fast Fourier transform (FFT) analysis; current and voltage THDs are measured to be 3.16% and 8.34%, respectively (Figure 15).
Based on the real power output of the inverter, the efficiency of the matrix converter is computed with reference to 0.4 MW as the input to the converting system. Based on this computation, the efficiency of the matrix converter is measured to be 95.75%. Therefore, to warrant the effectiveness of the matrix converter, existing inverting schemes are compared and illustrated in Table 4. It is detected that the recommended converting system accomplishes a greater efficiency rate of 95.75%, which is greater than other converting techniques except for buck-boost and split-inductor differential type, but both of them demonstrated for constant sources. This is due to the direct AC-to-AC power converters that help to handle the variable voltage and variable frequency effectively compared with traditional rectifier–inverter-type power frequency converters. Since it offers sinusoidal output and input waveforms, with marginal higher-order harmonics with bi-directional energy flow capability, it can be concluded that the proposed converter shows better performance for WECS.
Based on the above inferences, it is observed that the proposed system offers better results while assessing the mechanical and electrical characteristics of the wind energy conversion system. Therefore, this model can be extended for higher-rated wind turbine systems for better evaluation of mechanical (vibration assessment) and efficient electrical output.

5. Conclusions

This work attempted to evaluate the mechanical and electrical characteristics of the wind turbine system by employing empirical wavelet transform (EWT) based on acoustic sensors and a matrix converter with input filter. The complete system was modeled and simulated to obtain various mechanical and electrical parameters. Based on the attained results, the following conclusions are made:
  • The acoustic sensors employed with EWT identified the vibrational magnitude for low, medium, high, and transient wind speed profiles effectively.
  • The frequency of the vibrational signal observed a lower scale for low wind profile and higher value for medium speed rather than high wind profile.
  • The amplitude of the sampled vibrational signal was found to be low for low wind profile and higher amplitude for medium wind speed profile rather than high wind profile; there were similar trends for frequency characteristics.
  • The matrix converter with input filter provided significant improvement in its efficiency and outperformed other existing schemes.
  • THDs of voltage and current were also small, which warrant the better power quality of the WECS connected to the grid.
In a nutshell, this work proposed best methodologies to assess the electrical and mechanical characteristics of the WECS that lead to reducing mechanical failure and improving power quality in the overall system. Therefore, the suggested scheme can be employed for conditional monitoring of wind turbine systems and power-quality improvement for large-scale systems where turbines are placed in remote zones.

Author Contributions

Conceptualization, T.R. and P.C.; methodology, T.R. and P.C.; software, T.R., P.C. and R.K.; validation, P.C., V.T. and M.H.A.; investigation, J.H.K.; writing—original draft preparation, T.R. and P.C.; writing—review and editing, M.H.A., J.H.K. and R.K.; funding, J.H.K. All authors have read and agreed to the published version of the manuscript.

Funding

This study was supported by the Hewlett Foundation.

Institutional Review Board Statement

Not applicable.

Informed Consent Statement

Not applicable.

Data Availability Statement

Not Applicable.

Conflicts of Interest

We have no conflict of interest to disclose.

References

  1. Balaguru, V.S.S.; Swaroopan, N.J.; Raju, K.; Alsharif, M.H.; Kim, M.-K. Techno-Economic Investigation of Wind Energy Potential in Selected Sites with Uncertainty Factors. Sustainability 2021, 13, 2182. [Google Scholar] [CrossRef]
  2. Venkatesan, C.; Kannadasan, R.; Alsharif, M.H.; Kim, M.-K.; Nebhen, J. Assessment and Integration of Renewable Energy Resources Installations with Reactive Power Compensator in Indian Utility Power System Network. Electronics 2021, 10, 912. [Google Scholar] [CrossRef]
  3. Raju, K.; Madurai Elavarasan, R.; Mihet-Popa, L. An Assessment of Onshore and Offshore Wind Energy Potential in India Using Moth Flame Optimization. Energies 2020, 13, 3063. [Google Scholar] [CrossRef]
  4. Subramanian, S.; Sankaralingam, C.; Elavarasan, R.M.; Vijayaraghavan, R.R.; Raju, K.; Mihet-Popa, L. An Evaluation on Wind Energy Potential Using Multi-Objective Optimization-Based Non-Dominated Sorting Genetic Algorithm III. Sustainability 2021, 13, 410. [Google Scholar] [CrossRef]
  5. Anthony, M.; Prasad, V.; Kannadasan, R.; Mekhilef, S.; Alsharif, M.H.; Kim, M.-K.; Jahid, A.; Aly, A.A. Autonomous Fuzzy Controller Design for the Utilization of Hybrid PV-Wind Energy Resources in Demand Side Management Environment. Electronics 2021, 10, 1618. [Google Scholar] [CrossRef]
  6. Alsharif, M.H.; Yahya, K.; Geem, Z.W. Strategic Market Growth and Policy Recommendations for Sustainable Solar Energy Deployment in South Korea. J. Electr. Eng. Technol. 2020, 15, 803–815. [Google Scholar] [CrossRef]
  7. Anthony, M.; Prasad, V.; Raju, K.; Alsharif, M.H.; Geem, Z.W.; Hong, J. Design of Rotor Blades for Vertical Axis Wind Turbine with Wind Flow Modifier for Low Wind Profile Areas. Sustainability 2020, 12, 8050. [Google Scholar] [CrossRef]
  8. Alsharif, M.H.; Kim, J. Hybrid Off-Grid SPV/WTG Power System for Remote Cellular Base Stations Towards Green and Sustainable Cellular Networks in South Korea. Energies 2017, 10, 9. [Google Scholar] [CrossRef] [Green Version]
  9. Holitinen, H.; Hirvonen, R. Power system requirement for wind power. In Wind Power in Power System; Ackermann, T., Ed.; Wiley: New York, NY, USA, 2005; pp. 143–157. [Google Scholar]
  10. Bansal, R.C.; Zobaa, A.F.; Saket, R.K. Some issue related to power generation using wind energy conversion system: An overview. Int. J. Emerg. Electr. Power Syst. 2005, 3, 1–14. [Google Scholar] [CrossRef]
  11. Smith, J.C.; Milligan, M.R.; DeMeo, E.A. Utility wind integration and operating impact state of the art. IEEE Trans. Energy Convers. 2007, 22, 900–907. [Google Scholar]
  12. Sadd-Saoud, Z.; Jenkins, N. Models for predicting flicker induced by large wind turbines. IEEE Trans. Energy Convers. 1999, 14, 743–751. [Google Scholar] [CrossRef]
  13. Hu, W.; Chen, Z.; Wang, Y.; Wang, Z. Flicker Mitigation by Active Power Control of Variable-Speed Wind Turbines with Full-Scale Back-to-Back Power Converters. IEEE Trans. Energy Convers. 2009, 24, 640–648. [Google Scholar]
  14. Zhou, F.; Joos, G.; Abhey, C. Voltage stability in weak connection wind farm. In Proceedings of the IEEE Power Engineering Society General Meeting, San Francisco, CA, USA, 16 June 2005; Volume 2, pp. 1483–1488. [Google Scholar]
  15. Mohod, S.W.; Aware, M.V. Power quality issues & its mitigation technique in wind generation. In Proceedings of the 2008 13th International Conference on Harmonics and Quality of Power (ICHQP), Wollongong, Australia, 28 September–1 October 2008; pp. 1–6. [Google Scholar]
  16. Zhang, Z.; Li, Z.; Kazmierkowski, M.P.; Rodriguez, J.; Kennel, R. Robust Predictive Control of Three-Level NPC Back-to-Back Power Converter PMSG Wind Turbine Systems with Revised Predictions. IEEE Trans. Power Electron. 2018, 33, 9588–9598. [Google Scholar] [CrossRef]
  17. Djokic, S.Z.; Milanovic, J.V. Power quality and compatibility levels: A general approach. IEEE Trans. Power Deliv. 2007, 22, 1857–1862. [Google Scholar] [CrossRef]
  18. Villa, L.F.; Reñones, A.; Perán, J.R.; de Miguel, L.J. Angular Resampling for Vibration Analysis in Wind Turbines under Nonlinear Speed Fluctuation. Mech. Syst. Signal Process. 2011, 25, 2157–2168. [Google Scholar] [CrossRef]
  19. Uma Maheswari, R.; Umamaheswari, R. Trends in Non-Stationary Signal Processing Techniques Applied to Vibration Analysis of Wind Turbine Drive Train—A Contemporary Survey. Mech. Syst. Signal Process. 2017, 85, 296–311. [Google Scholar] [CrossRef]
  20. Kusiak, A.; Zhang, Z. Analysis of Wind Turbine Vibrations Based on SCADA Data. ASME J. Sol. Energy Eng. 2010, 132, 1–12. [Google Scholar] [CrossRef]
  21. Ghoshal, A.; Sundaresan, M.J.; Schulz, M.J.; Pai, P.F. Structural health monitoring techniques for wind turbine blades. J. Wind Eng. Ind. Aerodyn. 2000, 85, 309–324. [Google Scholar] [CrossRef]
  22. Yang, W.; Tavner, P.J.; Wilkinson, M.R. Condition monitoring and fault diagnosis of a wind turbine synchronous generator drive train. IET Renew. Power Gener. 2009, 3, 1–11. [Google Scholar] [CrossRef]
  23. Sheldon, J.S.; Watson, M.J.; Byington, C.S. Integrating oil health and vibration diagnostics for reliable wind turbine health predictions. In Proceedings of the ASME2011 Turbo Expo: Turbine Technical Conference and Exposition, Vancouver, BC, Canada, 6–10 June 2011; pp. 939–948. [Google Scholar]
  24. Rajalakshmi, M.; Chandramohan, S.; Kannadasan, R.; Alsharif, M.H.; Kim, M.-K.; Nebhen, J. Design and Validation of BAT Algorithm Based Photovoltaic System Using Simplified High Gain Quasi Boost Inverter. Energies 2021, 14, 1086. [Google Scholar] [CrossRef]
  25. Prakash, M.; Joo, Y.-H. Fuzzy Event-Triggered Control for Back to Back Converter Involved PMSG-Based Wind Turbine Systems. IEEE Trans. Fuzzy Syst. 2021. [Google Scholar] [CrossRef]
  26. Cui, Z.; Zhang, Z.; Yang, Q.; Kennel, R. Cascaded Model Predictive Control of Three-Level NPC Back-to-Back Power Converter PMSG Wind Turbine Systems. In Proceedings of the 2018 IEEE International Power Electronics and Application Conference and Exposition (PEAC), Shenzhen, China, 4–7 November 2018. [Google Scholar]
  27. Eedara, A.K.; Koritala, C.S.; Rayapudi, S.R. Modified Model Predictive Control of Back-to-Back T-Type NPC Converter Interfacing Wind Turbine-Driven PMSG and Electric Grid. Arab. J. Sci. Eng. 2019, 44, 7047–7065. [Google Scholar] [CrossRef]
  28. Benbouhenni, H.; Boudjema, Z.; Belaidi, A. Direct Vector Control of a DFIG Supplied by an Intelligent SVM Inverter for Wind Turbine System. Iran. J. Electr. Electron. Eng. 2019, 1, 45–55. [Google Scholar]
  29. Ni, K.; Hu, Y.; Lagos, D.T.; Chen, G.; Wang, Z.; Li, X. Highly Reliable Back-To-Back Power Converter without Redundant Bridge Arm for Doubly-Fed Induction Generator-Based Wind Turbine. IEEE Trans. Ind. Appl. 2019, 55, 3024–3036. [Google Scholar] [CrossRef]
  30. Bajestan, M.M.; Madadi, H.; Shamsinejad, M.A. Control of a New Stand-Alone Wind Turbine-Based Variable Speed Permanent Magnet Synchronous Generator Using Quasi-Z-Source Inverter. Electr. Power Syst. Res. 2019, 177, 106010. [Google Scholar] [CrossRef]
  31. Escaler, X.; Mebarki, T. Full-Scale Wind Turbine Vibration Signature Analysis. Machines 2018, 6, 63. [Google Scholar] [CrossRef] [Green Version]
  32. Liu, Z.; Zhang, L.; Carrasco, J. Vibration Analysis for Large-Scale Wind Turbine Blade Bearing Fault Detection with an Empirical Wavelet Thresholding Method. Renew. Energy 2020, 146, 99–110. [Google Scholar] [CrossRef]
  33. Naung, S.W.; Rahmati, M.; Farokhi, H. Nonlinear frequency domain solution method for aerodynamic and aeromechanical analysis of wind turbines. Renew. Energy 2021, 167, 66–81. [Google Scholar] [CrossRef]
  34. Inturi, V.; Sabareesh, G.R.; Supradeepan, K.; Penumakala, P.K. Integrated Condition Monitoring Scheme for Bearing Fault Diagnosis of a Wind Turbine Gearbox. J. Vib. Control 2019, 25, 1852–1865. [Google Scholar] [CrossRef]
  35. Liu, Z.; Zhang, L. Naturally Damaged Wind Turbine Blade Bearing Fault Detection Using Novel Iterative Nonlinear Filter and Morphological Analysis. IEEE Trans. Ind. Electron. 2020, 67, 8713–8722. [Google Scholar] [CrossRef]
  36. He, L.; Unnikrishnan, J.; Hao, L.; Matthews, B.; Qiao, W. Enhanced Wind Turbine Main Drivetrain Gearbox and Bearing Monitoring and Diagnostics via Information Fusion of Acoustic, Electrical, and Vibration Signatures. In Proceedings of the 2019 IEEE International Electric Machines & Drives Conference (IEMDC), San Diego, CA, USA, 12–15 May 2019. [Google Scholar]
  37. Mauricio, A.; Qi, J.; Gryllias, K. Vibration-Based Condition Monitoring of Wind Turbine Gearboxes Based on Cyclostationary Analysis. J. Eng. Gas Turbine Power 2019, 141, 031026. [Google Scholar] [CrossRef]
  38. Zhou, D.; Zhang, G.; Blaabjerg, F. Optimal Selection of Power Converter in DFIG Wind Turbine with Enhanced System-Level Reliability. IEEE Trans. Ind. Appl. 2018, 54, 3637–3644. [Google Scholar] [CrossRef] [Green Version]
  39. Wang, C.-N.; Lin, W.-C.; Le, X.-K. Modelling of a PMSG Wind Turbine with Autonomous Control. Math. Probl. Eng. 2014, 2014, 856173. [Google Scholar] [CrossRef]
  40. Nguyen, M.-K.; Lim, Y.-C.; Park, S.-J. A comparison between single phase quasi-Z-source and quasi-switched boost inverters. IEEE Trans. Ind. Electron. 2015, 62, 6336–6344. [Google Scholar] [CrossRef]
  41. Caceres, R.O.; Barbi, I. A boost dc-ac converter: Analysis, design, and experimentation. IEEE Trans. Power Electron. 1999, 14, 134–141. [Google Scholar] [CrossRef]
  42. Kim, K.; Cha, H.; Kim, H.-G. A new single-phase switched-coupled inductor DC-AC inverter for photovoltaic systems. IEEE Trans. Power Electron. 2017, 32, 5016–5022. [Google Scholar] [CrossRef]
  43. Tang, Y.; Bai, Y.; Kan, J.; Xu, F. Improved dual boost inverter with half cycle modulation. IEEE Trans. Power Electron. 2017, 32, 7543–7552. [Google Scholar] [CrossRef]
  44. Khan, A.A.; Cha, H. Dual-buck-structured high-reliability and efficiency single-stage buck-boost inverters. IEEE Trans. Ind. Electron. 2018, 65, 3176–3187. [Google Scholar] [CrossRef]
  45. Abdelhakim, A.; Mattavelli, P.; Davari, P.; Blaabjerg, F. Performance Evaluation of the Single-Phase Split-Source Inverter Using an Alternative DC-AC Configuration. IEEE Trans. Ind. Electron. 2018, 65, 363–373. [Google Scholar] [CrossRef] [Green Version]
  46. Anderson, J.; Peng, F.Z. Four quasi-Z-source inverters. In Proceedings of the 2008 IEEE Power Electronics Specialists Conference, Rhodes, Greece, 15–19 June 2008; pp. 2743–2749. [Google Scholar]
Figure 1. Basic wind turbine system with PMSG and controller.
Sustainability 14 04404 g001
Figure 2. Output power versus turbine speed (pu. represents per unit).
Sustainability 14 04404 g002
Figure 3. Framework of the proposed model.
Sustainability 14 04404 g003
Figure 4. Block Diagram of vibration analysis on WECS.
Sustainability 14 04404 g004
Figure 5. Matrix converter with input filter.
Sustainability 14 04404 g005
Figure 6. Equivalent model of the input filter circuit.
Sustainability 14 04404 g006
Figure 7. Frequency and magnitude of observed vibration.
Sustainability 14 04404 g007aSustainability 14 04404 g007b
Figure 8. Amplitudes of vibration for Set 1 and Set 2 regions.
Sustainability 14 04404 g008
Figure 9. Comparative investigation of vibration assessment.
Sustainability 14 04404 g009
Figure 10. DC-link voltages in volts.
Sustainability 14 04404 g010
Figure 11. Three-phase grid voltages in volts.
Sustainability 14 04404 g011
Figure 12. Three-phase grid current (A represents Ampere).
Sustainability 14 04404 g012
Figure 13. Real power in watts (output side).
Sustainability 14 04404 g013
Figure 14. Reactive power in VAR (output side).
Sustainability 14 04404 g014
Figure 15. Total harmonic distortions: (a) current (b) voltage.
Sustainability 14 04404 g015
Table 1. Existing works relating to the converting techniques and vibration assessment.
Ref. No.YearMethods/TechniquesInferencesLimitations/Research Gaps
Converting techniques
[9]2018NPC Back-to-Back Power Converter
̶
Proposed and validated a robust FCS-MPC scheme with modified predictions.
̶
Control variable ripples were condensed against parameter variations.
̶
Implemented with fully field-programmable-gate-array-based real-time hardware.
̶
The efficiency of the converter was not demonstrated.
[24]2021Simplified high-gain quasi-boost inverter (SHGqBI)
̶
The proposed converting technique reduced the number of components.
̶
It also reduced the conduction and switching losses.
̶
The current and voltage THD of the suggested inverter showed more miniature scale, about 2.7%, and 10.2%, respectively.
̶
The efficiency of the system attained a value of 97%.
̶
Tested for SPV system but no illustrations for wind turbine system.
[25]2021Back-to-Back (BTB) Converter with Fuzzy Event-triggered Control (ETC)
̶
Focused mainly on the dynamical investigation of full-scale direct-driven PMSG-based WECS configured with BTB.
̶
It was found to be cost-effective.
̶
The ETC is considered suitable control concerning the lessening of packet losses and the capability to guarantee steady enactment.
̶
Harmonic analysis was not performed.
̶
Efficiency assessment was not described.
[26]2018Cascaded Model Predictive Control with NPC Back-to-Back (BTB) Power Converter
̶
The proposed scheme alleviates the usage of weighting factors that increases the robustness of parameters.
̶
The proposed converting scheme is compared with other existing schemes and shows better performance.
̶
Power-quality assessment, such as harmonic analysis and efficiency of the converter, was not evaluated.
[27]2018BTB controller with modified model predictive control (MMPC)
̶
Focused on the common-mode voltage on both sides of BTB converter with less computation effort.
̶
Reactive power control, MPPT, DC-link voltage control, voltage balancing, and common-mode voltage showed better enhancement.
̶
Efficiency assessment of the MMPC was not described.
[28]2019Intelligent SVM Inverter with Direct Vector Control
̶
Suggested an enhanced direct vector command (DVC) based on intelligent space vector modulation (SVM).
̶
This method reduced the ripples in active and reactive powers and improved the performances of the DVC method.
̶
Efficiency of the converter was not computed.
[29]2019Back-To-Back Power Converter without Redundant Bridge Arm
̶
BTB converter was investigated in detail for power loss computation, and efficiency examination was accomplished in different post-fault circumstances.
̶
Both objectives were assessed and validated using simulation and experimental results.
̶
The efficiency of the converter was just 88.99%.
̶
Harmonic contents were not assessed.
[30]2019quasi-Z-source inverter (qZSI)
̶
The interface between the permanent magnet synchronous generator and the isolated load was obtained by a qZSI with the energy storage system.
̶
The proposed scheme balanced the fluctuated injected power with improved voltage and frequency.
̶
Stability of active power attained with the DC-link voltage in the course of over-generation circumstance.
̶
Harmonic analysis was not performed.
̶
Efficiency assessment was not described.
Vibration assessment
[31]2018Digital signal processing with accelerometers
̶
Healthy wind turbines with the same sizes and designs were examined to define the average vibrational signs of the drive train mechanisms during the regular process.
̶
Fault-recognition occasion is demonstrated screening the alteration of vibration sign persuaded by impairment in the gearbox.
̶
The vibrational frequency was not assessed.
̶
The magnitude of vibration for transient speed was not computed.
[20]2011Angular resampling
̶
Presented an angular resampling algorithm for a high-speed variability wind turbine system.
̶
The results are obtained from a bearing-diagnostic test bed and simulated signals.
̶
The observed results showed the algorithm’s accuracy compared with a similar technique offered by the consulted bibliography.
̶
Assessment was not carried out for different speed ranges.
̶
Transient speed assessment was not performed.
[32]2020Empirical wavelet thresh holding method
̶
Initially, this study dealt with 15 years of operated wind turbines with a naturally impaired large scale and low-speed blade bearing.
̶
Two cases were examined to accumulate the vibration data, namely, manual rotation and motor driving condition.
̶
The proposed model removed heavy noises and extracted fault signals effectively.
̶
Demonstration was not performed for the wide-ranging speed of the WECS.
̶
The magnitude of the vibration was not assessed.
[33]2020Nonlinear Frequency-Domain Solution
̶
Investigated the aerodynamics and aero elasticity of the wind turbine rotor for flow unsteadiness.
̶
Examined different material property effects along with outsized vibration amplitude on the aerodynamic damping of the wind turbine blade.
̶
Compared with the conventional time-domain method, this method reduced the computational time.
̶
The frequency of the vibration and wide-ranging speed were not presented.
[34]2019Discrete wavelet transform (DWT)
̶
Laboratory-scale WT gearbox was examined for rolling element bearing faults against non-stationary loads using condition monitoring, namely, vibration analysis, lubrication oil analysis, and acoustic analysis.
̶
Statistical structures were calculated from the wavelet estimate coefficients; most noteworthy features were recognized by employing a decision tree algorithm.
̶
Proved that the integrated control monitoring scheme had offered improved classification interpretations compared to single-control monitoring techniques.
̶
Wide-ranging speed consideration was not taken for the simulation study.
[35]2019Novel Iterative Nonlinear Filter (INF)
̶
Naturally harmed large-scale blade bearing, 15-years-operated WT was investigated.
̶
INF removed heavy noises effectively.
̶
The morphological transform-based envelope scheme was also employed to recognize the bearing faults.
̶
Tested the proposed scheme for vibrational magnitude but not for frequency and wide-ranging speeds.
[36]2019Gaussian model-based fusion algorithm
̶
Examined the likelihood of employing acoustic signals to perceive several WT drive train defects.
̶
To validate the proposed algorithm, a 25HP WT simulator was set up in the laboratory.
̶
This model outperformed other solution methods, notably, individual signals in sensing drive train gear and bearing faults at various load and speed action circumstances.
̶
Experimental setup was completed, but vibrational parameters were not assessed.
[37]2018Cyclo-stationaryanalysis
̶
Cyclic Spectral Correlation and Cyclic Spectral Coherence were illustrated for observing rolling element notably bearing condition.
̶
The novel diagnostic tool was employed considering the cyclic speed coherence with the frequency band that comprises the diagnostic data.
̶
This scheme chooses the filtering band automatically and reduces the fault indicators.
̶
Simulation was not performed for wide-ranging speed of the WECS.
̶
The magnitude of the vibration was not assessed.
Table 2. Parameters of the turbine and generator.
SystemParametersUnitRange
Wind turbinePower ratingkW2000
Radius of bladeMeter35
Tip-speed ratio 8
Power coefficient 0.4
Air densitykg/m31.225
Wind cut-in speedm33
Wind speed (rated)m312
Wind cut-out speedm325
Permanent magnet synchronous generator (PMSG)Rated voltageV5000
FrequencyHz50
TorqueN-m450
Stator resistanceOhms0.01
Armature InductanceH0.03
LqmH3.75
LdmH5.5
PolesNos.56
Table 3. Switching states and their outcomes.
On the States of Switches V 0 0 I i β i
S R r S Y y S Y b 2 / 3 V R Y 0 2 / 3 I r π / 6
S Y r S R y S R b 2 / 3 V R Y 0 2 / 3 I r π / 6
S Y r S B y S B b 2 / 3 V Y B 0 2 / 3 I r π / 2
S B r S Y y S Y b 2 / 3 V Y B 0 2 / 3 I r π / 2
S B r S R y S R b 2 / 3 V B R 0 2 / 3 I r 7 π / 6
S R r S C y S B b 2 / 3 V B R 0 2 / 3 I r 7 π / 6
S Y r S R y S Y b 2 / 3 V R Y 2 π / 3 2 / 3 I y π / 6
S R r S Y y S R b 2 / 3 V R Y 2 π / 3 2 / 3 I y π / 6
S B r S Y y S B b 2 / 3 V Y B 2 π / 3 2 / 3 I y π / 2
S Y r S B y S Y b 2 / 3 V Y B 2 π / 3 2 / 3 I y π / 2
S R r S B y S R b 2 / 3 V B R 2 π / 3 2 / 3 I y 7 π / 6
S B r S R y S B b 2 / 3 V B R 2 π / 3 2 / 3 I y 7 π / 6
S Y r S Y y S R b 2 / 3 V R Y 4 π / 3 2 / 3 I b π / 6
S R r S R y S Y b 2 / 3 V R Y 4 π / 3 2 / 3 I b π / 6
S B r S Y y S B b 2 / 3 V Y B 4 π / 3 2 / 3 I b π / 2
S Y r S Y y S B b 2 / 3 V Y B 4 π / 3 2 / 3 I b π / 2
S R r S R y S B b 2 / 3 V B R 4 π / 3 2 / 3 I b 7 π / 6
S B r S B y S B b 2 / 3 V B R 4 π / 3 2 / 3 I b 7 π / 6
S R r S R y S R b 0-0-
S Y r S Y y S Y b 0-0-
S B r S B y S B b 0-0-
S R r S Y y S B b V i m a x α i I 0 m a x β 0
S R r S B y S Y b V i m a x α i I 0 m a x β 0
S B r S R y S Y b V i m a x α i + 2 π / 3 I 0 m a x β i + 2 π / 3
S Y r S R y S B b V i m a x α i + 2 π / 3 I 0 m a x β i + 2 π / 3
S Y r S B y S R b V i m a x α i + 4 π / 3 I 0 m a x β i + 4 π / 3
S B r S Y y S R b V i m a x α i + 4 π / 3 I 0 m a x β i + 4 π / 3
Table 4. Comparison of different inverter configurations.
Ref. No.ConfigurationEfficiency (%)
[40]Quasi Z-source inverter90.20
[41]Differential boost inverter83.33
[42]Switched-coupled inductor inverter90.50
[43]Improved DBI92.60
[44]Buck-boost inverter96.10
[45]Split-inductor differential boost inverter type-I96.50
[45]Split-inductor differential boost inverter type-II97.00
[46]Split-source inverter95.50
Proposed methodMatrix converter95.75
Publisher’s Note: MDPI stays neutral with regard to jurisdictional claims in published maps and institutional affiliations.

