Article

On Risk Probability of Prefabricated Building Hoisting Construction Based on Multiple Correlations

1
Engineering Management, School of Civil Engineering and Architecture, Wuhan University of Technology, Wuhan 430070, China
2
China Construction Seventh Engineering Division Corp. Ltd., Shenzhen 518000, China
*
Author to whom correspondence should be addressed.
These authors contributed equally to this work.
Sustainability 2022, 14(8), 4430; https://doi.org/10.3390/su14084430
Submission received: 22 March 2022 / Revised: 3 April 2022 / Accepted: 6 April 2022 / Published: 8 April 2022
(This article belongs to the Special Issue Sustainability in Construction Management)

Abstract

:
With growing concern about environmental pollution and occupational safety in construction industry globally, prefabricated building has become a popular building model in sustainable society. In China, management specifications of prefabricated buildings are far from mature, and safety accidents occur frequently in construction. In order to comprehensively analyze risks in hoisting construction of prefabricated buildings, this study, in view of characteristics of hoisting construction process and correlations in complex system, summarizes risk factors and classifies them according to Wuli-Shili-Renli (WSR) system. From perspective of multiple correlations, evolution mechanism of multi-system correlation and multi-risk correlation is carried out, so as to explore risk probability of hoisting construction of prefabricated buildings. At the same time, this study extends Two Additive Choquet Integral (TACI) operator and Decision-making Trial and Evaluation Laboratory (DEMATEL) in dynamic stochastic environment to construct a two-stage model for risk probability research of hoisting construction, hoping to profoundly reveal influence of risk factors and their dynamic evolution. The results show that: (1) risk probability presented a seasonal, dynamic change trend, which meant rising first, then falling, and finally keeping rising, thus regular inspection and dynamic monitoring are required in hoisting construction in these regions in the first three quarters. (2) the influence of each risk factor demonstrated dynamic changes, and risk sources that need to prevent and defuse at different time points are varied, thus targeted measures catering to different risk sources are required. (3) the degree of risk controllability is in dynamic change, but classification of cause or result in the region at the period remains the same, thus necessitating targeted response measures aimed at various risk types. (4) Individual risks like hoisting job climated break out periodically, so the law of risk occurrence should be mastered and relative precautionary measures should be taken in advance.

1. Introduction

Development of global economy gradually deepens urbanization and industrialization of less developed countries. In the process of advocating sustainable global resources [1], it is pointed out that traditional construction industry is undoubtedly a resource consumption and carbon emission-intensive industry [2]. Therefore, the Chinese government proposes “14th Five-Year Plan” and the 2035 Vision Plan [3], aiming to vigorously develop prefabricated building and promote sustainable development of global environment. At the same time, projects and worker safety is cornerstone of construction industry, which can be achieved by fundamental measures—risks reduction and elimination.
According to data released by the Ministry of Housing and Urban-Rural Development, 96.17% of project accidents were caused by human and organizational factors from 2009 to 2020. Undoubtedly, fast progress of infrastructure construction results in more construction accidents [4]. The public information shows in 2020, 284 accidents occurred in construction of prefabricated buildings, with nearly two-thirds of which in component hoisting, and an average of 1.63 work-related accidents took place in components hoisting of each building [5]. Therefore, it is of great significance to understand probability of risk factors and their influence in construction of prefabricated buildings, which can not only ensure safety of workers, but also reduce overall casualty rate of accidents in construction industry [6].
Compared with developed countries, management technologies of prefabricated components are not mature enough in China [7], and there are deficiencies in industry supervision. Hoisting construction of prefabricated components is the stage most prone to accidents because in traditional building construction, raw materials are delivered to the construction layer through tower crane for cast-in-situ. By contrast, prefabricated components are prefabricated in the factory and then spliced by tower crane on construction site. Thus, risk research in traditional buildings has obvious shortcomings if it was referred for prefabricated buildings [8]. The hoisting construction process of prefabricated buildings is dynamic, random, open and complex, making it a dynamic multi-complex system. Spatial adjoining interweaving and functional interdependence induce multi-system correlations in hoisting construction, so that changes in one system will affect normal operation of other systems [9]. Re-investigation and analysis are required since two different buildings have different risk factors and risk probabilities [10].
Risk probability is a key standard to measure possibility of risks occurrence, and also an important basis for judging risks situation to prevent and resolve risks [11]. In summary, against the context of China’s prefabricated construction industry, this study analyzes causes of component hoisting accidents, systematically identifies risk factors in hoisting construction of prefabricated buildings, and explores risk probability of hoisting construction that considers multiple correlations and dynamic randomness. It has been a top priority to provide necessary methods and decision-making guidance for dynamically judging risk situation in hoisting construction, and effectively preventing and resolving risks.

2. Literature Review

Risk Probability Research of Prefabricated Building Construction

With development of prefabricated building models in China, some scholars study construction risks and achieve theoretical research results. In view of clear differences between prefabricated buildings and traditional cast-in-place buildings, Wang statistically analyzed documents, designed a questionnaire for construction risk of prefabricated buildings by theory of planned behavior, and summarized relevant risk factors leading to construction accidents. Finally, differences between risks and traditional cast-in-place buildings were analyzed [12]. Shin (2015) [13] studied causes of tower crane disassembly and assembly accidents from 2001 to 2011 [14] and explained safety management according to risks in workers’ occupational norms, mechanical performance and quality. Some [15,16,17,18,19] explored behavioral perception and explained risk factors from the perspective of management. There are also many scholars who believe risk source events cause accidents, and achieve great results in identifying key risk factors and establishing evaluation indicators via cloud model [20,21], grey clustering [22] and other methods, providing a basic framework for understanding occurrence of safety accidents in prefabricated construction projects. In terms of study on risk probability, some scholars, from a static point of view, carried out research in situations of multiple risks. Hernandez-Fajardo et al. [23] evaluated the risk probability in situations of earthquakes and random failure respectively using a simulation-based method; Applegate et al. [24] proposed to evaluate risk probability in situations of multiple disasters using modeling methods and algorithm based on Bayesian network. Other scholars conducted research from the dynamic perspective. For instance, Giorgio et al. [25] proposed to evaluate the risk probability in situations of inclement weather, earthquakes and communication interference respectively on the basis of dynamic Bayesian network. Solhaug et al. [26] presented model-driven, consistent risk analysis methods to conduct dynamic evaluation on risk probability. Bristow et al. [27] proposed to dynamically evaluate risk probability using graph models featuring maximum entropy and likelihood estimation. As to study on risk probability of construction of prefabricated buildings, the majority of existing literature focuses on the influence of key risk factors upon accidents, without further exploration at the system level. In conclusion, the paper took into consideration risks in construction of prefabricated buildings at the system level. All risk factors in engineering accidents were integrated and systematized. Subsequently, study on risk probability of all systems was conducted, so relative risk research on construction of prefabricated buildings was perfected.2.2. Research on Risk Association
As mentioned previously, construction risk of prefabricated buildings has been analyzed extensively. However, due to complex and changeable hoisting conditions on site, it is inevitable that risks interact with each other, but most scholars fail to realize such correlation. Earlier, scholar Suraji (2001) [28] considered both short-term and long-term risk effects in construction, finding different risks interacted. Moreover, taking into account external influences such as climate, Mohanmed (2002) [29] established a model for interaction between workers’ occupational behavior and climate. In the context of safety risk management, risk correlation was interpreted as the extent to which different risk systems or risk factors interact and inner connections among these systems or factors [30]. Zhang et al. [31,32] adopted N-K model to investigate relationship between risk factors of gas explosion, and they drew a conclusion that probability of gas explosion rose with the increase of risk factors. At the same time, based on system dynamics method. Some scholars used association rule algorithm to explore the dependency degree and incidence relation among incidents, as well as relative association rules which could predict the development tendency of future incidents or systems. For instance, Abhishek et al. [33] adopted ARM algorithm to analyze and handle the unknown relations among data, so as to assess and manage risks Xue et al. [34] established a risk association model for risk evaluation of high-speed railway projects. Also, a preliminary research was launched by some scholars to dig out correlation between risk factors by integrating Decision-making Trial and Evaluation Laboratory (DEMATEL) and the Interpretation Structure Model (ISM). Wang (2018) [35] narrated interaction mechanism of risk factors in field of coal mine safety production. DEMATEL and ISM methods were introduced by Lu (2021) [36] to expound causal mechanism of hoisting construction accidents from the perspective of correlations, and they obtained risk path of accident causes. In addition, applying digital twin technology, Liu (2021) [37] described correlation of risk factors in hoisting process, which improved handling efficiency of parallel accidents. In conclusion, on the basis of previous research, this study extends correlations between risks to that between multiple systems and multiple risks, further enriching correlation types between risks. Meanwhile, dynamic randomness is introduced to comprehensively consider dynamic changes of risk probability over time.

3. Materials and Methods

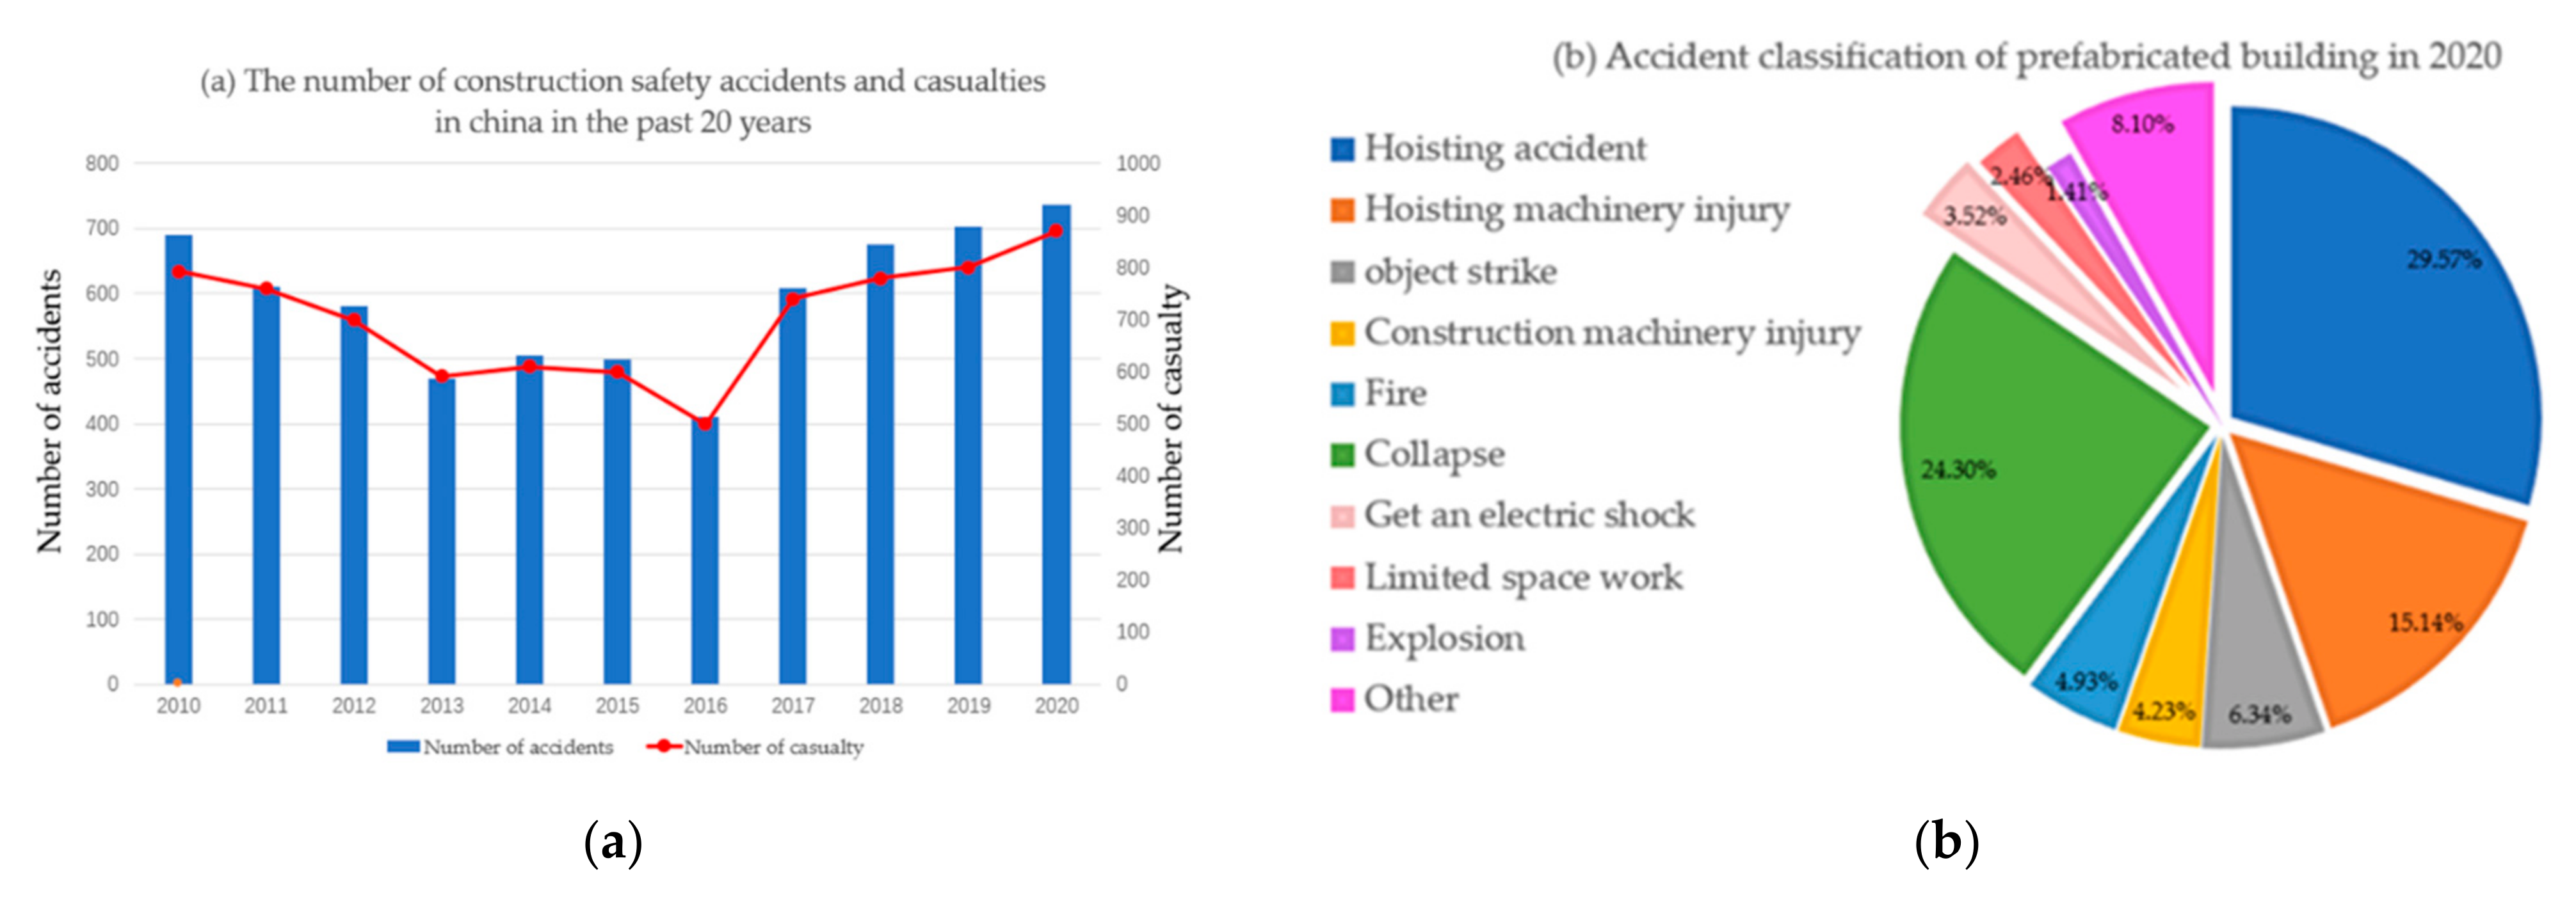
3.1. Accident Data Investigation and Analysis

The study is carried out based on detailed data of real and reliable engineering safety accidents. According to statistics of construction safety accidents and casualties in China in the past 11 years [4], statistics of engineering accidents are shown in Figure 1.
According to statistics of engineering safety accidents and casualties in 2010–2020 released by the Ministry of Housing and Urban-Rural Development of China and classification of safety accidents in prefabricated construction projects in 2020, the average occupational injury rate is above 1 per accident [4,38]. Among safety accidents, common accidents in components hoisting include lifting accidents, lifting machinery injuries, object strikes, and construction machinery injuries, accounting for 55% of all accidents [39].

3.2. WSR Multi-System Analysis of Prefabricated Building Hoisting Construction

WSR methodology is the abbreviation of Wuli(W)-Shili(S)-Renli(R) system methodology. Based on the perspective of systems engineering, it deeply analyzes three system dimensions of Wuli-Shili-Renli of objective system [40]. Furthermore, Chen (2020) [41] established a construction safety conceptual model of prefabricated buildings through WSR method, and identified key carriers of safety transmission of construction risks in each working space of prefabricated buildings. Referring WSR methodology, this study analyzes hoisting construction process of prefabricated buildings, and builds a WSR-based multi-system conceptual model for hoisting construction, as shown in Figure 2.
1.
Wuli (W) is objectively existing law of matter motion. In hoisting construction of prefabricated buildings, physical system is mainly composed of prefabricated components and climatic environment of hoisting operation.
2.
Shili (S) means intervention mechanism in the face of objective existence and its laws, such as organization and management measures in the process of hoisting construction.
3.
Renli (R) represents influence caused by people in dealing with problems, for example, operators on hoisting construction site realize project objectives by completing tasks.
The component hoisting accident is a special safety accident, which makes prefabricated construction project differ from traditional construction. In hoisting operation, tower crane hook is directly connected to components or connected to the reserved lifting point of components, so it proposes higher requirements on construction personnel, components reliability, management specification and operating environment. Therefore, referring to relevant research on causes of complex system accidents and previous survey data, this study concludes relevant literature and safety accidents for hoisting operation according to characteristics and specification requirements of hoisting operation, and extracts keywords and word frequency with risk characteristics of hoisting accidents. Based on accident causes in the WSR system, high-frequency risk feature words are classified and screened, obtaining 10 risk factors in hoisting, as shown in Table 1.

3.3. Evolution Mechanism of System Correlations

Systems of WSR are independent of each other, but their spatial adjacency and functional interdependence cause mutual correlation; state change of a single system will lead to weakening, disappearing or emerging, exacerbating of state of related systems. In summary, systems of Wuli(W)-Shili(S)-Renli(R) are interconnected. Scholars divide correlation between systems from the perspective of urban infrastructure. To be specific, Rinaldi et al. [42] classified these correlations into geographic, physical, network and logical correlation, based on System-of-systems. Suo et al. [43] deemed they were geographic, functional and random correlations from the angle of derivation reason. Therefore, this study referred system correlation classified in the literature [43], in accordance with risk characteristics of prefabricated building hoisting construction and correlation features between WSR systems. Moreover, correlations were defined as geographic, functional and random system associations after considering derivation reason, correlation evolution states, and characteristics of correlation structure. (1) Geographical. It is mainly caused by major natural disasters that affect construction, such as weather and climate or earthquakes and debris flows. Typically, state of geographic correlation is relatively stable. (2) Functional. It is derived from interactions between matters (prefabricated components) and management information. Abnormal interaction between matter and information will lead to weakening, disappearing or emerging or intensifying of state of related system. (3) Random. It attributes to emergencies caused by operational errors, illegal operations, deliberate destruction and others. Random system correlation usually lasts in a certain period of time after emergencies, and its state will emerge or intensify with the deterioration and escalation of emergencies, and also gradually weaken or even disappear with prompt initiation of emergency response measures and orderly progress of system maintenance projects.
In conclusion, for multi-system correlation in hoisting construction of prefabricated buildings, correlation state changes dynamically with the time, and a correlation type may emerge, intensify, weaken or disappear at a certain moment. Figure 3 describes correlation evolution mechanism. According to the figure, shaded nodes are destroyed internal nodes of system; gray nodes are new internal nodes; gray undirected connection is the newly built internal pipeline of the system; thickness of double-headed arrow line indicates intensification or weakening of correlation strength, and gray double-headed arrow line represents new correlation. In other words, coexistence and evolution of correlations may aggravate or alleviate risks in hoisting construction stage, thus producing impact on operational risk probability.

3.4. Risk Correlation Evolution Mechanism

Correlations in hoisting construction stage are explained as direct risk correlation and indirect risk correlation from aspects of correlation derivation, correlation evolution state, and characteristics of correlation structure. (1) Direct risk correlation. It is derived from causal or restrictive relationship between one risk factor and another, for example, if risk factor A causes risk factor B, then risk factor A directly affects risk factor B. Generally, state of direct risk correlation will weaken, disappear, emerge, and intensify with the implementation of risk prevention and resolution strategies. According to derivation reasons, it is more suitable to describe characterization of correlation structure by one-way arrow connection. (2) Indirect risk correlation. It is caused by conductance of direct associations between risk factors. For example, if risk factor A directly affects risk factor B that directly impacts risk factor C, risk factor A shall indirectly affect risk factor C due to conduction. Usually, state of indirect risk correlation will change correspondingly with change of that of direct risk correlation.
Similarly, one-way arrow connection is suitable to describe characterization of correlation structure. Similar to the multi-system correlation, multi-risk correlation of hoisting construction will experience state weakening, disappearing, emerging and intensification as time goes. But the difference is that multi-risk correlation involves both risk correlation within same system or between different systems. The evolution mechanism is shown in Figure 4, in which shaded nodes are disappearing risk factors; gray nodes refer to emerging risk factors; thickness of one-way arrow connection indicates intensification or weakening of correlation strength, and gray one-way arrow connection represents emerging correlations. It should be pointed out that such evolution shall impact risk probability of hoisting construction, to some extent, resulting in dynamic changes in risks aggravation or mitigation.

3.5. Two-stage Modelings

3.5.1. Problem Description

For the convenience of analysis, the following symbols are used to describe sets and quantities involved in risk probability evaluation of prefabricated building hoisting construction that considers multiple correlations and dynamic randomness.
Assume the system set in hoisting construction stage is C, where Ca is the a-th system, a = 1, 2, …, m;
Assume set of risk factors for hoisting construction at time t is F t , where F t i a is the i-th risk factor in system Ca at time t, i = 1, 2, …, n a t , a = 1, 2, …, m, t = 1, 2, …, g;
Assume number of occurrence of internal risk factor F t i a in system Ca at time t is λ i a t , i = 1, 2, …, na(t), a = 1, 2, …, m, t = 1, 2, …, g;
Assume initial judgment matrix of system correlation dynamics is W ˜ t , where w ˜ a b t is interval judgment information given by the expert group at time t for impact effect of correlation between systems Ca and Cb on risk probability of hoisting construction; w a b t is the lower limit of impact effect strength, w a b + t means upper limit of impact effect strength; impact of system’s own correlation on the probability of operational risk is not considered, that is, w ˜ a a t = 0, a = 1, 2, …, m, t = 1, 2, …;
Assume that initial judgment matrix for correlation dynamics of risk factors within the system is Z ˜ a t , where z ˜ i j a t is interval number judgment information given by expert group as a response to direct influence degree of risk factor F t i a in the system Ca on F t j a (ij) at time t; z i j a t represents lower limit of degree of direct influence, z i j a + t is upper limit of degree of direct influence; direct impact of risk factors is not considered, that is z ˜ ii a t = 0, i, j = 1, 2, …, na(t), a = 1, 2, …, m, t = 1, 2, …, g;
Assume that initial judgment matrix for correlation dynamics of risk factors within the system is Z ˜ a b t , where z ˜ i s a b t is interval number judgment information given by expert group as a response to direct influence degree of risk factor F t i a in the system Ca on risk factor F t s b (ab) in system Cb at time t; z i s a b t represents lower limit of degree of direct influence, z i s a b + t is upper limit of degree of direct influence, that is i = 1, 2, …, na t , s = 1, 2, …, nb t , a, b = 1, 2, …, m, t = 1, 2, …, g.
It should be noted that the number of a single risk in a certain period of time is calculated by counting risk factors that occur in multiple prefabricated construction projects involved. The expert group uses −10~10 points to describe influence effect and intensity of system correlation on probability of operational risk, and points indicate that system correlation will aggravate risks, and the lower the point, the stronger the aggravating effect. Point 0 indicates no impact, and point 1–10 implies system correlation will mitigate risks, or in other words, the higher the point, the stronger the mitigation effect. Without loss of generality, it assumes that the effect of system correlation on probability of operational risk will only correspond to one of the aggravating effects, producing no effect or mitigating effect, and effect intensity changes dynamically. At the same time, point 0 to 10 is used by expert group to describe the degree of direct influence between risk factors, with 0 indicating no influence and 10 meaning extremely strong influence.
Based on definition of symbols, and according to known initial judgment matrix of system correlation dynamic W ˜ t , initial judgment matrix for correlation dynamic of internal system risks Z ˜ a t , initial judgment matrix for correlation dynamic of inter-system risk factors Z ˜ a b t and number of occurrence of risk factors within the system λ i a t , this study discusses how to quantify characterization of multiple correlation and dynamic randomness, and integrate them into risk probability evaluation process of hoisting construction, so as to dynamically reveal risks situation, scientifically diagnose root cause and risk controllability during hoisting construction stage, and provide decision support for effectively preventing and resolving risks.

3.5.2. Modeling Principles and Processes

In order to solve these problems, this study proposes a two-stage model for evaluating hoisting construction. This model extends TACI (Two Additive Choquet Integral) operator [44] and DEMATEL (Decision Making Trial and Evaluation Laboratory) [45] to a dynamic random environment for dynamic random quantification processing of multi-system correlation and multi-risk correlation respectively. Subsequently, dynamic random information of system correlation, risk correlation and of risk probability is comprehensively integrated. Finally, it determines dynamic random change of dynamic random probability of multi-system operation risk, ranking and classification of risk factors, so as to reasonably and effectively solve the problem that risk probability evaluation of hoisting construction has to take into account difficulties caused by characterization of multiple correlation and dynamic randomness. Based on the model, Figure 5 draws a flow chart of risk probability evaluation of hoisting construction.

3.5.3. Calculation Steps

According to Figure 3, calculation steps of constructed two-stage model for risk probability evaluation of hoisting construction risk are described as follows.
Step 1: Generated system-correlated dynamic random information. Set w a b t , w a b + t as value range of system-correlated dynamic random information provided by the expert group, referred to method of literature [46] to assume the generation of system-correlated dynamic random information obeyed uniform distribution, and used Matlab software to generate (m − 1) × (m + 1) dynamic random integer matrices. Among them, elements in arbitrary matrix V a b * t = v k * w a b t , w a b + t d × 1 consisted of d random integers, a, b = 1, 2, …, m, t = 1, 2, …, g, k = 1, 2, …, d;
Step 2: Constructed system-correlated dynamic random matrix. Based on generated dynamic random information, constructed a system-correlated dynamic random matrix W * t = w a b * t m × m , where w a b * t   was calculated:
w a b * t = v k * w a b t , w a b + t , a b 0 , a = b a ,   b = 1 ,   2 ,   ,   m ,   t = 1 ,   2 ,   ,   g
Step 3: Determined dynamic random influence coefficient of system correlation. According to definition of correlation coefficient of TACI operator [44], and dynamic random influence coefficient e a b * t of system correlation on risk probability of hoisting construction was obtained by the formula:
e a b * t = k = 1 d v k * w a b t , w a b + t / d × 10 ,   a b 0 ,   a = b
It shows 1 e a b * t 1 , when there is e a b * t 0 , 1 , it is recorded as e a b * + t ; when there is e a b * t 1 , 0 , it is recorded as e a b * t , a, b = 1, 2, …, m, t = 1, 2, …, g.
Step 4: Generated dynamic random information of risk factor correlation within and between systems. Set z i j a t , z i j a + t as value range of dynamic random information of internal system risks, referred to method of literature [46] to assume the generation of information obeyed uniform distribution, and used MATLAB software to generate m × n a t 1 × n a t 1 dynamic random integer matrices. Among them, elements in arbitrary matrix U i j a * t = u k * z i j a t , z i j a + t d × 1 consisted of d random integers, i, j = 1, 2, …, n a t , a = 1, 2, …, m, t = 1, 2, …, g, k = 1, 2, …, d. Similar, Set value range of dynamic random information of internal system risks, assumed the information obeyed uniform distribution, and used MATLAB software to generate m × m 1 × n a t × n b t dynamic random integer matrices. Among them, elements in arbitrary matrix U i s a b * t = u k * z i s a b t , z i s a b + t d × 1 consisted of d random integers, a, b = 1, 2, …, m, i = 1, 2, …, n a t , s = 1, 2, …, n b t , t = 1, 2, …, g, k = 1, 2, …, d.
Step 5: Constructed a dynamic random matrix of risk factor correlation based on the generated dynamic random information of risk factor correlation within and between systems.
Z x y * t = z x y * t N t × N t , x, y = 1, 2, …, N t , N t = a = 1 m n a t , t = 1, 2, …, g, wherein, z x y * t is calculated by
z x y * t u k * z i j a t , z i j a + t ,   x , y Ω 1 t Ω 2 t Ω m t ,   x y     u k * z i j a b t , z i j a b + t , x Ω a t , y Ω t Ω a t , a 1 , 2 , , m 0 ,   x = y  
In which,
Ω 1 t = 1 , 2 , , n 1 t ,
Ω 2 t = n 1 t + 1 , n 1 t + 2 , , n 1 t + n 2 t ,
Ω m t = a = 1 m 1 n a t + 1 , a = 1 m 1 n a t + 2 , , N t ,   Ω t = 1 , 2 , , N t
Step 6: Constructed a dynamic random normalization matrix of risk factor correlations. According to the idea of DEMATEL [45], Z x y * t was normalized, and a dynamic random normalization matrix of risk factor correlation was constructed.
L x y * t = l x y * t N t × N t , wherein, 0 l x y * t 1 , and it was calculated
l x y * t = k = 1 d u k * z i j a t , z i j a + t σ * t ,   x , y Ω 1 t Ω 2 t Ω m t ,   x y   k = 1 d u k * z i s a b t , z i s a b + t σ * t , x Ω a t , y Ω t Ω a t , a 1 , 2 , , m 0 ,   x = y  
σ * t = max 1 y N t a = 1 m j = 1 n a t k = 1 d u k * z i j a t , z i j a + t + b = 1 m s = 1 n b t k = 1 d u k * z i s a b t , z i s a b + t
From the absorption of Markov matrix, it can be seen that the matrix L x y * t satisfies the following properties [47]: l i m τ L x y * t τ = O ; l i m τ I + L x y * t + L x y * t 2 + + L x y * t τ = I L x y * t 1 , where O is a zero matrix and I is an identity matrix
Step 7: Constructed a dynamic random synthesis matrix for risks correlation. According to above properties, this study built a dynamic random comprehensive matrix for risks correlation H x y * t = h x y * t N t × N t , and it was calculated by
H x y * t = l i m τ L x y * t + L x y * t 2 + + L x y * t τ = L x y * t × I L x y * t 1
Step 8: Determined dynamic random centrality and dynamic random relationship degree of risk factors. According to formulas (7) and (8), dynamic random centrality q x * t and dynamic random relationship degree r x * t , x = 1 , 2 , , N t ,   t = 1 , 2 , , g of risk factors were calculated respectively.
q x * t = y = 1 N t l x y * t + y = 1 N t l y x * t
r x * t = y = 1 N t l x y * t y = 1 N t l y x * t
wherein, dynamic random centrality q x * t reflects dynamic random change of ranking of influence of risk factors in entire set. The larger the value, the greater the influence, which is also the root cause of construction risk of prefabricated buildings. The dynamic random relationship degree r x * t displays dynamic random change of controllability of risk factors. If there is r x * t > 0 , it indicates the risk is a cause-oriented risk factor, and the larger the value, the more active of the risk factor, and the less controllable; r x * t < 0 means it is result-oriented risk, and the smaller the value, the more sensitive and controllable the risk factor is.
Step 9: Generated dynamic random information for number of occurrences of a single risk. In reality, times of extreme weather occurred and the number of equipment failures that might take place during the hoisting construction of prefabricated buildings were considered to obey Poisson distribution [48,49]. It was known the number of occurrence of internal risk factor F t i a in system C a was λ i a t at time t, and MATLAB software was used to generate ξ dynamic random numbers obeying Poisson distribution with the parameter λ i a t , wherein, any random number was recorded as μ ϕ * λ i a t , i = 1 ,   2 ,   ,   n a t ,   a = 1 ,   2 ,   ,   m ,   t = 1 ,   2 ,   ,   g ,   ϕ = 1 ,   2 ,   ,   ξ .
Step 10: Determined dynamic random probability of a single risk. Used MATLAB software to produce probability density of ξ generated dynamic random number, and dynamic random probability was obtained by averaging the probability density through the formula:
p i a * t = 1 ξ ϕ = 1 ξ P χ = μ ϕ * λ i a t , i = 1 , 2 , , n a t ,   a = 1 , 2 , , m ,   t = 1 , 2 , g
Step 11: Calculated dynamic random probability of operational risk of a single system. The idea of DEMATEL method [45] was extended to a dynamic random environment, and dynamic random centrality q i * t reflecting influence of risk factors was introduced as equivalent weight, to determine dynamic random probability p a * t of single system risk during hoisting construction stage by the formula:
p a * t = i = 1 n a t q i * t × p i a * t i = 1 n a t q i * t , a = 1 , 2 , , m ,   t = 1 , 2 , , g
Step 12: Calculated the dynamic random probability of multi-system operational risk. Introduced dynamic random influence coefficient e a b * t of system correlation, and extended TACI operator [44] to dynamic random environment to calculate dynamic random probability p * t of multi-system operational risk of hoisting construction by the formula:
p * ( t ) = a = 1 m ( 1 m 1 2 b = 1 m ( e a b * + ( t ) + e a b * ( t ) p a * ( t ) + a = 1 m b = a + 1 m e a b * + ( t ) × min p a * ( t ) , p b * ( t ) ) + a = 1 m b = 1 a 1 e a b * ( t ) × max p a * ( t ) , p b * ( t )
wherein, there is 1 m 1 2 b = 1 m e a b * + t + e a b * t 0 , a , b = 1 , 2 , , m ,   t = 1 , 2 , , g .

4. Case Analysis

Shuangyashan Chengxiang Real Estate Development Company (Shuangyashan, China) is a prefabricated building developer, with more than ten prefabricated building projects. Based on collected risk events during hoisting and construction of projects, this study mainly studied risk events from 1 January 2021 to 31 December 2021, and set season as the time node. Then, it obtained internal risk factors and occurrence times in each time node of the research cycle, as shown in Table 2.
At the same time, an expert group was established, which was composed of scientific research backbones and well-known scholars, as well as senior engineers and front-line technical backbones, who had done research on prefabricated buildings in related fields such as structural engineering and engineering management in scientific research institutions and institutions of higher learning. They judged influence effect of system correlation on risk probability of prefabricated building hoisting and correlation of risk factors within and between systems, as shown in Table 3 and Table 4, respectively. When there is no risk factor in a system at any time node, it is considered the risk factor disappears at this time node, and its correlation with other risk factors is recorded as 0.
According to Table 2, Table 3 and Table 4, this study conducted quantitative analysis of multiple correlation, and quantitative analysis and integration of risks in view of process steps of two-stage model for risk probability evaluation of hoisting construction, finally determining dynamic random probability of multi-system operational risk:
p * 1 = 0.206 , p * 2 = 0.299 , p * 3 = 0.079 , p * 4 = 0.293 .
Judging from time and place, risk probability is in a dynamic evolution trend of rising first, then falling, and then continuing to rise. Among them, the second quarter experiences most risks of the year, and third quarter is the period with low risks. Therefore, second quarter is an important period to test effectiveness of risk prevention and resolution of hoisting construction.
Based on dynamic random centrality and dynamic random relationship degree obtained by the model, this study draws dynamic evolution diagram for influence and controllability of system risk factors (see Figure 6), in order to better improve risk prevention and resolution by identifying risk sources and diagnosing controllability of risks.
Symbols with same shapes represent risk factors at the same time node, among which, “◆” “▲” “■” “●” are risk factors of each time node at t = 1, 2, 3, and 4 respectively. Solid nodes are cause-oriented risk, the hollow nodes mean result-oriented risk, and “→” reflects dynamic evolution path of influence and controllability of risks. Dynamic random centrality q x * t reflects dynamic random change of ranking of influence of risk factors in entire set. The larger the value, the greater the influence, which is also the root cause of construction risk of prefabricated buildings. It shows through comprehensive research and judgment of risk probability evaluation and the dynamic evolution diagram of influence and controllability of system risks:
(1) The influence of risk factor changes dynamically with the passage of time, indicating that risk sources are different at various time nodes. It tells from Figure 4 that as time goes on, risk sources have evolved from climate environment F 1 1 for hoisting of Wuli system in first and second quarters to operating level of operators F 3 2 of Renli system, then gradually to regular maintenance of equipment of Shili system F 4 2 , and finally to management level of Renli system F 3 3 .
(2) The controllability degree of each risk changes dynamically with the passage of time, but risk types have not fundamentally changed, that is, the classification of cause-oriented or result-oriented risks remains same. Specifically, system risks are classified into: cause-oriented risks such as Hoisting job climate F 1 1 , Prefabricated components design and quality F 2 1 , Hoisting connection site strength F 3 1 , Operation process and rules F 2 2 , Prefabricated component hoisting safety measures F 3 2 , Operator’s operation level F 2 3 ; result-oriented risks such as security measures fee F 1 2 ,Equipment regular maintenance F 4 2 , Field security personnel configuration F 1 3 , Management personnel level F 3 3 .
(3) Individual risk factors erupt periodically, and it is necessary to strengthen emergency risk prevention and resolution. For example, Hoisting job climate F 1 1 only occurs at time nodes t = 1 and t = 2, but disappears at time nodes t = 3 and t = 4; while risk factors caused by Equipment regular maintenance F 4 2 are severe at t = 3 and t = 4, and relieved at t = 1 and t = 2.

5. Discussion

In order to verify validity and superiority of the model, this study assumes an uncorrelated scenario for comparative analysis, that is, multi-system correlation and multi-risk correlation are not involved. It should be noted that, in this case, the classical arithmetic average operator is used to integrate single system risks and multi-system risks respectively. The calculation results of dynamic random probability of multi-system operational risk under hypothetical scenario are as follows: p * 1 = 0.179, p * 2 = 0.213, p * 3 = 0.120, p * 4 = 0.178.
From the perspective of qualitative comparison, same conclusion is drawn although different methods are adopted under scenario in this study (that is, considering multiple correlations and dynamic randomness) and hypothetical scenario. Both believe risk probability is in a dynamic evolution trend of increasing first, then falling back and continuing to rise; the third quarter is the period with low risks of the whole year, but second quarter experiences the highest outbreak. From the perspective of quantitative comparison, dynamic random probabilities of risks at each time node are significantly different obtained by different methods in the scenario and the hypothetical scenario, and these probabilities at each time node are ranked: p * 2 > p * 4 > p * 1 > p * 3   and   p * 2 > p * 1 > p * 4 > p * 3 ; Spearman rank correlation coefficient is 0.800, indicating a significant correlation. In summary, calculation results obtained by the model proposed are as effective as by classical arithmetic mean method under the hypothetical scenario, and calculation results are credible.
Meanwhile, through methods comparison, the model is proved advantageous in following aspects. (1) To be closer to reality of research problem. The model fully considers multi-system correlation and multi-risk correlation in the hoisting construction process of prefabricated building projects, quantifies multi-correlation and dynamic randomness characterizations generated by superposition of both, and then integrates them into risk probability evaluation process of hoisting process. This aims to ensure research problems are analyzed comprehensively and accurately. (2) Research conclusions are of higher application value. The model can not only help obtain dynamic random probability, but also the dynamic random centrality and dynamic random relationship degree of risk factors, which provides important reference for judging risks trend, accurately identifying risk sources, and effectively diagnosing risks controllability. (3) To display research results more intuitively. The dynamic evolution diagram of risk influence and controllability is obtained by the model and it helps construction party to intuitively analyze and judge root cause of risks, risk controllability and its dynamic evolution path, providing necessary evidence and guidance for effective risks prevention and resolution.
Based on findings, it is suggested that influence and controllability of risk factors should be taken as an important breakthrough in risks prevention and resolution.
First of all, according to calculation of dynamic random probability of risks, except for the third quarter (a low-risk period for the whole year), the other three quarters are high-risk periods, especially the first and second quarters. At this time, climate is changeable, and extreme weather occurs frequently. Risk source is greatly related to wuli system. Consequently, more focus should be placed on preventing and resolving wuli system risks, as well as strengthening forecast of climate and weather. In addition, safety measures should be taken to avoid construction in extreme weather, and strictly control design and quality of prefabricated components.
Second, cause-oriented risk factors are active and controllability deviates, so strategies shall be introduced to boost timeliness of post-event response and risk resolution capabilities. An effective connection is achieved between each response link of “accident handling → accident reporting → engineering shutdown → causes investigation”. Cause-oriented risk factors should be resolved fundamentally, for example, for Prefabricated component hoisting safety measures F 3 2 , it is necessary to analyze possible safety accidents during hoisting construction in advance, and make safety measures accordingly. In terms of Operator’s operation level F 2 3 , teams experienced in the construction of prefabricated building projects can be hired and established, to train operators in advance and strengthen professional skills.
Third, result-oriented risk factors are more sensitive, with strong controllability, so efforts should be contributed to the normalization of prior hidden danger investigation and improvement of risk prevention capabilities. To be specific, with respect to Security measures fee   F 1 2 , it should increase investment in security measures fee, and avoid accidents caused by further risks intensifying due to correlations. For Equipment regular maintenance F 4 2 , the construction unit shall establish a regular maintenance system for machinery, materials and tools, to prevent accidents during hoisting process. Defective or slightly faulty equipment should be repaired in time [50] and equipment that is aging or structurally damaged should be replaced in time to avoid serious accidents and save engineering costs. For Management personnel level F 3 3 , in professional work, management level often determines quality of employees’ high-level needs, among which it is important to be respected and gain personal value [51]. As a result, it is a necessity to strengthen friendly relationship between managers and operators, which will greatly improve their enthusiasm and self-confidence at work, and encourage workers to pay more attention to occupational safety, avoiding hoisting accidents naturally.

6. Conclusions

Taking into account characterization of multiple correlations and dynamic randomness of hoisting construction risk, this study, from the perspective of evolution mechanism of multiple correlations, constructs a two-stage model for risk probability evaluation that considers multiple correlations and dynamic randomness. Moreover, an empirical research is launched to verify validity and superiority of the model. The results show that: (1) risk probability presented a seasonal, dynamic change trend, which meant rising first, then falling, and finally keeping rising, thus regular inspection and dynamic monitoring are required in hoisting construction in these regions in the first three quarters. (2) the influence of each risk factor demonstrated dynamic changes, and risk sources that need to prevent and defuse at different time points are varied, thus targeted measures catering to different risk sources are required. (3) the degree of risk controllability is in dynamic change, but classification of cause or result in the region at the period remains the same, thus necessitating targeted response measures aimed at various risk types. (4) Individual risks like hoisting job climated break out periodically, so the law of risk occurrence should be mastered and relative precautionary measures should be taken in advance.
Compared with existing studies, this study contributes three findings: First, it takes into account characterization of multiple correlation and dynamic randomness caused by superposition of multi-system correlations and multi-risk correlations. At the same time, it reliably obtains multi-source heterogeneous information and scientifically quantifies it. Second, the model helps effectively integrate multi-source heterogeneous information such as dynamic random information of system correlation, risk correlation, and risk probability. Obtained evaluation results are more scientific and interpretable and they provide important technical support for dynamically judging risks change of hoisting construction. Third, with the aid of results visualization, decision makers in hoisting construction stage shall intuitively analyze and judge root causes of risk, risk controllability and its dynamic evolution path, so as to offer necessary basis and guidance for effective risks prevention and resolution. Furthermore, when quantifying characterization of multiple correlation, this study obtains initial correlation information via collective consultation on conference of experts, which means subjectivity exists while advantages of expert experience are utilized maximally. Therefore, in the future, more attention will be placed on deeply mining system correlation mechanism and risk correlation mechanism of complex systems, and exploring integrated application of technologies including cellular automata, machine learning, text topic mining and others. The information must be acquired by combining subjective expert judgment and objective evidence description, and measures can be applied to explain accurate and rational correlation information, in order to further improve scientificity of risk probability evaluation process of hoisting construction and accuracy of evaluation results.

Author Contributions

Conceptualization, P.W.; data curation, Y.L.; formal analysis, P.W.; methodology, J.W.; software, Q.L.; writing—original draft, P.W. and C.Y. All authors have read and agreed to the published version of the manuscript.

Funding

This study was supported by National key R&D projects, grant number (2018YFC0704301), the Science and Technology Project of Wuhan Urban and Rural Construction Bureau, China (201943), Research on theory and application of prefabricated building construction management (20201h0439); Wuhan Mo Dou construction consulting Co., Ltd. (20201h0414), Pre-liminary Study on the Preparation of the 14th Five-Year Plan for Housing and Urban-Rural Development in Hubei Province (20202s0002).

Institutional Review Board Statement

Not applicable.

Informed Consent Statement

Informed consent was obtained from all subjects involved in the study.

Data Availability Statement

The case analysis data used to support the findings of this study are available from the corresponding author upon request.

Conflicts of Interest

The authors declare no conflict of interest.

References

  1. Zuo, J.; Pullen, S.; Rameezdeen, R.; Bennetts, H.; Wang, Y.; Mao, G.; Zhou, Z.; Du, H.; Duan, H. Green building evaluation from a life-cycle perspective in Australia: A critical review. Renew. Sustain. Energy Rev. 2017, 70, 358–368. [Google Scholar] [CrossRef]
  2. Shi, Q.; Chen, J.; Shen, L. Driving factors of the changes in the carbon emissions in the Chinese construction industry. J. Clean. Prod. 2017, 166, 615–627. [Google Scholar] [CrossRef]
  3. Chen, L.Y.; Gao, X.; Hua, C.X.; Gong, S.T.; Yue, A.B. Evolutionary process of promoting green building technologies adoption in China: A perspective of government. J. Clean. Prod. 2021, 279, 123607. [Google Scholar] [CrossRef]
  4. Ministry of Housing and Urban-Rural Development of the People’s Republic of China. Available online: http://www.mohurd.gov.cn/ (accessed on 18 November 2021).
  5. 2020 National Construction Safety Accident Data “Released”, It Is Imperative to Promote VR Site Safety Training. Available online: http://www.ycc333.com/Article/2020qgjzaq.html (accessed on 4 November 2021).
  6. Wang, Z.H.; Li, L.; Zhang, Y.X.; Wang, W.T. Bond-slip model considering freeze-thaw damage effect of concrete and its application. Eng. Struct. 2019, 201, 109831. [Google Scholar] [CrossRef]
  7. Hong, J.K.; Shen, G.Q.P.; Li, Z.D.; Zhang, B.Y.; Zhang, W.Q. Barriers to promoting prefabricated construction in China: A cost-benefit analysis. J. Clean. Prod. 2018, 172, 649–660. [Google Scholar] [CrossRef]
  8. Wang, J.; Liao, P.-C. Re-Thinking the Mediating Role of Emotional Valence and Arousal between Personal Factors and Occupational Safety Attention Levels. Int. J. Environ. Res. Public Health 2021, 18, 5511. [Google Scholar] [CrossRef]
  9. Zhang, C.; Kong, J.J.; Simonovic, S.P. Restoration resource allocation model for enhancing resilience of interdependent infrastructure systems. Saf. Sci. 2018, 102, 169–177. [Google Scholar] [CrossRef]
  10. Tam, V.W.Y.; Tam, C.M.; Zeng, S.X.; Ng, W.C.Y. Towards adoption of prefabrication in construction. Build. Environ. 2007, 42, 3642–3654. [Google Scholar] [CrossRef] [Green Version]
  11. Aven, T. An emerging new risk analysis science: Foundations and implications. Risk Anal. 2018, 38, 876–888. [Google Scholar] [CrossRef] [Green Version]
  12. Wang, X.W.; Sun, Y.C.; Liu, Y. Research on Influencing Factors of Unsafe Behavior of Prefabricated Building. In IOP Conference Series: Earth and Environmental Science; IOP Publishing: Bristol, UK, 2020; Volume 546. [Google Scholar] [CrossRef]
  13. Shin, I.J. Factors that affect safety of tower crane installation/dismantling in construction industry. Saf. Sci. 2015, 72, 379–390. [Google Scholar] [CrossRef]
  14. Chi, S.; Han, S.; Kim, D.Y. Relationship between Unsafe Working Conditions and Workers’ Behavior and Impact of Working Conditions on Injury Severity in US Construction Industry. J. Constr. Eng. Manag. 2013, 139, 826–838. [Google Scholar] [CrossRef] [Green Version]
  15. Li, H.; Lu, M.J.; Hsu, S.C.; Gray, M.; Huang, T. Proactive behavior-based safety management for construction safety improvement. Saf. Sci. 2015, 75, 107–117. [Google Scholar] [CrossRef]
  16. Haslam, R.; Hide, S.; Gibb, A.; Gyi, D.; Pavitt, T.; Atkinson, S.; Duff, A.R. Contributing factors in construction accidents. Appl. Ergon. 2005, 36, 401–415. [Google Scholar] [CrossRef] [PubMed] [Green Version]
  17. Harvey, E.; Waterson, P.; Dainty, A. Impact of the ‘Contributing Factors in Construction Accidents’ (ConCA) Model. Adv. Intell. Syst. 2019, 824, 310–319. [Google Scholar] [CrossRef] [Green Version]
  18. Goncalves, A.P.G.; Waterson, P.; Jun, G.T. Improving accident analysis in construction—Development of a contributing factor classification framework and evaluation of its validity and reliability. Saf. Sci. 2021, 140, 105303. [Google Scholar] [CrossRef]
  19. Soltanzadeh, A.; Mohammadfam, I.; Moghimbeigi, A.; Akbarzadeh, M.; Ghiasvand, R. Key factors contributing to accident severity rate in construction industry in Iran: A regression modelling approach. Arh. Hig. Rada Toksikol. 2016, 67, 47–53. [Google Scholar] [CrossRef] [Green Version]
  20. Li, Y.P.; Liu, M.Q.; Wang, F. Safety performance assessment of fabricated building project based on cloud model. Chin. Saf. Sci. J. 2017, 27, 115–120. [Google Scholar] [CrossRef]
  21. Liu, J.K.; Gong, E.Q.; Wang, D.; Teng, Y. Cloud Model-Based Safety Performance Evaluation of Prefabricated Building Project in China. Wirel. Pers. Commun. 2018, 102, 3021–3039. [Google Scholar] [CrossRef]
  22. Chen, W.; Fu, J.; Xiong, F.G. Grey clustering evaluation model for construction safety of fabricated building project. Chin. Saf. Sci. J. 2016, 26, 70–75. [Google Scholar] [CrossRef]
  23. Hernandez-Fajardo, I.; Duenas-Osorio, L. Probabilistic study for cascading failures in interdependent lifeline systems. Reliab. Eng. Syst. Saf. 2013, 111, 260–272. [Google Scholar] [CrossRef]
  24. Applegate, C.J.; Tien, I. Framework for probabilistic vulnerability analysis of interdependent infrastructure systems. J. Comput. Civ. Eng. 2019, 33, 04018058. [Google Scholar] [CrossRef] [Green Version]
  25. Giorgio, A.D.; Liberati, F. A Bayesian network-based approach to the critical infrastructure interdependencies analysis. IEEE Syst. J. 2012, 6, 510–519. [Google Scholar] [CrossRef]
  26. Solhaug, B.; Seehusen, F. Model-driven risk analysis of evolving critical infrastructure. J. Ambient Intell. Humaniz. Comput. 2014, 5, 187–204. [Google Scholar] [CrossRef]
  27. Bristow, D.N.; Hay, A.H. Graph model for probabilistic resilience and recovery planning of multi-infrastructure systems. J. Infrastruct. Syst. 2016, 23, 04016039. [Google Scholar] [CrossRef]
  28. Suraji, A.; Duff, A.R.; Peckitt, S.J. Development of causal model of construction accident causation. J. Constr. Eng. Manag. 2001, 127, 337–344. [Google Scholar] [CrossRef]
  29. Mohamed, S. Safety climate in construction site environments. J. Constr. Eng. Manag. 2002, 128, 375–384. [Google Scholar] [CrossRef]
  30. Xue, Y.; Liu, Y.; Zhang, T. Research on the formation mechanism of coupled disaster risk. J. Nat. Disasters 2013, 22, 44–50. [Google Scholar] [CrossRef]
  31. Zhang, J.; Xu, K.; Wang, B.; Wang, Y.; Wang, R. Study on the evolution mechanism of gas explosion accident risk coupling. Chin. Saf. Sci. J. 2016, 76, 81–85. [Google Scholar]
  32. Zhang, J.; Xu, K.; You, G.; Wang, B.; Zhao, L. Causation Analysis of Risk Coupling of Gas Explosion Accident in Chinese Underground Coal Mines. Risk Anal. 2019, 39, 1634–1646. [Google Scholar] [CrossRef]
  33. Abhishek, V.; Sudha, D.K.; Maiti, J.; Krishna, O.B. Identifying patterns of safety related incidents in a steel plant using association rule mining of incident investigation reports. Saf. Sci. 2014, 70, 89–98. [Google Scholar] [CrossRef]
  34. Xue, Y.; Xiang, P.; Jia, F.; Liu, Z. Risk Assessment of High-Speed Rail Projects: A Risk Coupling Model Based on System Dynamics. Int. J. Environ. Res. Public Health 2020, 17, 5307. [Google Scholar] [CrossRef] [PubMed]
  35. Wang, L.L.; Cao, Q.G.; Zhou, L.J. Research on the influencing factors in coal mine production safety based on the combination of DEMATEL and ISM. Saf. Sci. 2018, 103, 51–61. [Google Scholar] [CrossRef]
  36. Wang, J.W.; Lu, C. On the cause-result consequence of the hoisting accidents in the prefabricated construction projects from the perspective of relevance. J. Saf. Environ. 2021, 21, 1158–1164. [Google Scholar] [CrossRef]
  37. Liu, Z.S.; Meng, X.T.; Xing, Z.Z.; Jiang, A.T. Digital Twin-Based Safety Risk Coupling of Prefabricated Building Hoisting. Sensors 2021, 21, 3583. [Google Scholar] [CrossRef]
  38. Analysis on the Number, Death Toll and Accident Types of Production Safety Accidents in Housing and Municipal Engineering in China. Available online: https://www.chyxx.com/industry/202012/915491.html (accessed on 19 November 2021).
  39. National Large-Scale Construction Safety Accidents in 2020-Tower Crane Collapse and High Falling. Available online: https://blog.51cto.com/u_14890609/2519824 (accessed on 19 November 2021).
  40. Ji, R.B.; He, S.; Zhong, X. Research on oil and gas companies work safety model based on WSR. Chin. Saf. Sci. J. 2013, 23, 139–144. [Google Scholar] [CrossRef]
  41. Chen, W.; Yang, Z.Z. Research on DEMATEL-BN model of construction risk transmission for prefabricated building. Chin. Saf. Sci. J. 2020, 30, 1–6. [Google Scholar] [CrossRef]
  42. Rinaldi, S.M.; Peerenboom, J.P.; Kelley, T.K. Identifying, understanding, and analyzing critical infrastructure interdependencies. IEEE Contr. Syst. Mag. 2001, 21, 11–25. [Google Scholar] [CrossRef]
  43. Suo, W.L.; Zhang, J.; Sun, X.L. Risk assessment of critical infrastructures in a complex interdependent scenario: A four-stage hybrid decision support approach. Saf. Sci. 2019, 120, 692–705. [Google Scholar] [CrossRef]
  44. Grabisch, M. K-order additive discrete fuzzy measures and their representation. Fuzzy Set Syst. 1997, 92, 167–189. [Google Scholar] [CrossRef]
  45. Gabus, A.; Fontela, E. World Problems, an Invitation to Further Thought within the Framework of DEMATEL; Battelle Geneva Research Centre: Geneva, Switzerland, 1972. [Google Scholar]
  46. Ayrim, Y.; Atalay, K.D.; Can, G.F. A new stochastic MCDM approach based on COPRAS. Int. J. Inf. Tech. Decis. 2018, 17, 857–882. [Google Scholar] [CrossRef]
  47. Papoulis, A.; Pillai, S.U. Probability, Random Variables, and Stochastic Processes; McGraw-Hill: New York, NY, USA, 2002. [Google Scholar]
  48. Zachary, D.S. The Inverse Poisson functional for forecasting response time to environmental events and global climate change. Sci. Rep. 2018, 8, 11342. [Google Scholar] [CrossRef] [PubMed] [Green Version]
  49. Lethanh, N.; Kaito, K.; Kobayashi, K. Infrastructure deterioration prediction with a Poisson hidden Markov model on time series data. J. Infrastruct. Syst. 2015, 21, 04014051. [Google Scholar] [CrossRef]
  50. Cheung, C.M.; Zhang, R.P. How Organizational Support Can Cultivate a Multilevel Safety Climate in the Construction Industry. J. Manag. Eng. 2020, 36, 04020014. [Google Scholar] [CrossRef] [Green Version]
  51. Lingard, H.; Zhang, R.P.; Oswald, D. Effect of leadership and communication practices on the safety climate and behaviour of construction workgroups. Eng. Constr. Arch. Manag. 2019, 26, 886–906. [Google Scholar] [CrossRef]
Figure 1. Annual engineering accidents statistical information.
Sustainability 14 04430 g001
Figure 2. WSR model of safe prefabricated construction.
Sustainability 14 04430 g002
Figure 3. Evolution illustration of multi-system interdependency.
Sustainability 14 04430 g003
Figure 4. Evolution illustration of multi-risk interdependency.
Sustainability 14 04430 g004
Figure 5. Process diagram on risk probability assessment for prefabricated building hoisting construction.
Sustainability 14 04430 g005
Figure 6. Dynamic evolutions on influence and controllability of risk factors from systems.
Sustainability 14 04430 g006
Table 1. Factors for accidents of prefabricated building components hoisting.
Latent VariableLabelObserved VariableLabel
Wuli System C 1 Hoisting job climate F 1 1
Prefabricated components design and quality F 2 1
Hoisting connection site strength F 3 1
Shili System C 2 Security measures fee F 1 2
Operation process and rules F 2 2
Prefabricated component hoisting safety measures F 3 2
Equipment regular maintenance F 4 2
Renli System C 3 Field security personnel configuration F 1 3
Operator’s operation level F 2 3
Management personnel level F 3 3
Table 2. Occurrence numbers of risk factors within systems under each time node.
Time Framet = 1t = 2t = 3t = 4
System Internal Risk Factors
Wuli   System   C 1 Hoisting   job   climate   F 1 1 5300
Prefabricated   components   design   and   quality   F 2 1 3011
Hoisting   connection   site   strength   F 3 1 0003
Shili   System     C 2 Sec urity   measures   fee   F 1 2 3351
Operation   process   and   rules   F 2 2 1231
Prefabricated   component   hoisting   safety   measures   F 3 2 1221
Equipment   regular   maintenance   F 4 2 0035
Renli   System   C 3 Field   sec urity   personnel   configuration   F 1 3 1021
Operator s   operation   level   F 2 3 3320
Management   personnel   level   F 3 3 2211
Table 3. Interval judgment information on influence effects of operational risk probability from system interdependency under each time node provided by the expert group.
Time Framet = 1t = 2t = 3t = 4
System C 1 C 2 C 3 C 1 C 2 C 3 C 1 C 2 C 3 C 1 C 2 C 3
C 1 0 1 , 3 2 , 5 0 4 , 1 3 , 2 0 2 , 5 1 , 4 0 3 , 1 5 , 2
C 2 1 , 3 0 2 , 4 4 , 1 0 3 , 5 2 , 5 0 1 , 3 3 , 1 0 3 , 5
C 3 2 , 5 2 , 4 0 3 , 2 3 , 5 0 1 , 4 1 , 3 0 5 , 2 3 , 5 0
Table 4. Interval judgment information on risk factor interdependency within and among systems under each time node provided by the expert group.
t = 1
F 1 1 F 2 1 F 3 1 F 1 2 F 2 2 F 3 2 F 4 2 F 1 3 F 2 3 F 3 3
F 1 1 0[6,9][2,4][8,10][7,10][1,4]0[6,8][5,7][7,9]
F 2 1 [5,7]00[8,10][7,10][1,2][1,2][6,9][6,9][7,9]
F 3 1 0000000000
F 1 2 [2,4][1,2]00[3,5][1,4][1,2][2,3][6,9][3,4]
F 2 2 [1,4][2,4]0[8,10]0[5,8][1,3][4,6][5,8][2,5]
F 3 2 [5,8][1,2]0[8,10][4,8]0[1,2][2,4][6,9][2,3]
F 4 2 0[3,5]0[6,8][1,3][1,2]0[8,10][5,8][2,4]
F 1 3 [6,8][2,3]0[8,10][3,4][1,2][1,2]0[8,10][5,7]
F 2 3 [4,7][5,8]0[5,7][2,4][1,2][1,2][5,9]0[2,3]
F 3 3 [6,9][4,7]0[3,6][5,7][4,7][1,2][5,8][6,9]0
t = 2
F 1 1 F 2 1 F 3 1 F 1 2 F 2 2 F 3 2 F 4 2 F 1 3 F 2 3 F 3 3
F 1 1 0[6,9][2,4][7,10][2,3][1,3]0[2,5]0[7,9]
F 2 1 [5,7]0[2,3][8,10][1,2][2,3]0[3,4]0[5,7]
F 3 1 [1,2][1,3]0[1,2][1,2][2,3]0[2,3]0[5,7]
F 1 2 [7,9][1,3][2,3]0[2,3][1,2]0[1,3]0[1,2]
F 2 2 [6,8][2,3][6,8][6,9]0[5,8]0[3,6]0[2,4]
F 3 2 [5,8][6,9][5,8][7,10][2,4]00[8,10]0[5,7]
F 4 2 0000000000
F 1 3 [5,8][6,9][2,3][6,9][3,5][2,3]000[2,4]
F 2 3 0000000000
F 3 3 [6,9][5,8][1,2][5,8][6,8][5,9]0[5,9]00
t = 3
F 1 1 F 2 1 F 3 1 F 1 2 F 2 2 F 3 2 F 4 2 F 1 3 F 2 3 F 3 3
F 1 1 0000000000
F 2 1 0000000000
F 3 1 0000000000
F 1 2 0000[2,4][1,3][1,2]0[4,7][2,4]
F 2 2 000[6,9]0[2,5][1,2]0[5,8][3,4]
F 3 2 000[7,10][1,2]0[1,2]0[8,10][3,5]
F 4 2 000[8,10][2,5][2,6]00[8,10][3,4]
F 1 3 0000000000
F 2 3 000[7,9][2,3][1,2][1,2]00[2,3]
F 3 3 000[6,8][7,9][4,8][2,5]0[6,9]0
t = 4
F 1 1 F 2 1 F 3 1 F 1 2 F 2 2 F 3 2 F 4 2 F 1 3 F 2 3 F 3 3
F 1 1 0[5,10]0[8,10][2,4][3,5]0[2,4][6,9][2,4]
F 2 1 [4,6]00[7,9][3,6][2,5]0[8,10][5,8][8,10]
F 3 1 0000000000
F 1 2 [4,7][1,3]00[1,3][1,3]0[1,3][5,9][2,4]
F 2 2 [4,8][5,8]0[5,9]0[4,7]0[3,6][5,8][3,5]
F 3 2 [4,6][6,9]0[7,10][3,5]00[2,5][7,10][1,4]
F 4 2 0000000000
F 1 3 [4,7][1,3]0[6,9][2,4][4,6]00[7,9][3,5]
F 2 3 [4,6][5,8]0[5,8][1,3][2,4]0[6,9]0[2,4]
F 3 3 [4,7][1,2]0[5,9][6,8][7,9]0[6,10][7,10]0
Publisher’s Note: MDPI stays neutral with regard to jurisdictional claims in published maps and institutional affiliations.

