1. Introduction
Spatial problems might be complex due to the possible number of criteria and objectives involved [
1]. This complexity increases as the decision-making process is implemented in disaster-related emergencies. According to [
1,
2,
3,
4,
5,
6], one of the main reasons for TH delay is due to the time often invested in finding the safest areas for it. On the other hand, fast decision making for site selection might fail due to a wide range of related factors. In this regard, an unsuitable site selection process has already proven to be the cause of failure in previous post-disaster housing programmes, such as the cases of Bam (Iran) and Pescomaggiore (Italy) [
7,
8]. In general, inappropriate site location for post-event temporary housing units (THUs) may lead to short- and long-term problems such as: (1) secondary hazards, (2) expenses, (3) loss of previous communities, (4) effects on the host community, and (5) environmental pollution [
3,
5,
9,
10]. Likewise, THUs could be critical in terms of economic, social, and environmental sustainability pillars [
10,
11,
12].
Mainly, the negative impacts of TH discussed by the researchers related to THUs, which need to be provided after the events [
5], whereas other types, such as rental units, already exist in the affected area. Nevertheless, THUs, which have been used for many recovery programmes in recent decades, could not be refused due to THU benefits and local limitations, such as: (1) other alternatives cannot meet huge demands; (2) pressure from the displaced population (DP), media, and so on, to provide THUs; (3) special conditions and the urgency of the situation (e.g., adverse weather conditions, number of vulnerable DP), which require fast delivery time; and (4) DP reluctance [
7,
9,
11,
13].
THU site location could become a serious challenge due to increased urban populations [
14], especially in areas prone to natural disasters [
15], informal settlements [
4], changing natural disasters [
16], insufficient research on disaster operations management [
17,
18,
19,
20], other area-specific limitations, such as land scarcity, and increasing global concern for environmental sustainability. Thus, regarding the probability of DP growth aftermath following events, as well as adverse outcomes of inappropriate site location for post-event THUs, it is required to help emergency managers select optimal site locations to consider spatial and sustainability-related aims quickly and precisely.
In this regard, the main objective of this research is to present a novel model to select the most suitable site location for THUs using sustainability concepts to meet the 2030 Agenda for Sustainable Development, introduced by the United Nations. This model aims to facilitate the decision-making process while considering multiple and complex variables to be quantified, without compromising the accuracy and representativeness of the results. Consequently, a combination of GIS and MIVES–knapsack techniques were considered to compile a multi-criteria decision-making model meant to provide suitable site locations for THUs. This new approach is applied to four districts of Tehran’s (Iran) metropolitan area to determine the best subset of site locations for THUs. According to the report issued by both the Japan International Cooperation Agency (JICA) and the Centre for Earthquake and Environmental Studies of Tehran (CEST), dangerous seismic events along the Mosha fault in Tehran are expected to occur. The proposed model is applied before the seismic event. Nevertheless, the model can also be applied after the disaster, with slight modifications.
The remainder of this paper is organised into four parts: (1)
Section 2, literature review; (2)
Section 3, the design of the MCDM approach; (3)
Section 4, a case study considering the four districts of Tehran, identifying and quantifying the impacts of a possible seismic hazard; and (4)
Section 5,
Section 6 and
Section 7, application of the model and analysis of results.
2. Literature Review
Chandio et al. [
21] stated that to achieve sustainability goals, it is fundamental to include GIS techniques in decision making. Combining both GIS and decision-making techniques helps stakeholders analyse spatial decision problems [
22]. Carver [
1] confirmed that GIS-MCDM could have an essential role in the site identification and evaluation processes. In this regard, according to [
1,
21,
22], combining MCDM and GIS techniques brings the following advantages: (1) including decision makers’ preferences, (2) guaranteeing experts’ collaboration and engagement, and (3) involving and quantifying huge numbers of indicators and alternatives.
GIS-based approaches incorporating MCDMs to overcome post-disaster-related spatial problems have been already performed. For instance, Hadavi et al. [
23] used the TOPSIS method and GIS to select the site location of TH in district 6 of Tehran. Fan [
24] combined both clustering and spatial data association algorithms to determine suitable site locations for emergency response centres. Kar and Hodgson [
25] designed a model based on GIS and weighted linear combination to specify the most appropriate evacuation shelters for the aftermath of hurricanes. Yau et al. [
26] conducted a research study to determine site location suitability for post-disaster transitional housing using GIS, 3D building models, and construction project management. Kocatepe et al. [
27] suggested a GIS-based optimisation model to select appropriate shelter locations for the displaced population aged over 85 with special needs and/or with pets. Chen et al. [
28] presented a GIS-based hierarchical location model for post-earthquake shelter locations. Li et al. [
29] designed a model based on a combination of GIS and a hierarchical model to select post-disaster shelter in urban areas. Moroto et al. [
30] used a GIS and logistic regression model to specify influential factors in selecting locations for NGOs’ projects during the disaster management process. Shi et al. [
31], believing that the provision of urban emergency shelters is an essential part of disaster management, designed a model based on GIS and a weighted Voronoi diagram to obtain optimal solutions. Kılcı et al. [
32] combined GIS and integer linear programming to allocate temporary shelter locations. Xu et al. [
33] presented a multi-criteria method GIS for evacuation shelter locations. Cetinkaya et al. [
34] prompted a GIS-based fuzzy analytic hierarchy method and TOPSIS to determine refugee camps.
The aforementioned GIS-MCDM hybrid models are intended to specify suitable zones so that decision makers can select the sites (inside the zones). Nonetheless, few of these models embrace stakeholder satisfaction objectively and, if so, quantification is rather subjective. Moreover, there are few, if any, studies that consider all pillars of sustainability, such as environmental and social, as a whole. Furthermore, Ma et al. [
35] and Abid et al. [
36] mentioned the need to combine intelligent optimization algorithms with GIS to deal with this decision-making problem due to the number of variables involved and the complexity associated with its quantification. However, few studies in THU site selection areas applied intelligent optimisation.
Several decision-making methods have been combined with GIS to solve spatial problems. However, MIVES, which has already been applied successfully in several different fields, such as post-disaster housing management (e.g., [
9,
10]; more publications that applied MIVES for other fields are listed in
Section 3, Methodology), has yet to be used with GIS. Meanwhile, MIVES is a sustainability assessment method with remarkable features, such as being based on utility theory. These features of MIVES, which are explained in the next section, enable decision makers to achieve more accurate results regarding the sustainability concept (see [
37] for more information about the advantages of MIVES over other methods).
4. Case Study (Earthquake in Tehran)
The four districts (2, 3, 6, and 7) of Tehran (
Figure 4) among 22 districts, capital of Iran, in the aftermath of a seismic event at the Mosha fault are considered as a case study. The Tehran megacity (35° N, 51° E at the high altitude of 900 to 1800 m) is the highest populated city (8.8 million citizens and up to 15 million inhabitants in the whole metropolitan) in Iran. There are several faults in Tehran. The main active fault is the Mosha fault, which is close to the case study districts. These four districts, which have diverse characteristics, such as population density, facilities, households, etc. (
Table 2), represent all districts of Tehran. The data were collected from a report by the Japan International Cooperation Agency (JICA) [
74] and the Centre for Earthquake and Environmental Studies of Tehran (CEST), as shown in
Table 2.
According to the JICA and CEST study (2000), in the case of an earthquake with the expected intensity occurring during the day, the number of DP from the four districts would exceed 160,000 people. In this research study, it is assumed that the total area of all the required sites should be sufficient to settle one-third of the DP, whilst the remaining two-thirds of DP could be accommodated in other types of TH.
Additionally, in order to increase the number of alternatives and potential subsets as well as the complexity of the problem, it was assumed that some sites would be located outside the city centre, close to entry roads, and that half of the DP would be settled there, whilst the other half would be settled on alternative sites in the city centre. This required a total area of nearly 100 hectares. In this study, a required area of almost 20 m
2 per person was obtained, based on the possibility of using multi-storey THUs due to land scarcity in Tehran. Nonetheless, 30 and even 45 m
2 per person was considered to be the required area by [
54,
75].
Table 2.
Relevant information of the four studied districts.
Table 2.
Relevant information of the four studied districts.
| | Case Study Districts | Reference |
|---|
| District 2 | District 3 | District 6 | District 7 |
|---|
| Area (ha) | 4701 | 2922 | 2137 | 1534 | [74,76,77,78] |
| Population (No.) | 707,119 | 333,621 | 255,270 | 312,500 | [45,77] |
| Population density (pers./ha) | 150.42 | 114.18 | 119.45 | 203.72 | [77] |
| Green area (m2/pers.) | 20.64 | 15.72 | 12.37 | 4.4 | [77,78,79,80] |
| Medical services (m2/pers.) | 0.56 | 1.46 | 1.69 | 2.03 | [74,77,81] |
| Police stations (pers./NO.) | 20,203.40 | 8554.38 | 3272.69 | 6009.62 | [74,77,80] |
| Fire stations (m2/pers.) | 0.0143 | 0.0190 | 0.0258 | 0.0117 | [77,80,82] |
| Schools (m2/pers.) | 735 | 586 | 795 | 431 | [77,80] |
| Cultural | 0.04 | 1.06 | 0.6 | 2.96 | [77] |
| Infrastructure | 0.21 | 0.26 | 0.55 | 0.13 | [77] |
| Level of urban development (%) | 77.94 | 89.96 | 9.91 | 72.48 | [79,80] |
| Damaged buildings proportion (%) | 11.1 | 16.4 | 12.7 | 12.8 | [74] |
| Causalities (%) | 0.10 | 0.20 | 0.20 | 0.20 | [74] |
5. The New Model Application
After defining the requirements and boundaries (
Figure 1), the initial GIS model is applied to the four districts of Tehran to determine possible alternatives. In this section of the study, the initial indicators, including site areas, functions (land use), properties, and location of the lands, were defined based on the problem requirements and boundaries to determine feasible sites among all alternatives in the four districts of Tehran. The total area of alternatives is 1979 ha, whilst the total area of the four districts is 11,294 ha. The areas of the chosen sites ranged from 5.1 to 179.8 ha, as the model searched for alternative sites covering an area of more than 5.0 ha. Available sites could be chosen, provided the sites do not belong to private parties; moreover, sites are not located in conservation areas. Furthermore, chosen sites should meet the other criteria, including connectivity and accessibility. Then, ArcGIS version 10.7 was applied to select possible sites based on the aforementioned selection criteria, using the layers in the geodatabase of the Tehran municipality. A total of 92 alternative sites were introduced, as shown in
Figure 5. All land uses on alternative sites are shown in
Figure 5, such as parks and green areas, educational, military, mixed-use, hospital, recreational, and other purposes. Some of these sites would need to be prepared before use; nonetheless, some of them were already being used for other functions.
The second part of the model, consisting of combining MIVES–knapsack and GIS, is designed to determine the most suitable alternatives from a sustainability perspective. As previously mentioned in
Section 4, the total area of alternative sites (individuals or sets) should be almost 100 ha. To increase the number of potential alternatives, a slight variation of ±5% (100 ± 5 ha) was also considered as valid.
To assess the
SI of the subsets, value functions were fixed to quantify the satisfaction of each indicator gathered in the DMT (
Figure 2). Coefficients and boundaries (
Xmin and
Xmax) were established for the indicators (
Table 3 and
Table 4) based on data from the literature, international guidelines, Iranian standards, and seminars delivered by experts. The resulting value functions took the following shapes: seven decreasing, including three convex functions (DCx), one concave (DCv), and three S-shaped (DS), and eight increasing, including eight S-shaped functions (IS).
A point-assignment system was applied for I6. Furthermore, it should be emphasised that the sub-indicator weights were considered to be the same for the access indicator (I2) and neighbourhood acceptability indicator (I5) regarding weights assigned by experts in the seminars.
The weights were allocated to the indicators using two approaches: (1) assigned by experts using the analytical hierarchy process (AHP), with the resulting weights (average values) presented in
Figure 2, and (2) Shannon entropy (SE). The weights (
λi) were determined by holding meetings and seminars with professors from the Universitat Politècnica de Catalunya (UPC) and Universitat Internacional de Catalunya (UIC) and experts from the Tehran Disaster Mitigation and Management Organization (TDMMO). The coefficients of variation for each
λi did not exceed 10%; excluding outliers, which were eliminated.
Furthermore, to verify the adequacy of the model and minimise sources of error when assigning weights, these were previously estimated by SE using two approaches: (1) considering the indicator weights assigned by the experts (SE/AHP) and (2) disregarding the weights proposed by the experts (SE/NW).
The computational framework consisted of running the model three times with the same input data, each run with the sets of weights resulting from applying each of the aforementioned techniques. Indeed, the model is applied to select the most suitable alternatives among all 92 alternative sites and wide range of possible sets. All possible sets, formed by a combination of different sites, are assessed provided that all these sets meet the first condition mentioned in
Section 3. To calculate the value of indicators I
1–I
7 for each alternative (
), the information derived from GIS is automatically used whilst the remaining coefficients and parameters are specified as input data for the model (
Table 2 and
Table 3). The algorithm seeks suitable sets by optimising
SI (three pillars of sustainability) for individual sites, considering weights assigned to indices.
6. Result and Discussion
The results obtained from applying the model, considering different weighting approaches, are shown in
Table 5. The top-five ranked subsets presented in
Table 5 were obtained with the three different weighting techniques (AHP, SE/AHP, and SE/NW). The suitable alternatives resulting from the model make it possible to confirm that a wide range of feasible sites was obtained. Consequently, the results should be rigorously analysed to select the most suitable subset.
The
SIs of the highest-ranked subsets (A
1, B
1, and C
1), which were selected based on the three different weighting techniques, are 0.85, 0.98, and 0.93, respectively. As shown in
Table 5, the alternative sites (S
28, S
33, S
40, S
44, and S
47) were chosen to be the most sustainable by the algorithm for all subsets (A
1, B
1, and C
1), independently of the weighting technique (AHP, SE/AHP, and SE/NW). In this case, most sites from subset A
1 are from the common sites (S
28, S
33, S
40, S
44, and S
47) compared with B
1 and C
1. This is also reflected in
Figure 6, which makes it possible to confirm that the frequency of sites (S
28, S
30, S
33, S
34, S
40, S
44, and S
47) is higher than other sites considering the top-five ranked subsets. From the aforementioned high frequency selected site, three sites (S
33, S
44, and S
47) were selected for each of the top-five ranked subsets of the three weighting techniques.
The alternative sites (S
28, S
33, S
40, S
44, and S
47), which were chosen to be the most sustainable by the three weighting techniques, have already been used for other functions. The current use of these lands is educational (S
28 and S
47), medical (S
33 and S
44), and one site is military (S
40). These results demonstrated that the model works properly, as the sites, which have been used before the events, mostly could achieve high satisfaction values of the three pillars of sustainability (economic, social, and environmental). Additionally, it should be noted that these five sites are located within district 6, coinciding with the central area of the four districts (
Figure 5). As already shown in
Table 2, district 6 has a privileged situation in terms of fire stations, police stations, schools, and infrastructure. Meanwhile, this district presents a lower urban development degree in comparison with the other three districts.
The sites of subset A
1, which were selected based on the AHP weighting technique, were located within the three districts (3, 6, and 7); the other techniques led to selecting the sites located within the two districts (6 and 7). Among the sites of the first-ranked subsets (A
1, B
1, and C
1), there was no site selected from district 2, as shown in
Figure 7. This could be due to some weaknesses of this district, such as high population density and low number of emergency services per capita. It should be mentioned that this district could be affected slightly compared with the other case study districts, and consequently, this district has a lower number of DP. In this case, there is a paradox in selecting suitable sites for this district. On the one hand, lower damage leads to less need for site locations for DP; however, DP from other districts could be settled in this district. On the other hand, according to several previous research studies, DP would prefer to stay close to their damaged properties. In this regard,
population coverage (I
3) was determined to make greater coverage based on DP distributions to overcome this problem. Thus, most of the selected sites are located on the border of the four districts, as shown in
Figure 7. Nevertheless, it is required to consider this paradox mentioned above specifically in future studies.
The areas of high selected frequency sites (seven sites) range between 5.36 and 20.53 ha. All satisfaction values of I
1, I
4, and I
6 (from the economic, social, and environmental requirements, respectively) for the seven sites are maximum (1.0), as shown in
Table 6. Among these seven alternatives, S
30 has the highest satisfaction values for SBI
1 and I
3. Additionally, five sites (S
28, S
30, S
33, S
34, and S
40), located in district 6, obtained the highest satisfaction values for SBI
3, SBI
4, SBI
5, SBI7
1, and SBI
8. S
40 and S
47 achieved the best satisfaction values for SBI
2 and I
7, respectively. Additionally, it should be mentioned that the current use of these lands is educational (S
28 and S
34), one site is military (S
40), and the others are medical (S
30 and S
33).
As shown in
Table A1,
Table A3 and
Table A5, both satisfaction values and
SIs of the highest-ranked alternative sets using the three weighting methods are presented to implement sensitivity analysis on the indicator weights. According to Triantaphyllou and Sánchez [
90], sensitivity coefficients of indicators and sub-indicators are determined, as shown in
Table A2,
Table A4 and
Table A6. More detailed descriptions of the sensitivity coefficient have been reported elsewhere, such as [
90]. The results in
Table A2 confirm that the most sensitive indicator based on the AHP weighting technique is I
7, and the least sensitive is SBI
1.
Table A4 demonstrates that the most sensitive indicator based on the SE/AHP weighting technique is SBI
9, and the least is SBI
4. The results in
Table A6 show that the most sensitive indicator based on the SE/NW weighting technique is SBI
9, and the least is I
7. In general, the results of these three weighting techniques are different.
In this regard, the weights assigned to the indices by the three techniques are assessed. As shown in
Table 7, the weights assigned to the indicators by the SE/AHP method cannot be reliable due to the weight allocated to I
1. Although almost all the experts ranked this indicator at the first level, the weight of this indicator could not be 79%, and the rest of the indicators could be only 21%.
To this end, the results of SE/AHP have been eliminated from the final analysis. As shown in
Figure 8, the weights assigned to the indicators by the two techniques (AHP and SE/NW) are considerably different for some indicators, for instance, I
7. In this regard, the weights of the AHP, SE/NW techniques, and the average weights (AW) of these two are considered, as shown in
Figure 8.
Then, the model with the same input data, except the weights assigned to indices by the aforementioned average weights (AW) is applied to the 92 alternative sites to select a suitable subset. As shown in
Table 8, a subset (D
1) with the
SI of 0.8899 has been selected as the best solution. The subset D
1 includes all high-frequency selected sites (S
28, S
30, S
33, S
34, S
40, S
44, and S
47). The
SI of D
1 is ranked between the
SIs of A
1 and C
1; however, the total area of sites in this subset (D
1) is closer to the exact chosen area.
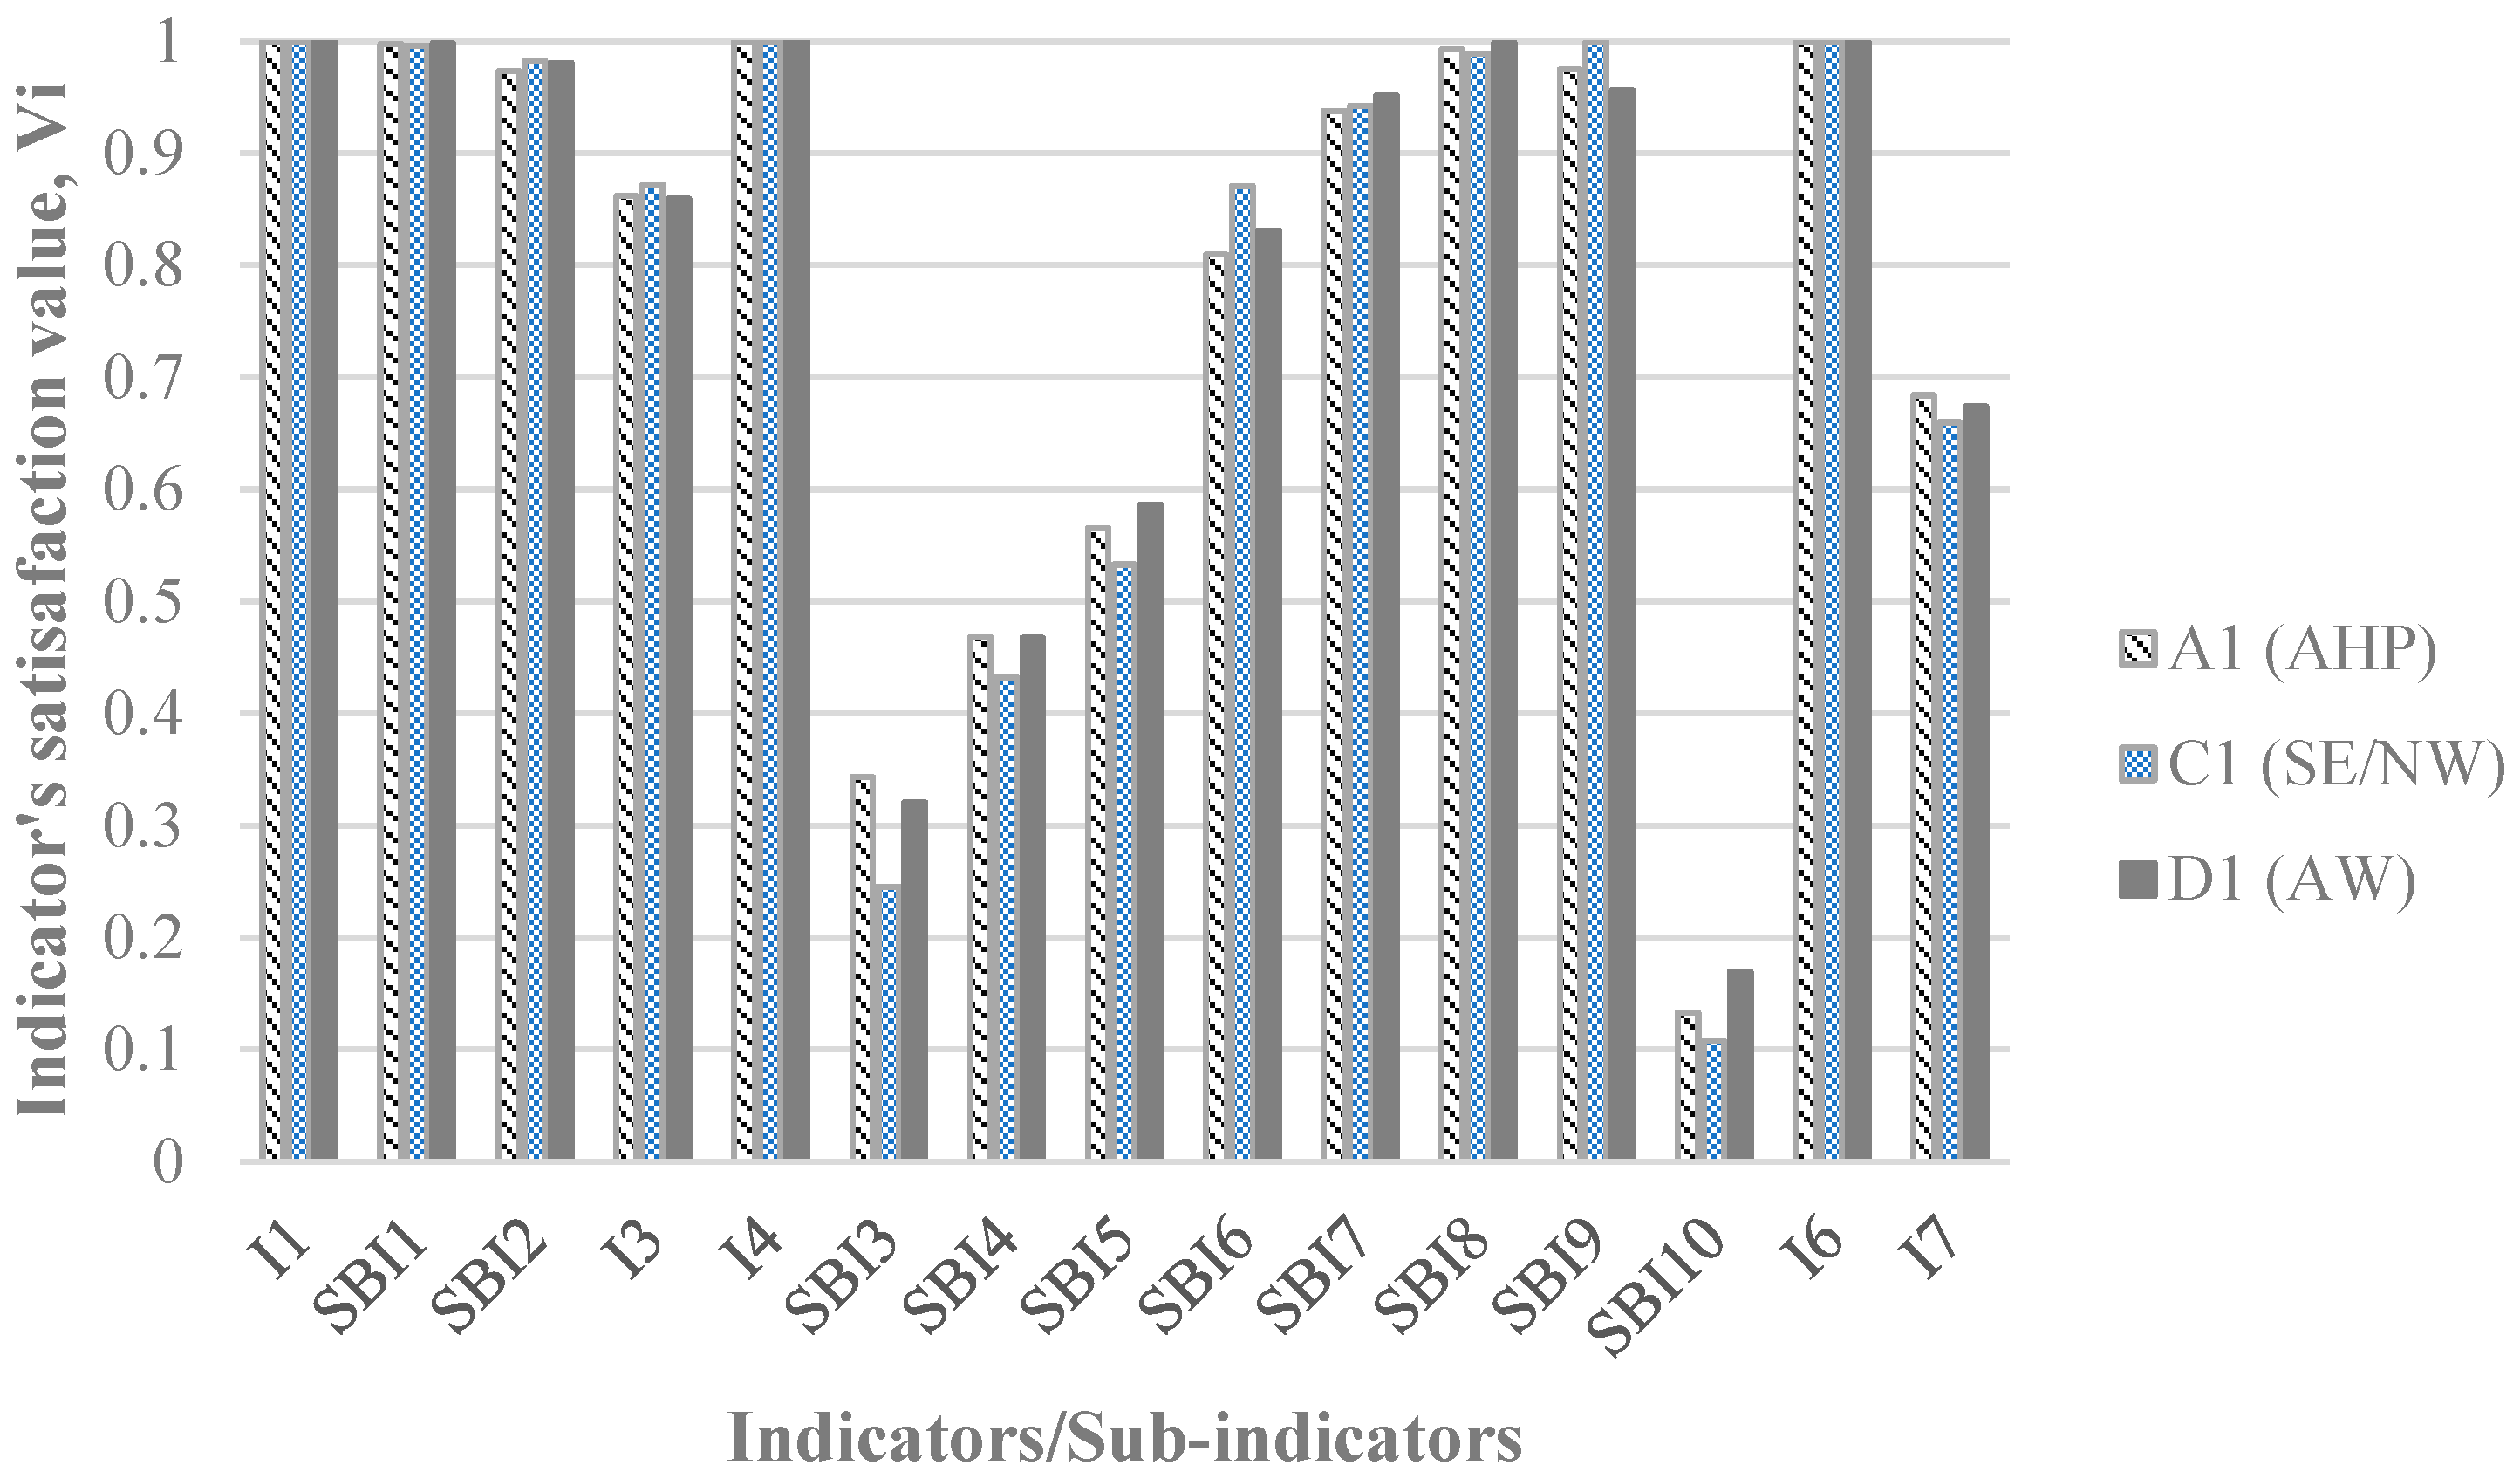
Figure 9 shows the indicator and sub-indicator values (
Vi) of the highest-ranked subsets by the AHP, SE/NW, and AW methods. In this case, it should be noted that no weights were applied.
Vi can be understood as the satisfaction index associated with each indicator.
As shown in
Figure 9, the highest numbers (seven) of indices (an indicator and sub-indicators) with the minimum satisfaction values are concerned with subset C
1, which was selected by the SE/NW weighting technique. These seven indices are SBI
1, SBI
3, SBI
4, SBI
5, SBI
8, SBI
10, and I
7 from subset C
1. In contrast, the highest numbers (five) of indices with the maximum satisfaction values belongs to subset D
1, which was selected based on the average weights (AW). These five indices are SBI
1, SBI
5, SBI
7, SBI
8, and SBI
10 from subset D
1; all the indices are related to the social requirement. Subset A1, which is the highest ranked regarding the AHP weighting technique, has three indices with the highest satisfaction values (SBI
3, SBI
4, and I
7).
In general, according to the aforementioned findings, results from a model tend to be more reliable when experts are somehow involved in assigning the weights to the indices. Additionally, although satisfaction values for some indices correspond to the weights allocated to these indices, it is not possible to generalise this issue to all indices.
Based on the analysis of results, it can be concluded that the proposed model, which is made by the combination of GIS and the MIVES–knapsack approach, could be a robust decision-making model for the configuration of post-disaster housing sites. Furthermore, applying the average weights (AW) derived from AHP and SE/NW weighting techniques could lead to more suitable results.


