Abstract
The article covers issues related to the selection of a management strategy for the operation of technical infrastructure. It contains the approaches, methodology and a general model of the system of operation of the Maintenance Services of the LOTOS Group production company, which is an example of a large oil concern. Nowadays, an increasing aspect is put on the efficiency of individual repair processes, as well as the operation of equipment. Doubts often arise as to which strategy is the right one and which one to choose. With numerous machines, there are problems related to work planning and optimal use of resources. In addition, there are frequently difficulties in identifying the devices that interfere with the processes. The aim of this article is to present the maintenance strategy of the LOTOS production company and to introduce a procedure that allows for the assessment of the efficiency of machinery and equipment operation. It includes a method extending the identification of “Bad Actors” used so far, based on data from the ERP (Enterprise Resource Planning) system, with a solution based on reports made after device repairs. MTBR (Mean Time Between Repair) coefficients were calculated for particular Complexes, Plants and Machines, which allowed for the identification of troublesome areas and the most difficult devices in production processes. This made it possible to select the equipment that should be repaired in the first place. After the implementation of the method and service activities, a decrease in the number of problematic machines was observed.
1. Introduction
Maintenance is one of the most important areas of activity of production companies because it is up to the Maintenance Services to ensure the availability of technical infrastructure, i.e., to maintain the continuity of production lines and reduce downtime resulting from failures or periodic inspections. The operation of the plants depends on whether the machines and production devices are repaired in an effective manner because only such activities enable high throughput capacity, high-quality products and increase work safety. This subject is extremely important because production companies are expected to maximize profit at the lowest possible cost [1], and losses can be offset by properly trained employees providing maintenance and repair services.
Overhauls, repairs and adjustments as well as any other measures to prevent failures of production plants require a specific action plan. A maintenance strategy is a sequence of decisions necessary to be carried out in order to be able to maintain production capacity [2]. Maintenance services should therefore follow the previously established strategy and procedures, which will allow for the removal of faults in a standardized manner. Importantly, these strategies are constantly evolving because, with the acquired experience and skills to find weaknesses and improve repair processes, it is possible to constantly develop and introduce appropriate innovations. With many years of practice of engineers and management staff, differentiated and individual repair approaches based on selected strategies have usually been developed. The following maintenance strategies are most commonly used in manufacturing companies: reactive, preventive, condition-based, predictive, production-integrated, reliability-oriented and prescriptive.
The reactive strategy consists of service works carried out only when a fault or failure occurs. It is characterized by low costs to be incurred for maintenance, control and diagnostics [3]. It is practiced mainly for machines that are less important in the production process, which do not generate such large losses in the event of a standstill. This strategy is common in enterprises where individual and small-lot components are manufactured.
Preventive maintenance is characterized by the operation of Maintenance Services based on plans and schedules, e.g., resulting from the manufacturer’s technical and operational documentation [4]. It includes activities that should be taken at specified intervals or after the device has worked a given amount of time [5]. Some of the production companies adjust these assumptions to their own needs, based on their experience with the use of technical infrastructure [6].
Condition Based Management (CBM) strategy is based on data collection using devices, incl. such as: vibration analyzers, pyrometers, thermal imaging cameras, which makes it possible to perform vibroacoustic diagnostics or thermovision. Such scheme allows a team of specialists to analyze and evaluate the current technical condition of a given device [7,8].
The predictive approach (PdM) is also based on collecting and analyzing large amounts of data, which are taken directly from machines from production plants. However, the key difference between CBM and PdM is the prediction failure mechanism. On the one hand, we are dealing, respectively, with models in the form of simple mathematical formulas, considering the influence of several operational factors, developed with the participation of a team of experts, and on the other hand, with the concept of a digital twin and statistical modeling techniques taking into account the aspects of Machine Learning (ML) and the Internet of Things (IoT) [9]. PdM allows, based on historical data and current failure analysis, to continuously improve models and predict downtime with greater efficiency and take into account the changing conditions in production [10]. Usually, this strategy is practiced on critical enterprise machines.
Total Productive Maintenance (TPM) is a concept aimed at increasing the stability of production processes, extending the service life, and reducing the maintenance costs of production equipment. It is considered a holistic system because it concerns the entire production and repair process and blurs the boundaries between production and the service area [11]. Production workers are more involved in taking care of the technical condition of machines and devices through simple operating activities such as lubrication, cleaning and capturing irregularities in the work. Activities improving the organization of work with the machine, keeping maintenance standards and properly trained operators provide a good basis for proposing improvements, e.g., Kaizen ideas [12] and for increasing the Overall Effectiveness of Equipment (OEE), which is an indicator of the effectiveness of this strategy [13]. OEE monitoring allows for the identification of waste and the determination of the nominal efficiency of the use of machinery and production equipment [14].
The methodology in the field of maintenance focused on reliability (RCM-Reliability Centered Management) is based on determining the necessary activities in the operational efficiency of a device or machine, taking into account the conditions of use [15,16]. Therefore, the importance of individual technical objects for the entire production process is assessed, as well as their working conditions, technical condition and history of use. This strategy is widely used to achieve and establish certain standards in the field of operational safety by changing procedures, operational activities and repair plans. Proper implementation of RCM leads to increased cost efficiency, machine uptime and a better understanding of the level of risk in maintenance [17]. This strategy uses analytical tools, the most popular of which are: Failure Mode and Effects Analysis, Fault Tree Analysis, Critical Analysis, Root Cause Failure Analysis and Bad Actors identification.
The prescriptive strategy is the development/improvement of the predictive approach, in which the system (by collecting data in real time) calculates the estimated time of operation of the device until a failure occurs. In the prescriptive concept, it is possible to obtain information on how to avoid failure and what its consequences may be [18]. It also uses: Internet of Things, Machine Learning, Big Data analysis methods [19] and Artificial Intelligence methods [20]. The prescriptive strategy assumes that it is IT systems integrated with machines that will provide timely and accurate reports on the technical condition of devices, which will allow the company’s management to effectively control production, manage safety, plan downtime and generate precise and timely repair orders for Maintenance Services [21]. The main goal of this strategy is to reduce operational risk and eliminate the prescriptive approach based on planned repair.
Sustainability is one of the two most important factors of the Smart Manufacturing or so-called Industry 4.0, which is defined as a subset of the smart manufacturing system represented by self-learning and smart machines that predicts failure or as the application of machine learning by applying advanced analytic techniques or big data about technical conditions [22]. Due to the increase in digitalization and automation, we can nowadays collect data by using Internet of Things. Digital files stored in cloud services enable using fuzzy logic, neutral networks, evolutionary algorithms and machine learning. Data-driven predictive maintenance strategy may be developed by usage of deep neural structure called long short-term memory (LSTM), which allows the underlying time series patterns for predicting the failures and reflecting the degradation trends solves the instantaneous maintenance decision-making problems [23]. An important influence of maintenance is described in another empirical study on the impact of maintenance function on more sustainable manufacturing processes [24]. After identification of ten factors of maintenance activities, chosen from the sustainable manufacturing point of view, the matrix MICMAC (the matrix of crossed impact multiplications applied to a classification) was carried out to categorize maintenance factors. Application of the fuzzy analytic hierarchy process (F-AHP) enables creating an input for the fuzzy technique for order preference by similarity to an ideal solution (F-TOPIS). The analysis showed some of factors the most important and influential, for sustainable manufacturing. Factors such as: usage of data collection, preventive and prognostic service strategies and planning of the modernization of machines and devices are related to Industry 4.0 and its most known aspects that influence the social, environmental and economic aspects of manufacturing.
To sum up, all the strategies described above are characterized by a different approach with some common elements, which depend on many factors: economic, technical and organizational. It can therefore be concluded that the selection of an appropriate strategy is one of the key elements in the management area of maintenance, which can significantly optimize expenses in a production company [25], as well as reduce the number of failures to the level acceptable to the company. When selecting the procedure, it is important to determine the balance and find the optimal point between the costs of maintenance and the added value in the form of knowledge (information) about the technical condition of machines, which will allow for subsequent preventive actions reducing the number of failures.
The next part of the article presents the strategies for managing the operation of technical infrastructure used in the LOTOS Group production company. The focus was on the reliability elements related to typing “Bad Actors” and new methods related to their identification were presented. It is a very important element in the functioning of all production companies because the precise typing of problematic machines allows for reacting by improving/repairing or replacing the device with a new one. The number of contributions related to maintenance of large oil concerns is relatively small compared to other industrial sectors. With so many infrastructure components, there is a high risk that equipment will be continuously repaired at certain intervals, and this will not be qualified to be a weakness in the overall process. Therefore, it is necessary to implement the system of methods, rules and regulations which allow for identifying problematic devices that interfere with the production process and eliminate the problem. This will allow for improving the availability of plants and production possibilities.
Considering the above, this paper proposes an effective method of finding “Bad Actors” in production installations on the basis of data obtained automatically from reports of repair contractors. This allowed for the conversion of the MTBR efficiency index and the assessment of problematic production areas with frequent maintenance of machines and devices. This method is original as there is no such solution practiced in the maintenance approach. At LOTOS, this allowed, after the repairs were made, to extend the time between them. This approach can be successfully duplicated and implemented in other production companies.
The remainder of this paper is organized in the following order: Section 2 contains an introduction to technical infrastructure and assets of LOTOS Group. Section 3 describes specific maintenance strategies applied at LOTOS for rotary devices. In this section, the advantages and disadvantages of maintenance strategies are underlined and their economic viability is described. In Section 4, the proposed methodology and methods are presented. The identification of “Bad Actors” in the enterprise, as well as the schemes of the currently used methods, are described in detail in Section 5 and Section 6. The Section 5 describes the method which uses the data only from the ERP system, and the Section 6 contains a newly developed scheme consisting of data generated by the repair contractor—LOTOS Service, which allows for efficiency calculations for rotary machines. Finally, the authors’ contributions and further recommendations are summarized and discussed in Section 7.
2. Technical Infrastructure and Assets of the LOTOS Group
Due to its continuous development and significant needs related to the improvement of the efficiency of the works performed and the creation of repair schedules and plans, the LOTOS Group places great emphasis on the constant improvement of the quality of its services. For this purpose, it is necessary to regularly analyze, update and innovate procedures and repair activities. The construction of new production plants and the increase in the number of machines and devices leads to the problem of prioritization of repair activities, as well as to difficulties related to the even allocation of work for service teams and optimization of material resources (transport and cranes, spare parts, etc.). There are forty-four employees performing repair and service work at the Machinery and Equipment Repairs Department (from the mechanical industry). They are divided into three brigades: repairs of pumps, repairs of turbines, compressors and blowers, as well as a brigade of repairs of mixers and fans. Therefore, for each employee in this area, there are statistically several dozen machines, which, with a large number of repair reports that come from all plants every day, leads to work stacks. At this point, difficulties arise with determining the order of repairs, as the situation at the production plants is very dynamic. With such a large number of infrastructure elements, the question arises as to what strategies should be used for specific devices in order to use all resources of the company in the most effective way, minimize the number of equipment downtime and optimize expenses incurred on service and repair works. The importance of choosing the right strategy and its impact on Shell’s Petroleum Development Company costs was presented by [26].
LOTOS Group is an oil concern dealing in the extraction and processing of crude oil and the sale of high-quality petroleum products. The refining activity is carried out in the framework of five basic production plants: the Distillation Unit (PZD), the Fuel Unit (PZP), the Hydrocracking Unit (PZH), the Oil Unit (PZO) and the Hydrogen and Sulfur Production Unit (PZW). Storing and composing products is the subject of activity of Composition and Expeditions Products Unit (PZK), and the filling of products is carried out by Tank Topping Unit (PZC). Energy, steam, water, nitrogen and air—the media necessary for the operation of the plant—are provided by the Power Media Production and Water and Wastewater Unit (PZE), which also includes the sewage treatment plant. In 2019, the EFRA plants (Effective Refining of Oil Processing), i.e., delayed coking unit, was launched. Bitumen is produced by LOTOS Asfalt at plants in Gdańsk and Jasło (industrial, special road, modified bitumens and emulsions) and in Czechowice (MODBIT modified bitumens). Lubricating oils are produced by LOTOS Oil, which has plants in both Gdańsk and Czechowice (industrial oils). Figure 1 shows the scale and complexity of Grupa LOTOS production plants.

Figure 1.
Production plants of Grupa LOTOS in Gdańsk.
At each of the above-mentioned plants, there are plants that include machines and production devices such as: pumps, compressors, turbines, fans, mixers, blowers, etc. The refinery’s machinery park is extremely extensive (Table 1)—there are about two thousand pumps in total, while compressors and turbines are over two hundred, which shows the scale of workload to be performed in order to keep the refinery in good technical condition and prevent the interruption of the production process. Importantly, the development of infrastructure means that the number of technical objects is constantly growing. Table 1 shows the changes caused by development programs: 10+, which in 2009 increased the processing capacity to over ten million tons of crude oil per year, and EFRA for better management of heavy residues, i.e., those crude oil fractions from which heavy fuel oil is produced.

Table 1.
Number of devices in the LOTOS Group.
Each machine has its specific criticality (critical, semi-critical, important, remaining), which may vary depending on the current situation in the plants. The degree of materiality was established using the criteria relating to:
- safety–machines, the consequences of which may be: very dangerous/dangerous/safe;
- significance from the perspective of the unit–machines of: main/medium/small importance;
- significance from the perspective of the plant–machines: very important/important/other;
- probability of failure–machines with: high/medium/low probability of failure;
- refurbishment complexity-machines in need of refurbishment activities: very complex/medium complex/simple.
Table 2 presents the division of rotating machines (pumps, compressors, turbines, blowers, fans, mixers) that were classified and assessed for their criticality.
Table 2.
Classification of LOTOS rotating machines—as of 30 June 2020 (under revision).
In a given area, the devices operate in different systems: e.g., single (no replacement machine), two out of three (two are in operation, one is in reserve) or one of two (one is in operation, one is in reserve), which depends on the current production needs. However, there may be a case where the machine with a lower criticality degree will be more important than the one with the higher one because it is one of the three working on the production line, and it is impossible to start up the backup equipment. It is then necessary to prioritize work, perform a risk analysis and start repairing the technical object that threatens the continuity of production. In a situation where there are no such problems, and the device has its criticality in accordance with the qualified list, the appropriate procedure is adopted: the response time of the Maintenance Services determines the appropriate frequency of diagnostics, purchases/prepares/produces spare parts in the event of failure and possibly prepares repair technology.
3. Operation Management Strategies at the LOTOS Group
The strategy used at the LOTOS Group is a mixed (hybrid) strategy. For parts of machines and devices (mainly electric motors and safety valves), a preventive strategy has been adopted, in which periodic, scheduled inspections are planned, which is aimed at the replacement of individual elements of the device (regardless of the degree of wear) in order to exclude a potential failure and avoid future breakdowns. These activities are also related to legal issues. EX electric motors (used in potentially explosive atmospheres) require inspection within a period of three years. Of course, in the event of a stop, damage, malfunction or even a suspicion that a technical object is not functioning properly, it is sent for verification or repair. It should also be emphasized that, in connection with planned production activities, LOTOS also arranges shutdowns: both operational (e.g., for filter cleaning, regeneration or replacement of catalysts) and technical (turnaround repairs—every four/five years). Shutdowns of plants/units (complexes) create the possibility of performing certain preventive actions, so that, in the future, there will be no stacking orders for maintenance workers. Infrastructure components that are difficult to repair during normal operation are used for inspection and replacement, and their stoppage may result in a reduction in production. This applies to semi-critical and mainly critical machines.
Devices classified as less important from the production point of view as a result of the risk analysis (category of machines—important and other), the repair of which is usually not complicated and the repair time not being long, have been included in the reaction strategy. However, it should be borne in mind that, if the service detects irregularities in the operation, a diagnostician is called in to verify the correctness of the work. This means that there are very few machines running until they stop, i.e., “unattended”.
Diagnostics of the technical condition of the machines, apart from current reports, is also performed on a schedule (Table 3) by specialists from the Quality Control Department dealing with data collection using the “Microlog” type analyzer (measurement of vibrations of bearing nodes and the entire machine set), pyrometers and thermovision (temperature measurement of individual elements of the device). These data are subject to subsequent analysis, which allows for the detection of irregularities in individual components (CBM strategy). Such control is practiced for all types of devices, regardless of their criticality level.
Table 3.
Schedule of diagnostic works for one of the Production Unit-Hydrokraking.
However, it should be noted that, in the case of the CBM strategy, data acquisition may take place in various ways. The first is described above, while the second is collecting data directly from the device with the use of sensors, subsequent signal processing and acquisition of process parameters of technical objects. The analysis takes place in the PHD (Process History Database) system, which is a historical database and enables specific corrective actions to be taken.
Another strategy visible at LOTOS is TPM. In this approach, it is noticeable that production workers are involved in operating elements, so their duties include: control and operation of production plant equipment (capturing faults and irregularities in the operation of machines, refilling oil and maintenance), supervision over the course of technological processes and maintaining order and safety at the workplace.
For some time now, the emphasis has been on reliability. It includes all methods of assessing a technical object, taking into account the operating conditions of the device. The LOTOS company uses Organizational Instructions for risk analysis (probability of an arrest and determination of its consequences) and activities related to the identification of very problematic devices—“Bad Actors”. In addition, the causes of repairs, which resulted in difficulties with the operation of the device (the so-called repeated repairs of the device), are carefully considered. It should be emphasized that these problems may arise not only in connection with improper repair of the technical object, but also in connection with an incorrect attempt to start it or problems with other elements in the entire plant system, which means that these issues are considered more complex.
Due to the large number of different devices and extensive technical infrastructure, some practiced maintenance strategies can be seen in other areas of industries. Typical use in wind turbines include “time-based”, which involves performing maintenance tasks at predetermined regular intervals, and “failure-based”, which entails using a wind turbine until it fails. Sometimes, the RCM and Asset Life-Cycle Analysis method is used to increase the efficiency to identify possible failure modes [27]. In the aviation industry, the approach to repair and maintenance is very conservative in terms of safety. Here, the strategy implies a set of procedures and rules that must be followed in order to generate, plan and execute tasks. In practice, many maintenance activities are performed at fixed time intervals, i.e., according to the time-based strategy. Shorter time intervals of tasks increase the chance of detecting a serious degradation/failure and thus increase safety. Individual parts are replaced preventively, which generates high costs, but passenger safety is paramount [28]. Summing up, it should be noted that there are many strategies for rotating machines at the Refinery, and their selection depends on the criticality of the devices, which determines a specific procedure. Another factor is the cost that must be incurred to maintain the availability of the plant at a high level. Due to possible theoretical losses that may occur after an emergency stop of equipment and production lines, it is a consciously undertaken issue to obtain a high OEE. In order to constantly increase the level of reliability of refining plants, it is necessary to identify “Bad Actors”, which will allow for excluding the most problematic technical objects in the production process, regardless of the strategy used.
4. Methods and Methodology
The proposed research methodology for supporting all operation management strategies at the LOTOS Group, described in Section 3, allows for more accurate identification of “Bad Actors” by employing and combing different methods, as shown in Figure 2. The first method, based on the data obtained solely from the ERP system, was initially implemented at LOTOS in 2005. This method has had to be modified in recent years due to the continuous development of infrastructure, with an increased number of technical objects. In the current approach, the data from the ERP system and the data obtained from reports on completed repairs are analyzed simultaneously. This method uses the conversion of the MTBR efficiency index for the assessment of problematic production areas with frequent maintenance of machines and devices. At LOTOS, this allowed for significantly extending the time between the repairs. The above-mentioned methods are described in detail in the following chapters.
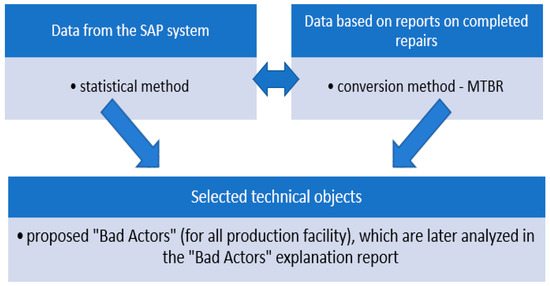
Figure 2.
Methods for the identification and analysis of “Bad Actors”.
5. Method Based on the Data from the ERP System
The method of identifying “Bad Actors” using the data obtained from the SAP ERP (Enterprise Resource Planning) system is mainly used for placing orders, ordering and retrieving materials needed for repair, settlement of commissioned works, post-repair reports, as well as for all accounting activities. It is used by industry engineers, production engineers, maintenance engineers and repair contractors (mainly LOTOS Service), who supply it with data related to the implementation of repairs. The organizational instruction used in the company called: “Identification, monitoring and reduction of “Bad Actors” in the process of maintenance and repairs” allows for the analysis of the list of functional locations in terms of:
- thirty with the highest actual costs (sum of materials and labor) (Table 4);
Table 4. SAP transaction after narrowing down the criteria, thirty orders with the highest actual costs, selected for the Fuel Production Unit on a quarterly basis.
- thirty with the most repairs (Table 5).
Table 5. SAP transaction after narrowing down the criteria, thirty orders with the largest number of repairs, selected for the Fuel Production Unit on a quarterly basis.
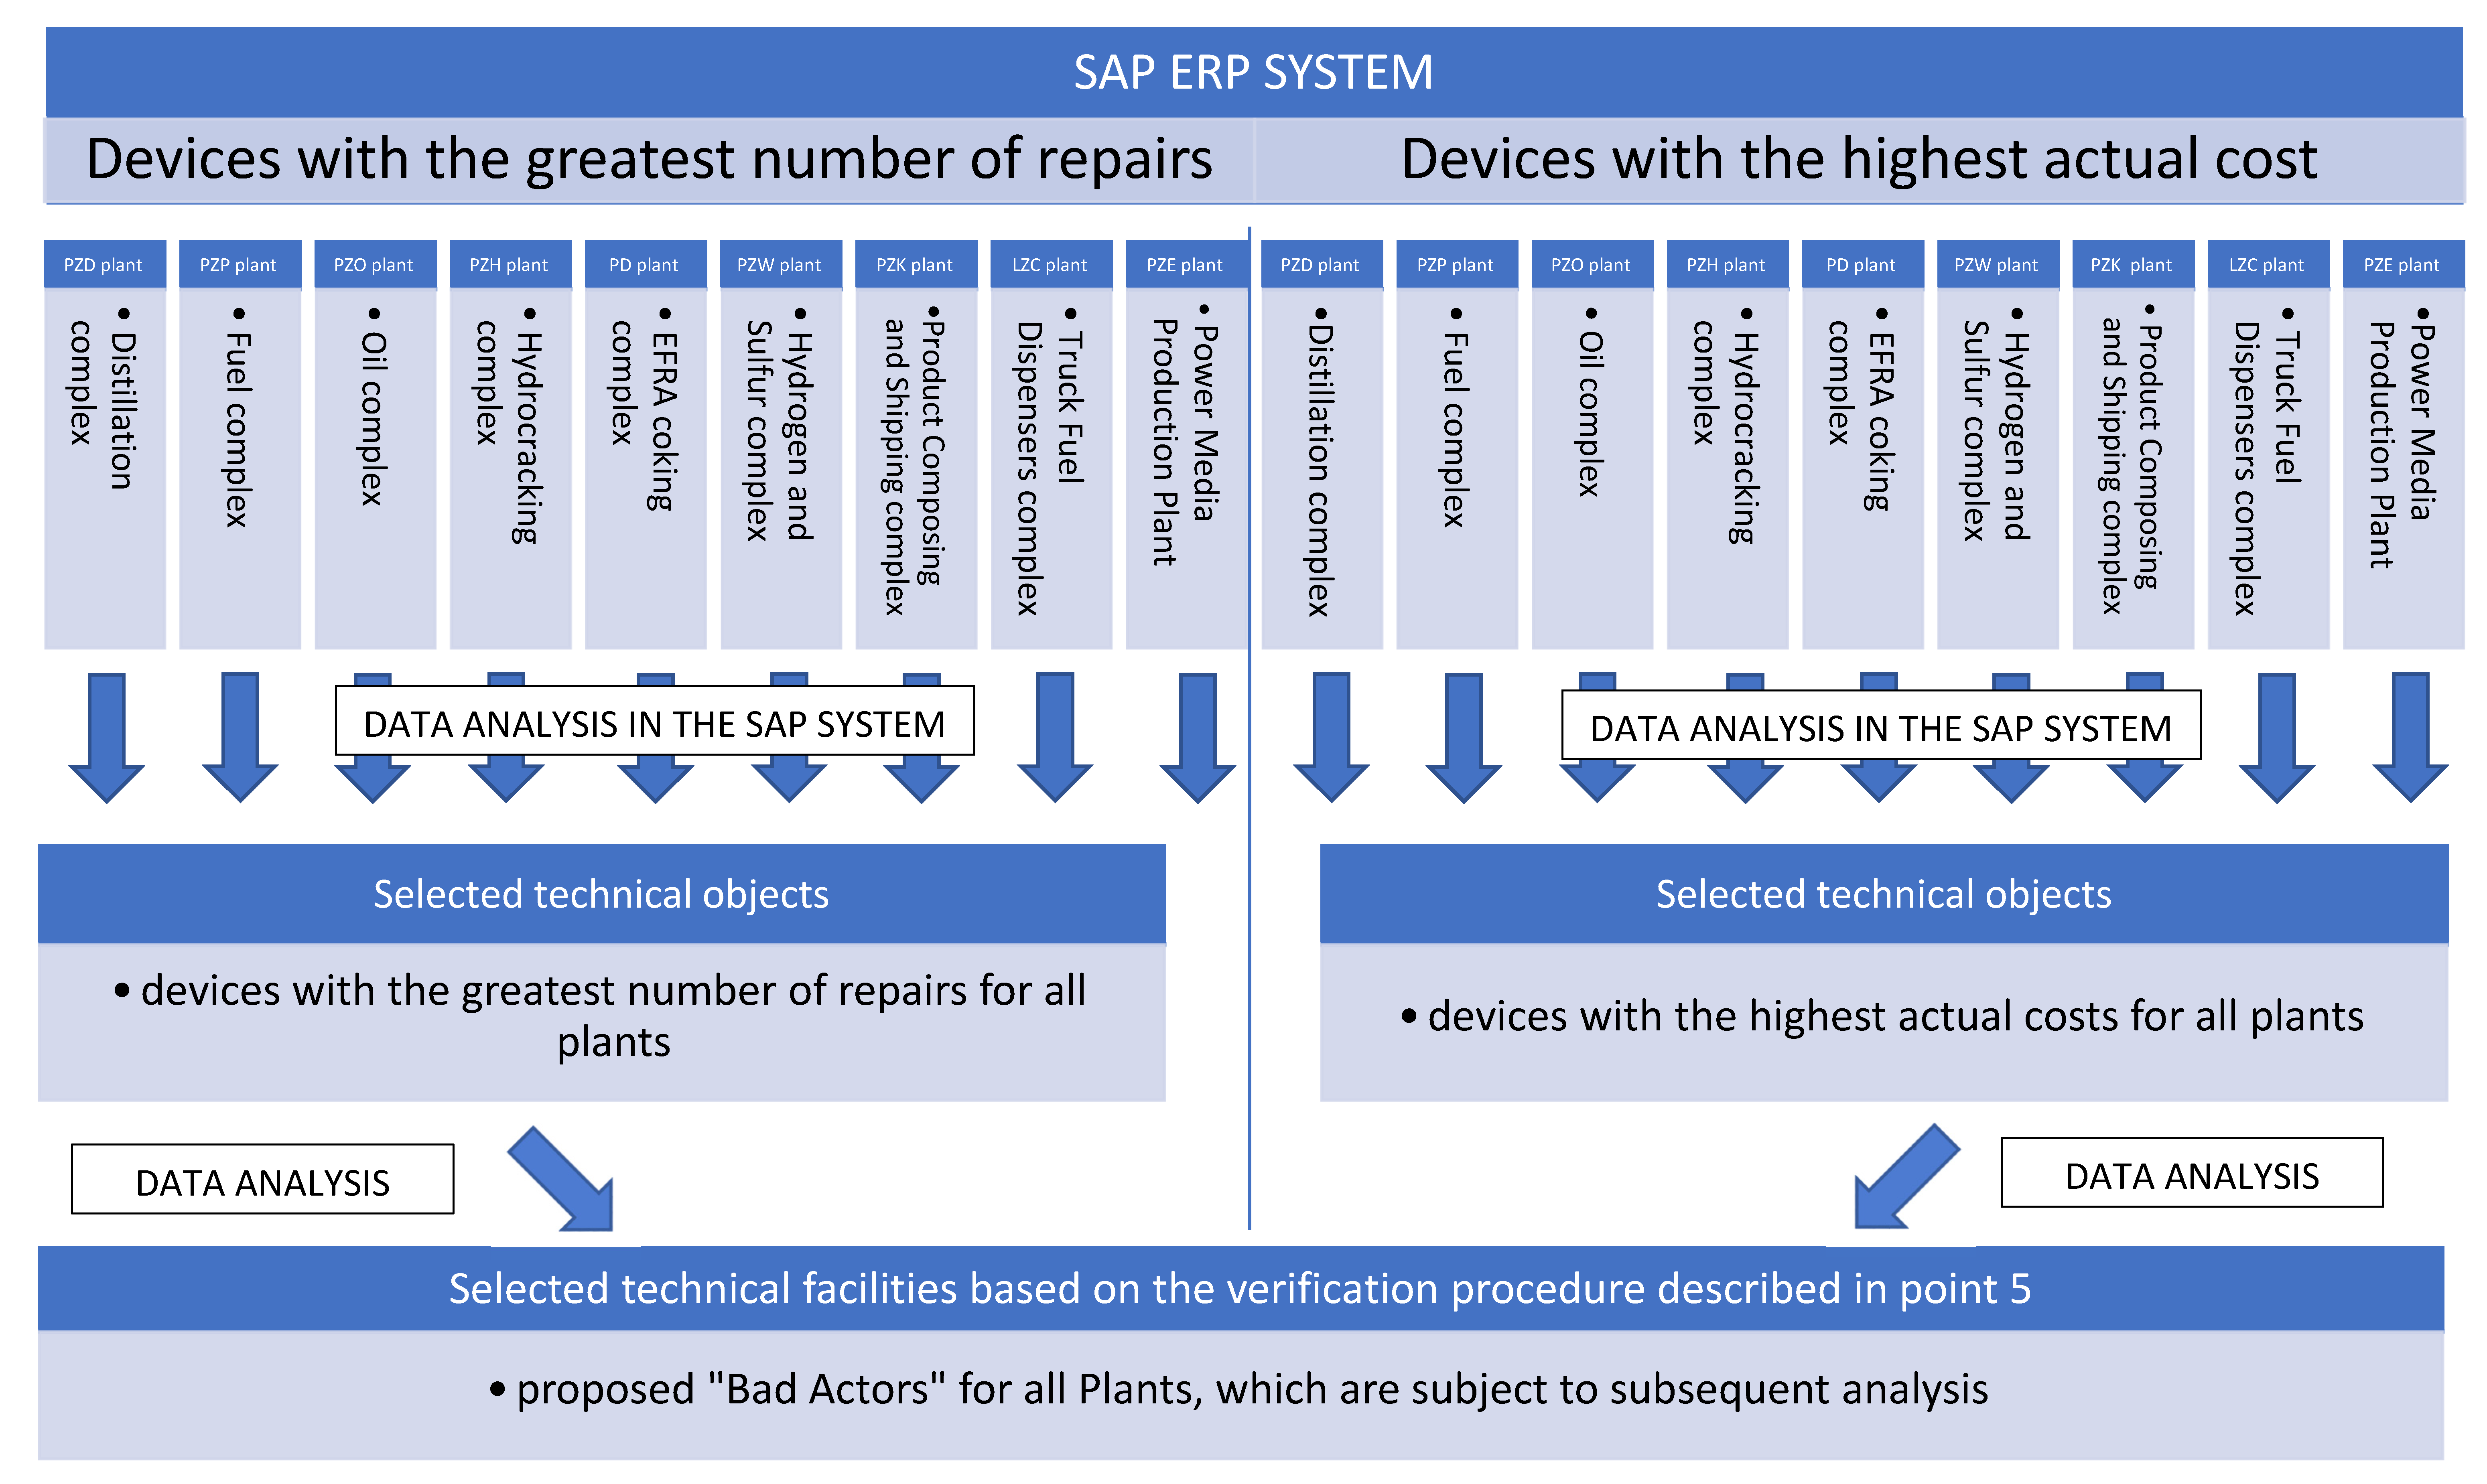
The reliability engineer is responsible for the analysis of all the above data, and the verification procedure is presented schematically in Figure 3. For a certain time period (e.g., annual), the reliability engineer checks, for all Production Units separately, the technical infrastructure generating the greatest costs or the greatest number of interventions. Activities related to selecting Bad Actors” are conditioned by certain criteria:
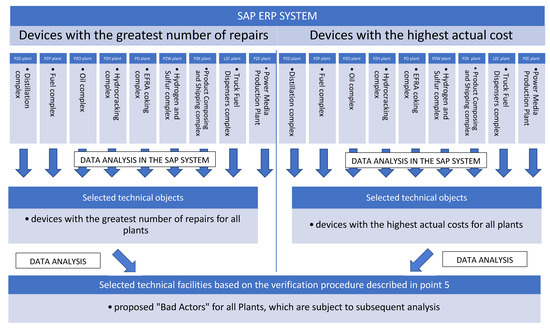
Figure 3.
Scheme of typing “Bad Actors” based on transaction data from the SAP system, included in Table 6.
- the selection of machines and devices is based on the experience and knowledge of the reliability engineer conducting the analysis;
- devices that are regularly repaired (preventive) cannot be taken into account, e.g., during operational shutdowns or downtime repairs;
- single repair works (even very expensive ones) should be ignored in the analysis, as they may result from modernization or repair in which very expensive spare parts were used;
- equipment repairs that are repeated cyclically, where the reports are similar to the previous ones, are important;
- look for devices with a large number of repairs and, based on historical events (repairs), consider whether they should be included in the list of “Bad Actors”.
After the analysis, the reliability engineer sends out the qualification proposal (along with the justification) to the Repair Project Managers responsible for a given Plant, Industry Managers (Mechanical, Electric and Automatic Industry and Machine Department), Managers of Production Plants, as well as to the Director of the Technology Division. (Table 6). This one can be accepted or rejected. If it is accepted (after consultation with the Production Departments), a commission is formed, consisting of people whose task is to explain the causes of frequent failures and to propose solutions aimed at reducing them. These can be: overhaul, modernization, replacement of individual elements or the purchase of a new technical object. An extensive “Bad Actor” explanation report is prepared (usually several dozen pages of analyzes), which includes elements such as:
Table 6.
An example of a list of the proposed “Bad Actors” from all plants on an annual basis.
- description and number of the “Bad Actor”;
- report date;
- plant number and technological code of the Unit;
- date of the report and date of effective liquidation of the “Bad Actor”;
- team leader and team composition;
- description of the reasons for selecting the object as a “Bad Actor”;
- analyzes and tests performed (along with documentation and reports);
- conclusions from the conducted analyzes and research;
- list of attachments.
The sheet for the implementation of the tasks recommended by the commission consists of:
- detailed description of the task;
- criteria for the effectiveness of an implemented recommendation;
- estimated costs;
- proposed methods of implementing the recommendations;
- name and surname of the person responsible for specific tasks;
- task completion date.
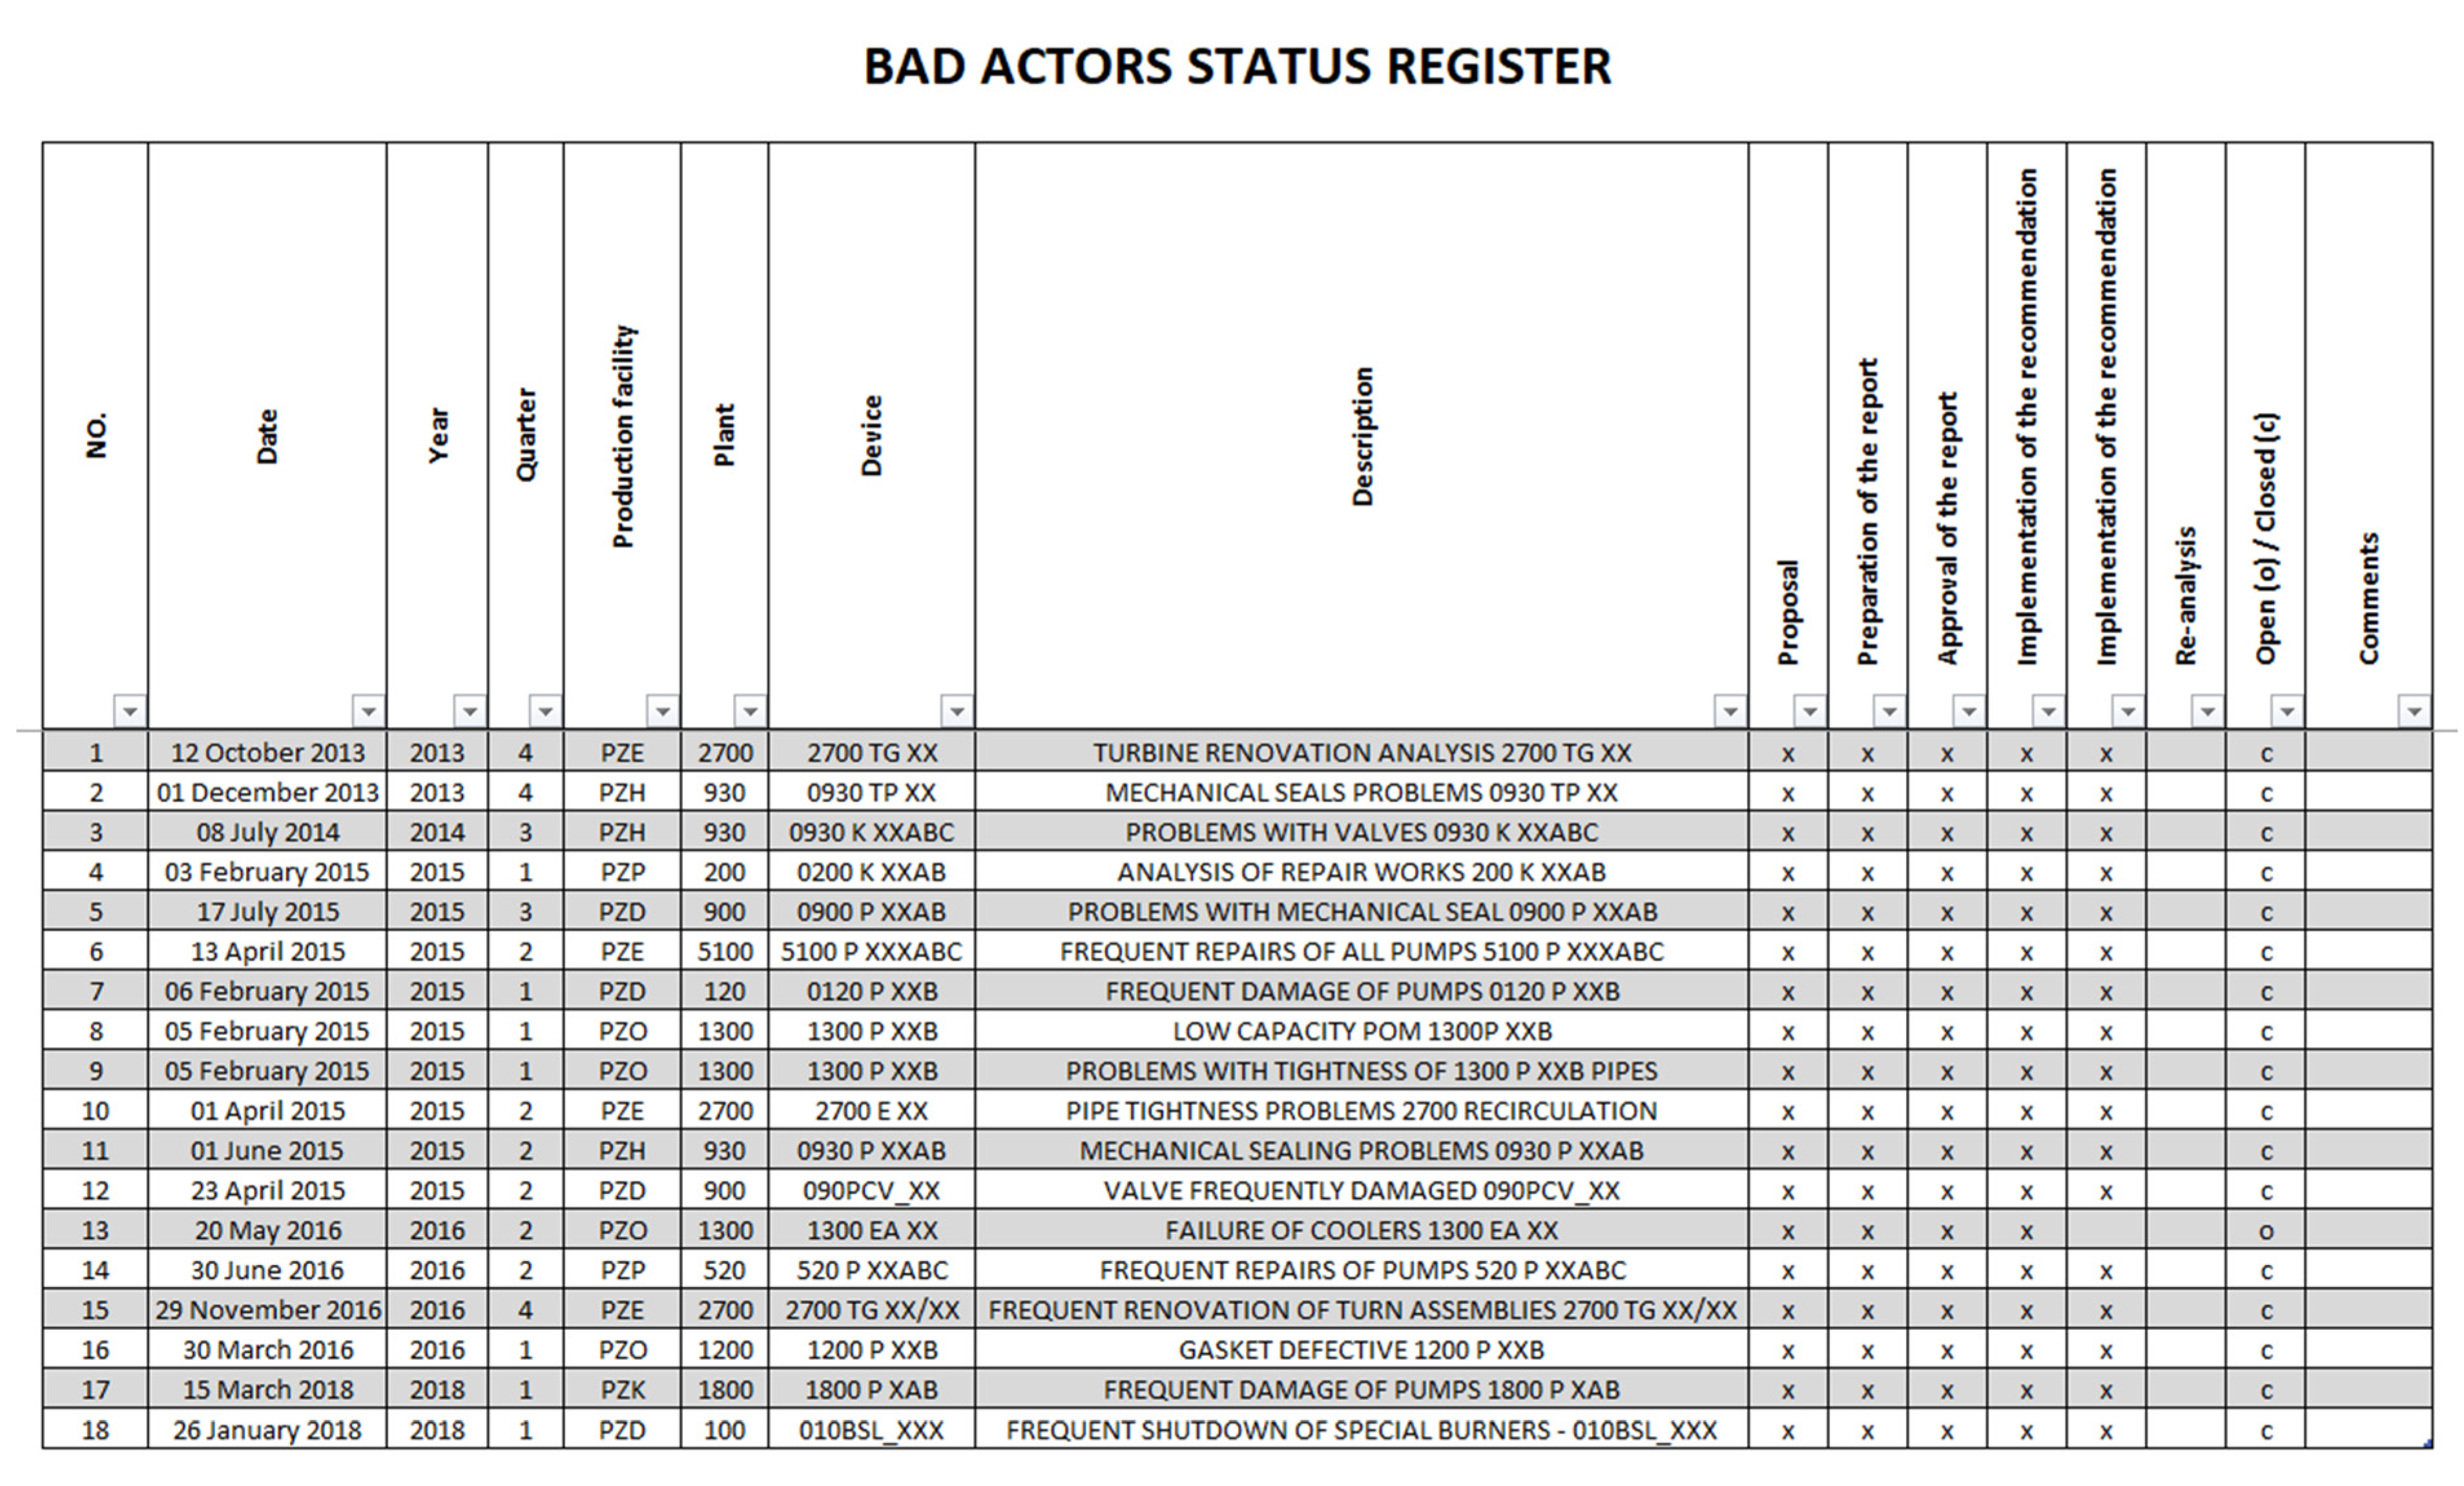
At each stage of the procedure, a status is marked (until the implementation and verification of the solution) in the file, which is a summary of all analyses. This file (Figure 4) is a database of “Bad Actors” (rejected, considered and accepted, and also under analysis).
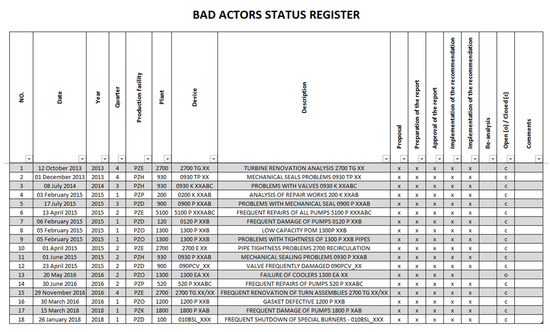
Figure 4.
Bad actors’ status register.
6. Extended Method of the Identification of “Bad Actors”
The previously discussed method of typing “Bad Actors” allows for determining problematic technical objects on the basis of data contained in the SAP ERP system. Unfortunately, this method is not always precise in some cases. The lack of accuracy of some data may result, i.a., from the fact that:
- issuing orders for “future” work, which can sometimes be cancelled—and the order is counted as statistics anyway because it is not deleted;
- counting in the SAP transaction all orders (from all industries) issued for a given technical object, which means that there may be a lot of orders, but exposed to theoretically less important work than repair, such as sensor replacement, oil change or regulatory work;
- issuing duplicate orders because the creator did not notice that the order had already been issued, e.g., by another engineer;
- separate orders for the collection of materials and a separate one for labor.
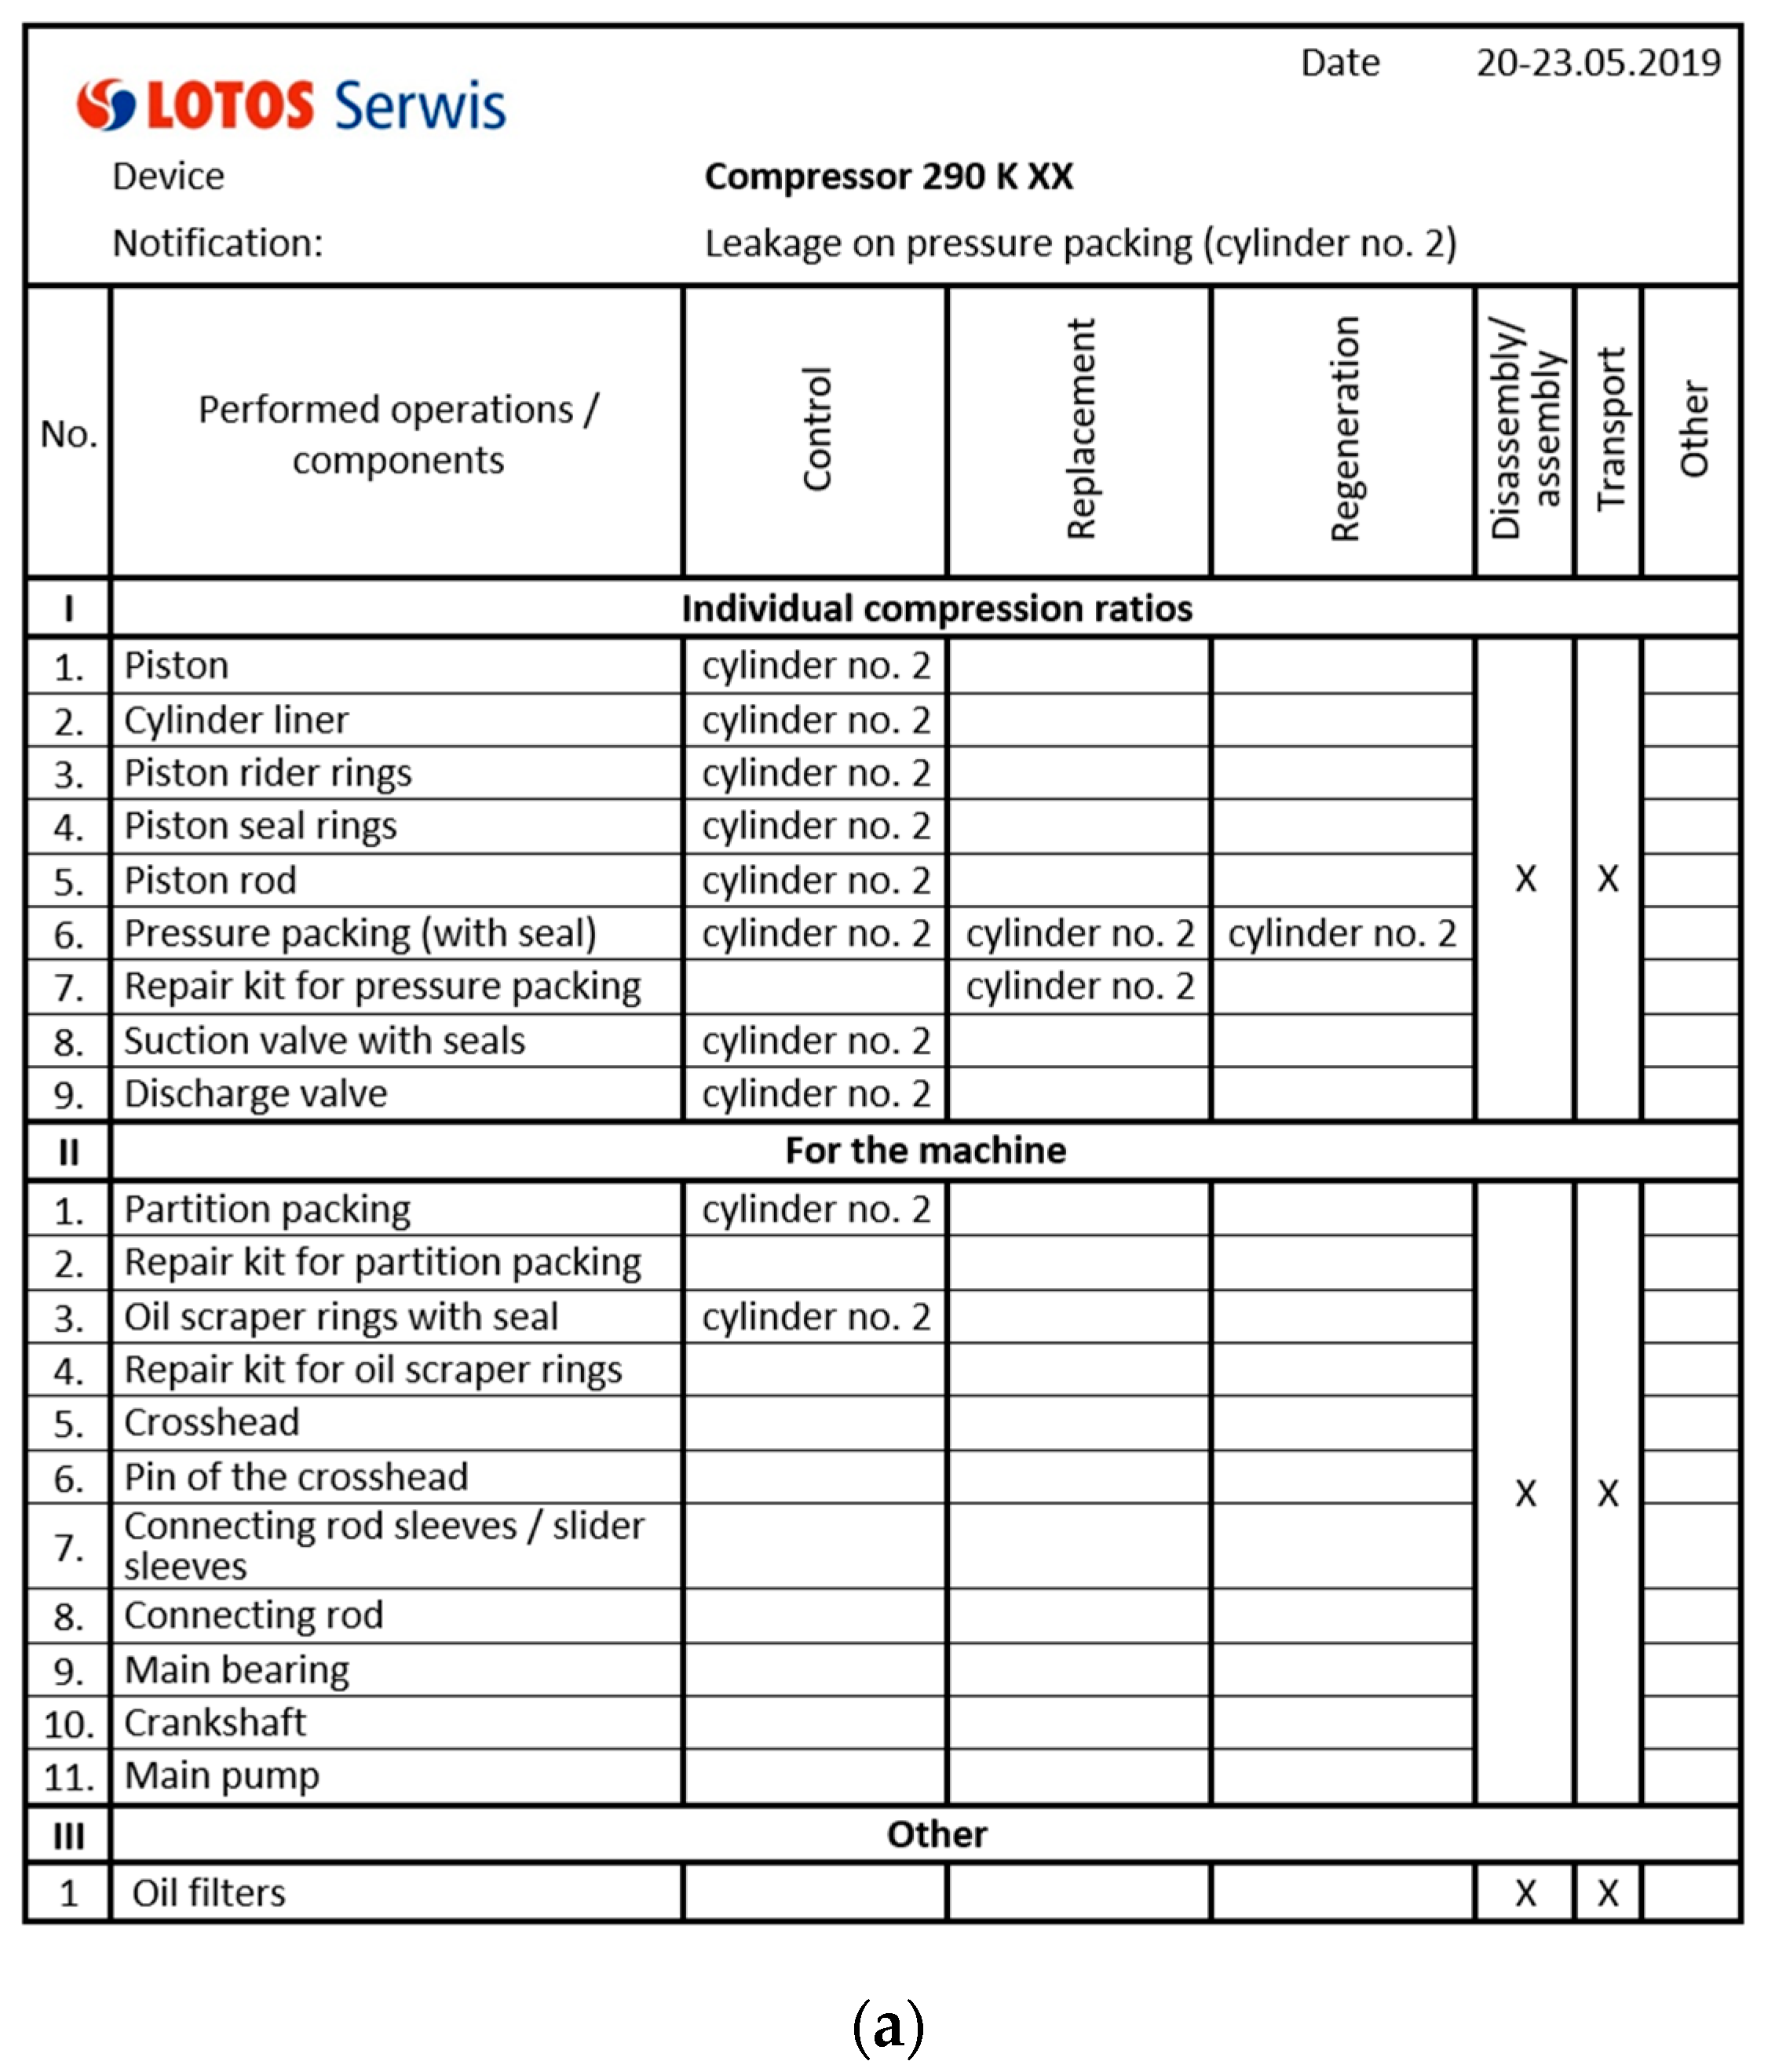
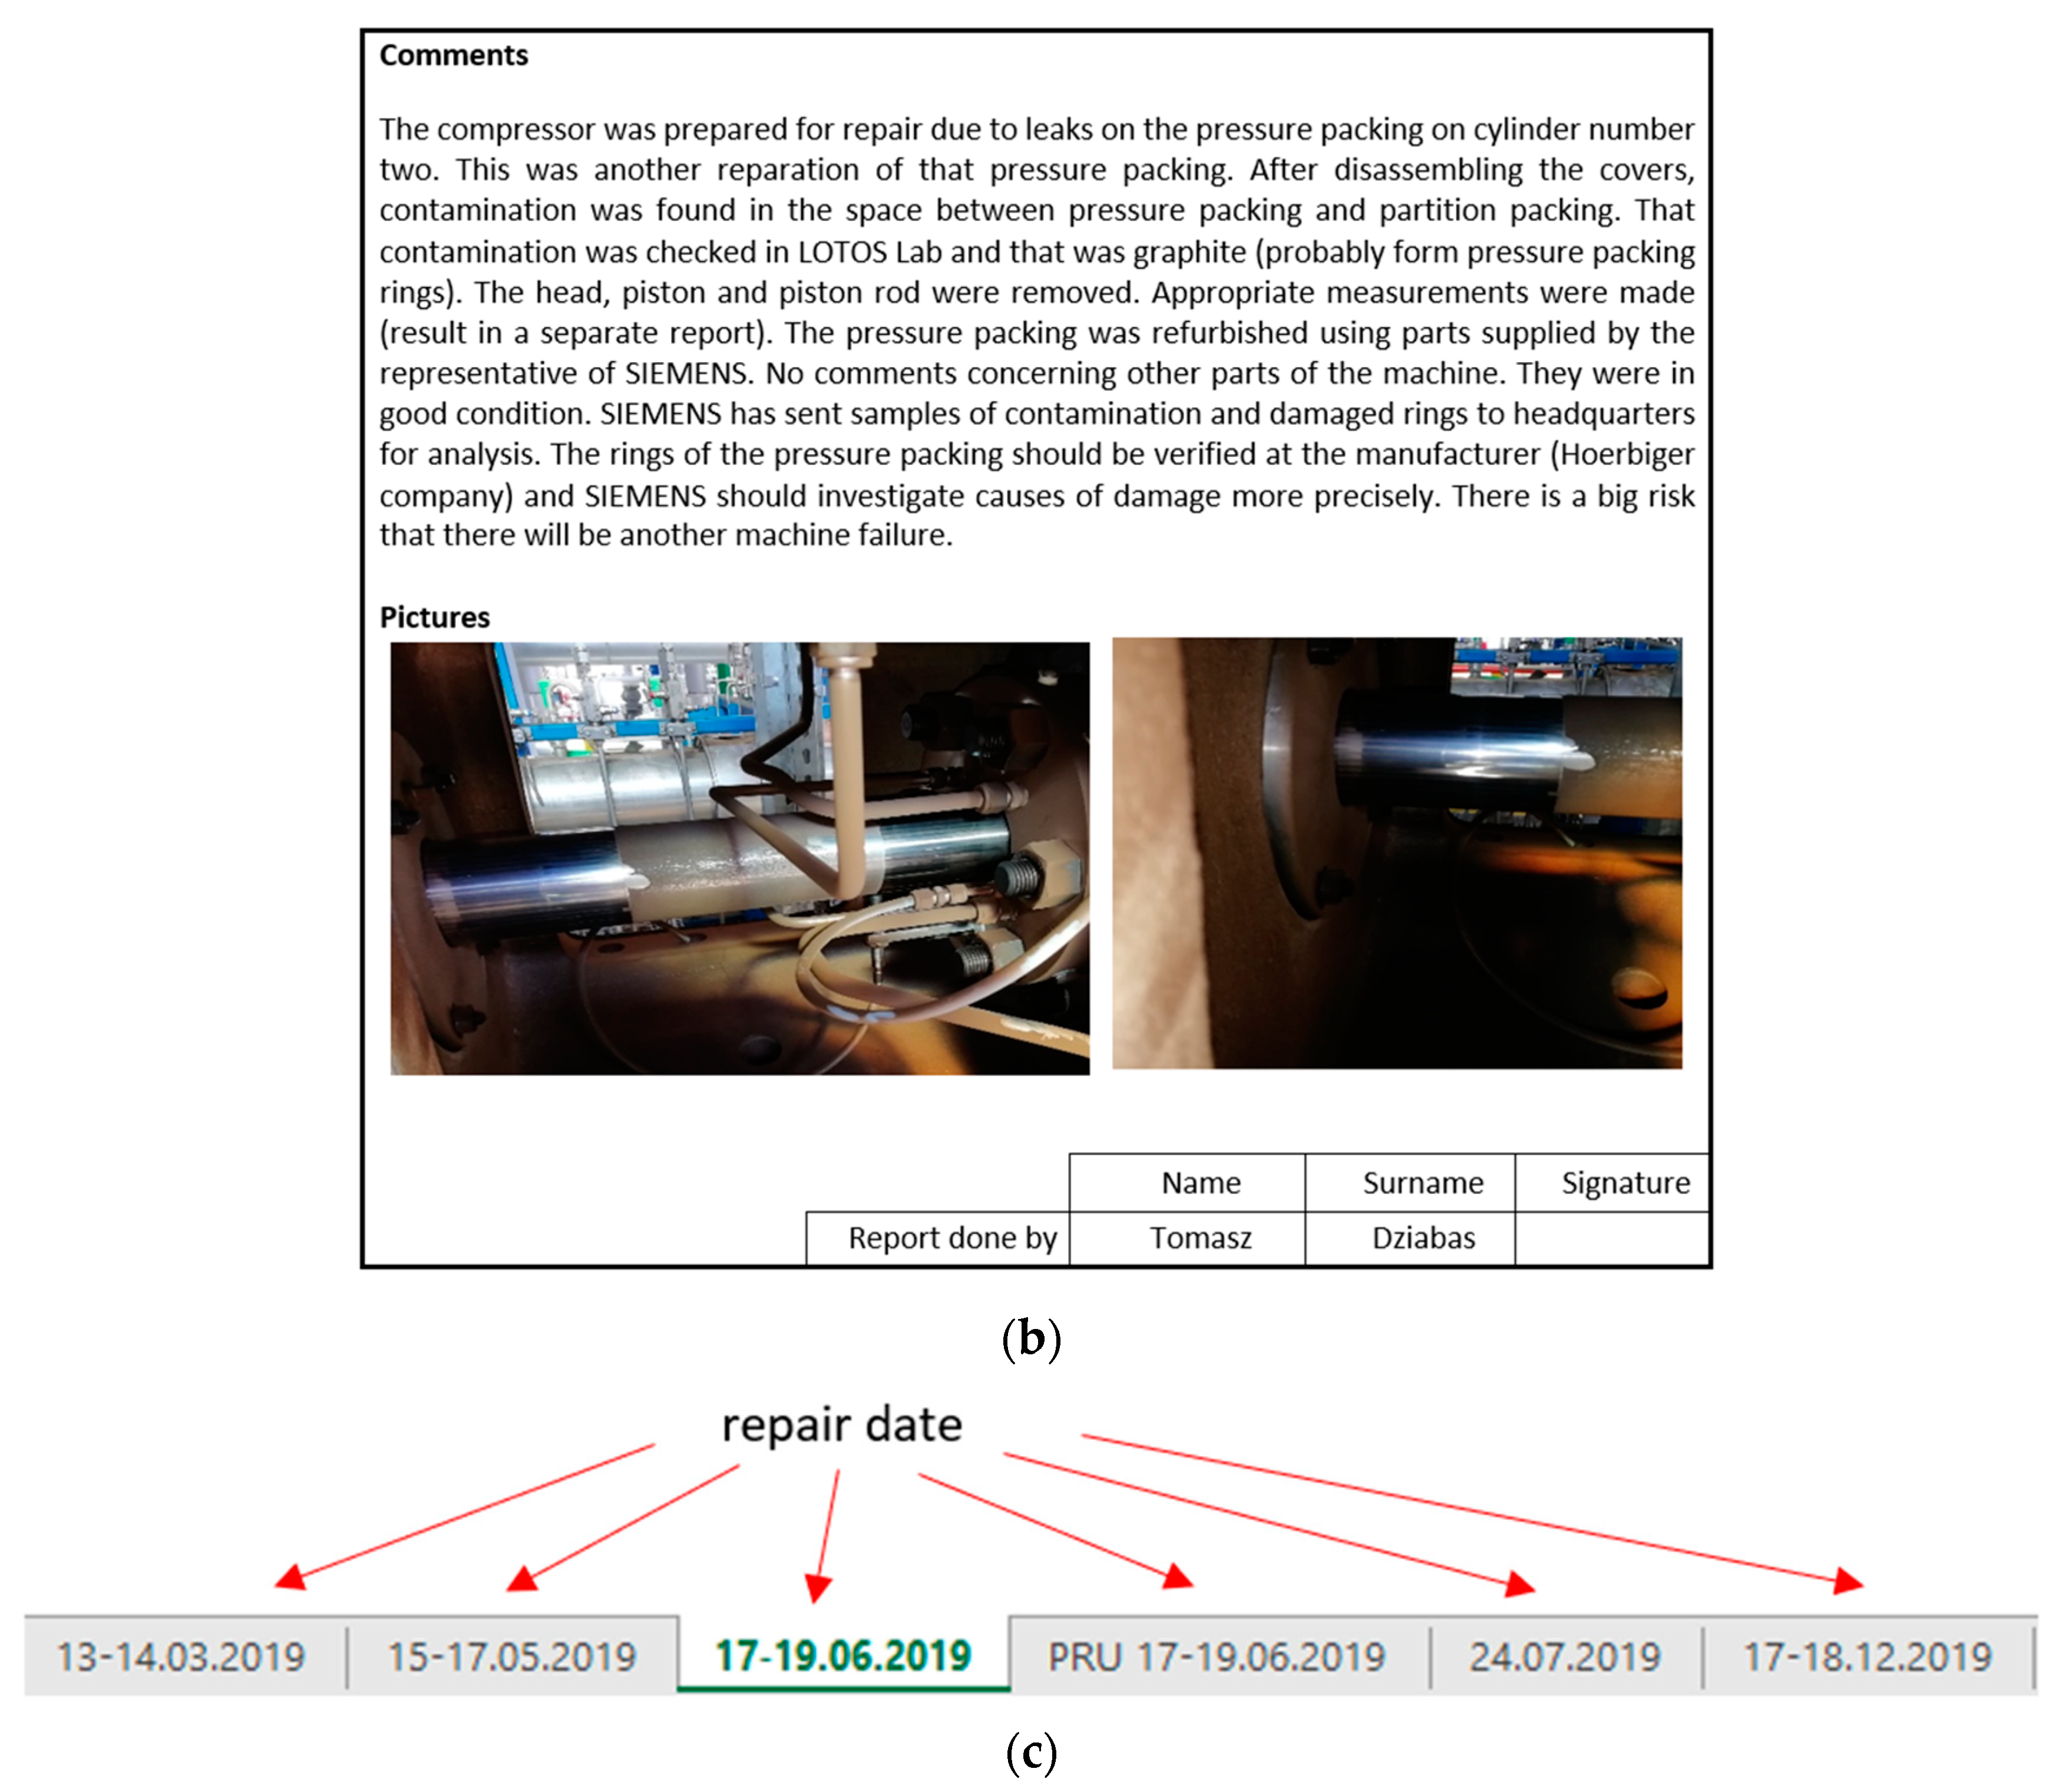
Therefore, it was decided to use an additional method through which the reliability engineer can cross-verify the data. It is based on data created on the basis of post-repair reports created by LOTOS Service engineers (Figure 5). It includes:
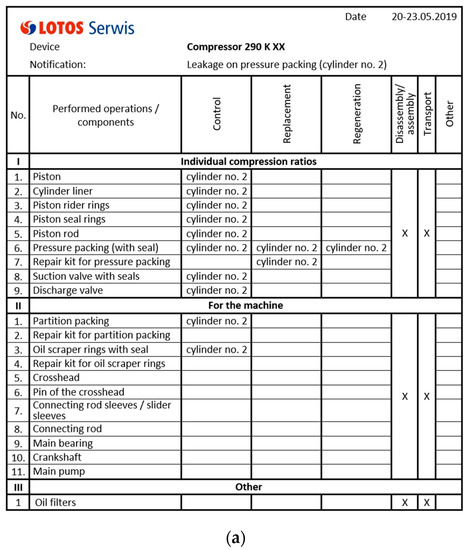

Figure 5.
Reciprocating compressor repair report (a) with comments and pictures (b) for specific repair date (c).
- technological number of the renovated device;
- the reason for the repair;
- date of repair;
- inspected/reconditioned/replaced parts;
- materials taken from the warehouse;
- materials for the order together with the number of the request;
- repair scope;
- comments and recommendations of the post-repair;
- photos;
- signature of the person responsible for the repair and creating the report.
The above-mentioned reports are generated in separate files, and each of them concerns a different device with an individual technological number, e.g., 1100-KXXA. Spreadsheets are created in individual files (the name includes the date of repair-bottom part of Figure 5), which indicate subsequent repairs. This structure allows data to be moved and automatically calculated in Power Query. After building appropriate algorithm, required data (obtained from a database of post-repair reports generated by the repair contractor-LOTOS Service) are automatically transferred from spreadsheets with relevant numerical information, such as the number of repairs and the time between repairs for a specific group of devices taken into account. Then, it is possible in one place to compare the number of repairs in given years, as well as to calculate the KPI (Key Performance Indicators), used in reliability, MTBR (Mean Time Between Repair), which means the average time between repairs. It is important to capture the general trend—the higher the result, the longer the period between repairs. This indicator is expressed as a formula and is measured in months:
Linking the index with the number of repairs allows it to be recalculated for specific groups of devices at the factory level (Table 7).
Table 7.
MTBR indicator for specific groups of devices in terms of the entire enterprise.
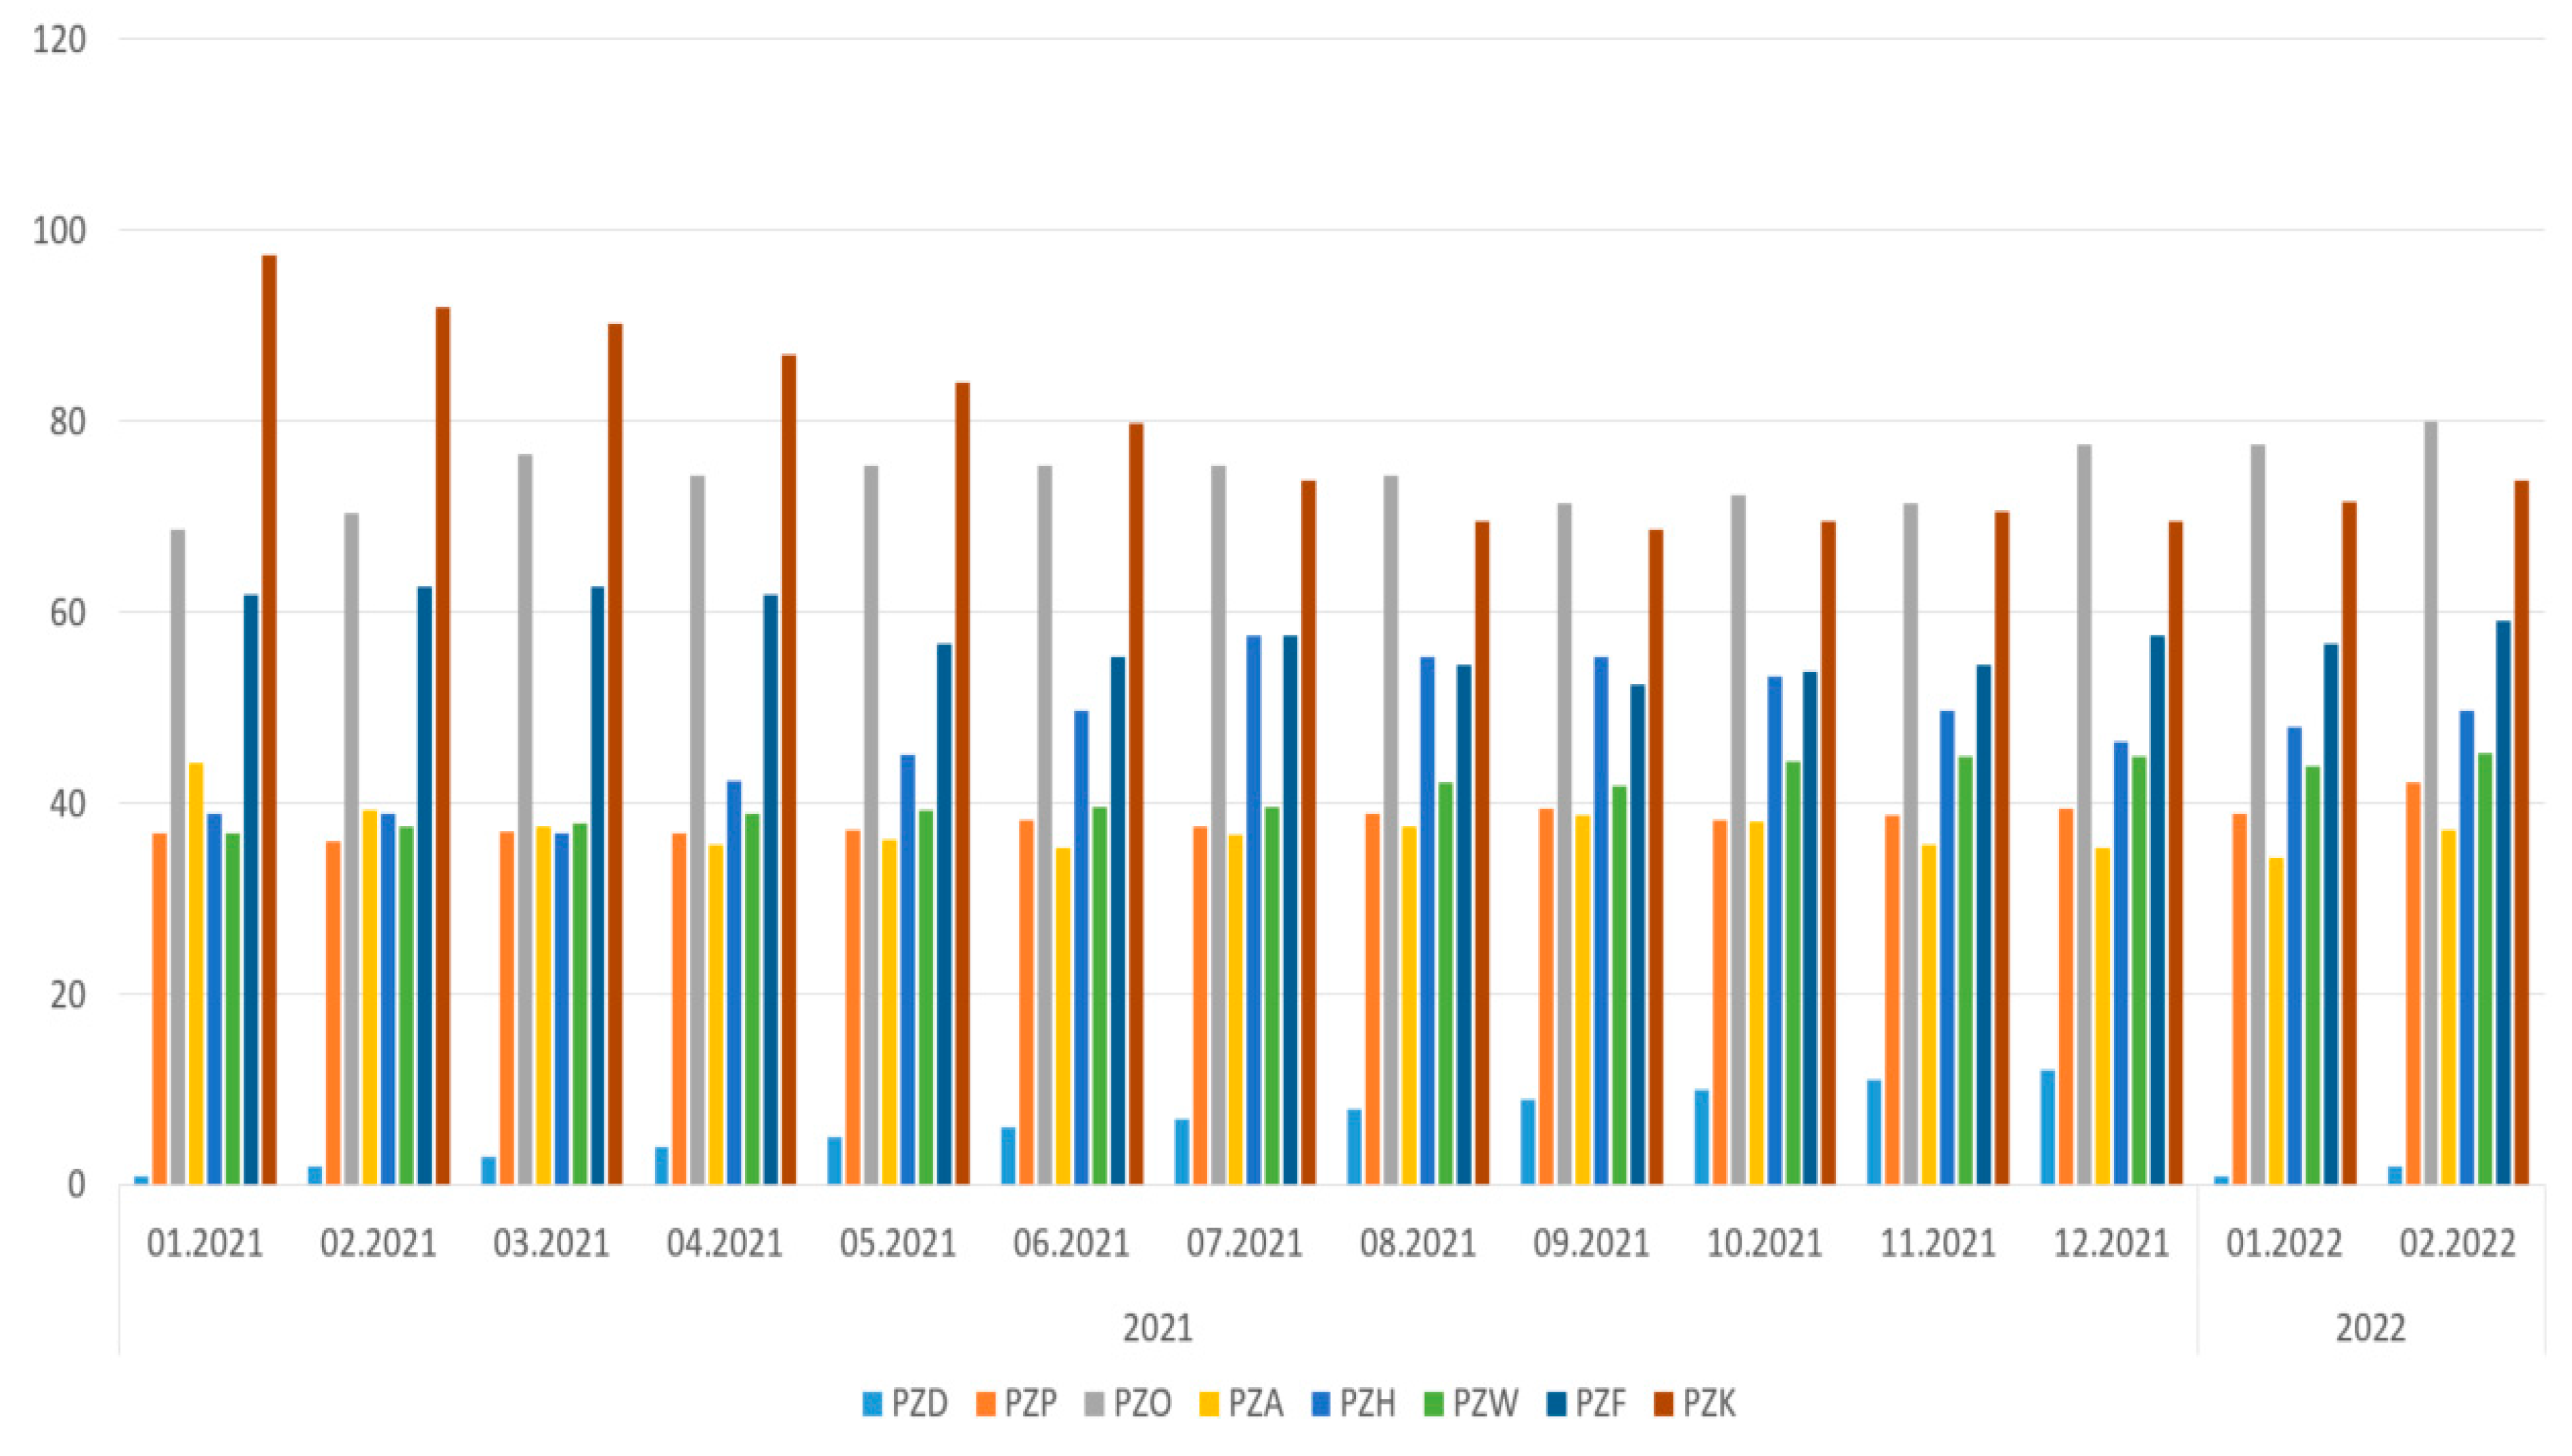
Then, going down one level, it can be observed for which groups of devices there are problems at specific Production Plants (Table 8 and Table 9, Figure 6). The deterioration of statistics in relation to the previous year is marked in shaded boxes, which means that, in these areas, special attention should be paid to technical objects and the reason for such a state of affairs should be analyzed.
Table 8.
MTBR indicator for specific groups in terms of Production Plants.
Table 9.
MTBR indicator for specific groups in terms of Production Plants in 2020 and 2021.
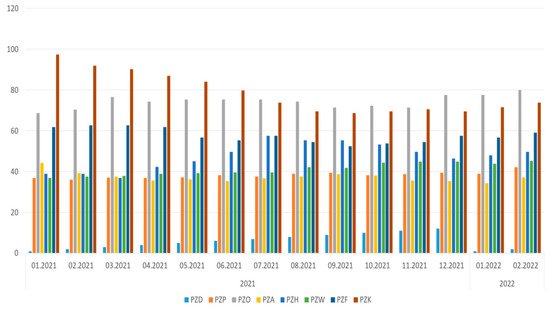
Figure 6.
MTBR indicator chart for specific groups in terms of Production Unit.
Going down one level again, it is possible to analyze MTBR at the device level (Table 10), where you should look for machines with a large number of repairs, and also with a low MTBR result, which means that the device breaks down faster, i.e., in a shorter time. It is also important to study the number of repairs, not based on the SAP system data only, but also based on post-repair reports prepared by engineers from LOTOS Service, which is ultimately included in Table 11. In this case, it is necessary to search for devices where problems occur in subsequent years. This is marked in shaded boxes.
Table 10.
List of pumps with the greatest number of repairs together with the conversion of the MTBR indicator.
Table 11.
Number of repairs for individual devices based on data from post-repair reports.
On this basis, using both the first (SAP data) and the second method (MTBR binding), as shown in Figure 2, it is possible to accurately list specific technical objects as problematic, analyze their type of damage and classify them as “Bad Actors”.
The further procedure is to prepare an explanatory report, which is described in detail in Section 5 and includes, among others: appointment of a team, analysis, preparation of a “Bad Actor” explanation report with a proposal of conclusions and implementation of an appropriate solution.
7. Discussion and Conclusions
Maintenance strategies used in production plants can be varied, which depends on the infrastructure and the costs that the company is able to incur for service and repair works. Choosing an effective approach requires a good knowledge of the principles and practices of repair management, as well as knowledge of the efficiency of specific infrastructure, plants or production units. There is no single correct solution when selecting a strategy that should be adapted to the current production conditions in order to obtain greater availability of machines while reducing costs, especially in large oil concerns, as shown on the example of LOTOS Group S.A.
The article provides the justification for practicing a given methodology at LOTOS, which has an extensive technical infrastructure. The issues related to the impact of each of them were highlighted and the decisive aspects (factors) of the selection of a specific strategy, such as criticality, the influence on technological processes, and the probability of failure, were identified.
One of the many strategies practiced is the RCM strategy—a reliability-based approach that uses a method of increasing the availability of production infrastructure by identifying and eliminating the most problematic devices that cause disruptions in production. The article presents the methodology of selecting activities in this area at the LOTOS Refinery based on the data contained in the ERP IT system. Due to the desire to increase the precision and efficiency of identification of “Bad Actors”, an additional method of analysis, developed in the company over many years, was proposed. In this method, the data are obtained from a database of post-repair reports generated by the repair contractor-LOTOS Service. On their basis, with the use of Power Query, an automatic counting of repair data in a specific time perspective was created. With the use of algorithms, it was possible to calculate the KPI (Key Performance Indicator), i.e., the average time between repairs in terms of Complex, Plants, and Machines. This method is effective for verifying the effectiveness of the repair works carried out and by identifying machines with high failure rates. It facilitates the planning of repairs that should be carried out in the first place. Checking the success of this method results from the further recalculation of MTBR indicators, which, as observed, increased as a result of the actions taken, which means that the time between failures increased.
It is important to emphasize the role of the reliability engineer who must demonstrate the knowledge and experience to define “Bad Actors”. The basis of the analysis performed by him are the collected data, which shows how significant it is to reliably supplement the systems/databases with information.
The identification methods (first and second) described in this paper can be used in companies that create their own databases and, above all, electronically record activities related to specific technical objects. It should be borne in mind that it is possible to further improve and modify this solution, e.g., by adding other efficiency indicators. Machine learning is also planned to eliminate the subjectivity of typing “Bad Actors”.
Author Contributions
Conceptualization, T.D., M.D.; methodology, T.D., M.D., A.W., formal analysis, T.D. and M.D.; resources, T.D.; data curation, T.D.; writing—original draft preparation, T.D. and M.D.; writing—review and editing, T.D., M.D. and A.W.; visualization, T.D.; supervision, M.D.; project administration, T.D.; funding acquisition, T.D., M.D. and A.W. All authors have read and agreed to the published version of the manuscript.
Funding
Research was partially financed by Polish budget funds for science from the Ministry of Science and Education as a research project “Implementation Doctorate”.
Institutional Review Board Statement
Not applicable.
Informed Consent Statement
Not applicable.
Data Availability Statement
Data available on request.
Conflicts of Interest
The authors declare no conflict of interest.
References
- Tambe, P.P.; Kulkarni, M.S. A superimposition based approach for maintenance and quality plan optimization with production schedule, availability, repair time and detection time constraints for a single machine. J. Manuf. Syst. 2015, 37, 17–32. [Google Scholar] [CrossRef]
- Fusko, M.; Rakyta, M.; Krajcovic, M.; Dulina, L.; Gaso, M.; Grznár, P. Basics of designing maintenance processes in industry 4.0. MM Sci. J. 2018, 2018, 2252–2259. [Google Scholar] [CrossRef]
- Stenström, C.; Norrbin, P.; Parida, A.; Kumar, U. Preventive and corrective maintenance–cost comparison and cost–benefit analysis. Struct. Infrastruct. Eng. 2016, 12, 603–617. [Google Scholar] [CrossRef]
- Amiri, S.; Honarvar, M.; Sadegheih, A. Providing an integrated Model for Planning and Scheduling Energy Hubs and preventive maintenance. Energy 2018, 163, 1093–1114. [Google Scholar] [CrossRef]
- Basri, E.I.; Razak, I.H.A.; Ab-Samat, H.; Kamaruddin, S. Preventive maintenance (PM) planning: A review. J. Qual. Maint. Eng. 2017, 23, 114–143. [Google Scholar] [CrossRef]
- Cvrk, S.; Ilijević, D. Application of diagnostics as a basis of condition based maintenance of the marine propulsion diesel engine. Brodogr. Teor. Praksa Brodogr. Pomor. Teh. 2020, 71, 119–134. [Google Scholar] [CrossRef]
- Ayo-Imoru, R.; Cilliers, A. A survey of the state of condition-based maintenance (CBM) in the nuclear power industry. Ann. Nucl. Energy 2018, 112, 177–188. [Google Scholar] [CrossRef]
- Goodman, D.; Hofmeister, J.P.; Szidarovszky, F. Prognostics and Health Management: A Practical Approach to Improving System Reliability Using Condition-Based Data; John Wiley & Sons: Hoboken, NJ, USA, 2019. [Google Scholar]
- Carvalho, T.P.; Soares, F.A.; Francisco, R.D.; Basto, J.P.; Alcalá, S.G. A systematic literature review of machine learning methods applied to predictive maintenance. Comput. Ind. Eng. 2019, 137, 106024. [Google Scholar] [CrossRef]
- Zonta, T.; da Costa, C.A.; da Rosa Righi, R.; de Lima, M.J.; da Trindade, E.S.; Li, G.P. Predictive maintenance in the Industry 4.0: A systematic literature review. Comput. Ind. Eng. 2020, 150, 106889. [Google Scholar] [CrossRef]
- Agustiady, T.K.; Cudney, E.A. Total productive maintenance. Total Qual. Manag. Bus. Excell. 2018, 1–8. [Google Scholar] [CrossRef]
- Habidin, N.F.; Hashim, S.; Fuzi, N.M.; Salleh, M.I. Total productive maintenance, kaizen event, and performance. Int. J. Qual. Reliab. Manag. 2018, 35, 1853–1867. [Google Scholar] [CrossRef]
- Nurprihatin, F.; Angely, M.; Tannady, H. Total productive maintenance policy to increase effectiveness and maintenance performance using overall equipment effectiveness. J. Appl. Res. Ind. Eng. 2019, 6, 184–199. [Google Scholar] [CrossRef]
- Willmott, P.; McCarthy, D. TPM-: A Route to World Class Performance; Newnes Elsevier Ltd.: Amsterdam, The Netherlands, 2001; p. 264. [Google Scholar]
- Legutko, S. Development Trends in Machines Operation Maintenance. Eksploat. I Niezawodn. Maint. Reliab. 2009, 2, 8–16. [Google Scholar]
- Alrifaey, M.; Hong, T.S.; As’Arry, A.; Supeni, E.E.; Ang, C.K. Optimization and Selection of Maintenance Policies in an Electrical Gas Turbine Generator Based on the Hybrid Reliability-Centered Maintenance (RCM) Model. Processes 2020, 8, 670. [Google Scholar] [CrossRef]
- Sifonte, J.R.; Reyes-PicknellI, J.V. Reliability Centered Maintenance-Reengineered: Practical Optimization of the RCM Process with RCM-R; Productivity Press: Boca Raton, FL, USA, 2017; p. 367. [Google Scholar] [CrossRef]
- García, J.R.; Martinetti, A.; Becker, J.M.; Singh, S.; van Dongen, L.A. Towards an industry 4.0-based maintenance approach in the manufacturing processes. In Research Anthology on Cross-Industry Challenges of Industry 4.0; IGI Global: Hershey, PA, USA, 2021. [Google Scholar]
- Canizo, M.; Onieva, E.; Conde, A.; Charramendieta, S.; Trujillo, S. Real-time predictive maintenance for wind turbines using Big Data frameworks. In Proceedings of the IEEE International Conference on Prognostics and Health Management (ICPHM), Dallas, TX, USA, 19–21 June 2017; pp. 70–77. [Google Scholar] [CrossRef]
- Matyas, K.; Nemeth, T.; Kovacs, K.; Glawar, R. A procedural approach for realizing prescriptive maintenance planning in manufacturing industries. CIRP Ann. 2017, 66, 461–464. [Google Scholar] [CrossRef]
- Marques, H.; Giacotto, A. Prescriptive maintenance: Building alternative plans for smart operations. Marques, Henrique, and Alessandro Giacotto. “Prescriptive maintenance: Building alternative plans for smart operations.” FT2019. In Proceedings of the 10th Aerospace Technology Congress, Stockholm, Sweden, 8–9 October 2019; Linköping University Electronic Press: Stockholm, Sweden; pp. 231–236. [Google Scholar]
- Jasiulewicz-Kaczmarek, M.; Legutko, S.; Kluk, P. Maintenance 4.0 technologies–new opportunities for sustainability driven maintenance. Manag. Prod. Eng. Rev. 2020, 11, 74–87. [Google Scholar]
- Chen, C.; Wang, C.; Lu, N.; Jiang, B.; Xing, Y. A data-driven predictive maintenance strategy based on accurate failure prognostics. Eksploat. i Niezawodn.-Maint. Reliab. 2021, 23, 387–394. [Google Scholar] [CrossRef]
- Jasiulewicz-Kaczmarek, M.; Antosz, K.; Wyczółkowski, R.; Mazurkiewicz, D.; Sun, B.; Qian, C.; Ren, Y. Application of MICMAC, Fuzzy AHP, and Fuzzy TOPSIS for evaluation of the maintenance factors affecting sustainable manufacturing. Energies 2021, 14, 1436. [Google Scholar] [CrossRef]
- Lad, B.K.; Kulkarni, M.S. Optimal maintenance schedule decisions for machine tools considering the user’s cost structure. Int. J. Prod. Res. 2012, 50, 5859–5871. [Google Scholar] [CrossRef]
- Amachree, T.T. Development of an Optimal Planning and Maintenance System (A Case Study of Shell Petroleum Development Company, Obigbo Node). Int. J. Sci. Technol. Res. 2017, 6, 112–124. [Google Scholar]
- Andrawus, J.A.; Watson, J.; Kishk, M.; Adam, A. The selection of a suitable maintenance strategy for wind turbines. Wind. Eng. 2006, 30, 471–486. [Google Scholar] [CrossRef]
- Lee, J.; Mitici, M. An integrated assessment of safety and efficiency of aircraft maintenance strategies using agent-based modelling and stochastic Petri nets. Reliab. Eng. Syst. Saf. 2020, 202, 107052. [Google Scholar] [CrossRef]


Publisher’s Note: MDPI stays neutral with regard to jurisdictional claims in published maps and institutional affiliations. |
© 2022 by the authors. Licensee MDPI, Basel, Switzerland. This article is an open access article distributed under the terms and conditions of the Creative Commons Attribution (CC BY) license (https://creativecommons.org/licenses/by/4.0/).