Spatiotemporal Distribution of Drought and Humidity in China Based on the Pedj Drought Index (PDI)
Abstract
:1. Introduction
2. Study Area and Data
2.1. Study Area
2.2. Data
2.3. Calculation of PDI
2.4. Statistical Analysis Method
3. Results
4. Discussion
5. Conclusions
- (1)
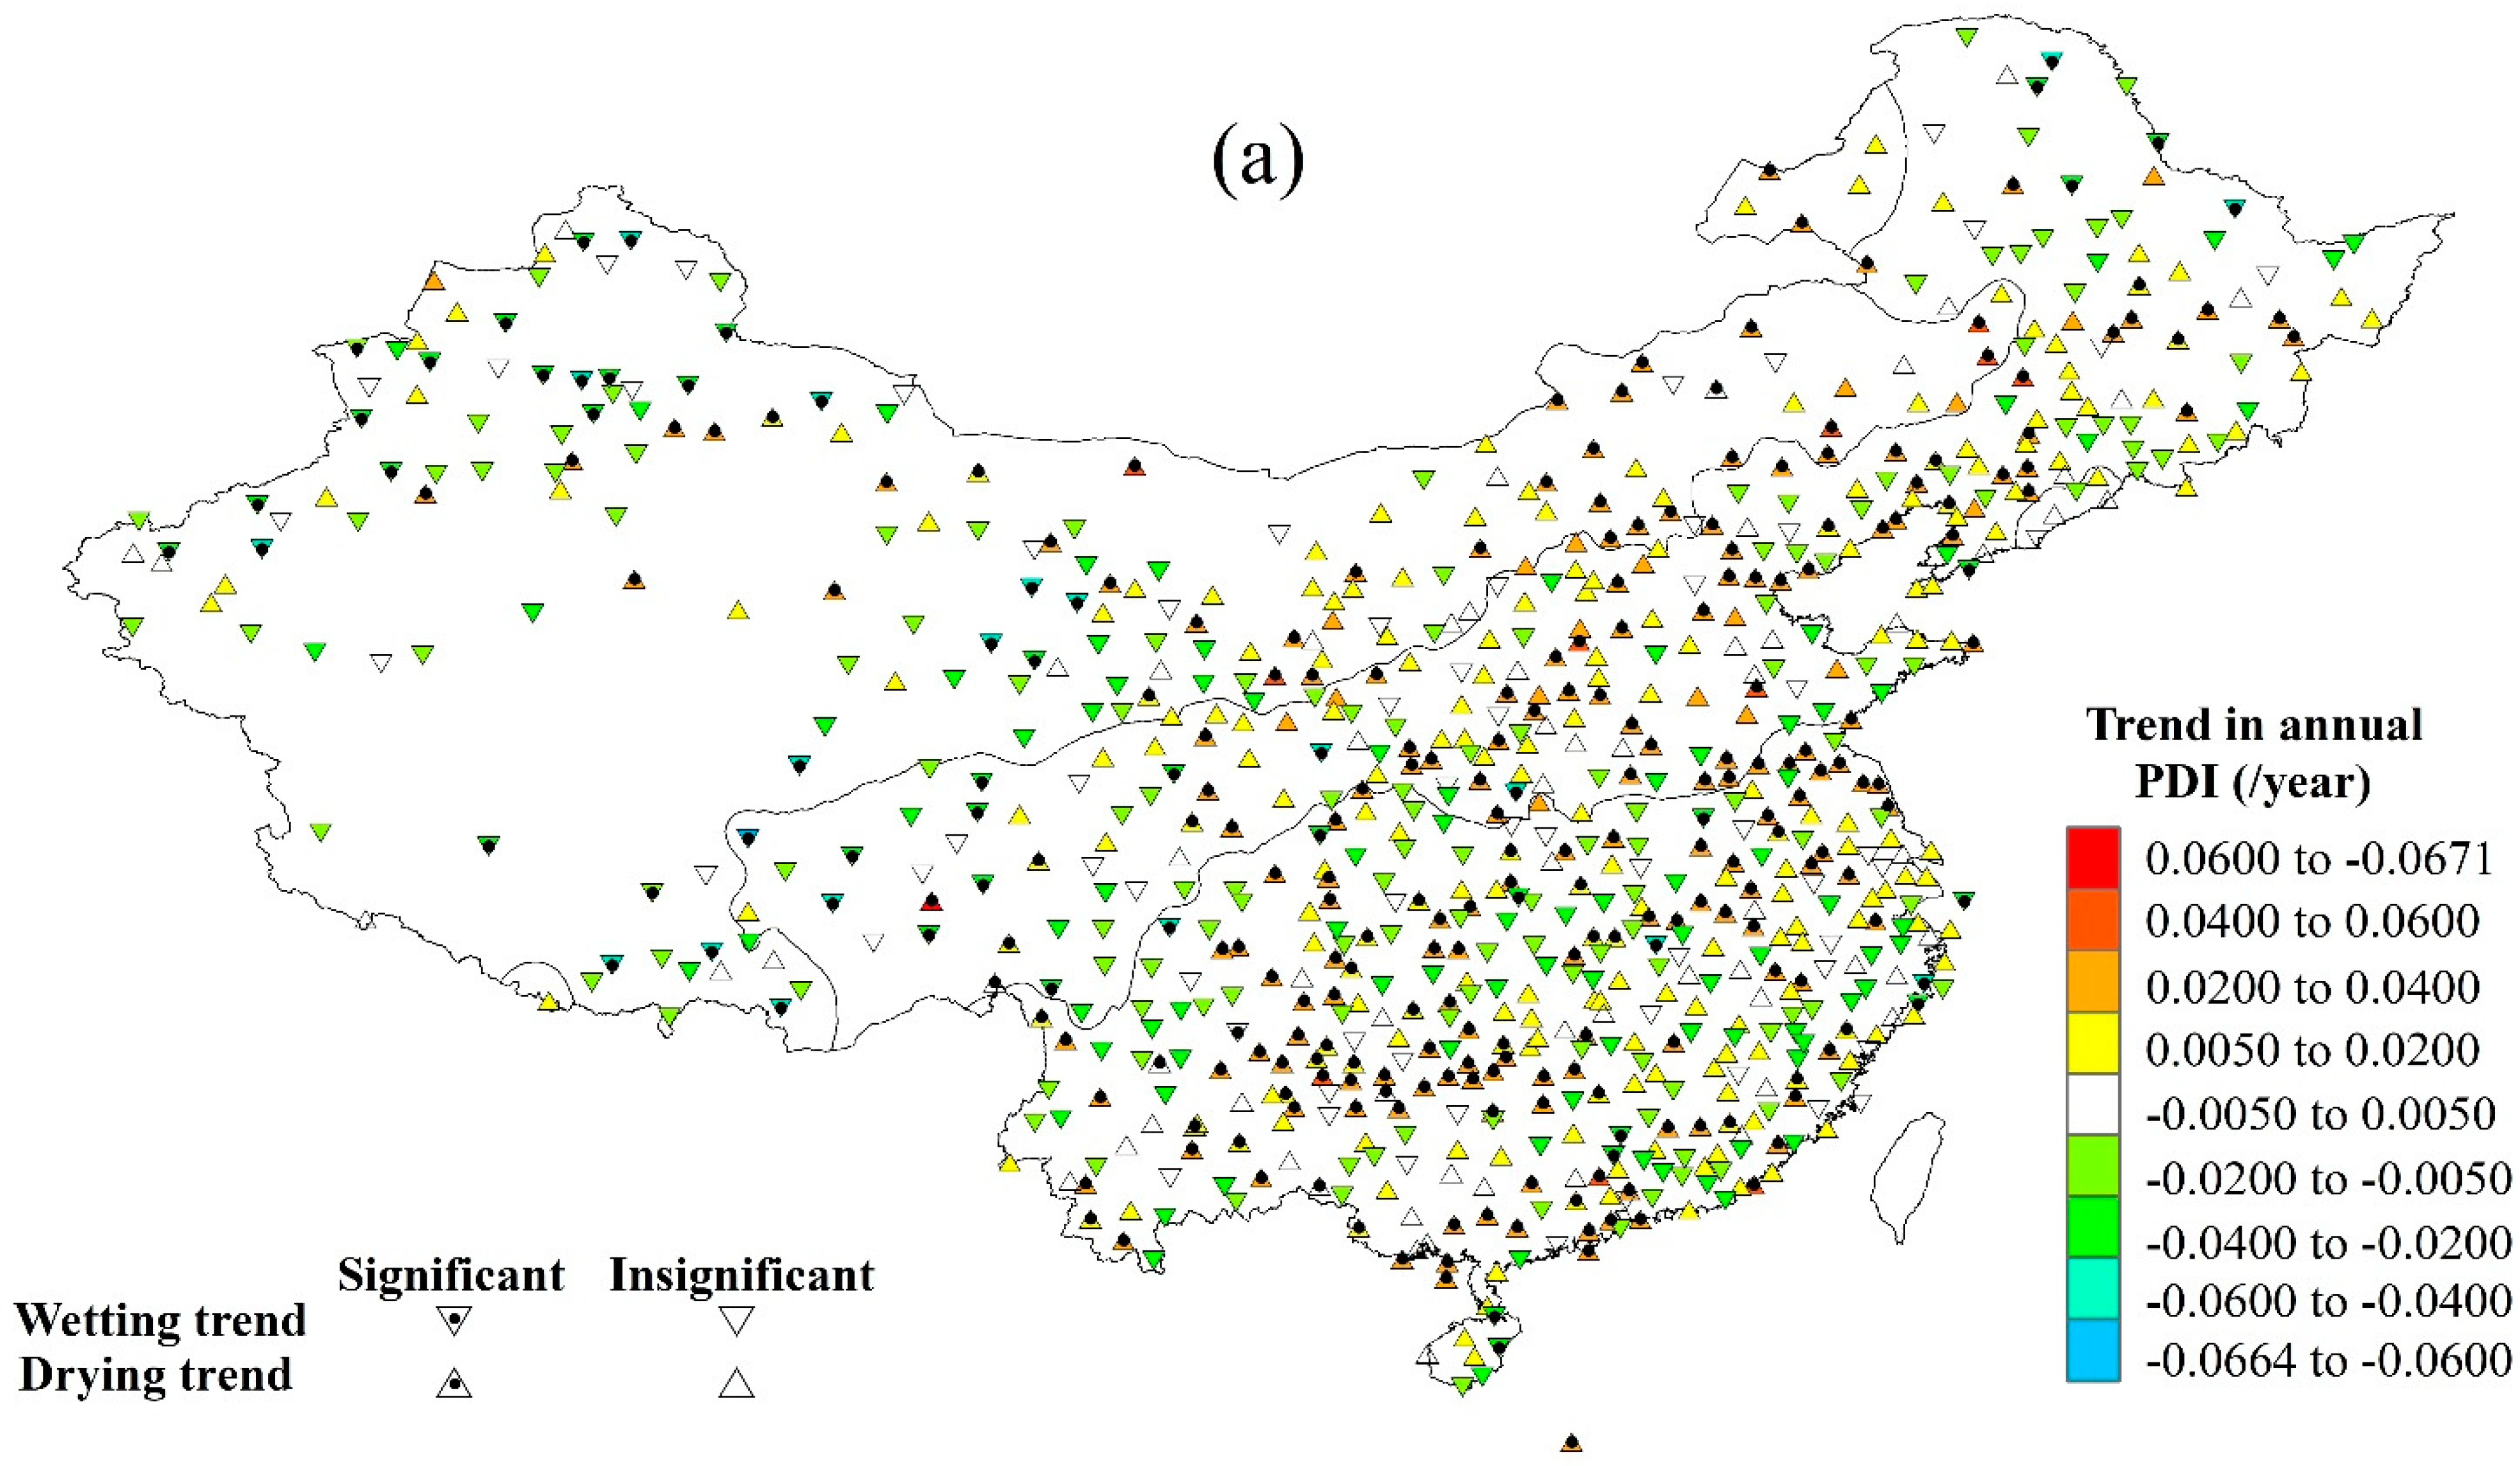
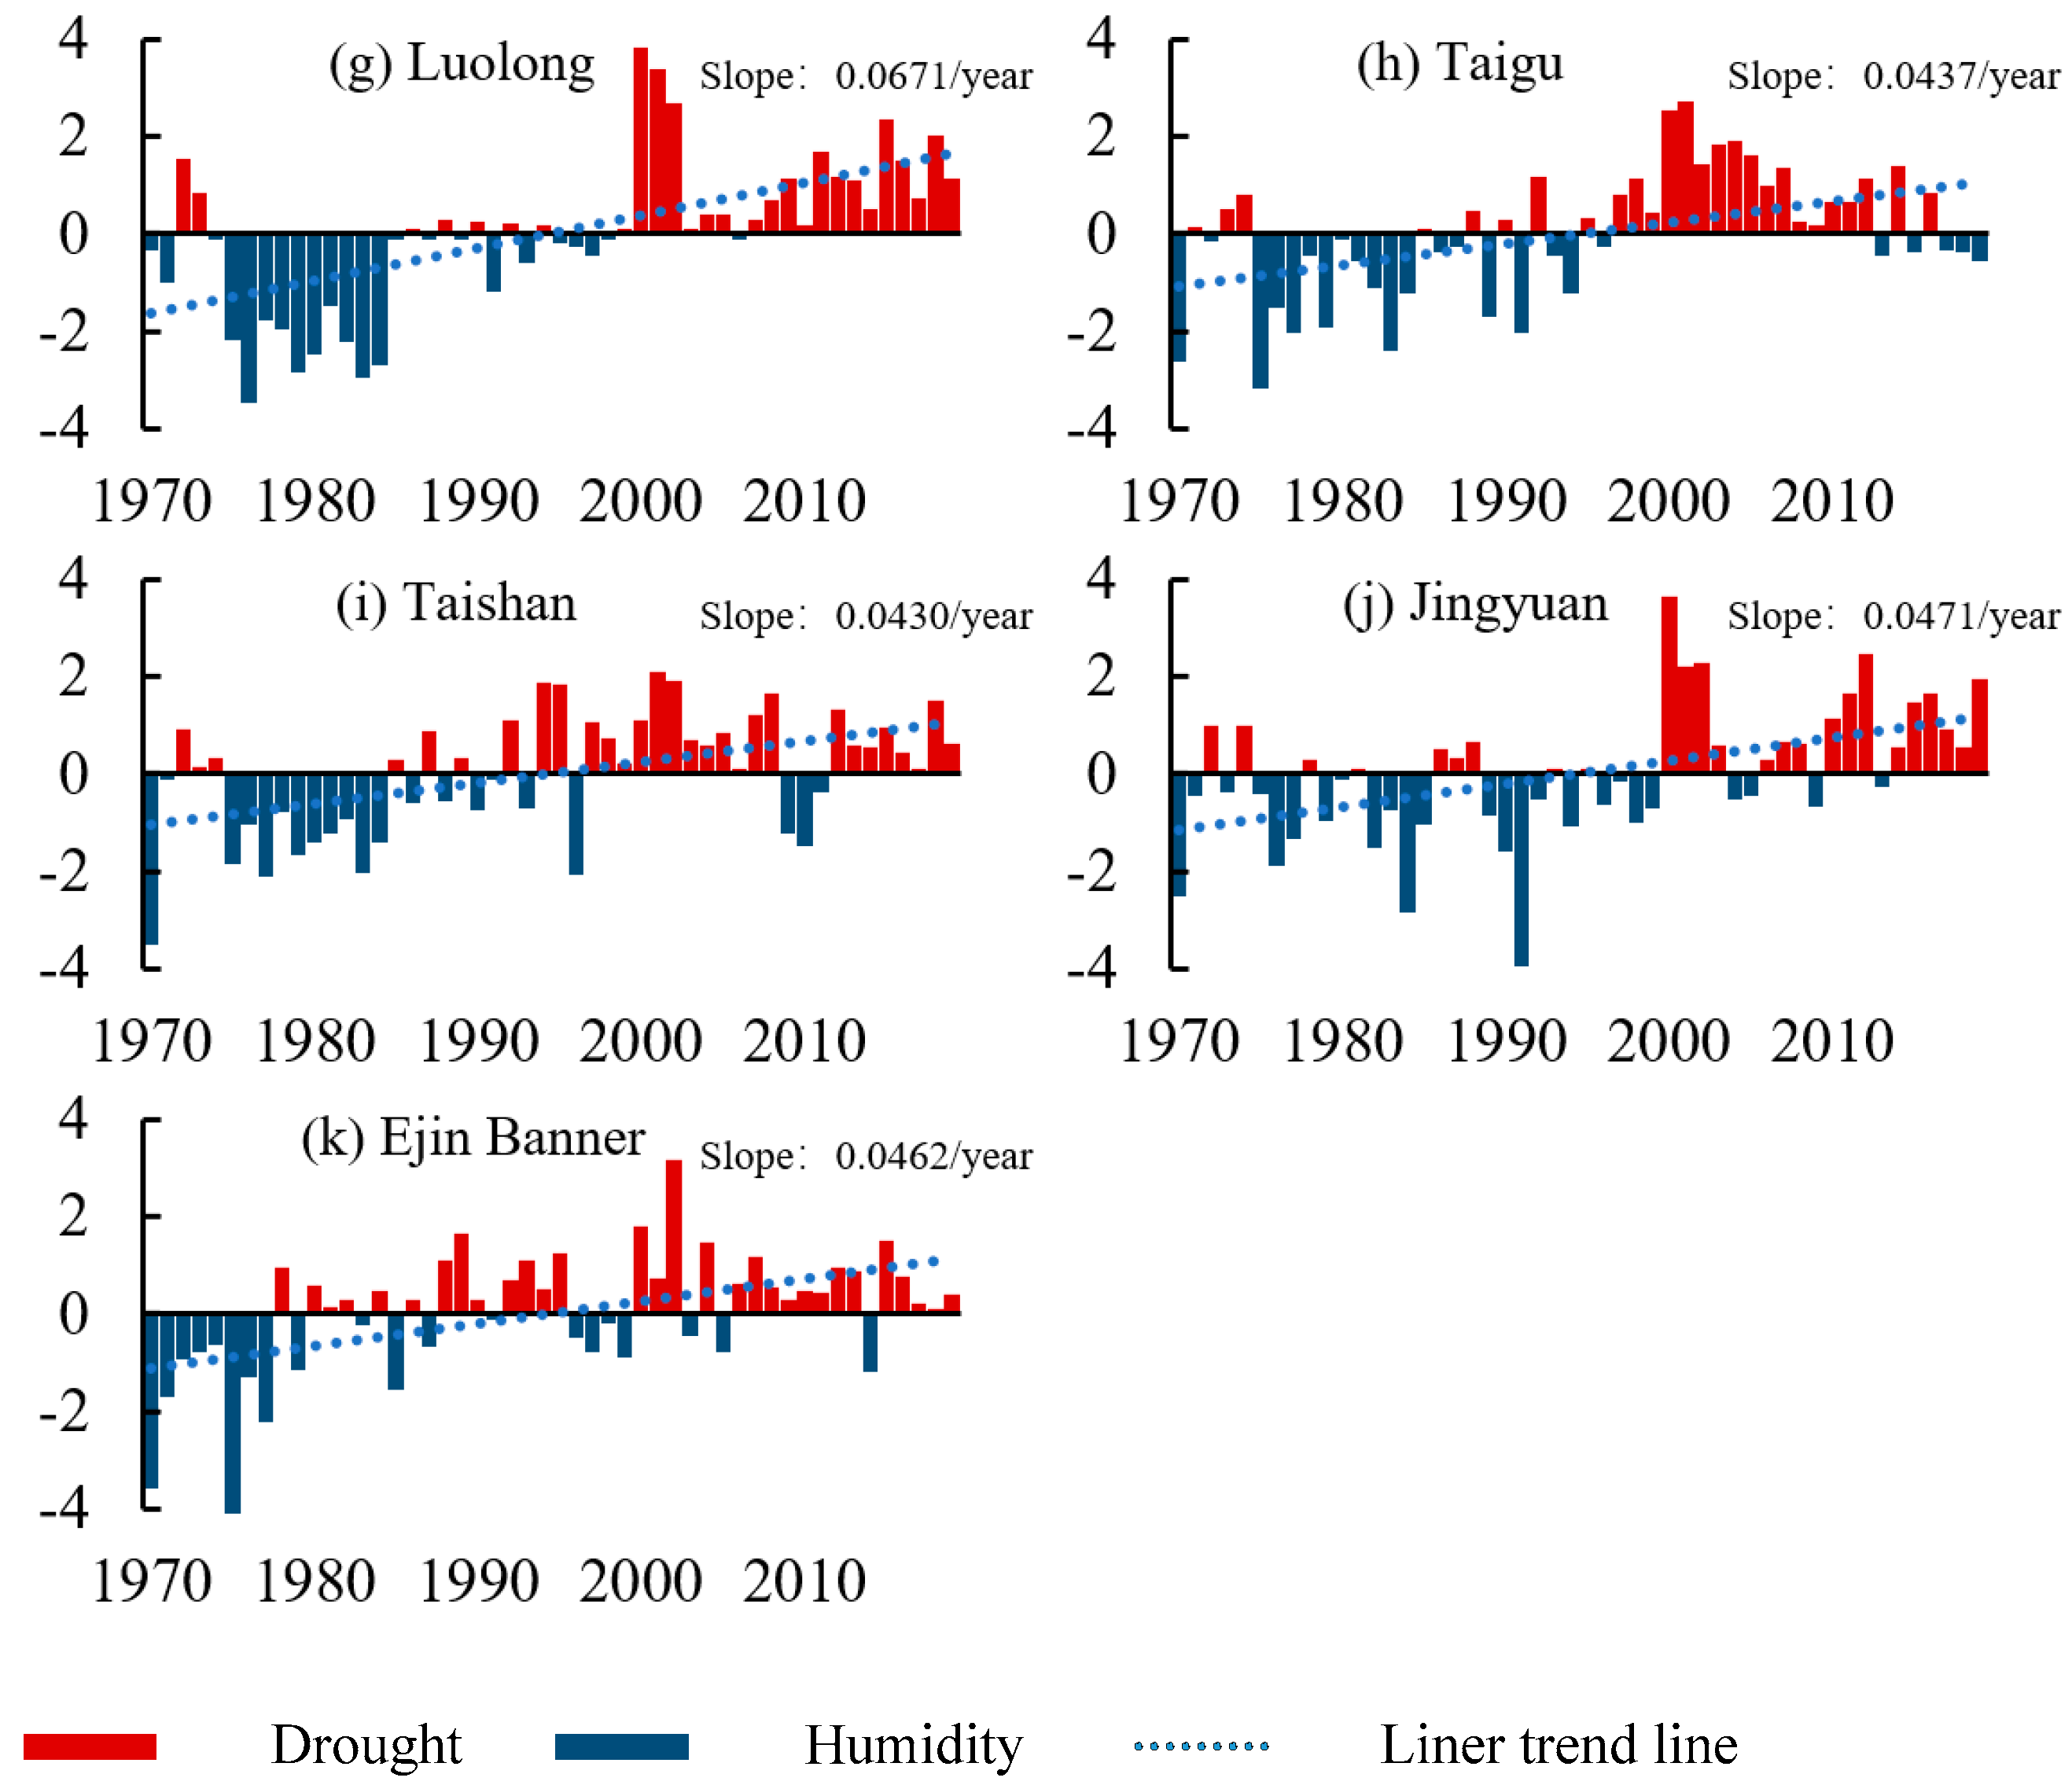
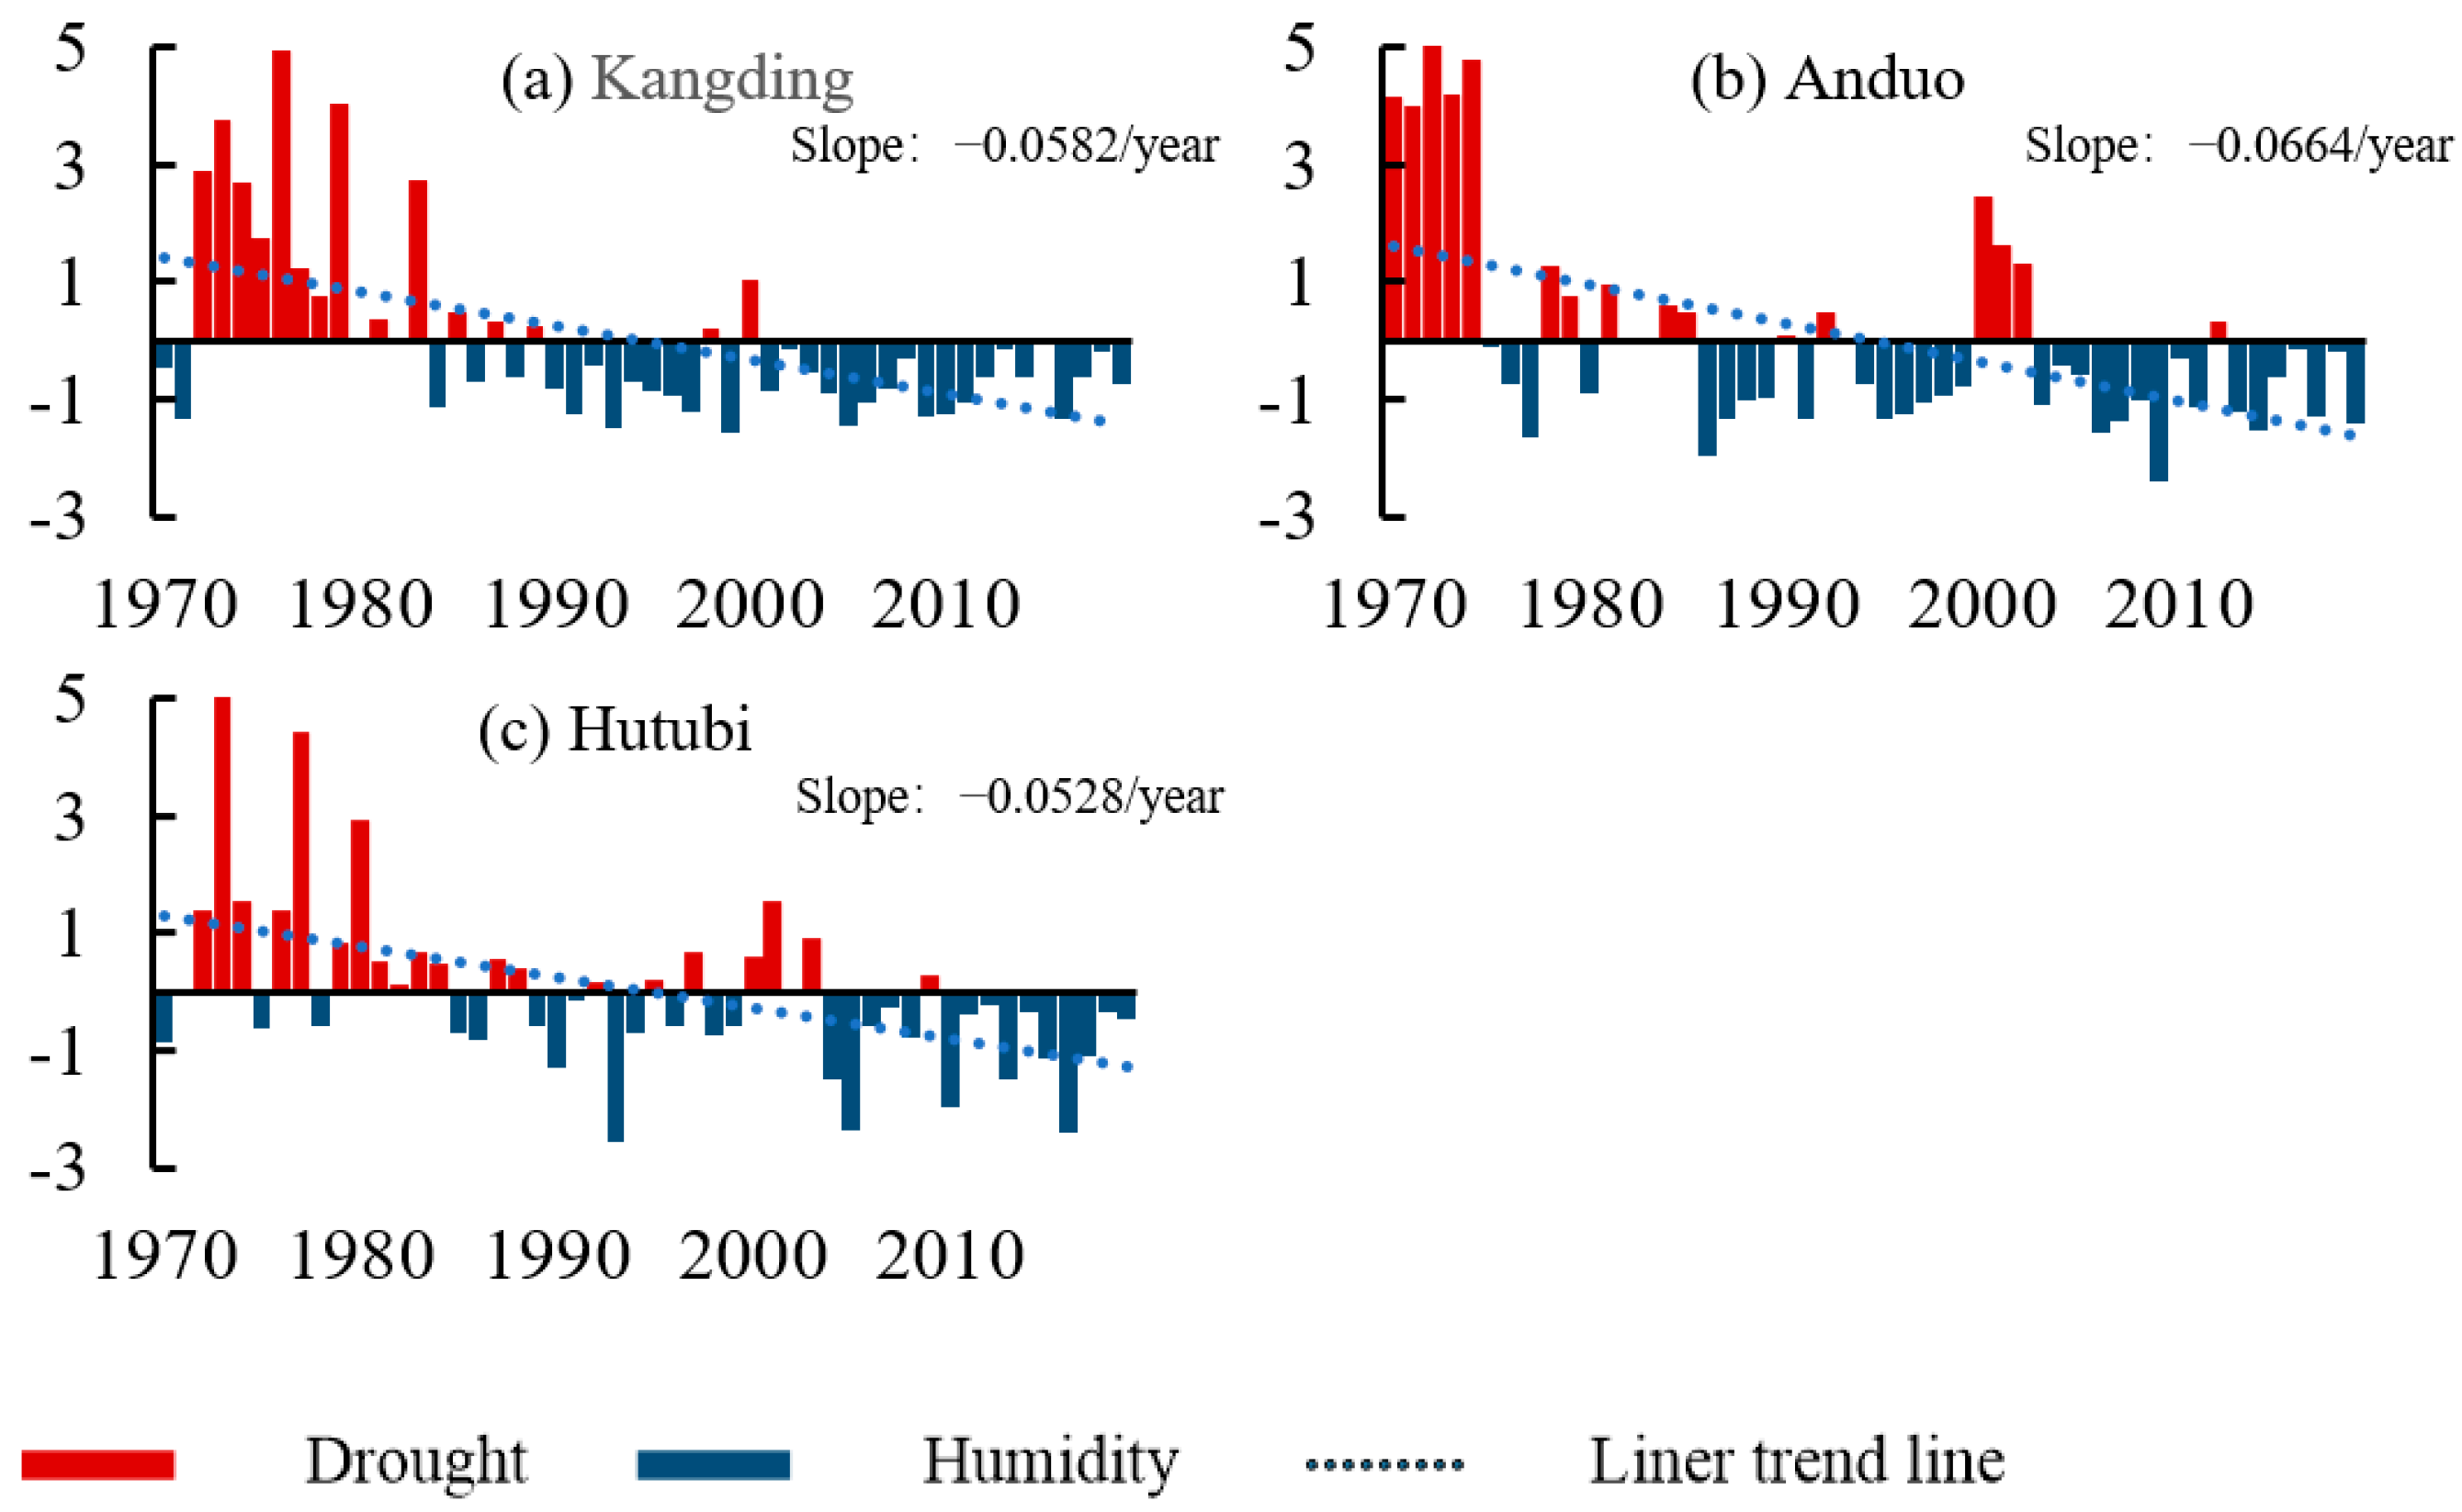
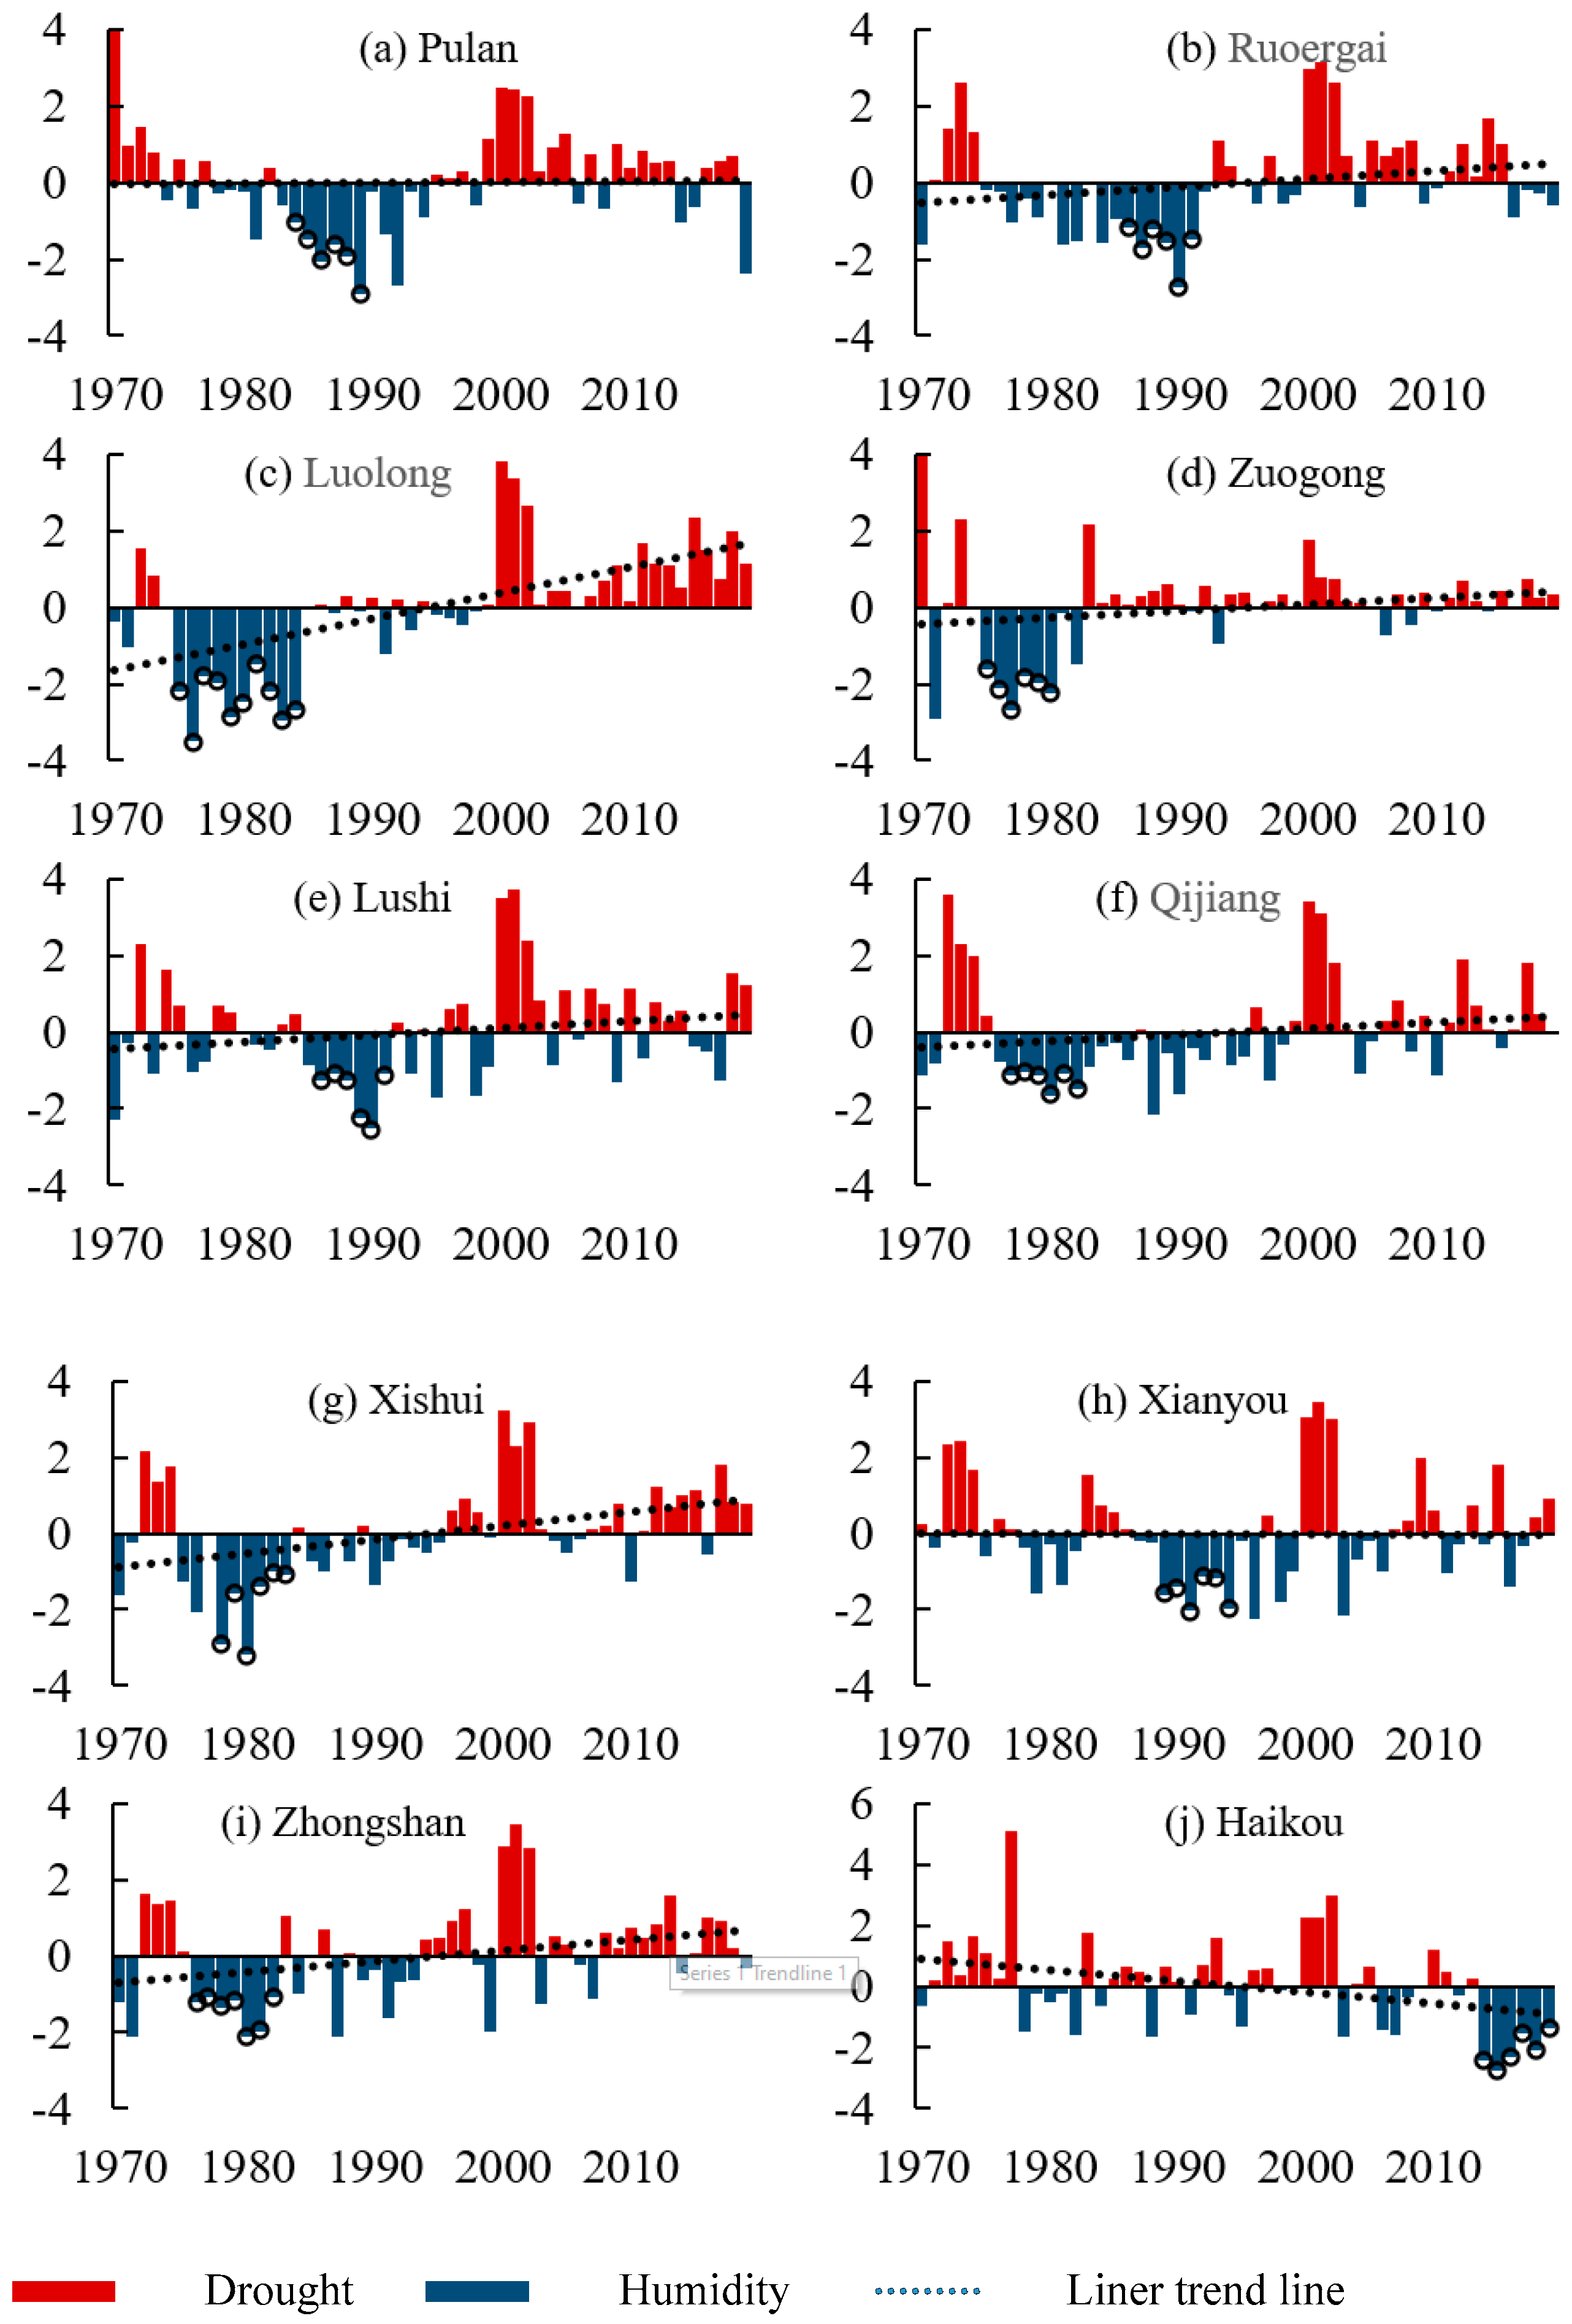
- There were 26.6% of stations that showed significant increases in annual PDI values throughout China during 1970–2019, the proportion of stations with significant increases in region I (31.6%), II (24.1%), and III (19.9%) gradually decreased. Only 6.9% of stations showed significant decreases throughout China, the proportion of stations in region I (3.4%), II (6.5%), and III (14.5%) gradually increased.
- (2)
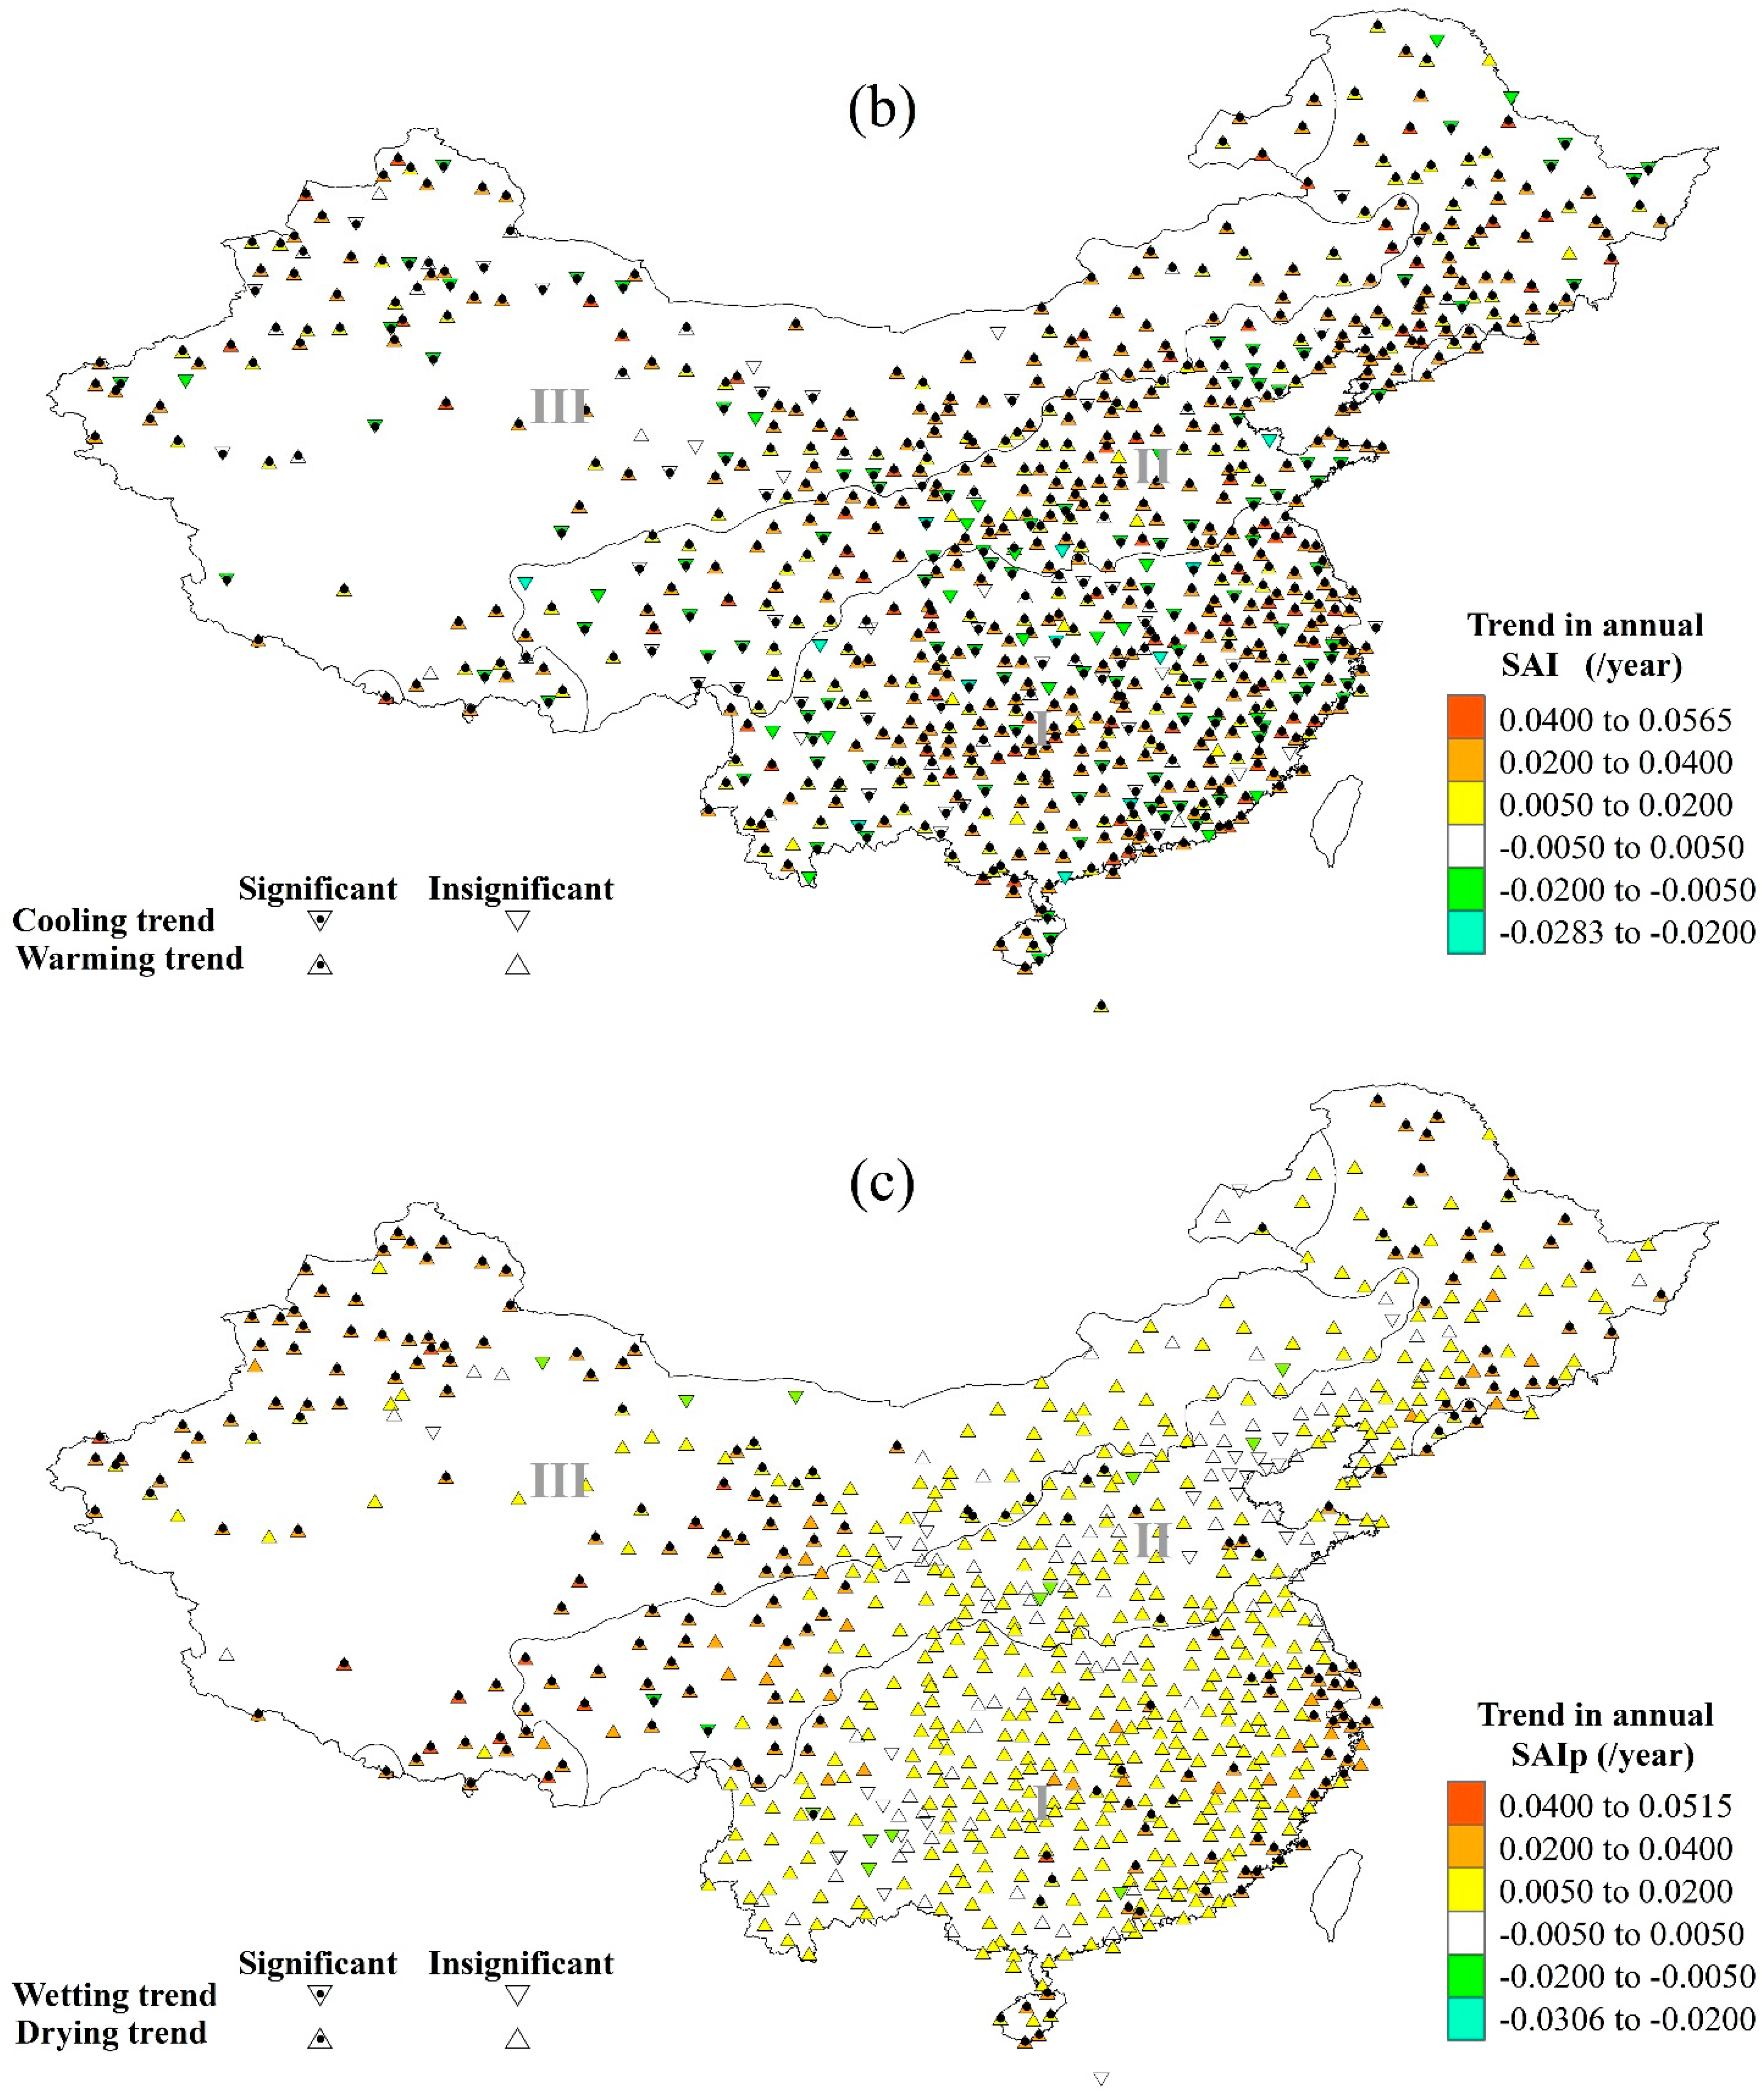
- Air temperature played a more remarkable role than precipitation in assessing the drying trend with PDI. Both precipitation and air temperature were important in assessing the wetting trend, but the former occupied a more prominent position.
- (3)
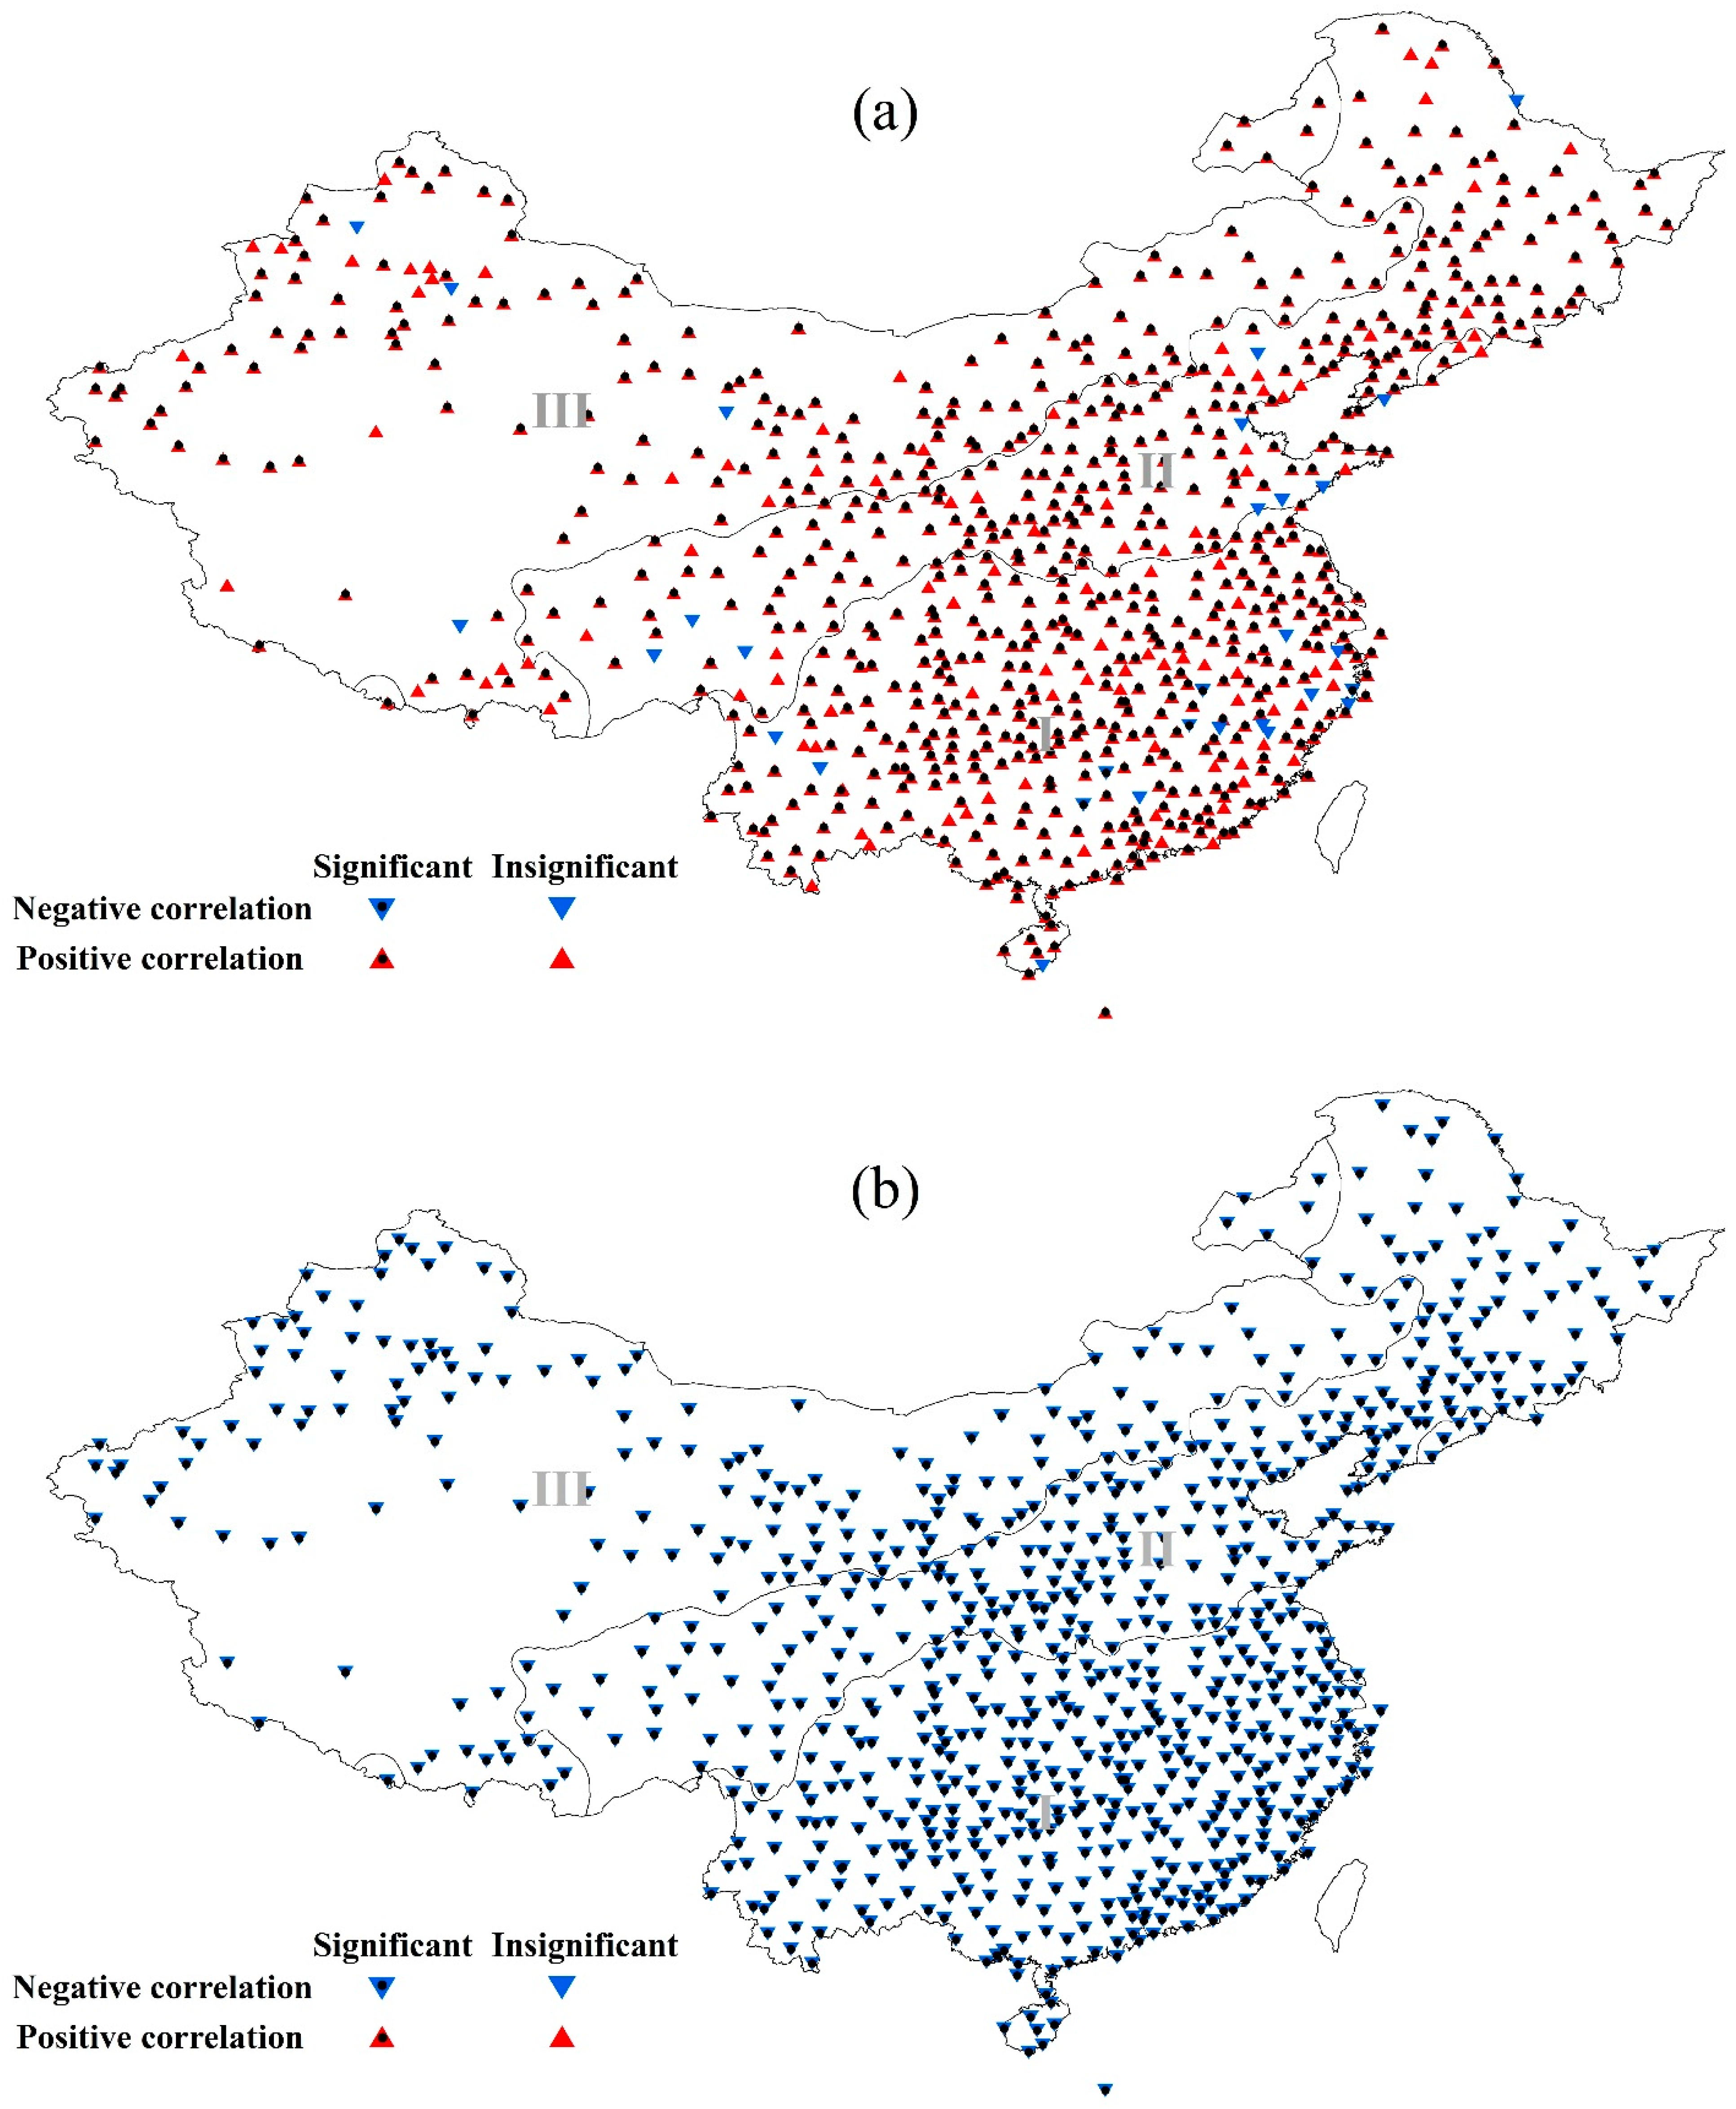
- Most stations (85%) showed significant positive correlations between annual PDI and SAIT. PDI and SAIP were significantly negatively correlated at all stations. SAIT and SAIP were positively correlated in some stations (23%) and negatively correlated in a few stations (1%).
- (4)
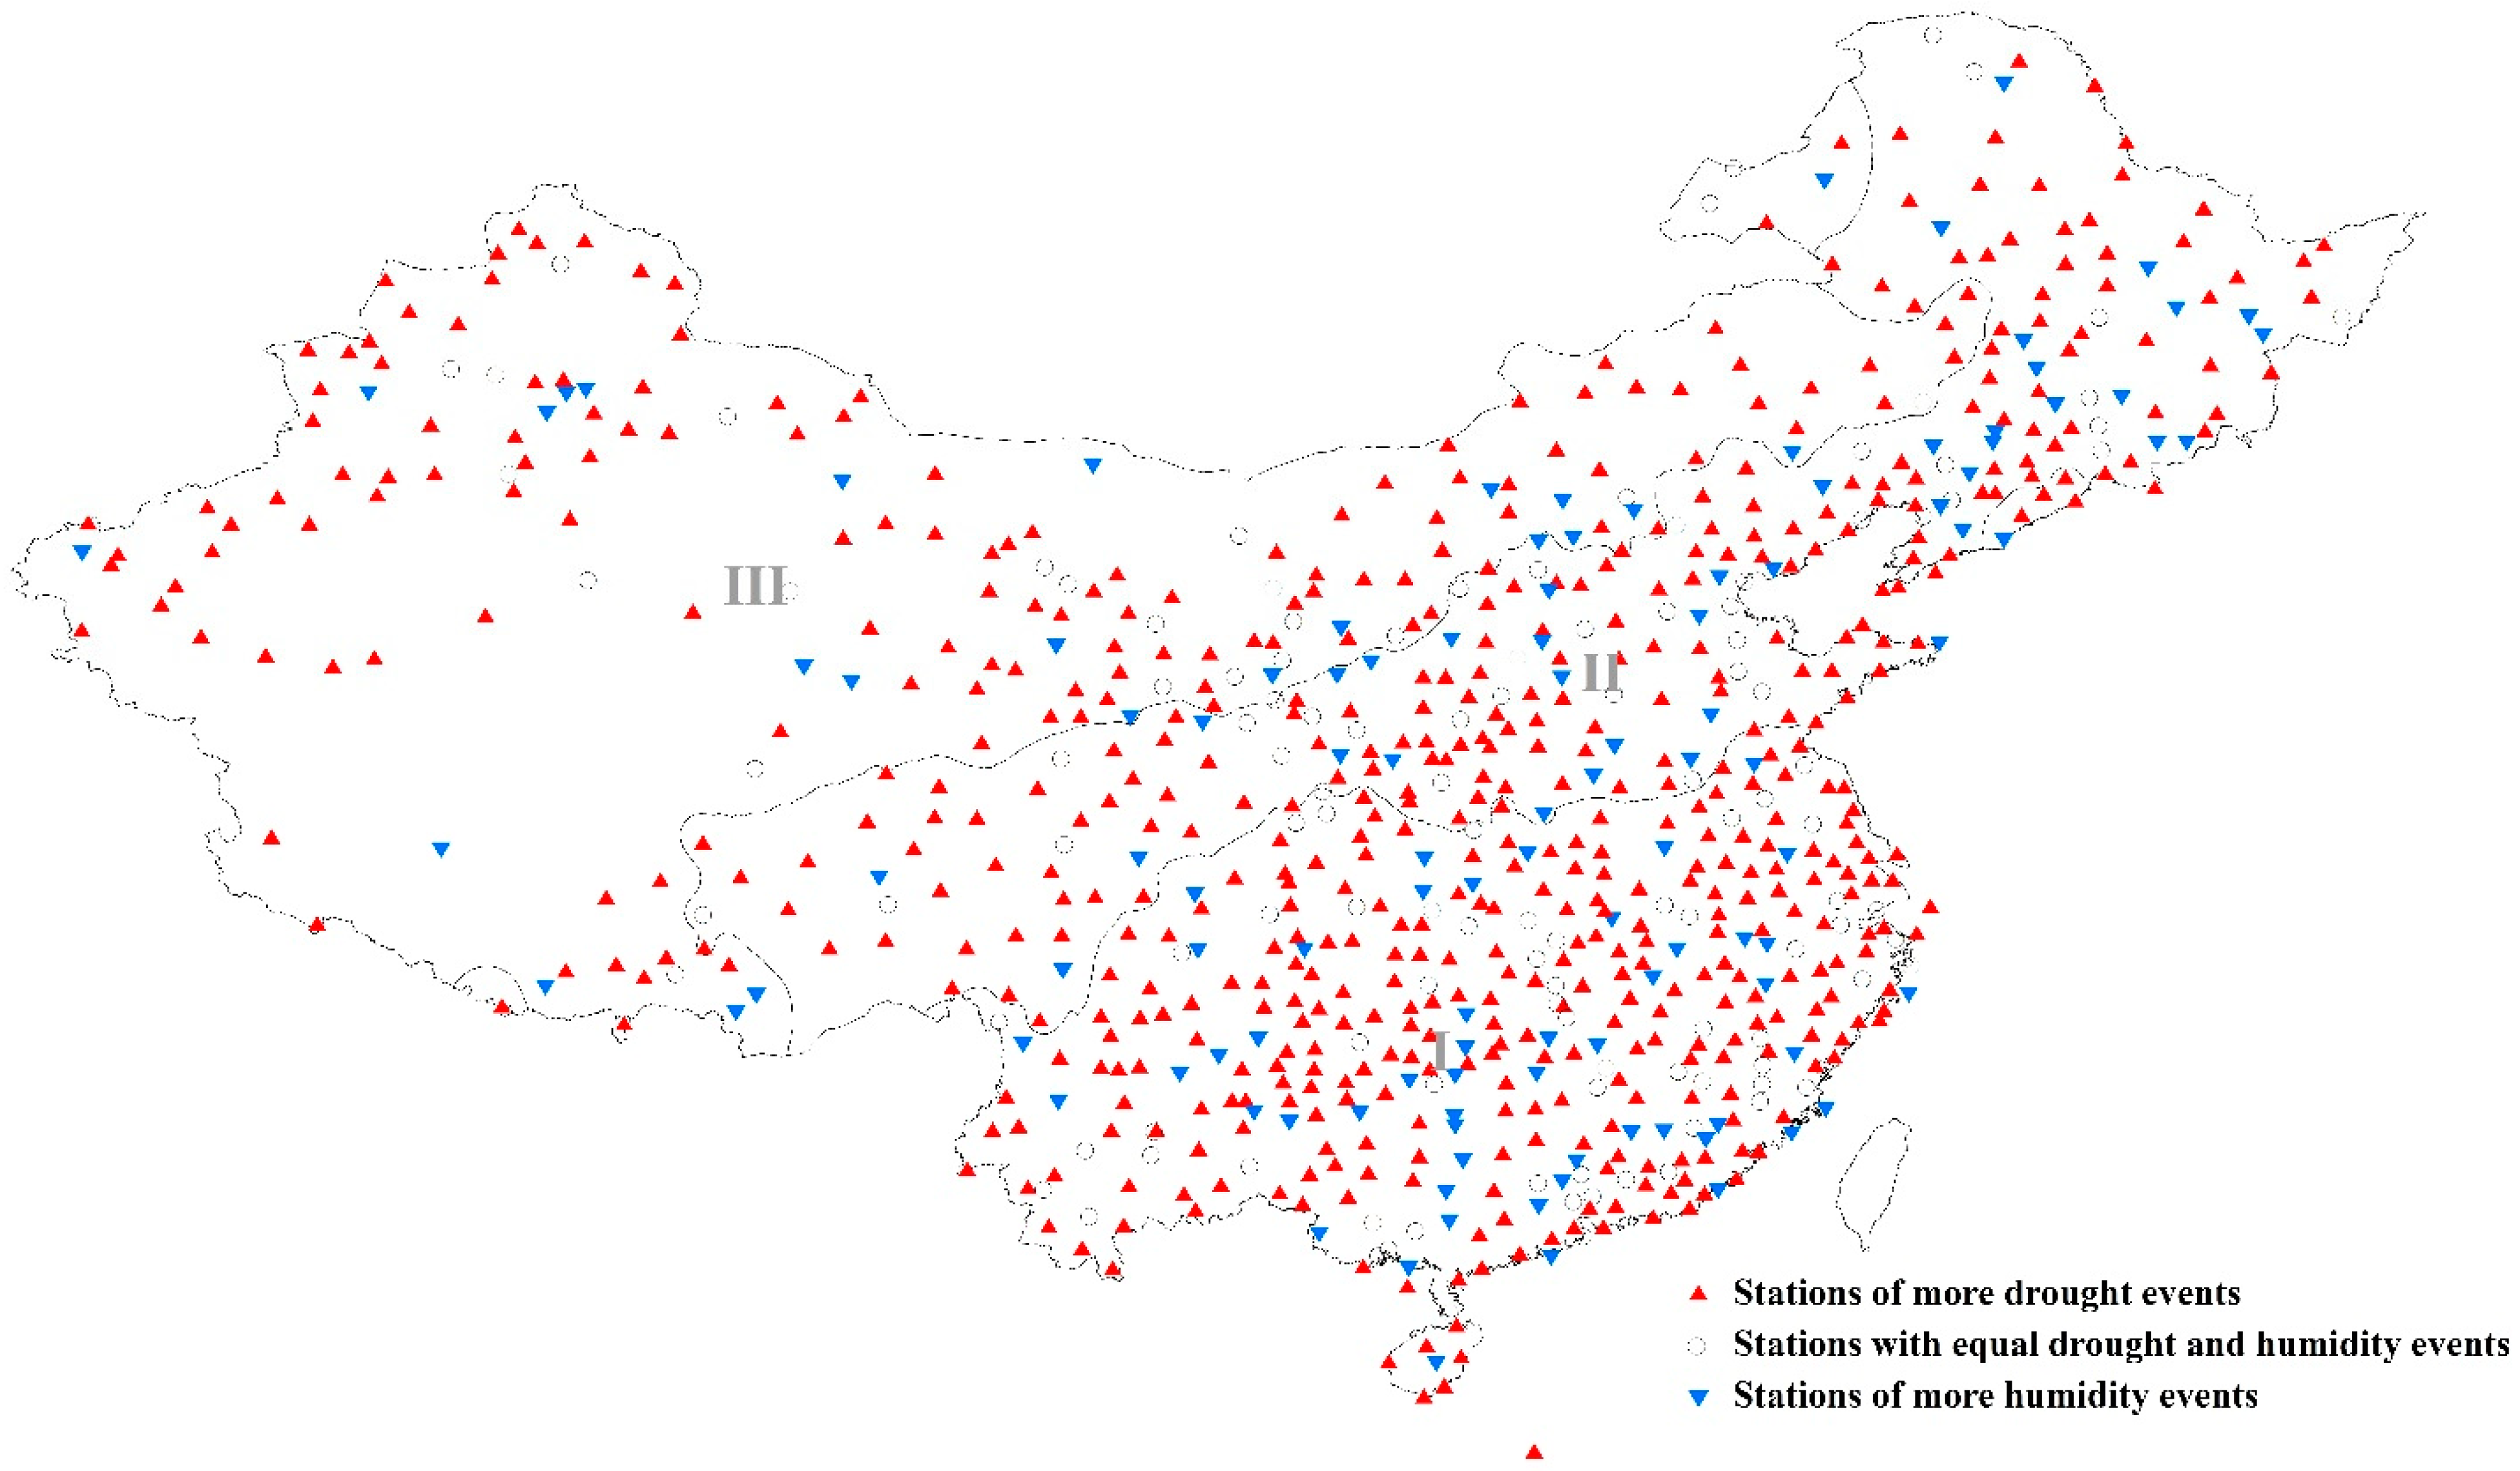
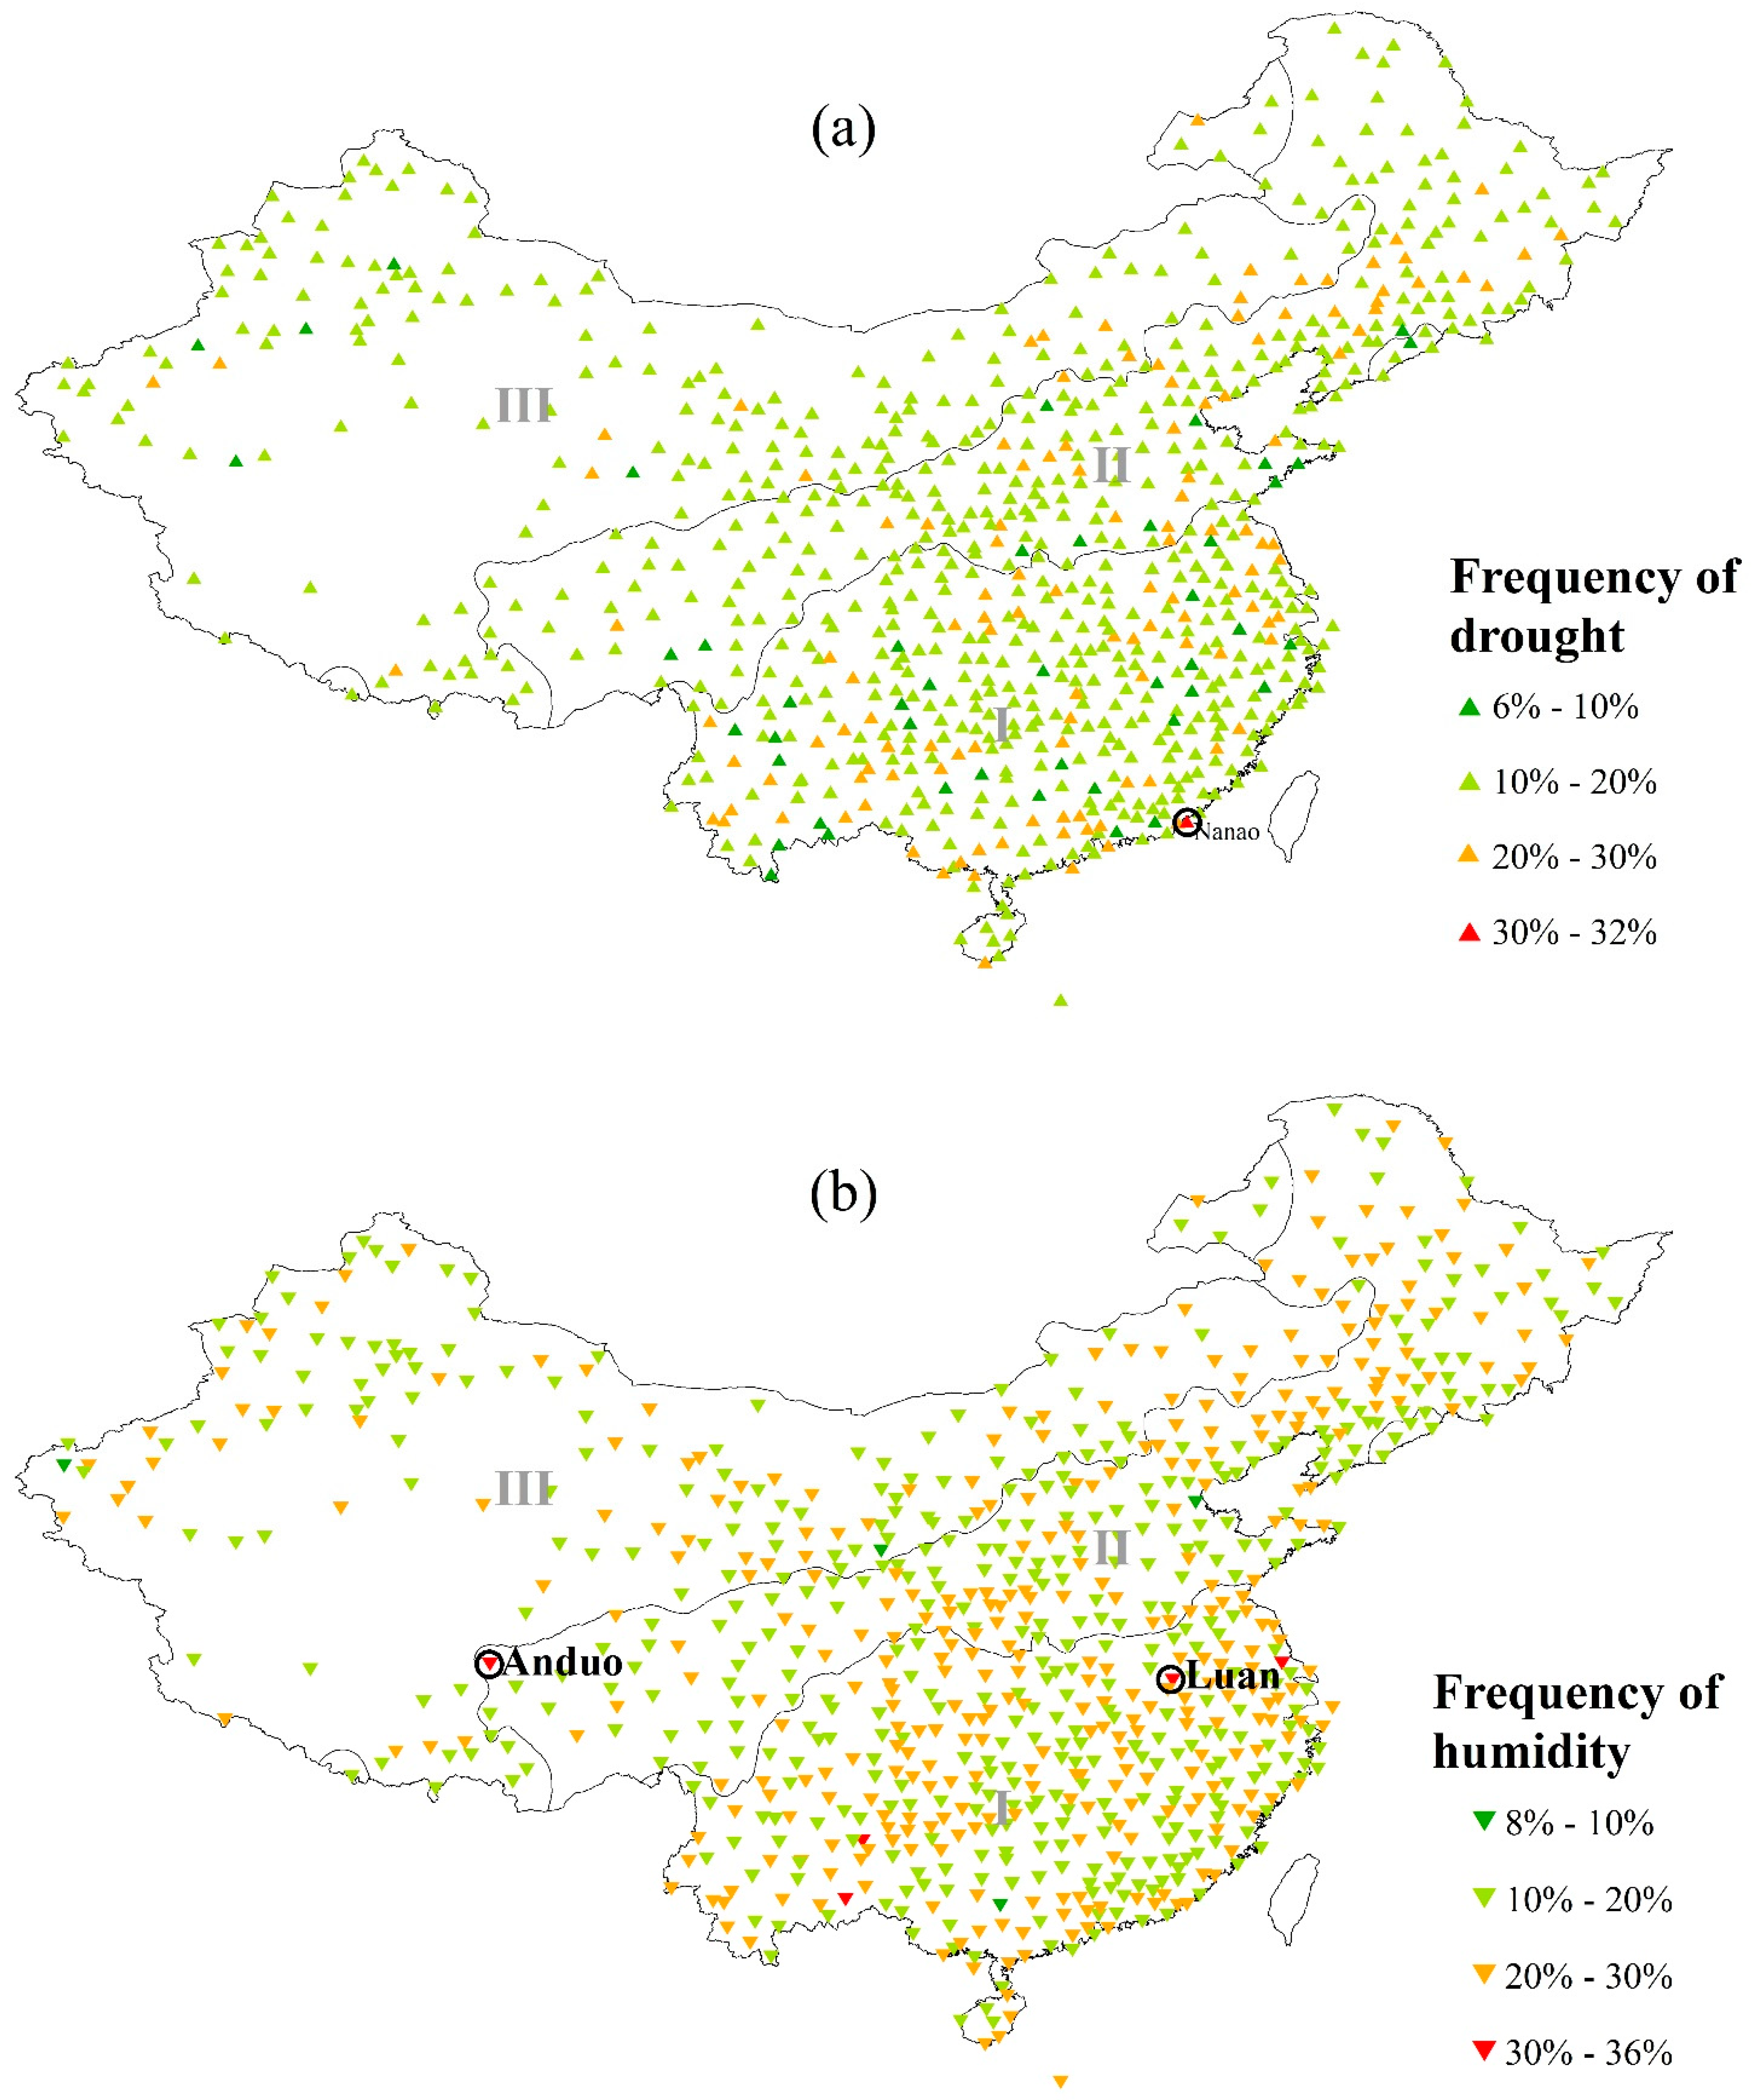
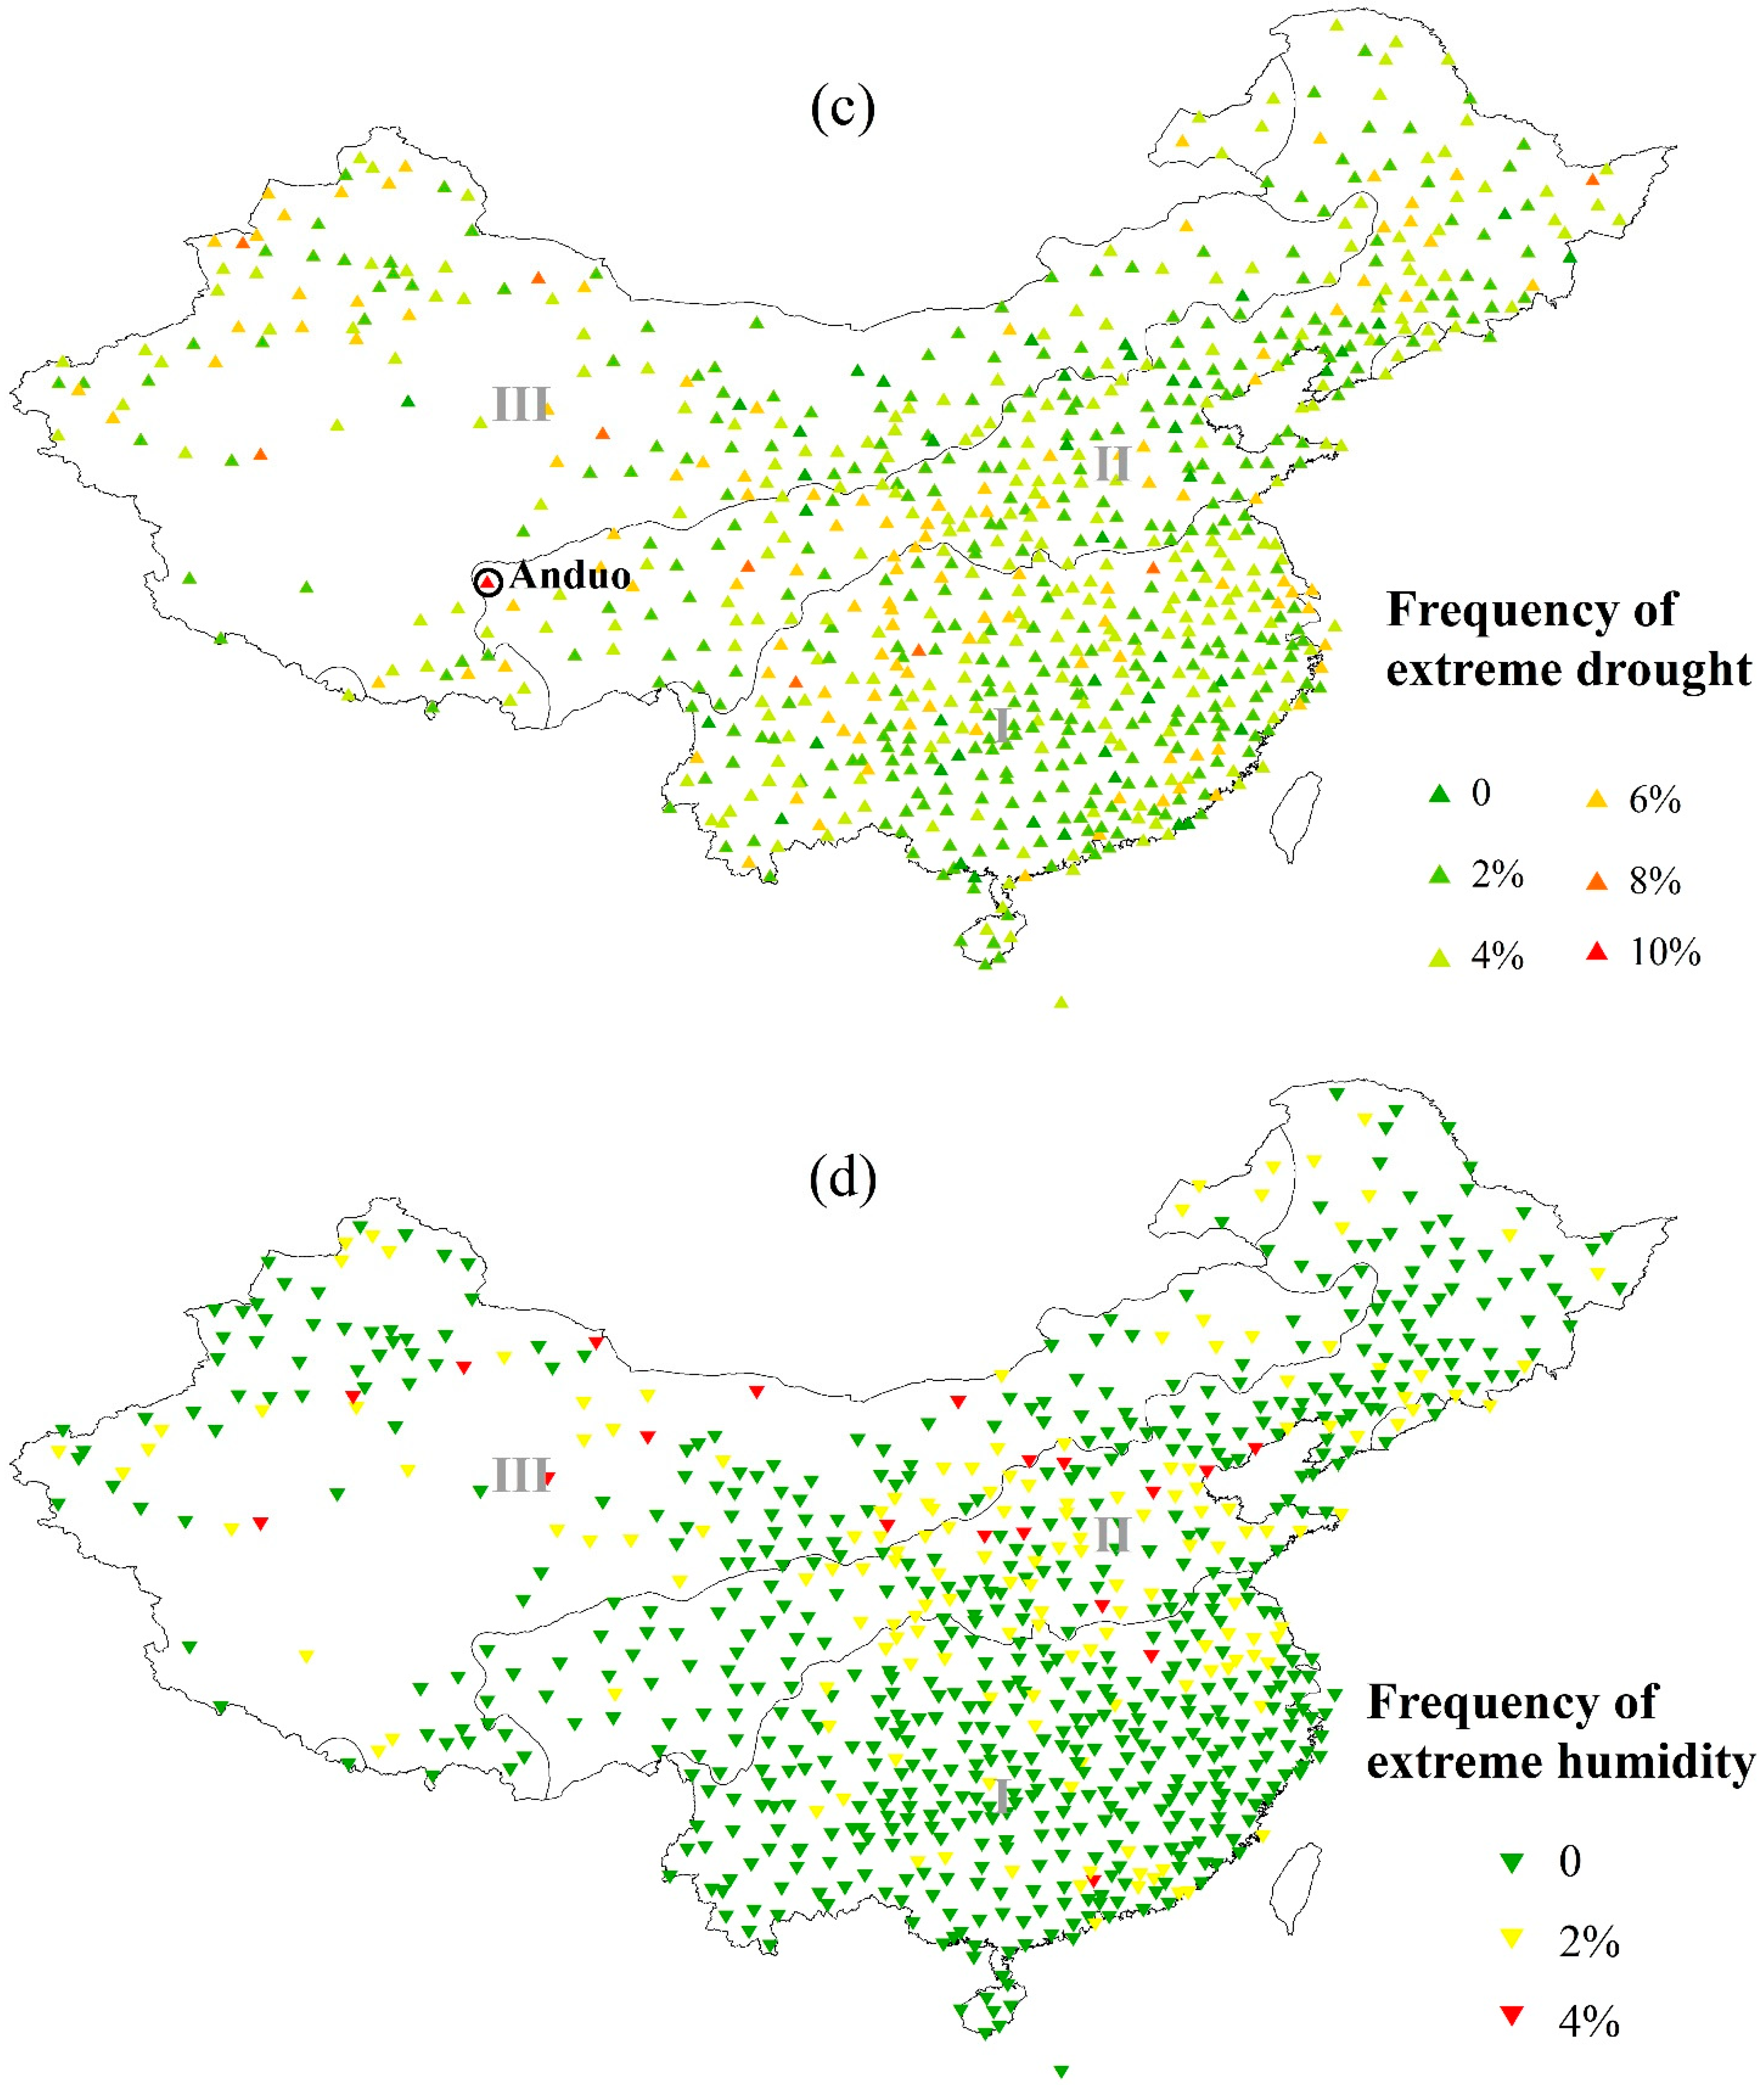
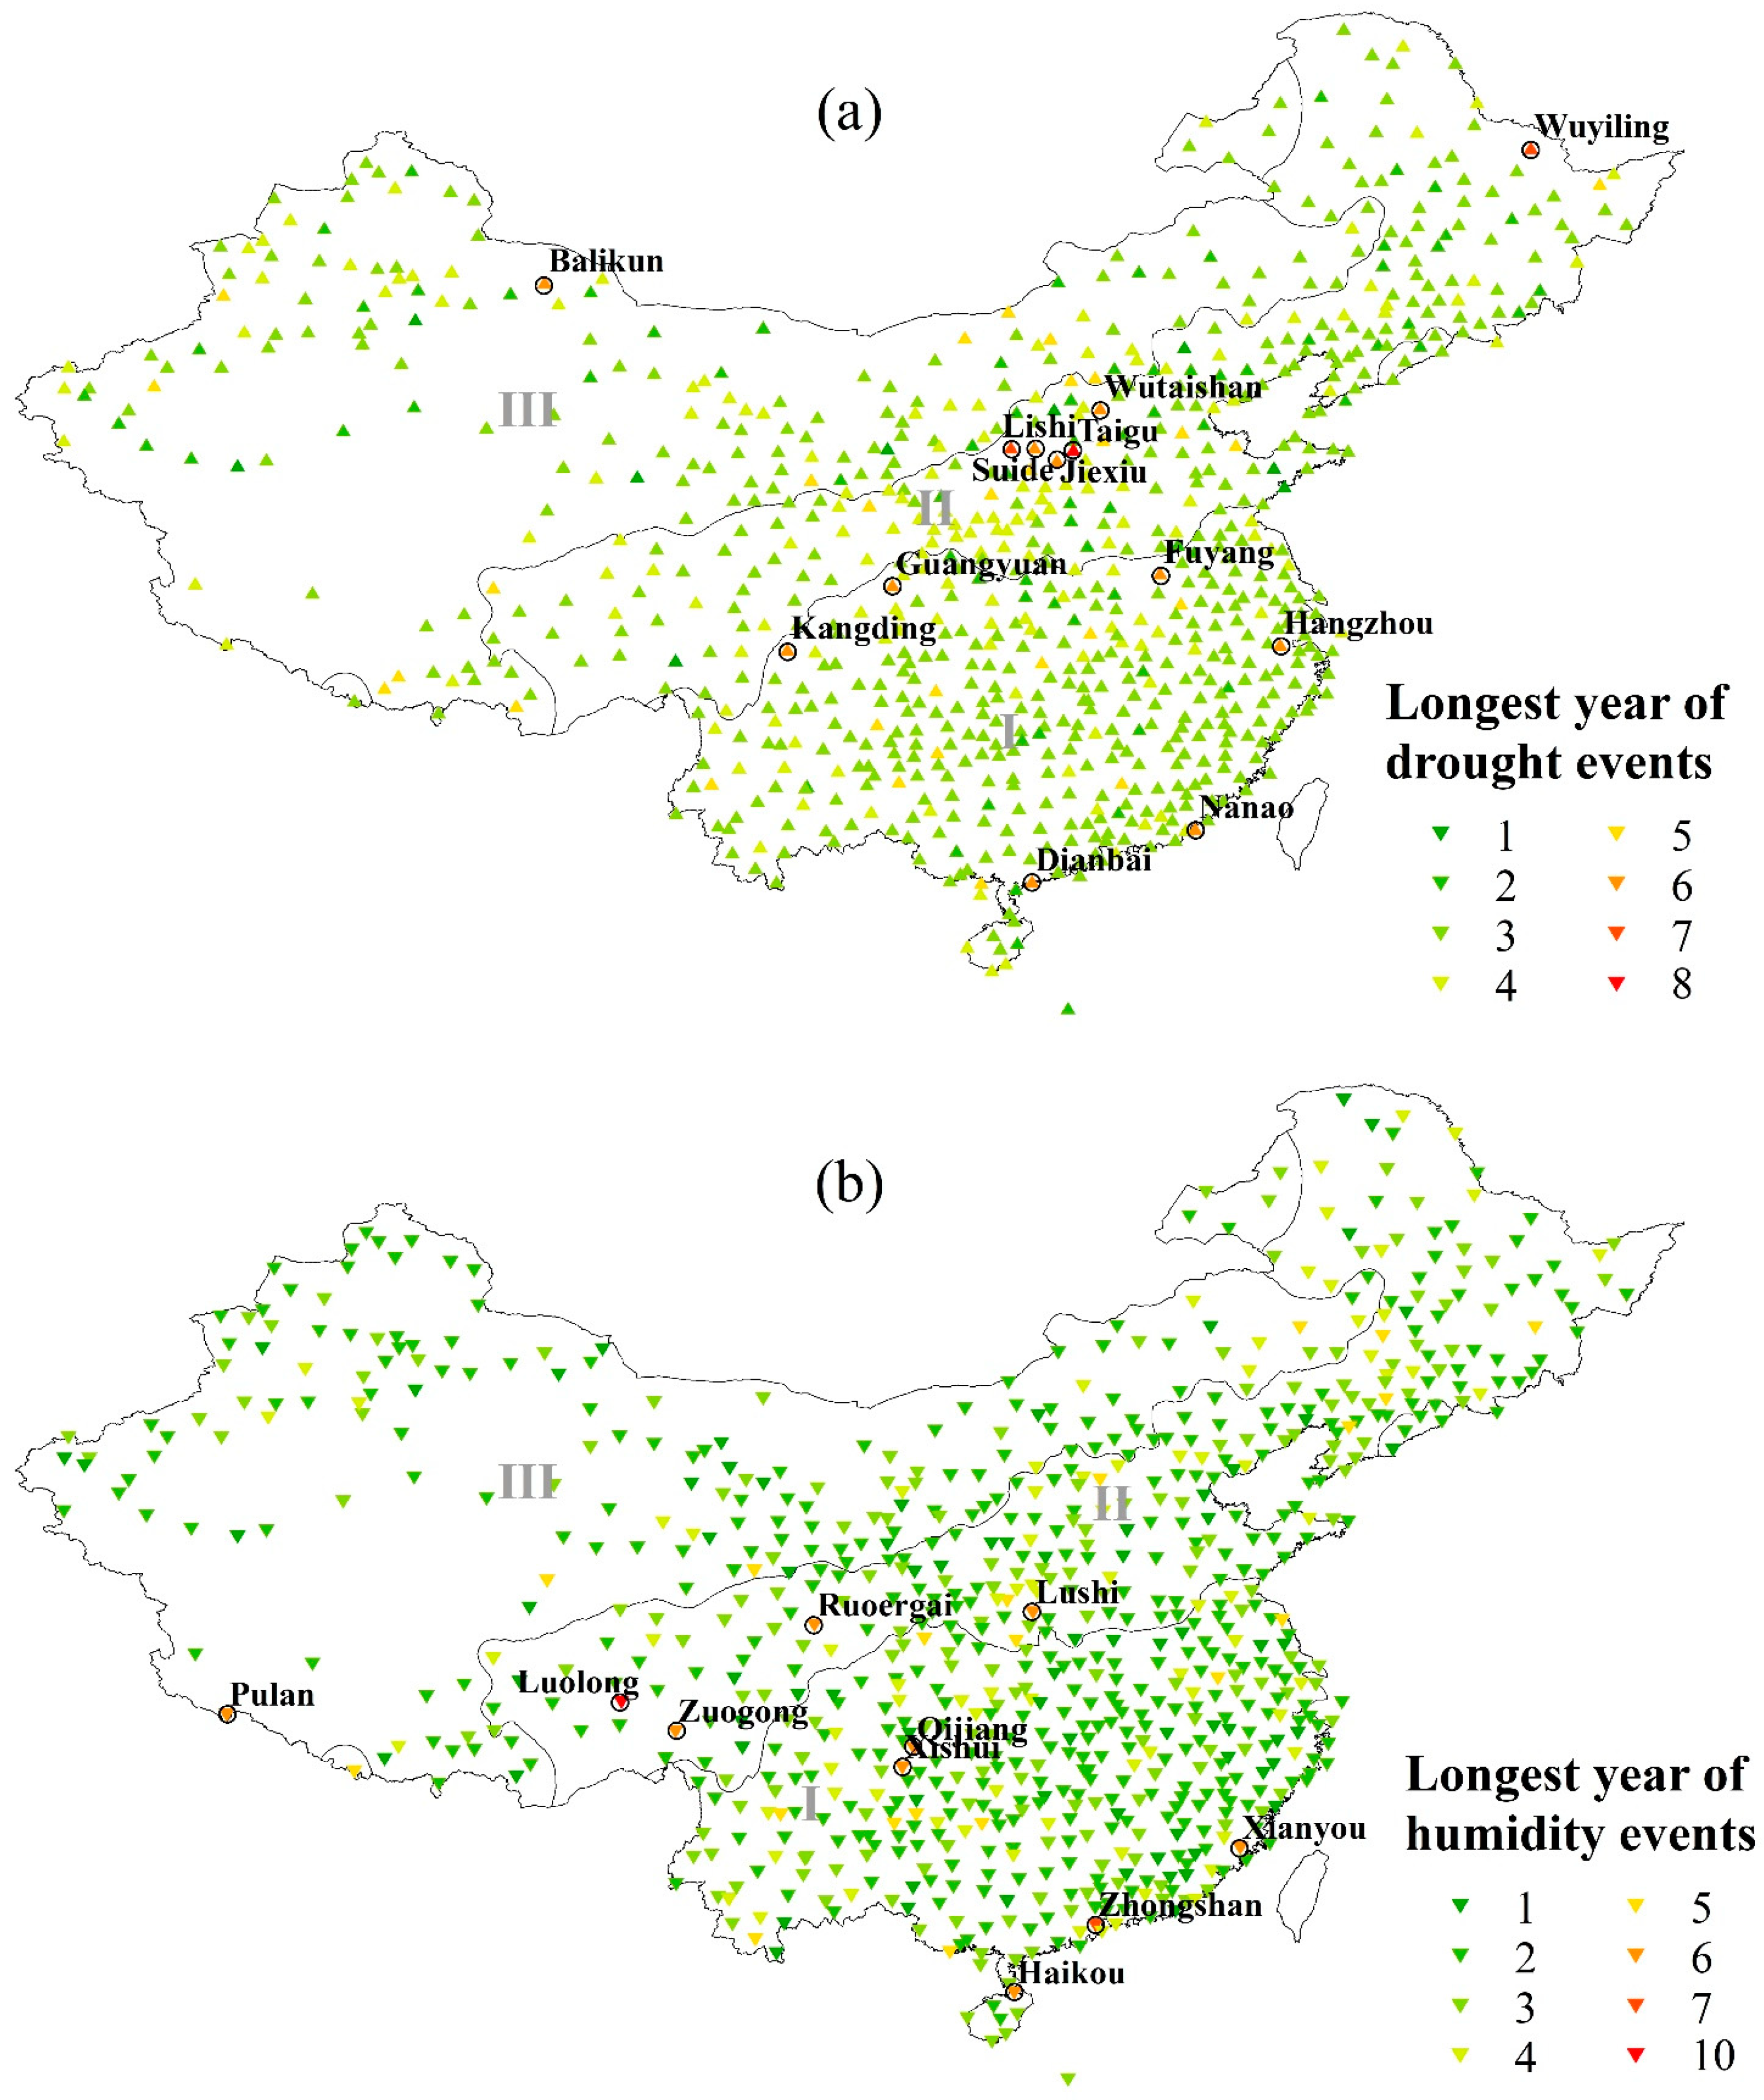
- Most stations (71%) experienced more drought events, and a few (14%) experienced more wet events or humidity events over the past 50 years. The frequency of drought events ranged from 6% to 32% and humidity events ranged from 8% to 36%. Most stations (95%) experienced extreme drought events, with a frequency range from 2% to 10%. A few (21%) experienced extreme humidity events, with a frequency range from 2% to 4%.
- (5)
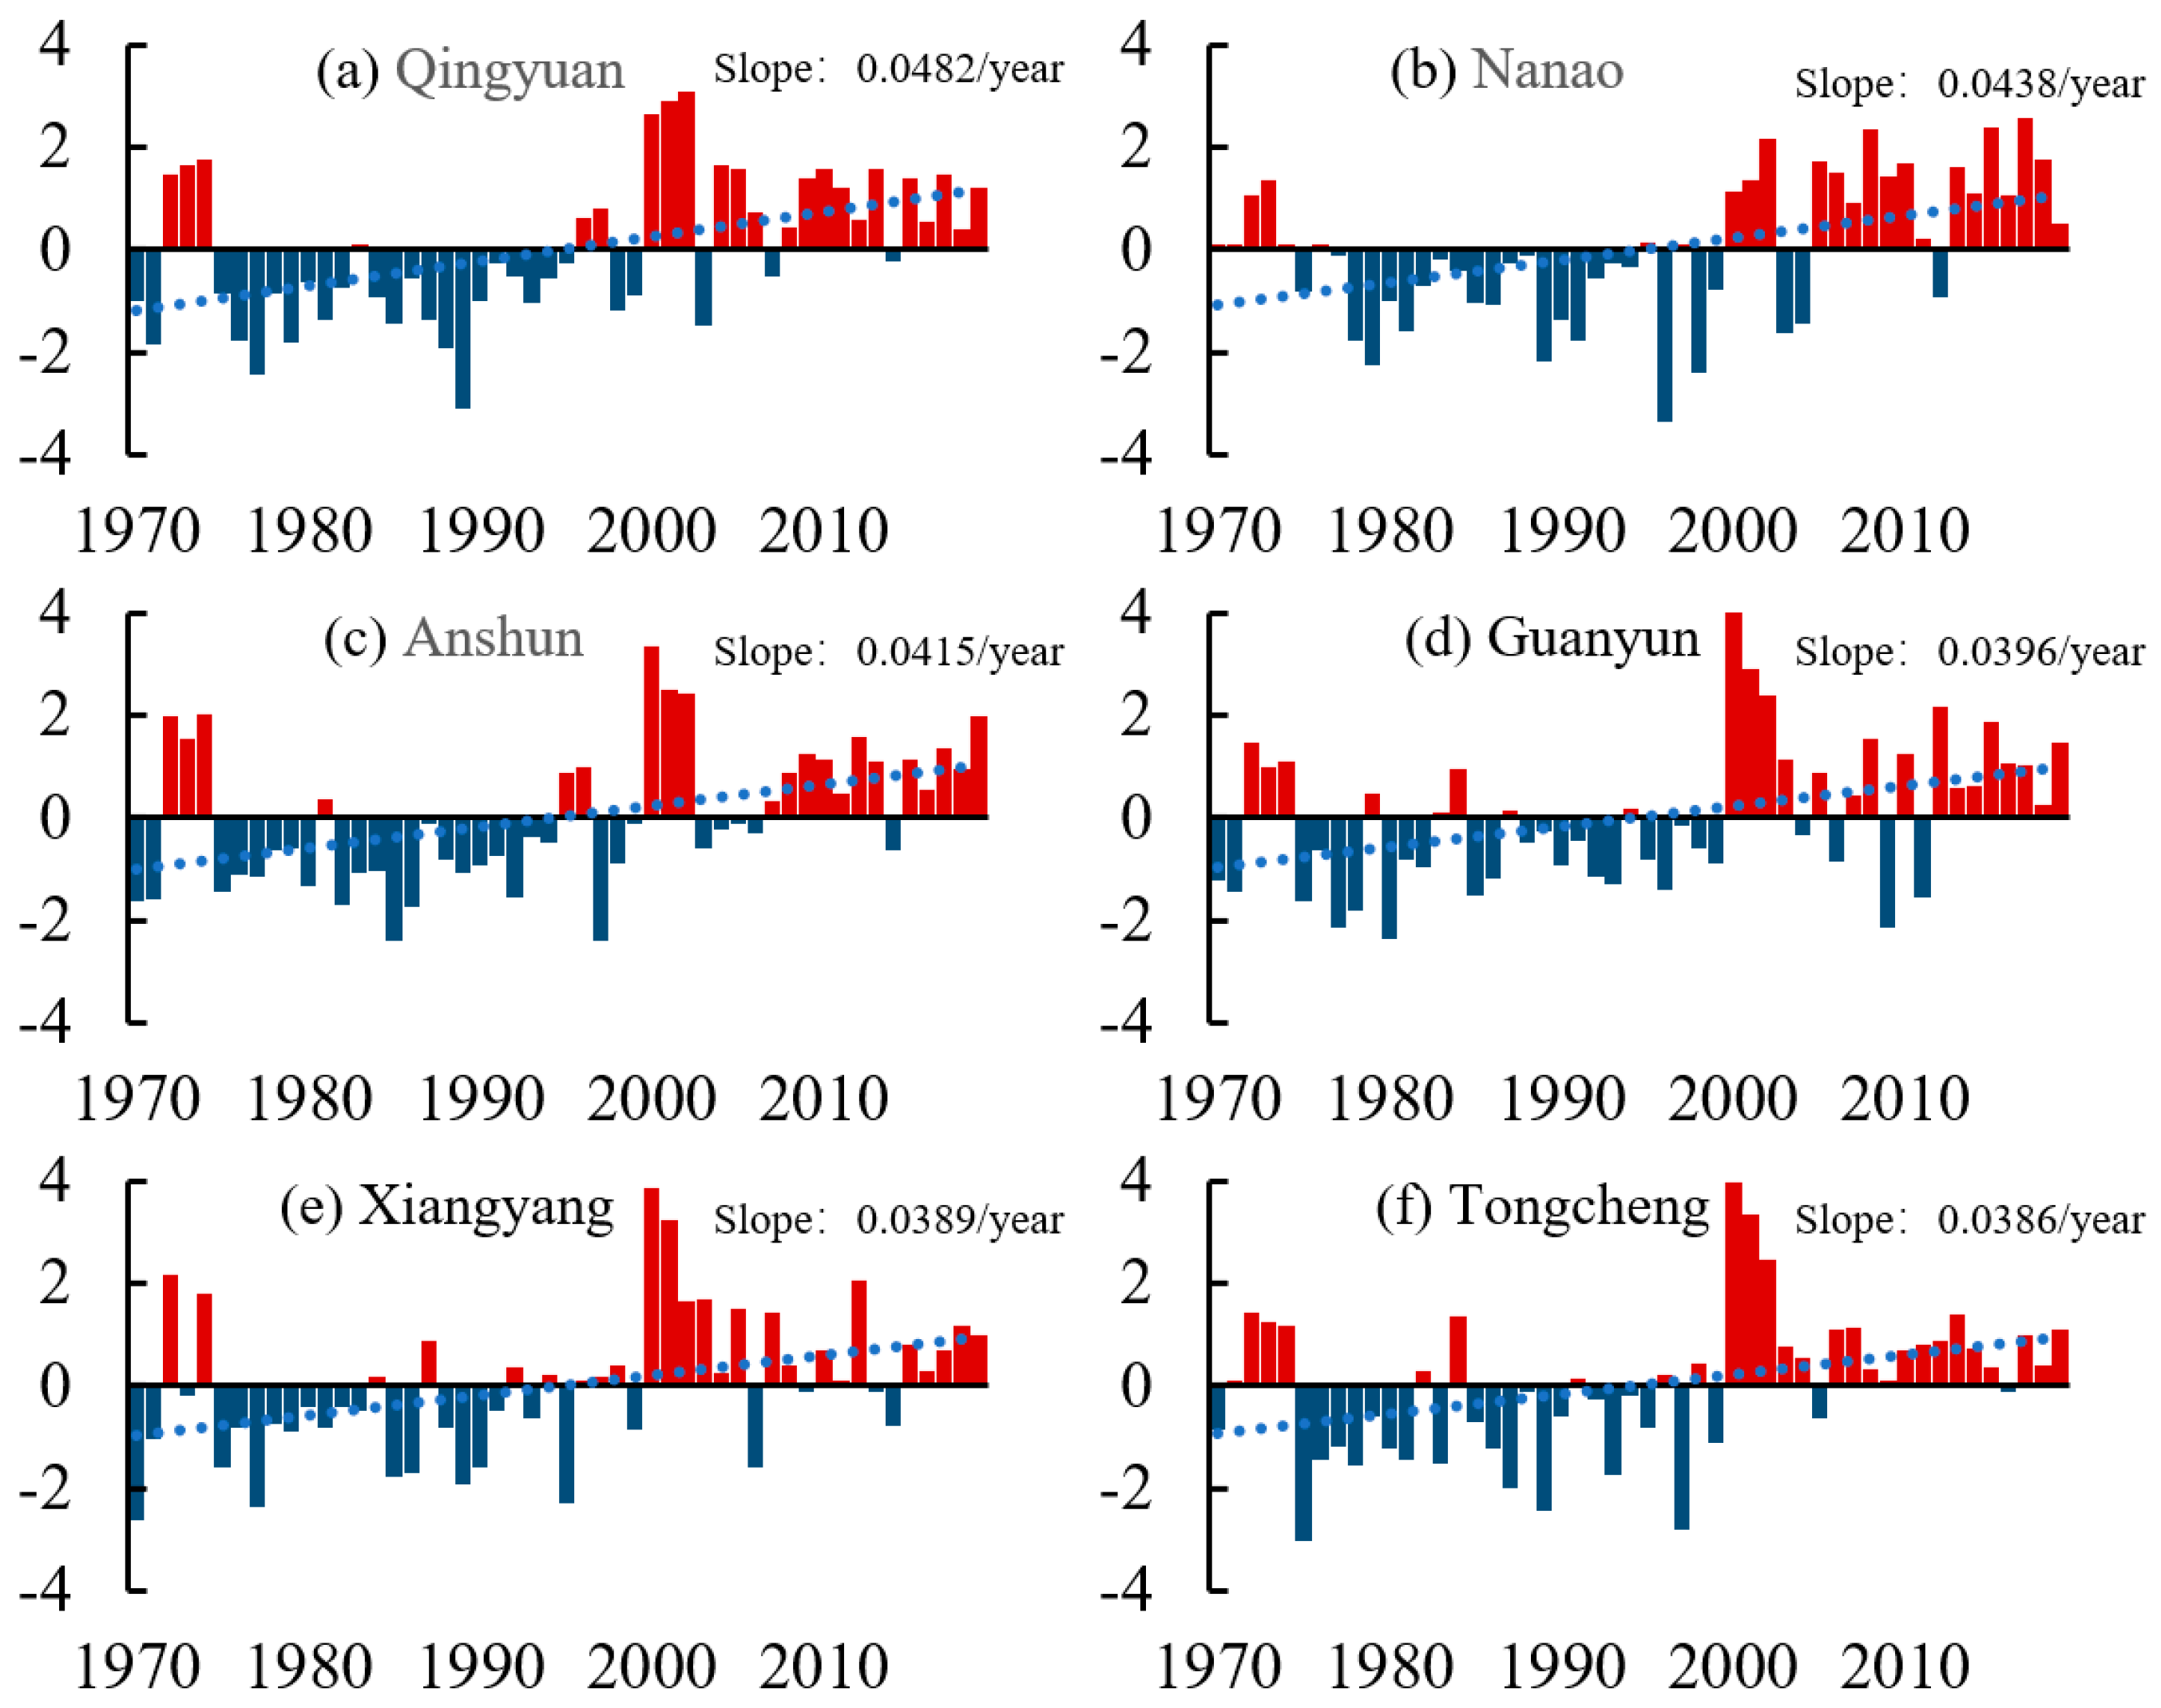
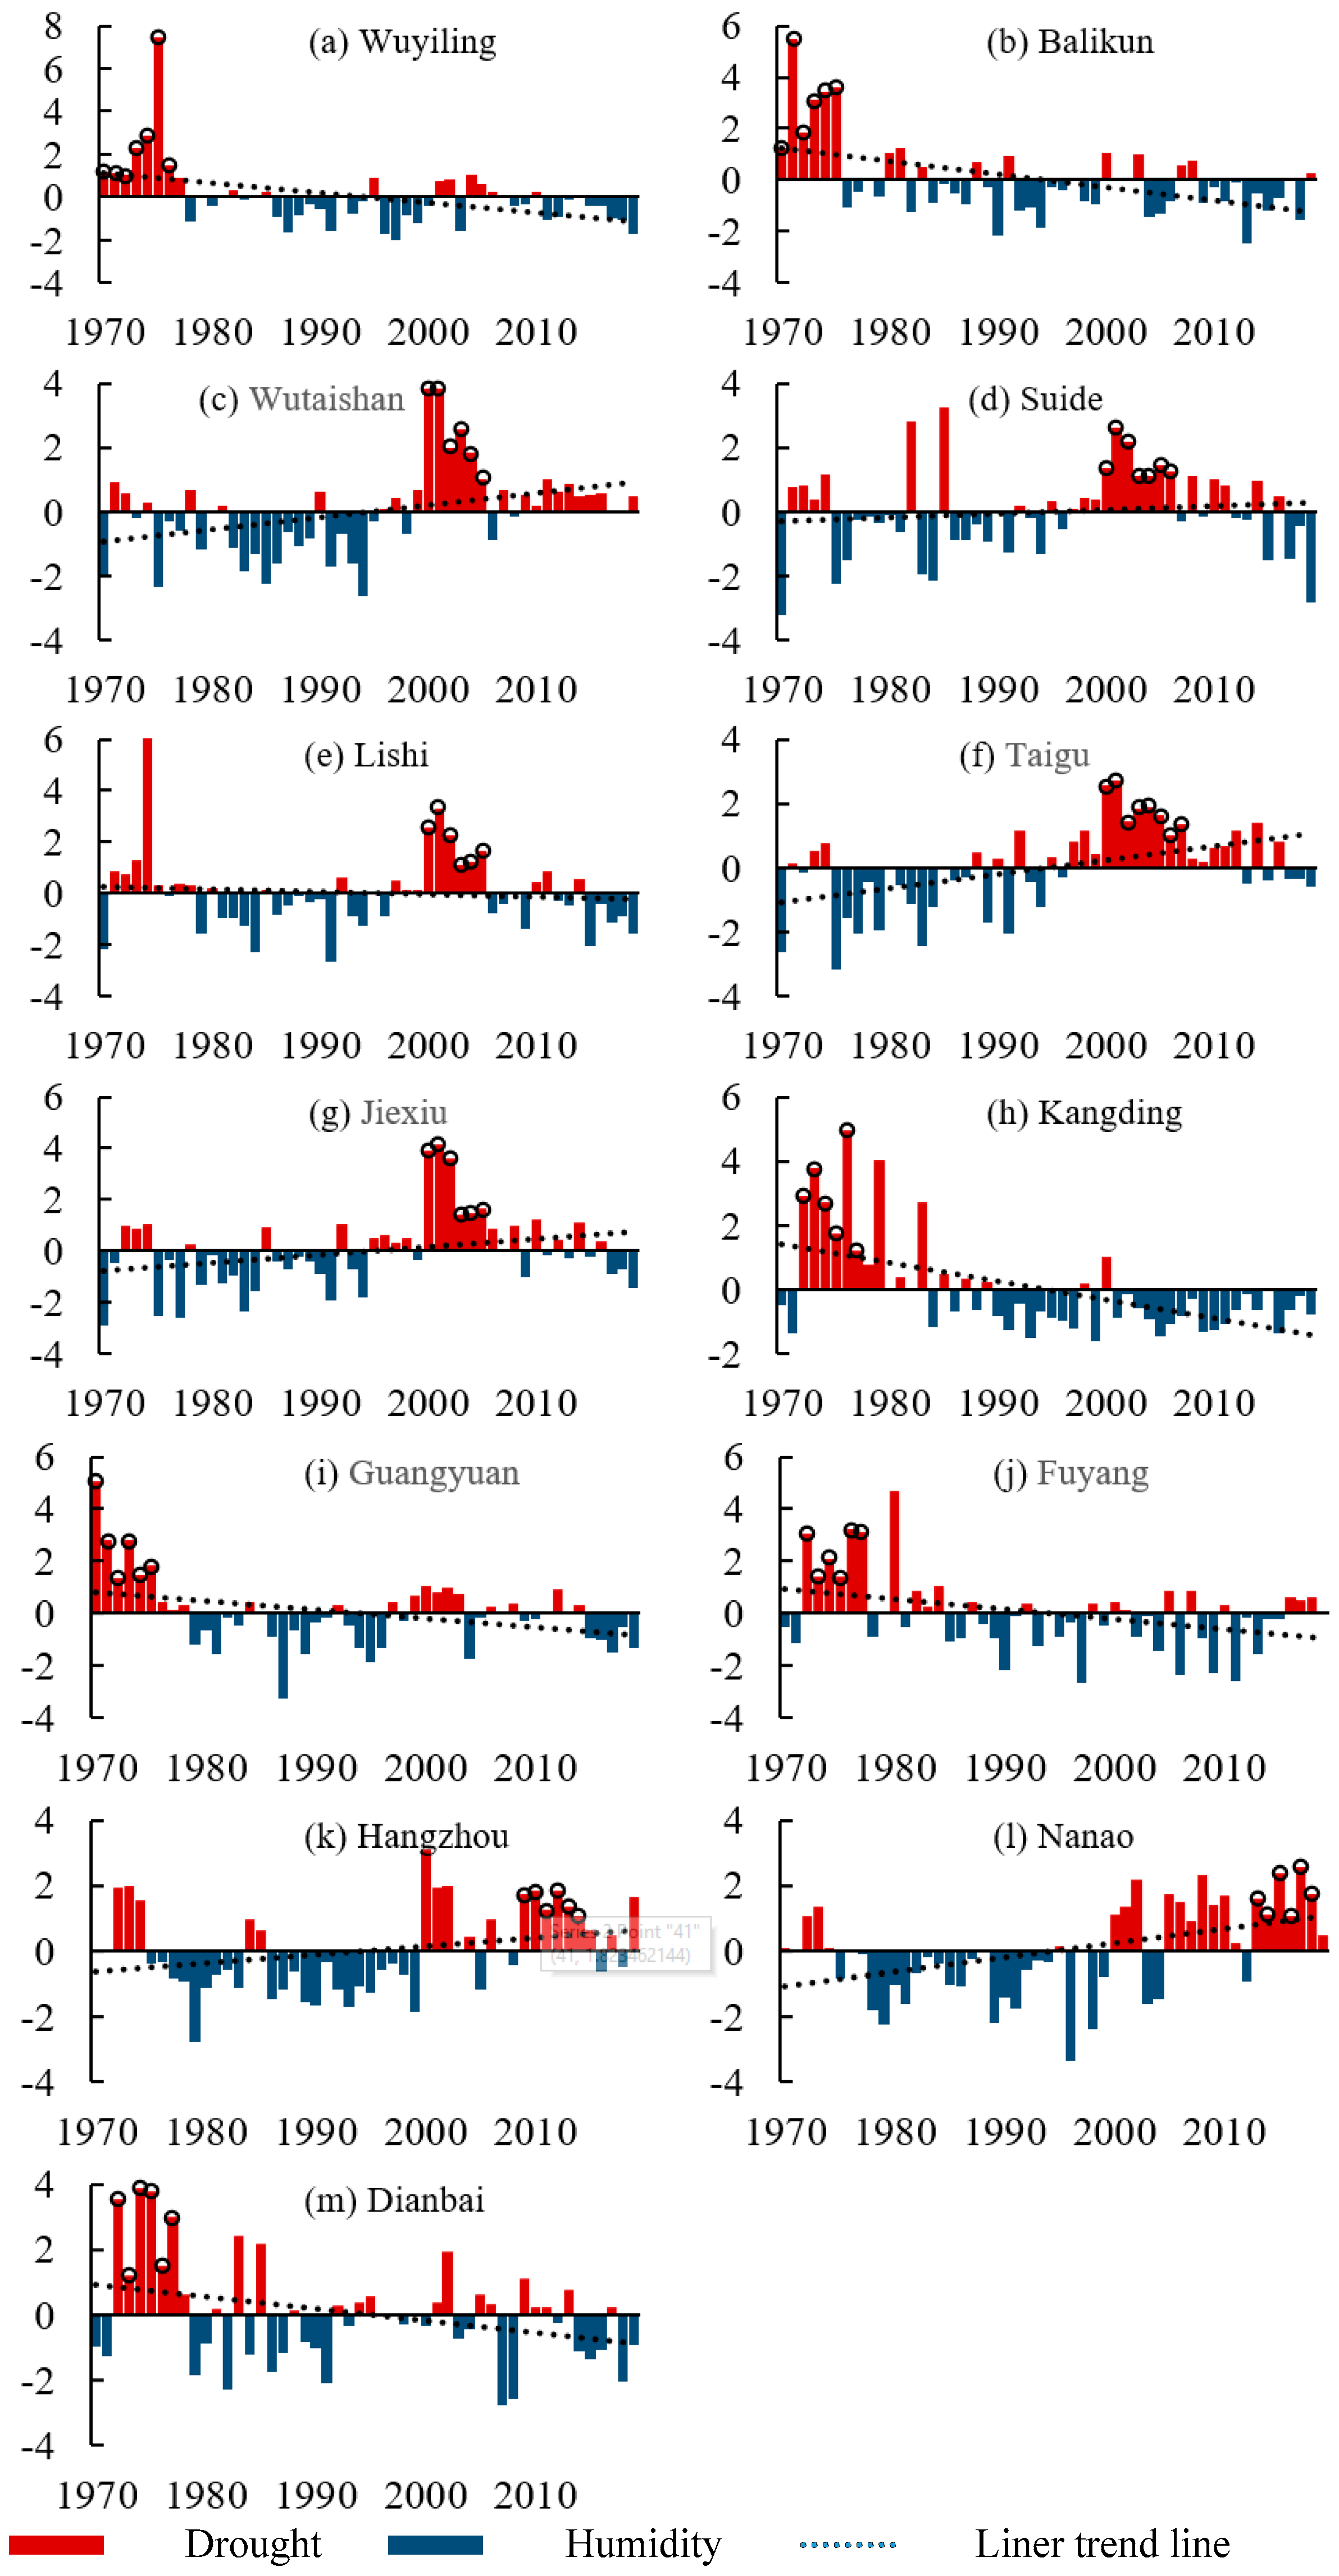
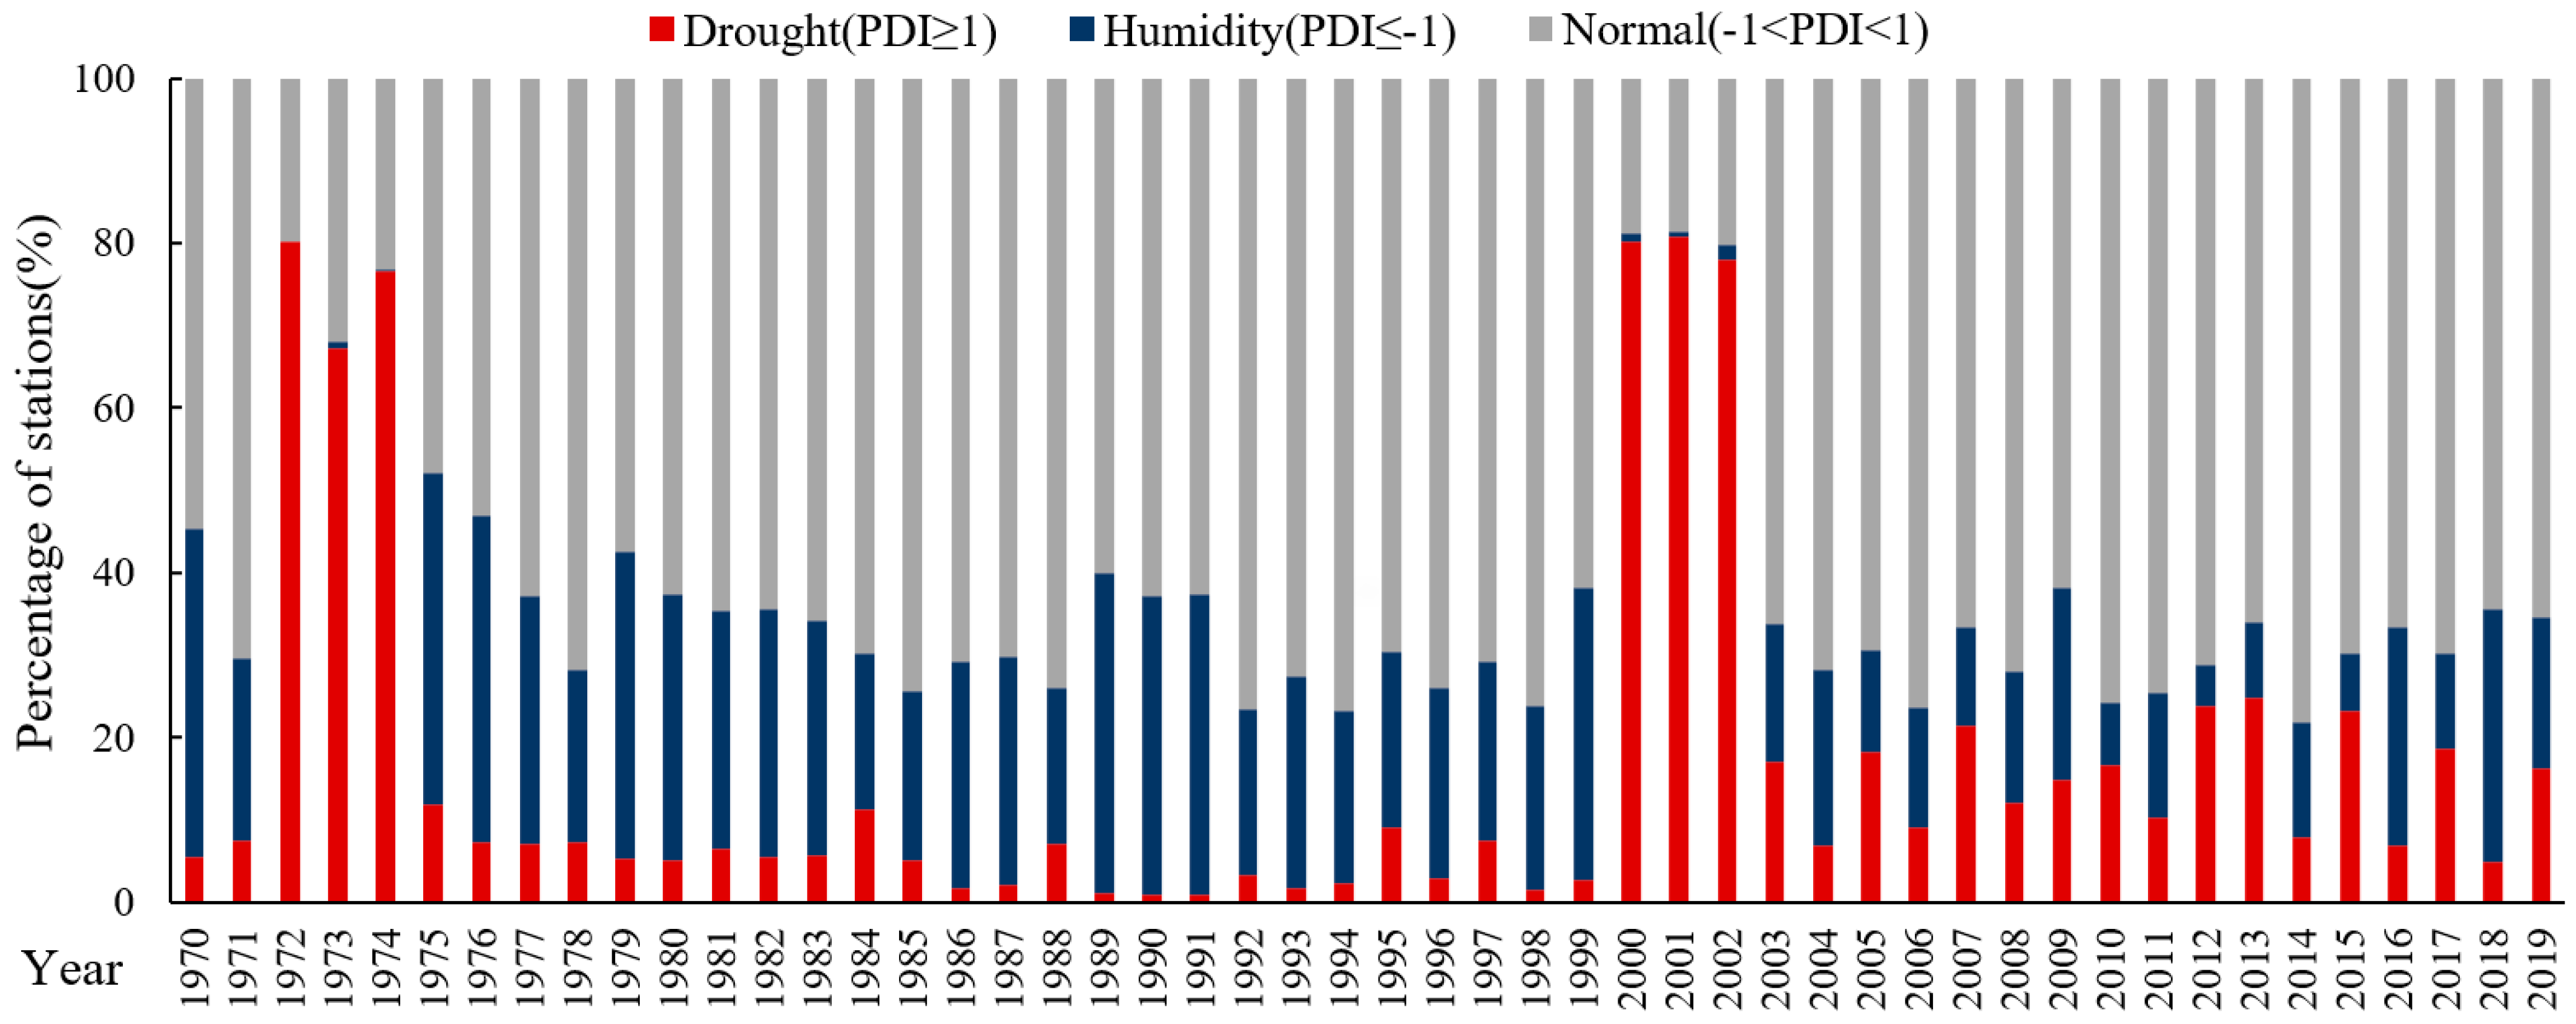
- Most stations experienced drought conditions during both 1972–1974 and 2000–2002. Drought events occurred at very few stations during the period of 1989–1991. Both periods of 1976–1983 and 1985–1999 can be considered as humidity periods throughout China.
Author Contributions
Funding
Institutional Review Board Statement
Informed Consent Statement
Data Availability Statement
Acknowledgments
Conflicts of Interest
References
- Keyantash, J.; Dracup, J.A. The quantification of drought: An evaluation of drought indices. Bull. Am. Meteorol. Soc. 2002, 83, 1167–1180. [Google Scholar] [CrossRef]
- Svoboda, M.; LeComte, D.; Hayes, M.; Heim, R.; Gleason, K.; Angel, J.; Rippey, B.; Tinker, R.; Palecki, M.; Stooksbury, D.; et al. The drought monitor. Bull. Am. Meteorol. Soc. 2002, 83, 1181–1192. [Google Scholar] [CrossRef] [Green Version]
- Yu, M.X.; Li, Q.F.; Hayes, M.J.; Svoboda, M.D.; Heim, R.R. Are droughts becoming more frequent or severe in China based on the Standardized Precipitation Evapotranspiration Index: 1951–2010? Int. J. Climatol. 2014, 34, 545–558. [Google Scholar] [CrossRef]
- Mishra, A.K.; Singh, V.P. A review of drought concepts. J. Hydrol. 2010, 391, 204–216. [Google Scholar] [CrossRef]
- Kundzewicz, Z.W. Adaptation to floods and droughts in the Baltic Sea basin under climate change. Boreal Environ. Res. 2009, 14, 193–203. [Google Scholar]
- McNeeley, S.M.; Beeton, T.A.; Ojima, D.S. Drought risk and adaptation in the interior United States: Understanding the importance of local context for resource management in times of drought. Weather Clim. Soc. 2016, 8, 147–161. [Google Scholar] [CrossRef] [Green Version]
- Otkin, J.A.; Svoboda, M.; Hunt, E.D.; Ford, T.W.; Anderson, M.C.; Hain, C.; Basara, J.B. Flash droughts: A review and assessment of the challenges imposed by rapid onset droughts in the United States. Bull. Am. Meteorol. Soc. 2018, 99, 911–919. [Google Scholar] [CrossRef]
- Mu, Q.; Zhao, M.; Kimball, J.S.; McDowell, N.G.; Running, S.W. A remotely sensed global terrestrial drought severity index. Bull. Am. Meteorol. Soc. 2013, 94, 83–98. [Google Scholar] [CrossRef] [Green Version]
- Vicente-Serrano, S.M.; Begueria, S.; Lopez-Moreno, J.I. A multiscalar drought index sensitive to global warming: The standardized precipitation evapotranspiration index. J. Clim. 2010, 23, 1696–1718. [Google Scholar] [CrossRef] [Green Version]
- McKee, T.B.; Doesken, N.J.; Kleist, J. The relationship of drought frequency and duration t time scales. In Proceedings of the Eighth Conference on Applied Climatology, Anaheim, CA, USA, 17–22 January 1993; American Meteorological Society: Anaheim, CA, USA, 1993. [Google Scholar]
- Weghorst, K. The reclamation drought index: Guidelines and practical applications. In Proceedings of the North American Water and Environment Congress & Destructive Water, Anaheim, CA, USA, 22–28 June 1996. [Google Scholar]
- Palmer, W. Meteorological Droughts; Weather Bureau Research Paper 45; U.S. Department of Commerce: Washington, DC, USA, 1965; p. 58.
- Van Rooy, M.P. A Rainfall Anomally Index Independent of Time and Space, Notos. Weather Bur. South Afr. 1965, 14, 43–48. [Google Scholar]
- Yang, P.; Xiao, Z.; Yang, J.; Liu, H. Characteristics of clustering extreme drought events in China during 1961–2010. Acta Meteorol. Sin. 2013, 27, 186–198. [Google Scholar] [CrossRef]
- Lu, E.; Luo, Y.; Zhang, R.; Wu, Q.; Liu, L. Regional atmosphere anomalies responsible for the 2009–2010 severe drought in China. J. Geophys. Res. 2011, 116, D2114. [Google Scholar] [CrossRef]
- Zhang, L.; Xiao, J.; Li, J.; Wang, K.; Lei, L.; Guo, H. The 2010 spring drought reduced primary productivity in southwestern China. Environ. Res. Lett. 2012, 7, 045706. [Google Scholar] [CrossRef] [Green Version]
- Zhao, C.; Deng, X.; Yuan, Y.; Yan, H.; Liang, H. Prediction of drought risk based on the WRF model in yunnan province of China. Adv. Meteorol. 2013, 2013, 295856. [Google Scholar] [CrossRef]
- Zou, X.; Zhai, P.; Zhang, Q. Variations in drought over China: 1951–2003. Geophys. Res. Lett. 2005, 32, L04707. [Google Scholar] [CrossRef]
- Lu, G.H.; Wu, Z.Y.; Wen, L.; Lin, C.A.; Zhang, J.Y.; Yang, Y. Real-time flood forecast and flood alert map over the Huaihe River Basin in China using a coupled hydro-meteorological modeling system. Sci. China Ser. E-Technol. Sci. 2008, 51, 1049–1063. [Google Scholar] [CrossRef]
- Lu, G.H.; Xiao, H.; Wu, Z.Y.; Zhang, S.L.; Li, Y. Assessing the Impacts of Future Climate Change on Hydrology in Huang-Huai-Hai Region in China Using the PRECIS and VIC Models. J. Hydrol. Eng. 2013, 18, 1077–1087. [Google Scholar] [CrossRef]
- Lu, G.H.; Wu, H.W.; Xiao, H.; He, H.; Wu, Z.Y. Impact of Climate Change on Drought in the Upstream Yangtze River Region. Water 2016, 8, 576. [Google Scholar] [CrossRef] [Green Version]
- Xu, K.; Yang, D.W.; Yang, H.B.; Li, Z.; Qin, Y.; Shen, Y. Spatio-temporal variation of drought in China during 1961–2012: A climatic perspective. J. Hydrol. 2015, 526, 253–264. [Google Scholar] [CrossRef]
- Ma, B.; Zhang, B.; Jia, L.G.; Huang, H. Conditional distribution selection for SPEI-daily and its revealed meteorological drought characteristics in China from 1961 to 2017. Atmos. Res. 2020, 246. [Google Scholar] [CrossRef]
- Zhang, Q.; Yao, Y.B.; Li, Y.H.; Huang, J.P.; Ma, Z.G.; Wang, Z.L.; Zhang, Y. Causes and Changes of Drought in China: Research Progress and Prospects. J. Meteorol. Res. 2020, 34, 460–481. [Google Scholar] [CrossRef]
- Lashkari, A.; Irannezhad, M.; Zare, H.; Labzovskii, L. Assessing long-term spatio-temporal variability in humidity and drought in Iran using Pedj Drought Index (PDI). J. Arid. Environ. 2021, 185, 104336. [Google Scholar] [CrossRef]
- Naresh Kumar, M.; Murthy, C.S.; Sesha Sai, M.V.R.; Roy, P.S. On the use of Standardized Precipitation Index (SPI) for drought intensity assessment. Meteorol. Appl. 2009, 16, 381–389. [Google Scholar] [CrossRef] [Green Version]
- Stagge, J.H.; Tallaksen, L.M.; Gudmundsson, L.; Van Loon, A.F.; Stahl, K. Response to comment on ‘Candidate Distributions for Climatological Drought Indices (SPI and SPEI)’. Int. J. Climatol. 2016, 36, 2132–2138. [Google Scholar] [CrossRef]
- World Atlas of Desertification 2ED. UNEP. 1997. Available online: https://www.unep.org (accessed on 12 December 2021).
- Elagib, N.A.; Elhag, M.M. Major climate indicators of ongoing drought in Sudan. J. Hydrol. 2011, 409, 612–625. [Google Scholar] [CrossRef]
- Wu, Z.; Lu, G.; Wen, L.; Lin, C. Reconstructing and analyzing China’s fifty-nine year (1951–2009) drought history using hydrological model simulation. Hydrol. Earth Syst. Sci. 2011, 15, 2881–2894. [Google Scholar] [CrossRef] [Green Version]
- Pedj, D.A. On the indicator of drought and moisture surplus. In Proceedings of HMC of USSR; Science Press: Beijing, China, 1975; Volume 156, pp. 19–38. [Google Scholar]
- Sen, P.K. Estimates of the regression coefficient based on kendall’s tau. J. Am. Stat. Assoc. 1968, 63, 1379–1389. [Google Scholar] [CrossRef]
- Kanji, G.K. 100 Statistical Tests, 3rd ed.; SAGE: Thousand Oaks, CA, USA, 2006. [Google Scholar]
- Gilbert, R.O. Statistical Methods for Environmental Pollution Monitoring; John Wiley & Sons: Hoboken, NJ, USA, 1987. [Google Scholar] [CrossRef] [Green Version]
- Kendall, M.G. Rank correlation methods. Biometrika 1957. [Google Scholar] [CrossRef]
- Mann, H.B. Nonparametric tests against trend. Econometrica 1945, 13. [Google Scholar] [CrossRef]
- Liu, B.; Tan, X.; Gan, T.Y.; Chen, X.; Lin, K.; Lu, M.; Liu, Z. Global atmospheric moisture transport associated with precipitation extremes: Mechanisms and climate change impacts. Wiley Interdiscip. Rev. -Water 2020, 7, e1412. [Google Scholar] [CrossRef]
- Trenberth, K.E.; Dai, A.; Rasmussen, R.M.; Parsons, D.B. The changing character of precipitation. Bull. Am. Meteorol. Soc. 2003, 84, 1205–1218. [Google Scholar] [CrossRef]
- Naumann, G.; Alfieri, L.; Wyser, K.; Mentaschi, L.; Betts, R.A.; Carrao, H.; Spinoni, J.; Vogt, J.; Feyen, L. Global changes in drought conditions under different levels of warming. Geophys. Res. Lett. 2018. [Google Scholar] [CrossRef]
- Ansari, H.; Davari, K. Spatial and temporal variations of drought by using palmer drought severity index (case study: Ghareghom and part of atrak basins). J. Soil Water Conserv. 2010, 17, 125–140. [Google Scholar]
- He, J.; Yang, X.H.; Li, Z.; Zhang, X.J.; Tang, Q.H. Spatiotemporal Variations of Meteorological Droughts in China During 1961–2014: An Investigation Based on Multi-Threshold Identification. Int. J. Disaster Risk Sci. 2016, 7, 63–76. [Google Scholar] [CrossRef] [Green Version]
- Ayantobo, O.O.; Li, Y.; Song, S.B.; Yao, N. Spatial comparability of drought characteristics and related return periods in mainland China over 1961–2013. J. Hydrol. 2017, 550, 549–567. [Google Scholar] [CrossRef]
- Guan, X.; Ma, J.; Huang, J.; Huang, R.; Zhang, L.; Ma, Z. Impact of oceans on climate change in drylands. Sci. China-Earth Sci. 2019, 62, 891–908. [Google Scholar] [CrossRef]
- Huang, J.; Ma, J.; Guan, X.; Li, Y.; He, Y. Progress in semiarid climate change studies in China. Adv. Atmos. Sci. 2019, 36, 922–937. [Google Scholar] [CrossRef]
- Xinyang, Y.; Qiang, Z.; Xiaomin, Y.; Sheng, W.; Xueyuan, R.; Funian, Z. An overview of drought distribution characteristics and formation mechanisms in global arid areas. Adv. Earth Sci. 2019, 34, 826–841. (In Chinese) [Google Scholar]
- Wu, C. Severe drought quantification in Fujian province during 2003. Hydraul. Sci. Technol. 2005, 1, 1–3. (In Chinese) [Google Scholar]
- Xu, J. Variation of subtropical high and an analysis of its relationship with drought in Fujian during summer. J. Oceanogr. Taiwan Strait 2005, 24, 363–369. (In Chinese) [Google Scholar]
- Lu, X.; Yang, X.; Li, S. Dam not sole cause of Chinese drought. Nature 2011, 475, 174. [Google Scholar] [CrossRef] [PubMed]
- Zhang, Q.; Yao, Y.; Wang, Y.; Wang, S.; Wang, J.; Yang, J.; Wang, J.; Li, Y.; Shang, J.; Li, W. Characteristics of drought in Southern China under climatic warming, the risk, and countermeasures for prevention and control. Theor. Appl. Climatol. 2019, 136, 1157–1173. [Google Scholar] [CrossRef]
- Huang, Q.Z.; Zhang, Q.; Li, Q. SPEI-based evaluation of seasonal dryness/wetness variations and related causes. J. Nat. Disasters 2018, 27, 130–140. (In Chinese) [Google Scholar] [CrossRef]
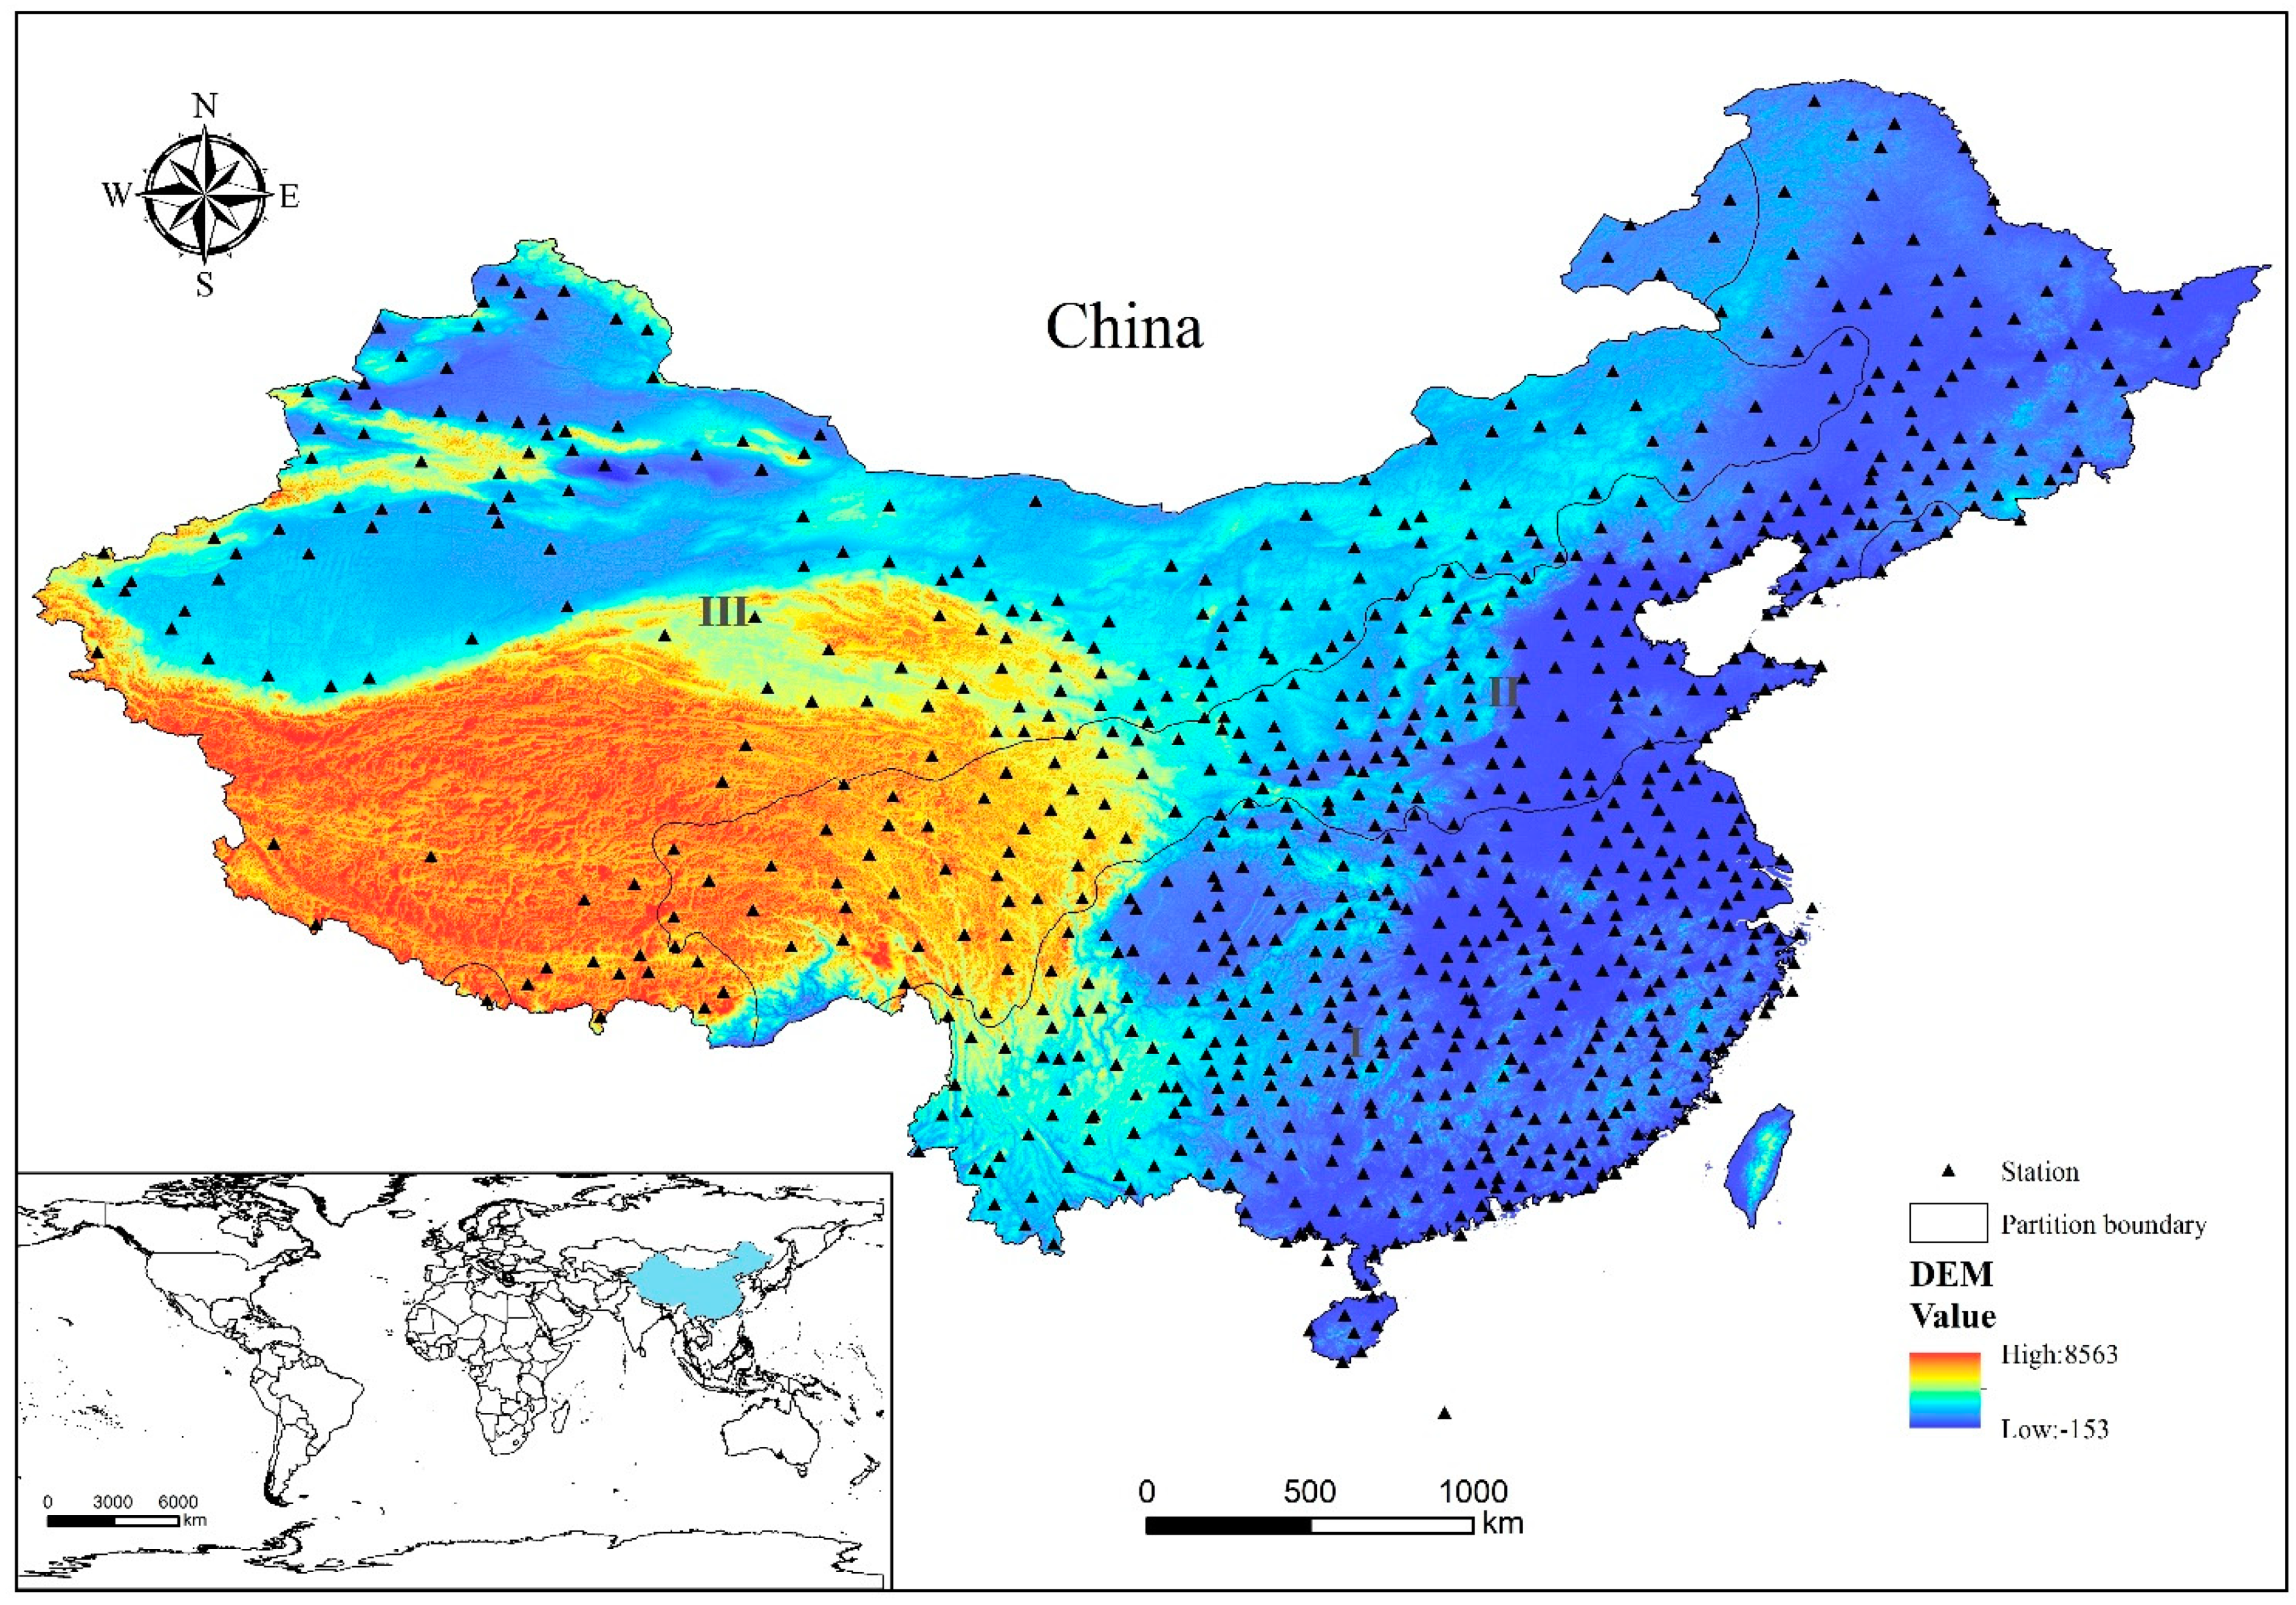


| Region | Climate | Number of Stations | Record Period |
|---|---|---|---|
| I | Humid | 383 | 1970–2019 |
| II | Sub-humid and semi-arid | 261 | 1970–2019 |
| III | Arid | 186 | 1970–2019 |
| Drought/Humidity Classification | Abbreviation | PDI Range |
|---|---|---|
| Extreme drought | D4 | More than 3 |
| Severe drought | D3 | 2 to 3 |
| Moderate drought | D2 | 1 to 2 |
| Light drought | D1 | 0 to 1 |
| Normal | N | 0 |
| Light humidity | H1 | −1 to 0 |
| Moderate humidity | H2 | −2 to −1 |
| Severe humidity | H3 | −3 to −2 |
| Extreme humidity | H4 | Less than −3 |
| Region | Insignificant | Significant | ||||
|---|---|---|---|---|---|---|
| Count | Percentage | Increase | Decrease | |||
| Count | Percentage | Count | Percentage | |||
| I | 249 | 65.0 | 121 | 31.6 | 13 | 3.4 |
| II | 181 | 69.3 | 63 | 24.1 | 17 | 6.5 |
| III | 122 | 65.6 | 37 | 19.9 | 27 | 14.5 |
| Total | 552 | 66.4 | 221 | 26.6 | 57 | 6.9 |
Publisher’s Note: MDPI stays neutral with regard to jurisdictional claims in published maps and institutional affiliations. |
© 2022 by the authors. Licensee MDPI, Basel, Switzerland. This article is an open access article distributed under the terms and conditions of the Creative Commons Attribution (CC BY) license (https://creativecommons.org/licenses/by/4.0/).
Share and Cite
Wu, X.; Shen, X.; Li, J. Spatiotemporal Distribution of Drought and Humidity in China Based on the Pedj Drought Index (PDI). Sustainability 2022, 14, 4546. https://doi.org/10.3390/su14084546
Wu X, Shen X, Li J. Spatiotemporal Distribution of Drought and Humidity in China Based on the Pedj Drought Index (PDI). Sustainability. 2022; 14(8):4546. https://doi.org/10.3390/su14084546
Chicago/Turabian StyleWu, Xu, Xiaojing Shen, and Jianshe Li. 2022. "Spatiotemporal Distribution of Drought and Humidity in China Based on the Pedj Drought Index (PDI)" Sustainability 14, no. 8: 4546. https://doi.org/10.3390/su14084546
APA StyleWu, X., Shen, X., & Li, J. (2022). Spatiotemporal Distribution of Drought and Humidity in China Based on the Pedj Drought Index (PDI). Sustainability, 14(8), 4546. https://doi.org/10.3390/su14084546


