Article

Various Fertilization Managements Influence the Flowering Attributes, Yield Response, Biochemical Activity and SoilNutrient Status of Chrysanthemum (Chrysanthemum morifolium Ramat.)

by
Ashok Choudhary
1,*,
Ajit Kumar
1,
Uttam Kumar
2,
Rajesh Choudhary
3,
Rakesh Kumar
4,
Rajkumar Jat
1,
Patel Nidhibahen
2,
Ashraf Atef Hatamleh
5,
Munirah Abdullah Al-Dosary
5,
Yasmeen Abdualrhman Al-Wasel
5,
Rajinikanth Rajagopal
6 and
Balasubramani Ravindran
7,*
1
Department of Horticulture, College of Agriculture, GBPUA&T, Pantnagar 263145, India
2
College of Plant Protection, Fujian Agriculture and Forestry University, Fuzhou 350002, China
3
Department of Horticulture, SKNAU, Jobner 303329, India
4
Department of Agronomy, College of Agriculture, GBPUA&T, Pantnagar 263145, India
5
Department of Botany and Microbiology, College of Science, King Saud University, P.O. Box 2455, Riyadh 11451, Saudi Arabia
6
Sherbrooke Research and Development Center, Agriculture and Agri-Food Canada, 2000 College Street, Sherbrooke, QC J1M 0C8, Canada
7
Department of Environmental Energy and Engineering, Kyonggi University, Youngtong-Gu, Suwon 16227, Korea
*
Authors to whom correspondence should be addressed.
Sustainability 2022, 14(8), 4561; https://doi.org/10.3390/su14084561
Submission received: 22 February 2022 / Revised: 4 April 2022 / Accepted: 6 April 2022 / Published: 11 April 2022

Abstract

:
Optimal nutrient management is critical for optimizing flowering, yield, quality and improving soil health. A key approach for making chrysanthemum crop cultivation profitable is balanced fertigation at the right time. This is possible by fertigation through drip. The present study was designed in 2019–2021 at a model floriculture center, Pantnagar, to investigate the response of split application of NPK through drip fertigation on flowering attributes, yield, biochemical activity and soil nutrient status of chrysanthemum. Plants received application of NPK with five treatment combinations: T1-NPK @ 100:150:100 kg/ha/year, T2-NPK @ 100:150:100 kg/ha/year, T3-NPK @ 100:150:100 kg/ha/year, T4-NPK @ 75:112.5:75 kg/ha/year and T5-NPK @ 75:112.5:75 kg/ha/year at vegetative, bud and flowering stages. The results reveal that the plants treated with treatment T3 (NPK @ 100:150:100 kg/ha/year) exhibited maximum increases in floral bud diameter (31.45%), number of inflorescences per branch (24.44%), diameter of inflorescence (15.32–28.44%), weight of inflorescence (24.30%), stem diameter, inflorescence stem length, number of inflorescences per plant (6.16%), number of inflorescences per hectare (53.46%), chlorophyll a content, chlorophyll b content, total chlorophyll content (40.20%), carotene content of inflorescence (69.56%), organic carbon (1.22-fold), available nitrogen content (7.46%), available phosphorus and available potassium (1.14-fold) compared to the control. Conclusively, the results suggest that split application of NPK through drip fertigation may improve the inflorescence attributes, yield, biochemical activity and soil nutrient status of chrysanthemum.

1. Introduction

Flower production is practiced all over the world and contributes sizeable revenue. The ornamental plant sector embraces the cultivation and trade of cut greens and inflorescence, potted and bedding inflorescence and house plants [1,2]. Ornamental plants are grown in many regions throughout the world. The leading producing countries are The Netherlands, Germany, Belgium, France, Spain and Romania [3,4,5].
Chrysanthemums are one of the most popular cut and potted inflorescence on the international market [6]. According to Van Huylenbroeck [1], chrysanthemum occupies seventh place in the number of turnovers on the Dutch market. Chrysanthemum (Chrysanthemum morifolium Ramat.) is a perennial herbaceous plant that belongs to the Asteraceae family and is known as the ‘Queen of the East’. It has a diploid chromosome number of 2n = 18. It is a plant that grows mostly in Europe and Asia in the northern hemisphere. Its origin, however, is said to be in China [6,7,8].
Chrysanthemum is a perennial herbaceous plant, attaining dwarf to medium height, vigorous and also has beautiful inflorescence. It is known by several names in various parts of India: guldaudi in Hindi, Chandramalika in eastern regions, Samanthi in southern states and Shevanti in western areas. In inflorescence, there are two types of florets: disc florists and ray florets. The disc florists are situated in the center, tabular with five initial petals. They are generally smaller and have both male and female reproductive organs. The outside florets are called ray florets and surround the disc florets, are comparatively longer and contain female reproductive organs.
Different colors of inflorescence such as white, purple, yellow, bronze and pink are produced by the chrysanthemum plant [9]. These characteristics make it ideal for floral arrangements as a cut inflorescence. Inflorescences of standard varieties are produced on long, sturdy stems and have good keeping quality. These characters make it highly suitable as a cut inflorescence for inflorescence arrangements. Spray inflorescences are ideal for loose inflorescence arrangements. They may also be utilized in border planting, front row planting and pot culture [10].
Chrysanthemum inflorescences are often used to make bracelets, hair ornaments and religious offerings. The exceptionally large inflorescence varieties are intended for exhibition purposes. In Japan, cut inflorescences are often utilized in cemeteries. The simultaneous inflorescence behavior of the plants, as well as the ease with which they may be trained into any desired form, provide enough opportunity for a professional gardener to demonstrate his or her skills.
Essential oil and sesquiterpenoid alcohol extracted from Chrysanthemum morifolium, Chrysanthemum cinerariifolium, C. pyrethrum and C. coccineum are sources of biological pesticides used to store food grains throughout the world. Apart from this, Chrysanthemum corymbosum seeds are a good source of acetylenic acid (C2H2).
Various chrysanthemum species are utilized for their medicinal value (anti-inflammatory, humoral and cellular immuno-modulatory, pemphigus, scrofula, swelling and pain) [11,12,13]. The plant’s extract is also efficient for treating age-associated disorders (brain and liver injury, obesity) in mice [14,15]; however, most of them are used for ornamental purposes. Ryori Giku is a yellow inflorescence culinary type that is fried and consumed as a delicacy in Japan [16]. Nowadays, wide varieties are available and the natural inflorescence period of November–December has been extended to September–December by selecting suitable types and planting on different dates. In India, its cultivation is presently confined to West Bengal, the Northeastern States, Maharashtra, Andhra Pradesh, Karnataka, Tamil Nadu and Rajasthan.
However, traditionally, farmers in India apply nutrients as basal doses and top dressing. The nutrients applied so are subjected to leaching and fixation losses in the soil. In addition, nutrients reach deeper areas beyond the active root zone and become unavailable to the plants.
Nutrition, because of its direct influence on crop physiology, plays a prime role in the production of any crop. It is also of vital importance to apply the proper quantity of fertilizers at an appropriate time to enhance the productivity. Fertilizers are the most significant inputs, as they have a direct influence on plant growth, development, output and quality. The majority of farmers apply nutrients as basal doses and top dressing. The nutrients applied with these methods are subjected to leaching and fixation losses in the soil. In addition, nutrients reach deeper areas beyond the active root zone and become unavailable to the plants [17]. In many cases, the effective utilization of nutrients by the plants is less than 50 percent of the fertilizers applied through conventional methods. In addition, the method of applying fertilizers and the timing of application at critical stages also reduces the cost of cultivation and increases qualitative and quantitative yield [18]. Thus, we need an alternate method, such as drip fertigation, to improve the productivity and quality of the flower crops. Drip irrigation and fertilizer application are the most efficient methods of providing water and nutrients to plant roots, meeting the plants’ overall and temporal demands for these two inputs. Because these inputs are positioned near the crop root zone, they are effectively used by the plants. For high production and good yield quality, the appropriate amount of water and type of fertilizer are essential [19].
Nitrogen (N) is a necessary part of nucleic acid and amino acids, and also increases photosynthetic activity and vegetative growth in plants [20,21,22]. Phosphorus (P) is required for optimal metabolism and is found in nucleic acid, phospholipids and enzymes [23,24]. The alternate synthesis and breakdown of energy-rich ADP and ATP ions control the storage and release of energy [25]. Potassium (K) is necessary for the production of amino acids, proteins, respiration, transpiration and chlorophyll, as well as improving the quality of a variety of floral crops [26].
Drip irrigation has been utilized to apply water-soluble nutrients via fertilization. Drip irrigation produces up to 90% irrigation efficiency, enhances crop yields by 25% to 30% and saves 30% to 50% on irrigation water when compared to traditional irrigation methods [27]. Fertigation enables the consistent distribution of the appropriate proportions of plant nutrients to the moistened root volume zone, where the majority of the functional roots are concentrated, hence improving nutrient usage efficiency [17,28]. It has been discovered that it improves agricultural output and quality while also increasing resource efficiency [29]. Fertigation, a synergistic approach, saves up to 25% on fertilizers, minimizes leaching losses of nutrients [30,31] and improves the movement of less mobile nutrients [32]. Solid fertilizers are used by farmers for agricultural production, but they are not totally water soluble, making them less accessible to plants. Some of the fertilizers also contain sodium and chloride salts, which are damaging to the soil as well as the quality and amount of crop production [33]. However, limited research has investigated the optimal nutrient management for chrysanthemum crop production.
The objective of this study was to evaluate the effect of drip irrigation with various fertilization management systems on the chrysanthemum flowering, yield, biochemical activity and soil nutrient characteristics. As a control, drip irrigation with NPK fertilization was used as a basal and spilt application.

2. Materials and Methods

2.1. Plant Material and Experimental Site

The study (2019 to 2021) was conducted at the research farm of the Model Floriculture Centre, G.B. Pant University of Agriculture and Technology, Pantnagar, located at 29° north latitude and 79.3° east longitude in the Himalayan foothills with an elevation of 243.84 m above mean sea level. Three to four-week-old cuttings of chrysanthemum (Chrysanthemum morifolium Ramat.) ‘Thai Chen Queen’ were purchased from Model Floriculture Centre-Pantnagar.
The soil of the experimental field was sandy loam with adequate drainage and optimal water retention capacity (Table 1). The raised beds (10.0–0.90 m2) were prepared on firmly pulverized soil [34]. Figure 1 depicts the different meteorological parameters such as mean, maximum and minimum temperatures; relative humidity; and total rainfall measured at the Pantnagar observatory throughout the field experimentation period from July 2019 to March 2021.
Throughout the entire testing time, all cultural practices were the same for all treatments. During the experiment, meteorological data were obtained from the GBPUAT observatory in Pantnagar. The experiment was plotted according to a randomized block design with five treatments, as shown in Table 2. The treatments were replicated four times in 24 m × 10 m plots. For allocation of various treatments, the area was partitioned into raised beds with a height of 30 cm and a width of 120 cm. The beds were separated by 30 cm to allow for the differentiation of treatments and replications as well as easy inter-cultural operation. A double row planting scheme was used, with a row/plant spacing of 30 cm × 45 cm. According to the experimental arrangement and treatment plan, a drip irrigation system and a venturi injector fertigation unit were installed. According to the treatment combinations, water-soluble fertilizers and straight fertilizers were used.

2.2. Inflorescence Attributes

Inflorescence characteristics, such as inflorescence bud diameter, number of inflorescences per branch, number of buds per plant, inflorescence diameter, inflorescence weight inflorescence stem diameter and inflorescence stem length, were measured at complete inflorescence physiological maturity, as determined by ocular observation. These parameters were determined by selecting 10 physiologically ripe inflorescence from 10 plants at random for each replication and treatment. Digital Vernier calipers were used to measure bud diameter, inflorescence diameter and inflorescence stem diameter, while a digital weighing scale was used to assess inflorescence weight.

2.3. Inflorescence Yield

At the inflorescence stage, inflorescence yield parameters such as total number of inflorescences per plant, plot and hectare were counted from each tagged plant and then averaged to obtain the mean value.

2.4. Biochemical Attributes

Concentration of total chlorophyll was measured as described by Hiscox and Israelstam [44]. First, 150 mg of leaves were inserted in a test tube containing 10 mL of DMSO. To avoid evaporation, the test tube was capped with paraffin and held at 60 °C for 4 h. A UV-visible spectrophotometer was used to measure the total chlorophyll content at wavelengths of 663, 645 and 470 nm. As a control, DMSO was used without any leaf material. The following formulas were used to estimate the concentration of chlorophyll a, chlorophyll b, total chlorophyll and carotene.

2.4.1. Chlorophyll a (mg/g) of Fresh Leaves

Chlorophyll   a =   [ ( 12.7 ×   OD   at   A 663 ) ( 2.69 × OD   at   A 645 ) ] × Volume   in   mL Weight   of   sample   ( gm ) × 1000
Chlorophyll a content in leaves was estimated at 30, 60 and 90 days of planting.

2.4.2. Chlorophyll b (mg/g) of Fresh Leaves

Chlorophyll   b =   [ ( 22.9 ×   OD   at   A 645 ) ( 4.68 × OD   at   A 663 ) ] × Volume   in   mL Weight   of   sample   ( gm ) × 1000
Chlorophyll b content in leaves was estimated at 30, 60 and 90 days of planting.

2.4.3. Total Chlorophyll (mg/g) of Fresh Leaves

Total   Chlorophyll =   [ ( 20.2 ×   OD   at   A 645 ) + ( 8.02 × OD   at   A 663 ) ] × Volume   in   mL Weight   of   sample   ( gm ) × 1000
where OD is optimal density.
Total chlorophyll content in leaves was estimated at 30, 60 and 90 days of planting.

2.4.4. Carotene Content (mg/g) of Inflorescence

Carotene   content   =   ( 1000 ×   A 470 ) ( 3.27 ×   Chlorophyll   a   + 104 ×   Chlorophyll   b )   299 × 1000
Carotene content in inflorescence was estimated at 90 days of planting.

2.5. Soil Nutrient Status

Samples of soil for analysis were collected twice: once before starting the experiment and again after completion of the experiment. The soil samples collected were analyzed for the following properties.

2.5.1. Organic Carbon (%)

The rapid titration method was used to evaluate the organic carbon content of the soil [45].

2.5.2. Available Nitrogen, Available Phosphorus, Available Potassium (kg ha−1)

The available nitrogen was determined by the alkaline potassium permanganate method [46]. Available phosphorus was extracted from soil with 0.5 M NaHCO3 (pH 8.5), as described by Olsen et al. [42]. Available potassium in the soil was extracted with neutral 1 N ammonium acetate, and using a Systronic-128 type flame photometer, the concentration of K was determined [40].

2.6. Experimental Design and Statistical Data Analysis

With four replicates, the study was conducted using a simple randomized block design. Except for inflorescence stem length and diameter, the collected data were subjected to analysis of variance (ANOVA) followed by a two-tailed Student’s t-test: * p < 0.05; ** p < 0.01, which revealed that fertigation had a significant (p < 0.05) effect. The data were analyzed statistically using Prism-8.0.1. For visualization and tables, we utilized Prism-8.0.1 and Microsoft Excel-2016, respectively.

3. Results

3.1. Effect of Split Supplication of NPK through Drip Fertigation on Inflorescence Attributes

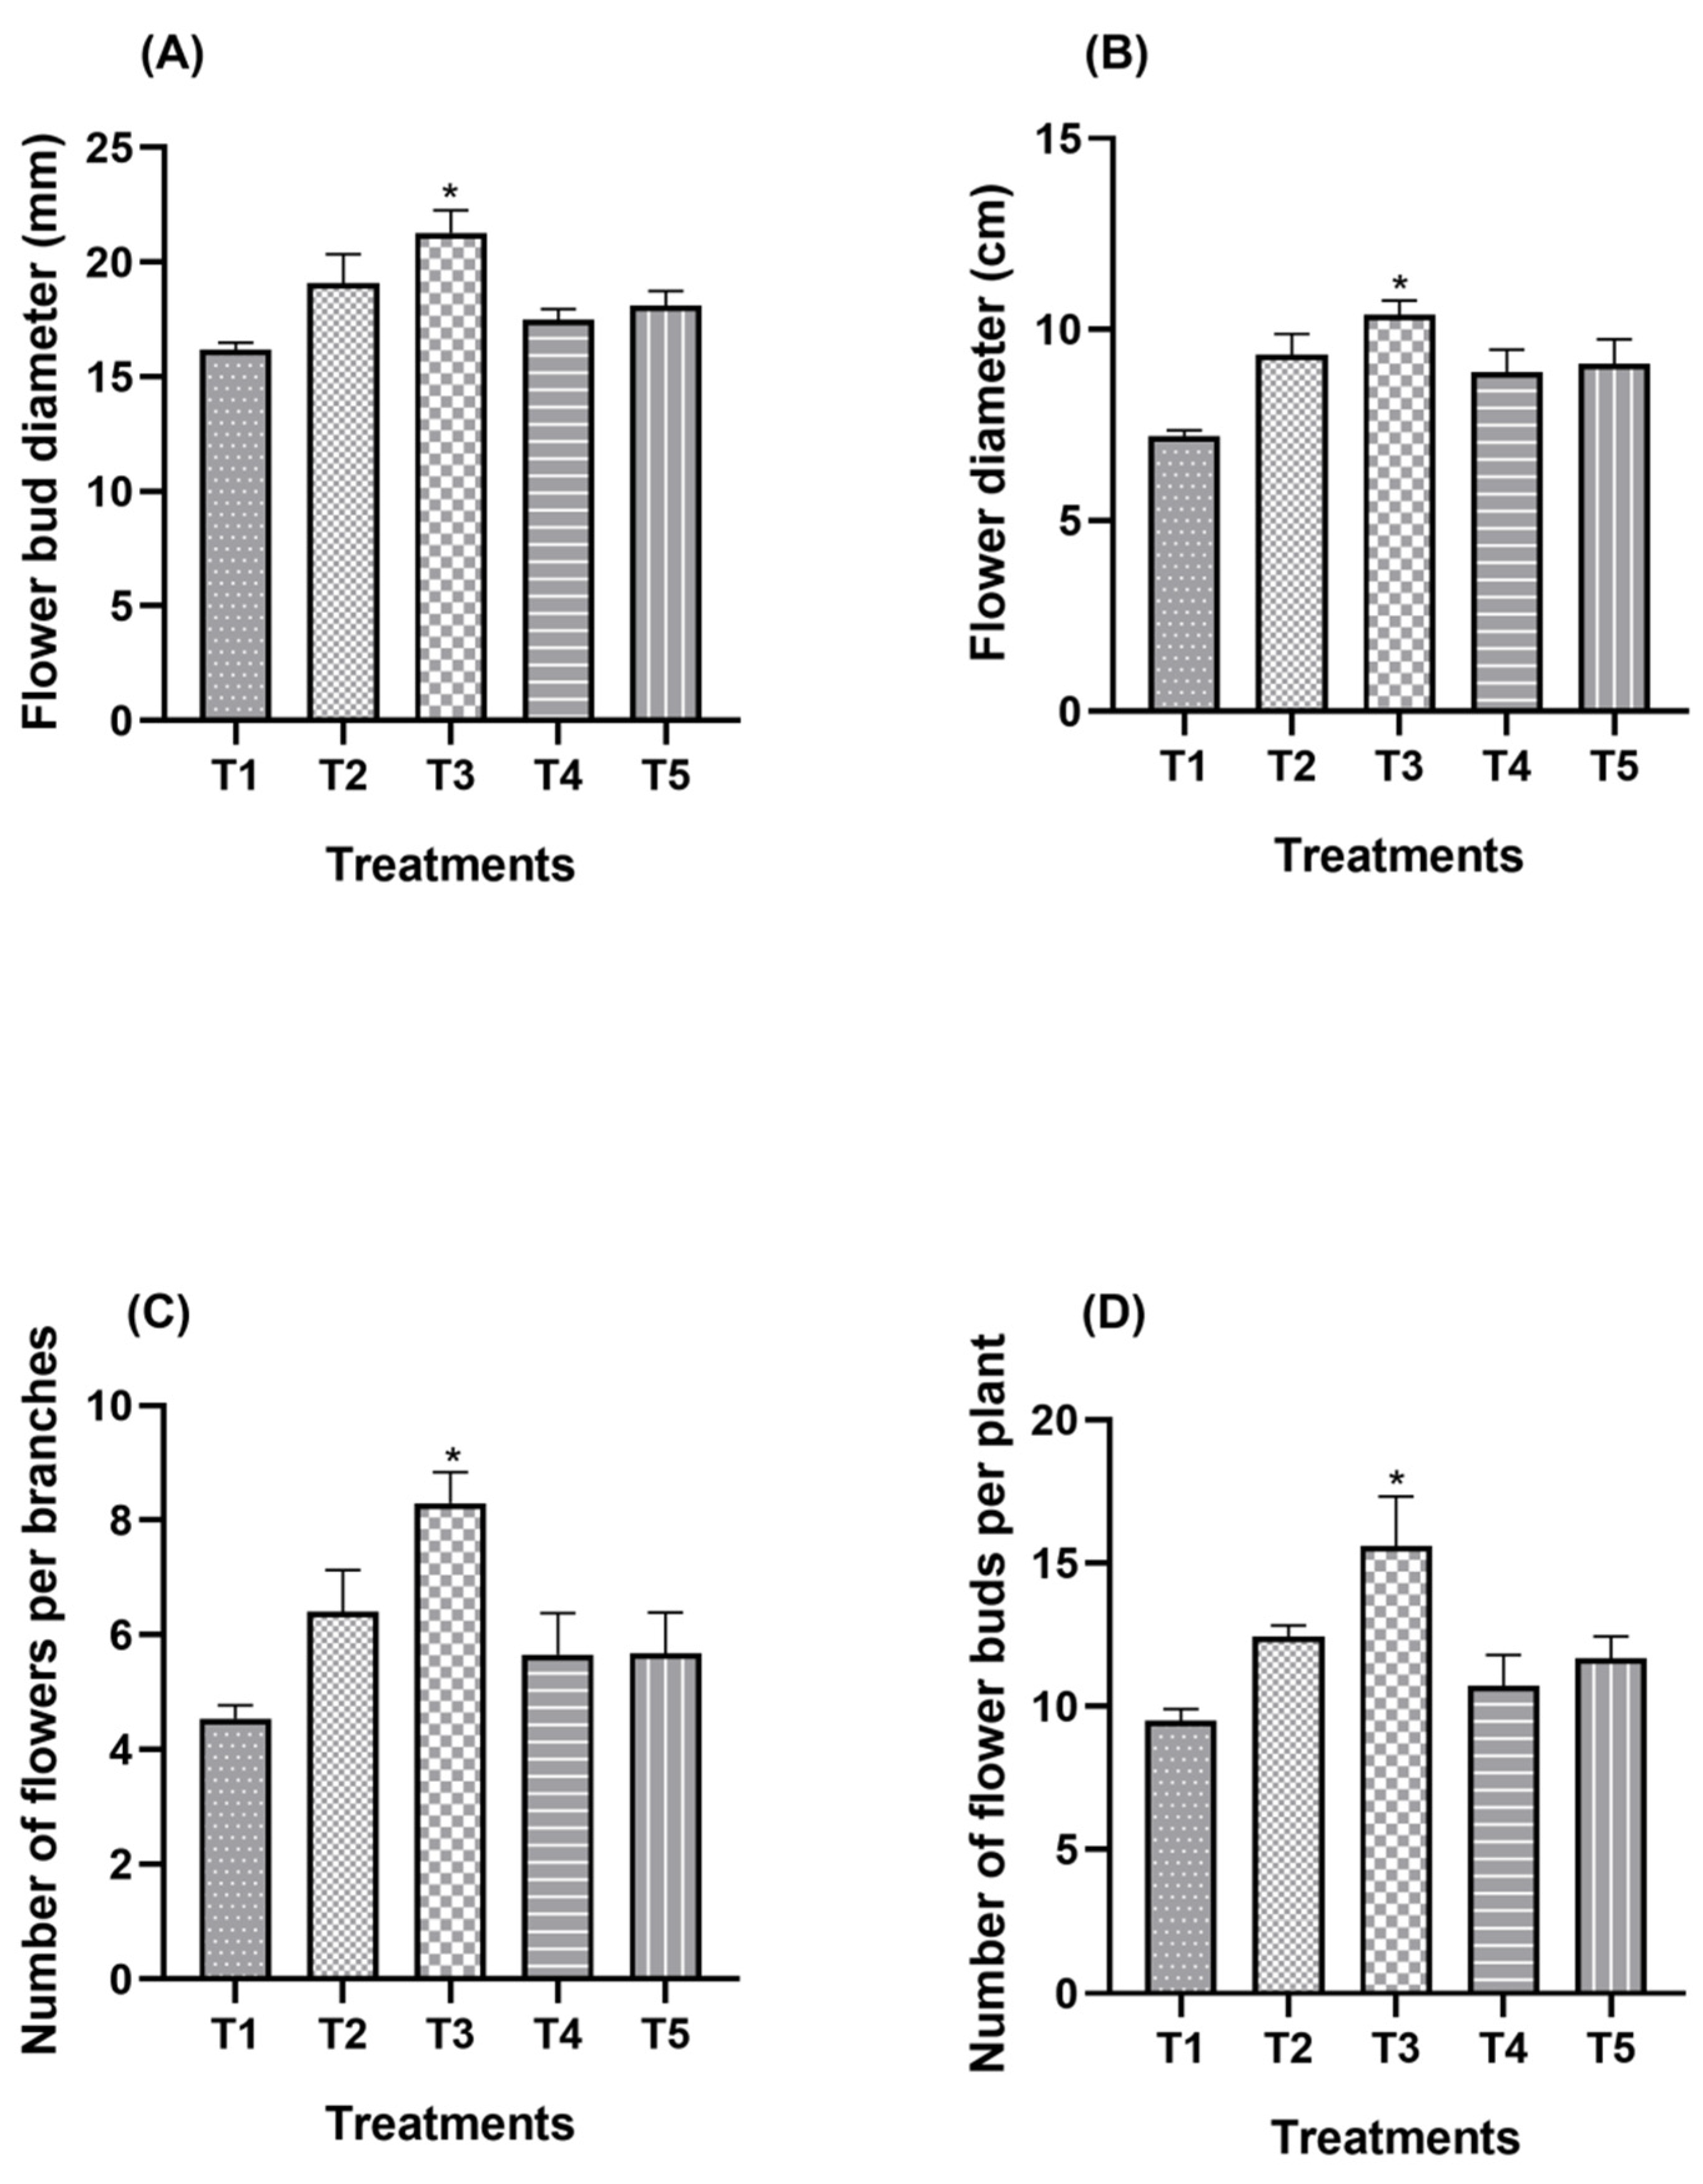
The T3 treatment resulted in a larger floral bud diameter in chrysanthemum plants than the control (p < 0.05). T3 plants had the highest floral bud diameter of 21.27 mm, which was 1.31 times larger than untreated plants (Table 3, Figure 2A). The treatments T2, T5 and T4 were statistically comparable. The floral bud diameter of chrysanthemum at T4 was 23.30%, 10.72% and 5.04% lower than the treatments T3, T2 and T5, respectively. Chrysanthemum plants treated with T3 showed increased diameter of inflorescence by 1.29-fold compared with untreated plants (Figure 2B). The plants treated with T2 and T5 measured the highest diameter of inflorescence (5.18% and 2.47%) as compared to T4 treatment. The minimum inflorescence diameter was observed in the control (Table 2).
In terms of the number of inflorescences per branch, drip irrigation showed a significant response of chrysanthemum and found that the treatment T3 exhibited a 24.44% increase in the number of inflorescences per branch as compared to the control. The number of inflorescences per branch in chrysanthemum at T2 was 1.11-fold higher as compared to T4 treatment. The treatments T5 and T4 were statistically comparable. The application of T3 treatment measured the maximum number of buds per plant as compared to the control (Table 3, Figure 2C). The chrysanthemum plant showed 65.60%, 33.12%, 23.99% and 13.05% increases in the number of buds per plant when treated with T3, T2, T5 and T4, respectively. The treatment T4 showed 1.13-fold better results than T1 treatment. Treatment T1, the control, produced the minimum number of buds per plant (Table 4, Figure 2D). The treatments T2, T5 and T4 were statistically comparable. The application of treatment T3 exhibited the maximum weight of inflorescence, 24.30% more than the control treated plant. The plant experienced 13.44%, 13.25% and 10.52% increases in weight of inflorescence when treated with T5, T4 and T2, respectively. The minimum weight of inflorescence (10.41 g) was recorded in the control (Table 5). The plants treated with T3 experienced a 16.15% increase in inflorescence stem diameter as compared to T1. The minimum inflorescence stem diameter was observed in the control. Chrysanthemum plants treated with T3 enhanced the inflorescence stem length by 1.09-fold as compared to the control (Table 6).

3.2. Effect of Split Supplication of NPK through Drip Fertigation on Yield Attributes

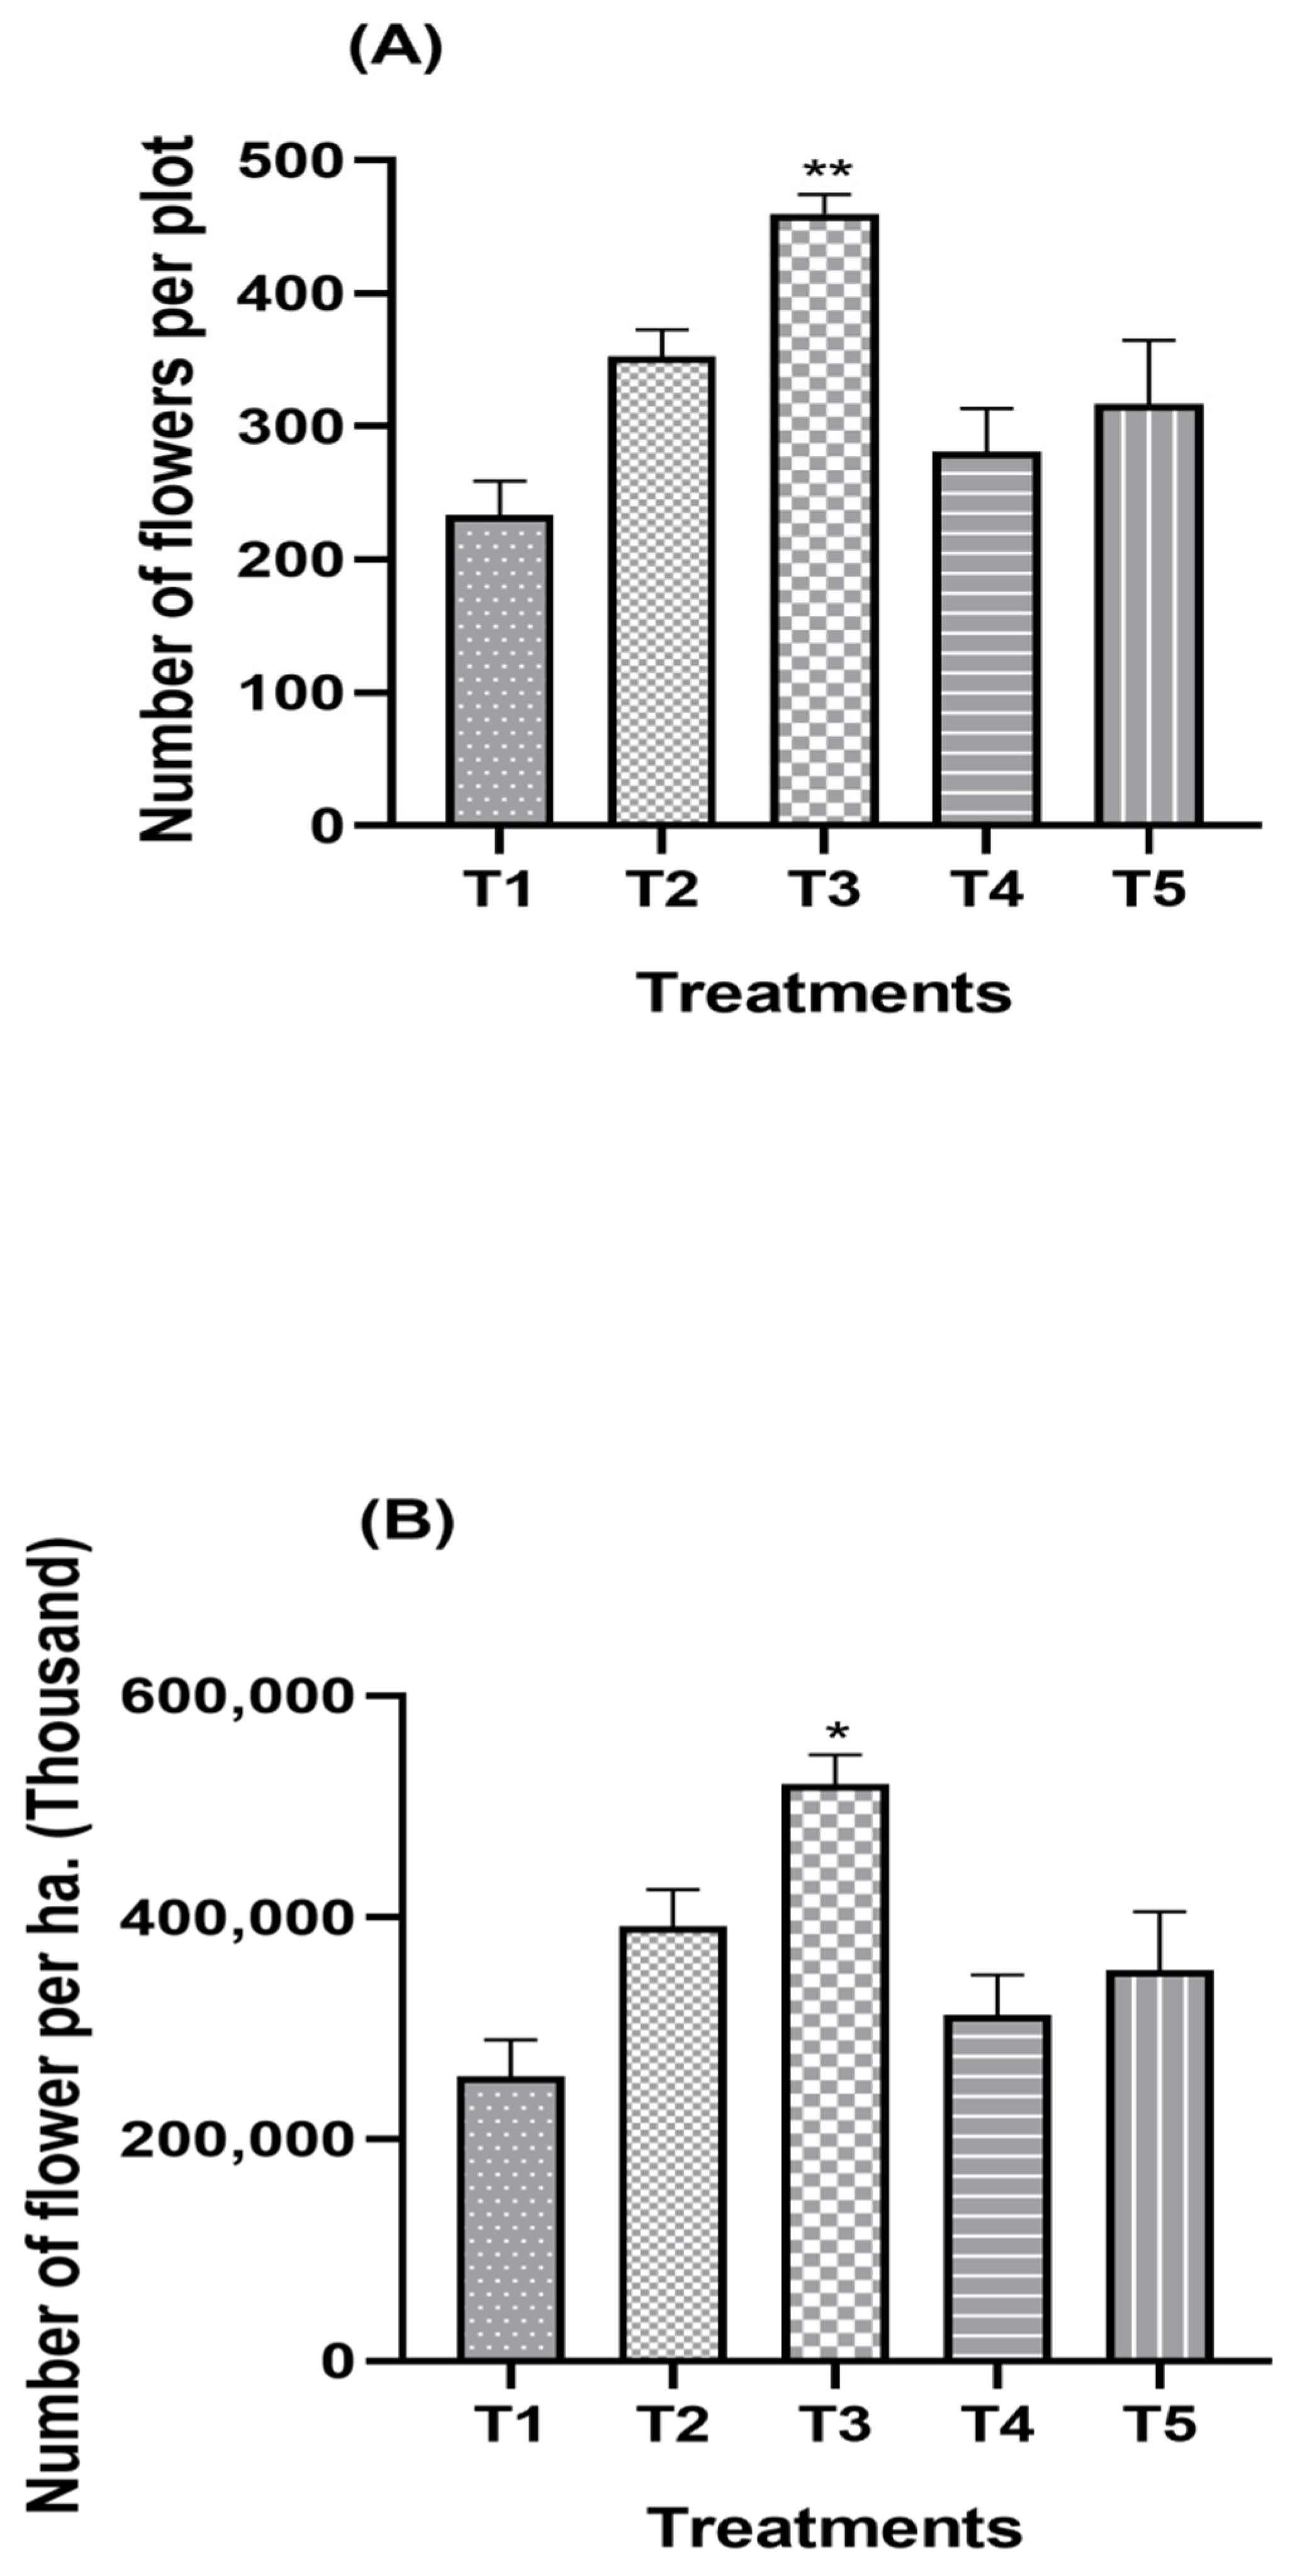
In the chrysanthemum plant, the application of T3 treatment enhanced the number of inflorescences per plant 53.46% and 28.78% higher as compared to T1 and T2 treatments, respectively. T5 treatment produced the highest number of inflorescences per plant (7.58), 6.16% more than T4 treatment. The treatment T4 had a 1.22-fold greater response as compared to the control in chrysanthemum plants (Table 4). The application of T3 treatment showed the maximum number of inflorescences per plot (409.79) as compared to the control. In chrysanthemum, the application of T2 treatment produced 32.04% more inflorescences per plot as compared to the control, and the T5 treatment produced 12.70% more than T4. The treatment T3 produced 1.53-fold more inflorescences per plot than T1 treatment. The chrysanthemum plant showed 53.46%, 32.04% and 18.70% increases in the number of inflorescences per hectare when treated with T3, T2 and T5 as compared to the control, respectively. T4 treatment enhanced the number of inflorescences per hectare by 1.05-fold as compared to the control (Table 7, Figure 3A,B).

3.3. Effect of Split Supplication of NPK through Drip Fertigation on Biochemical Attributes

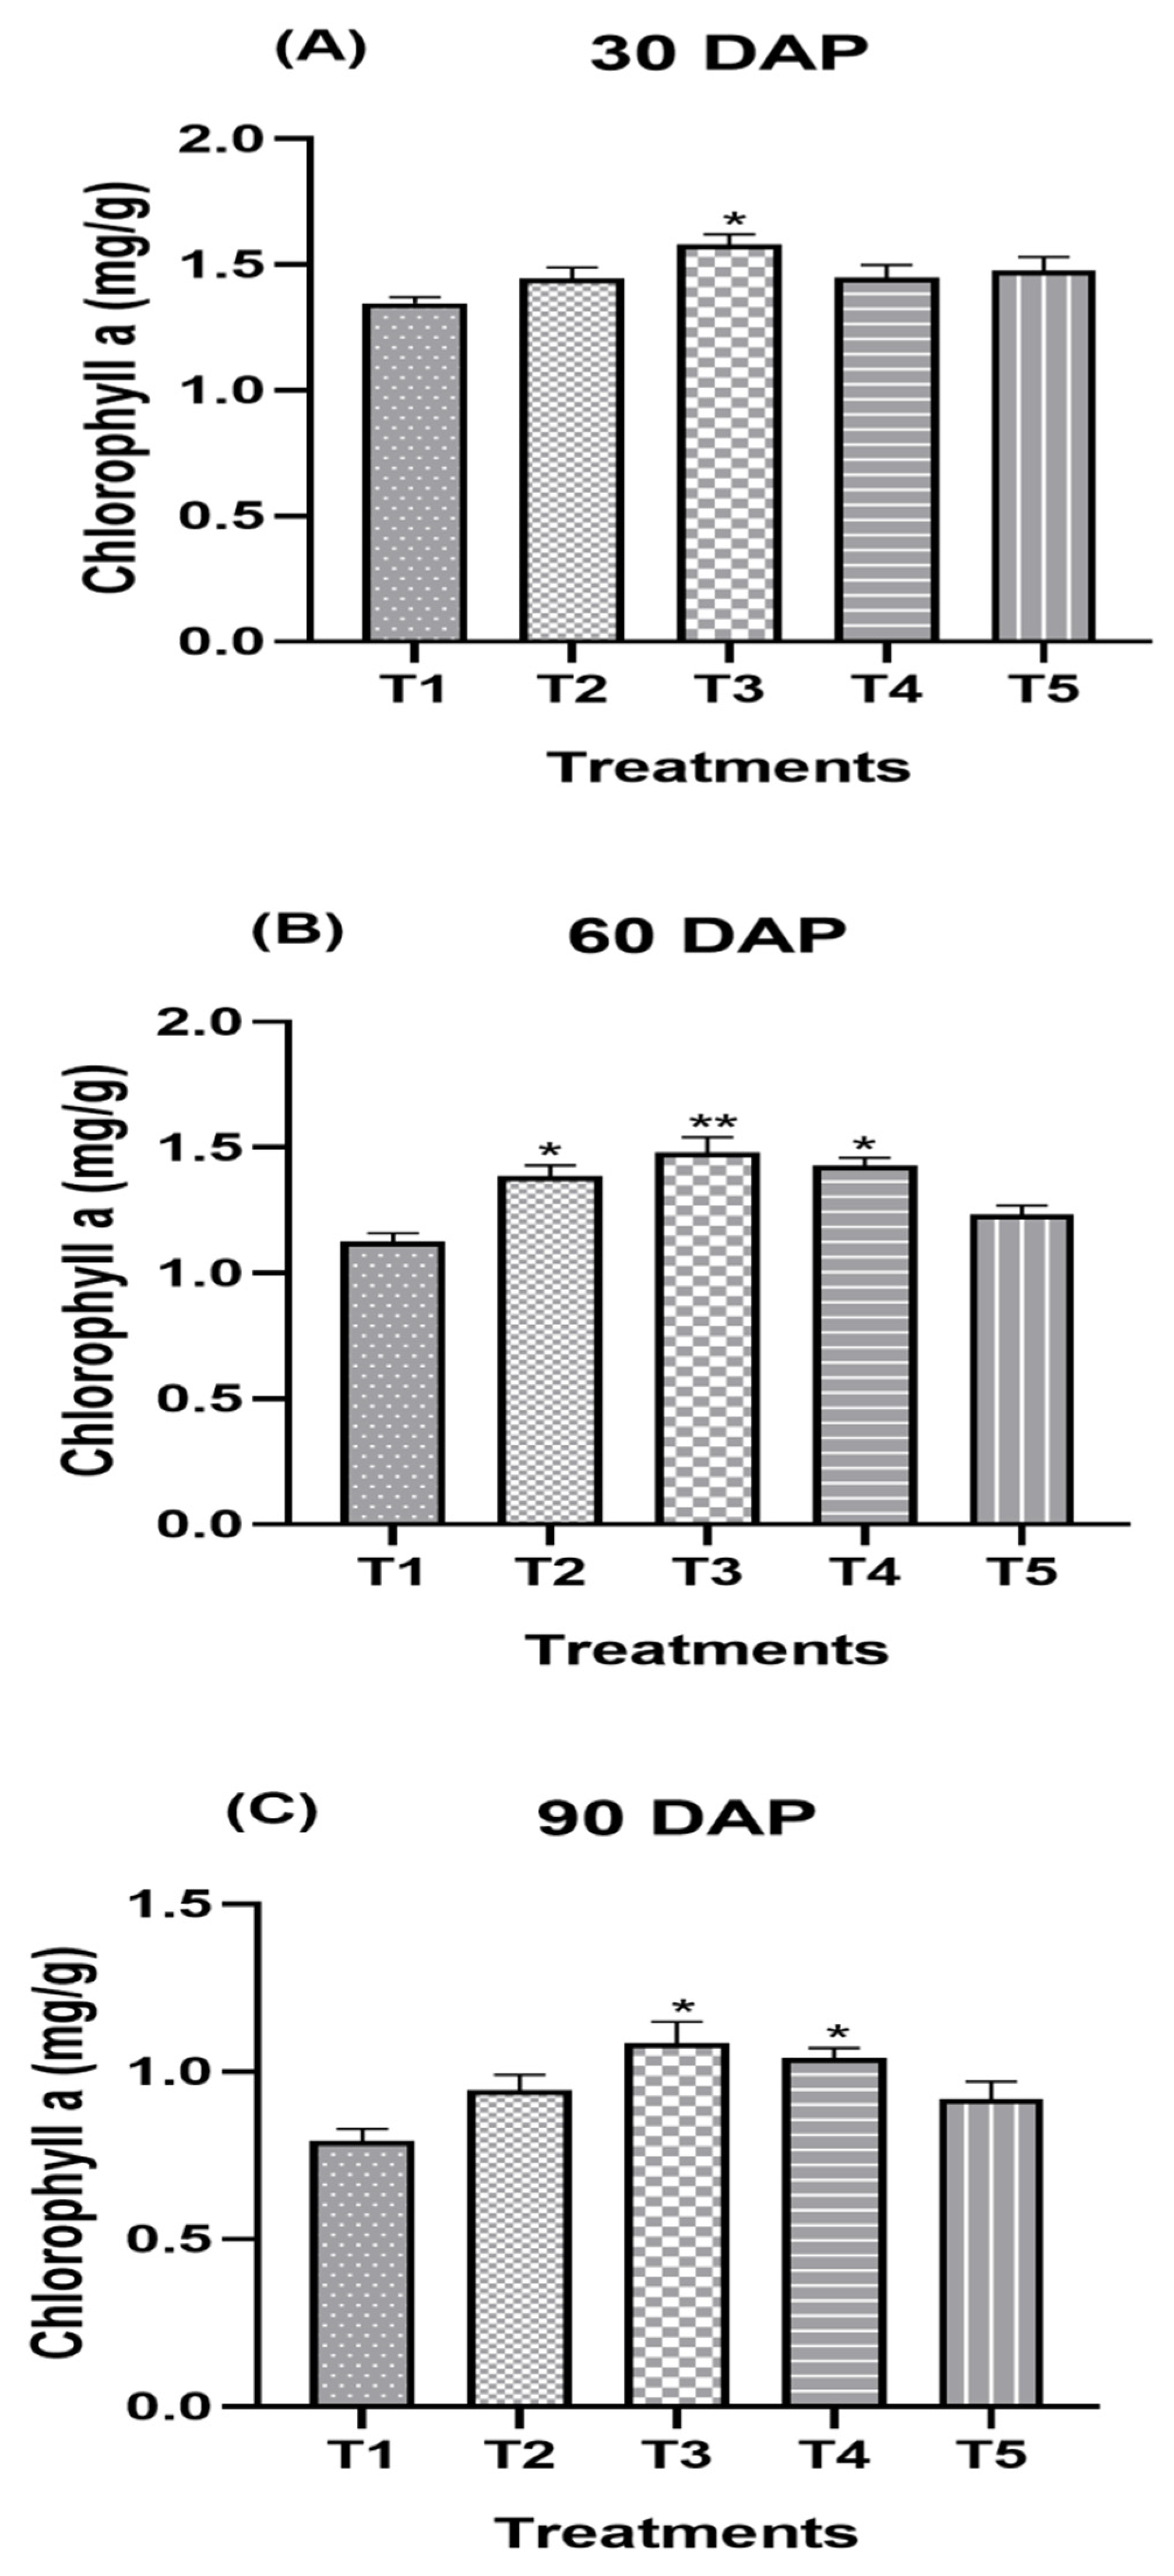
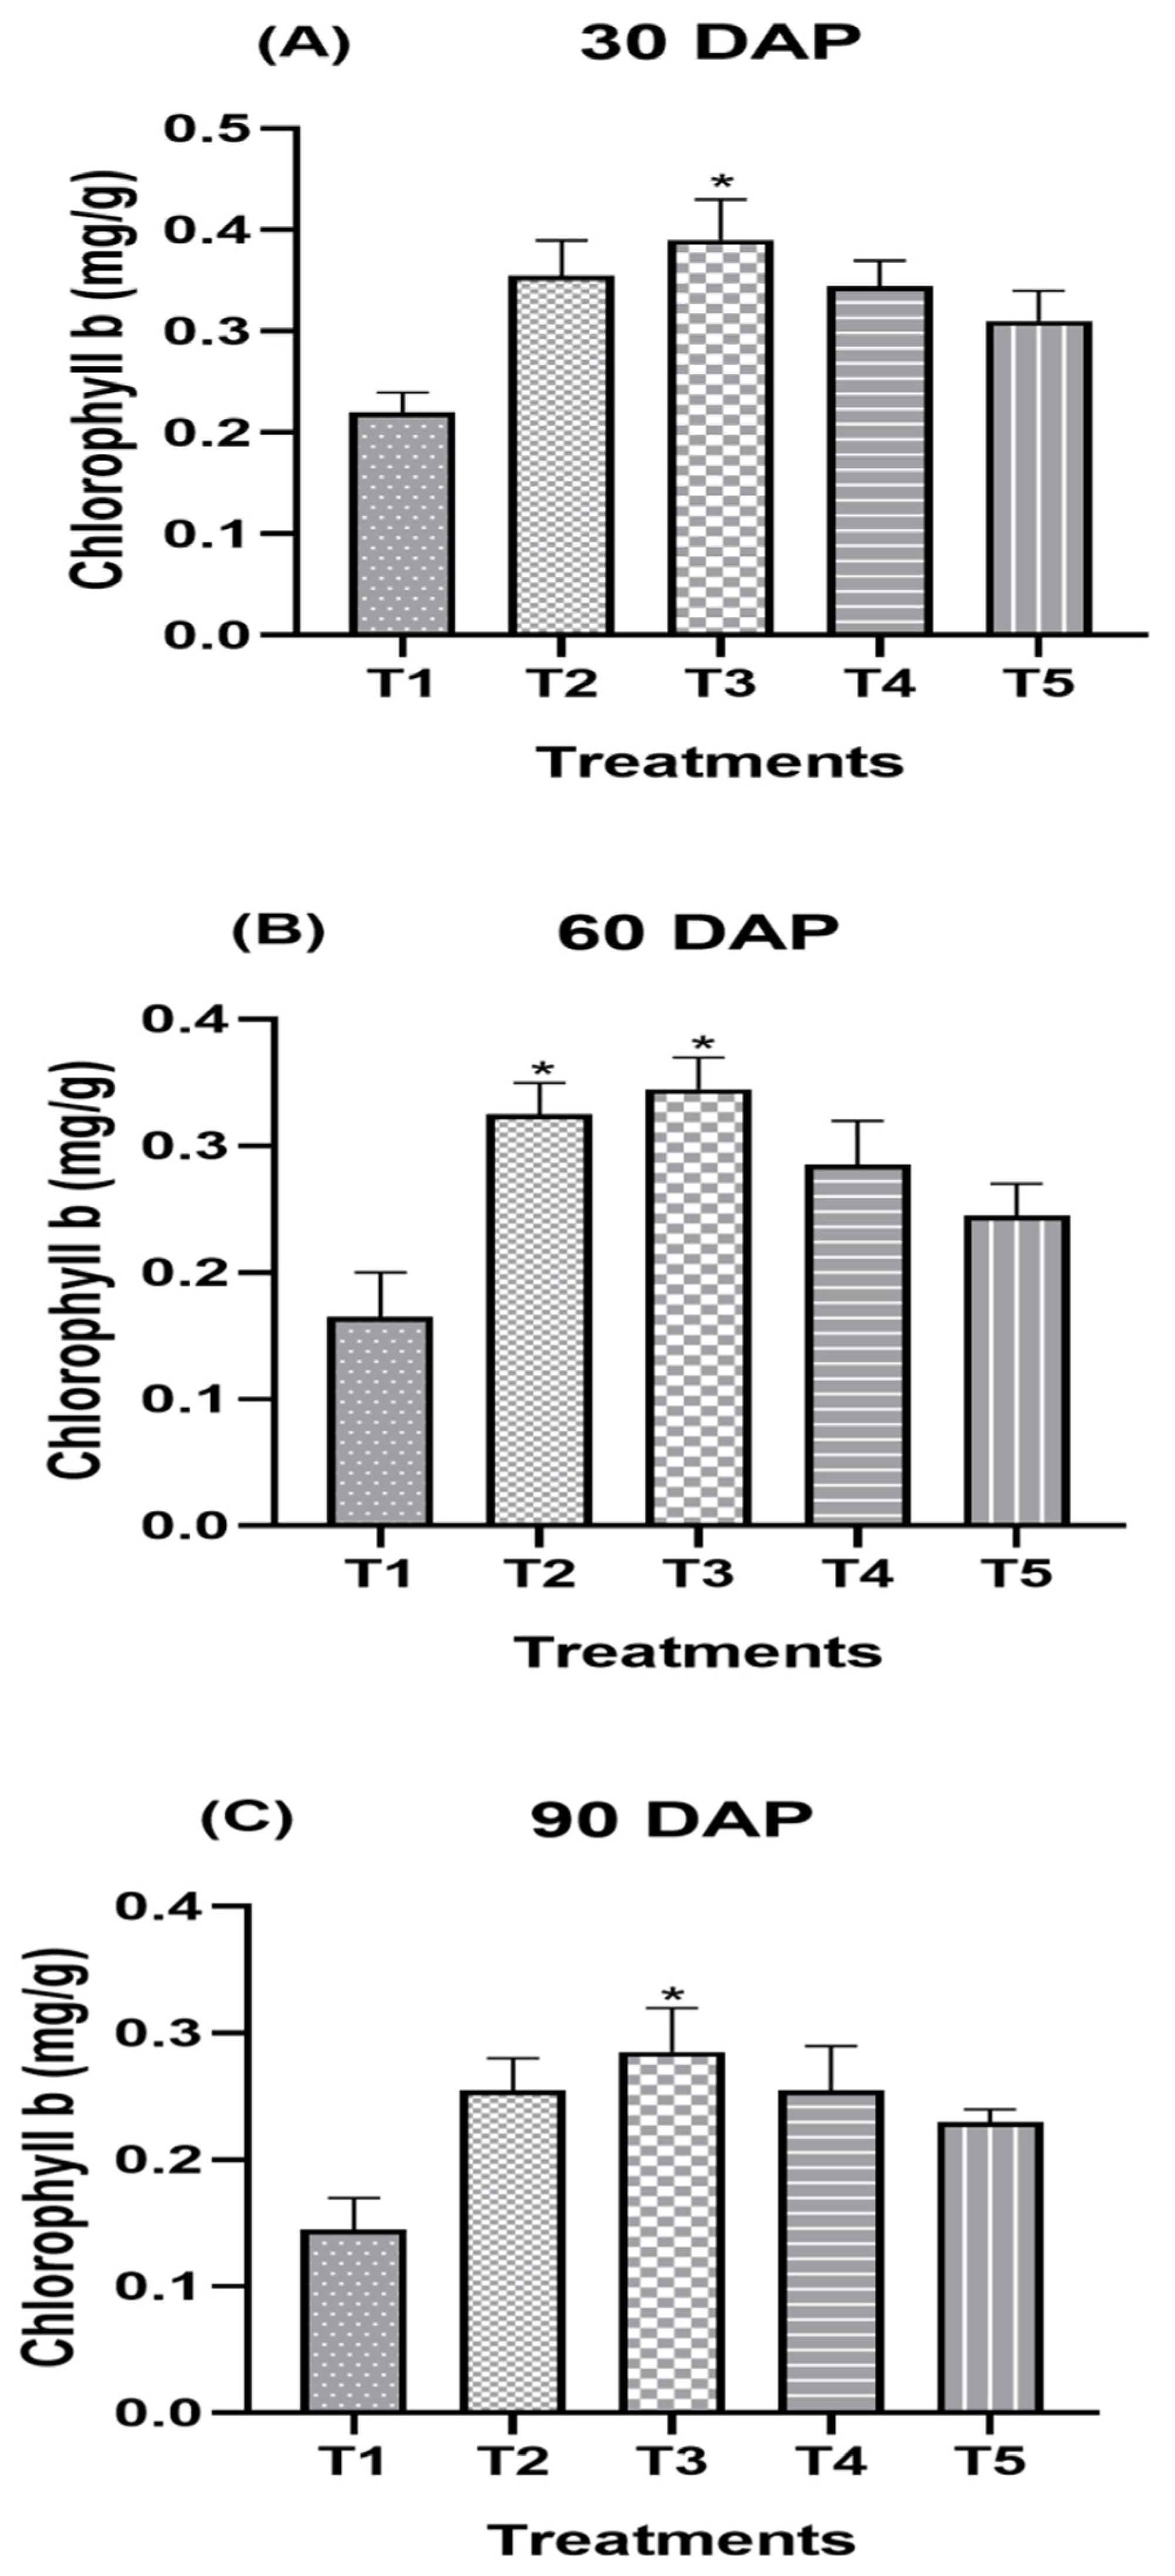
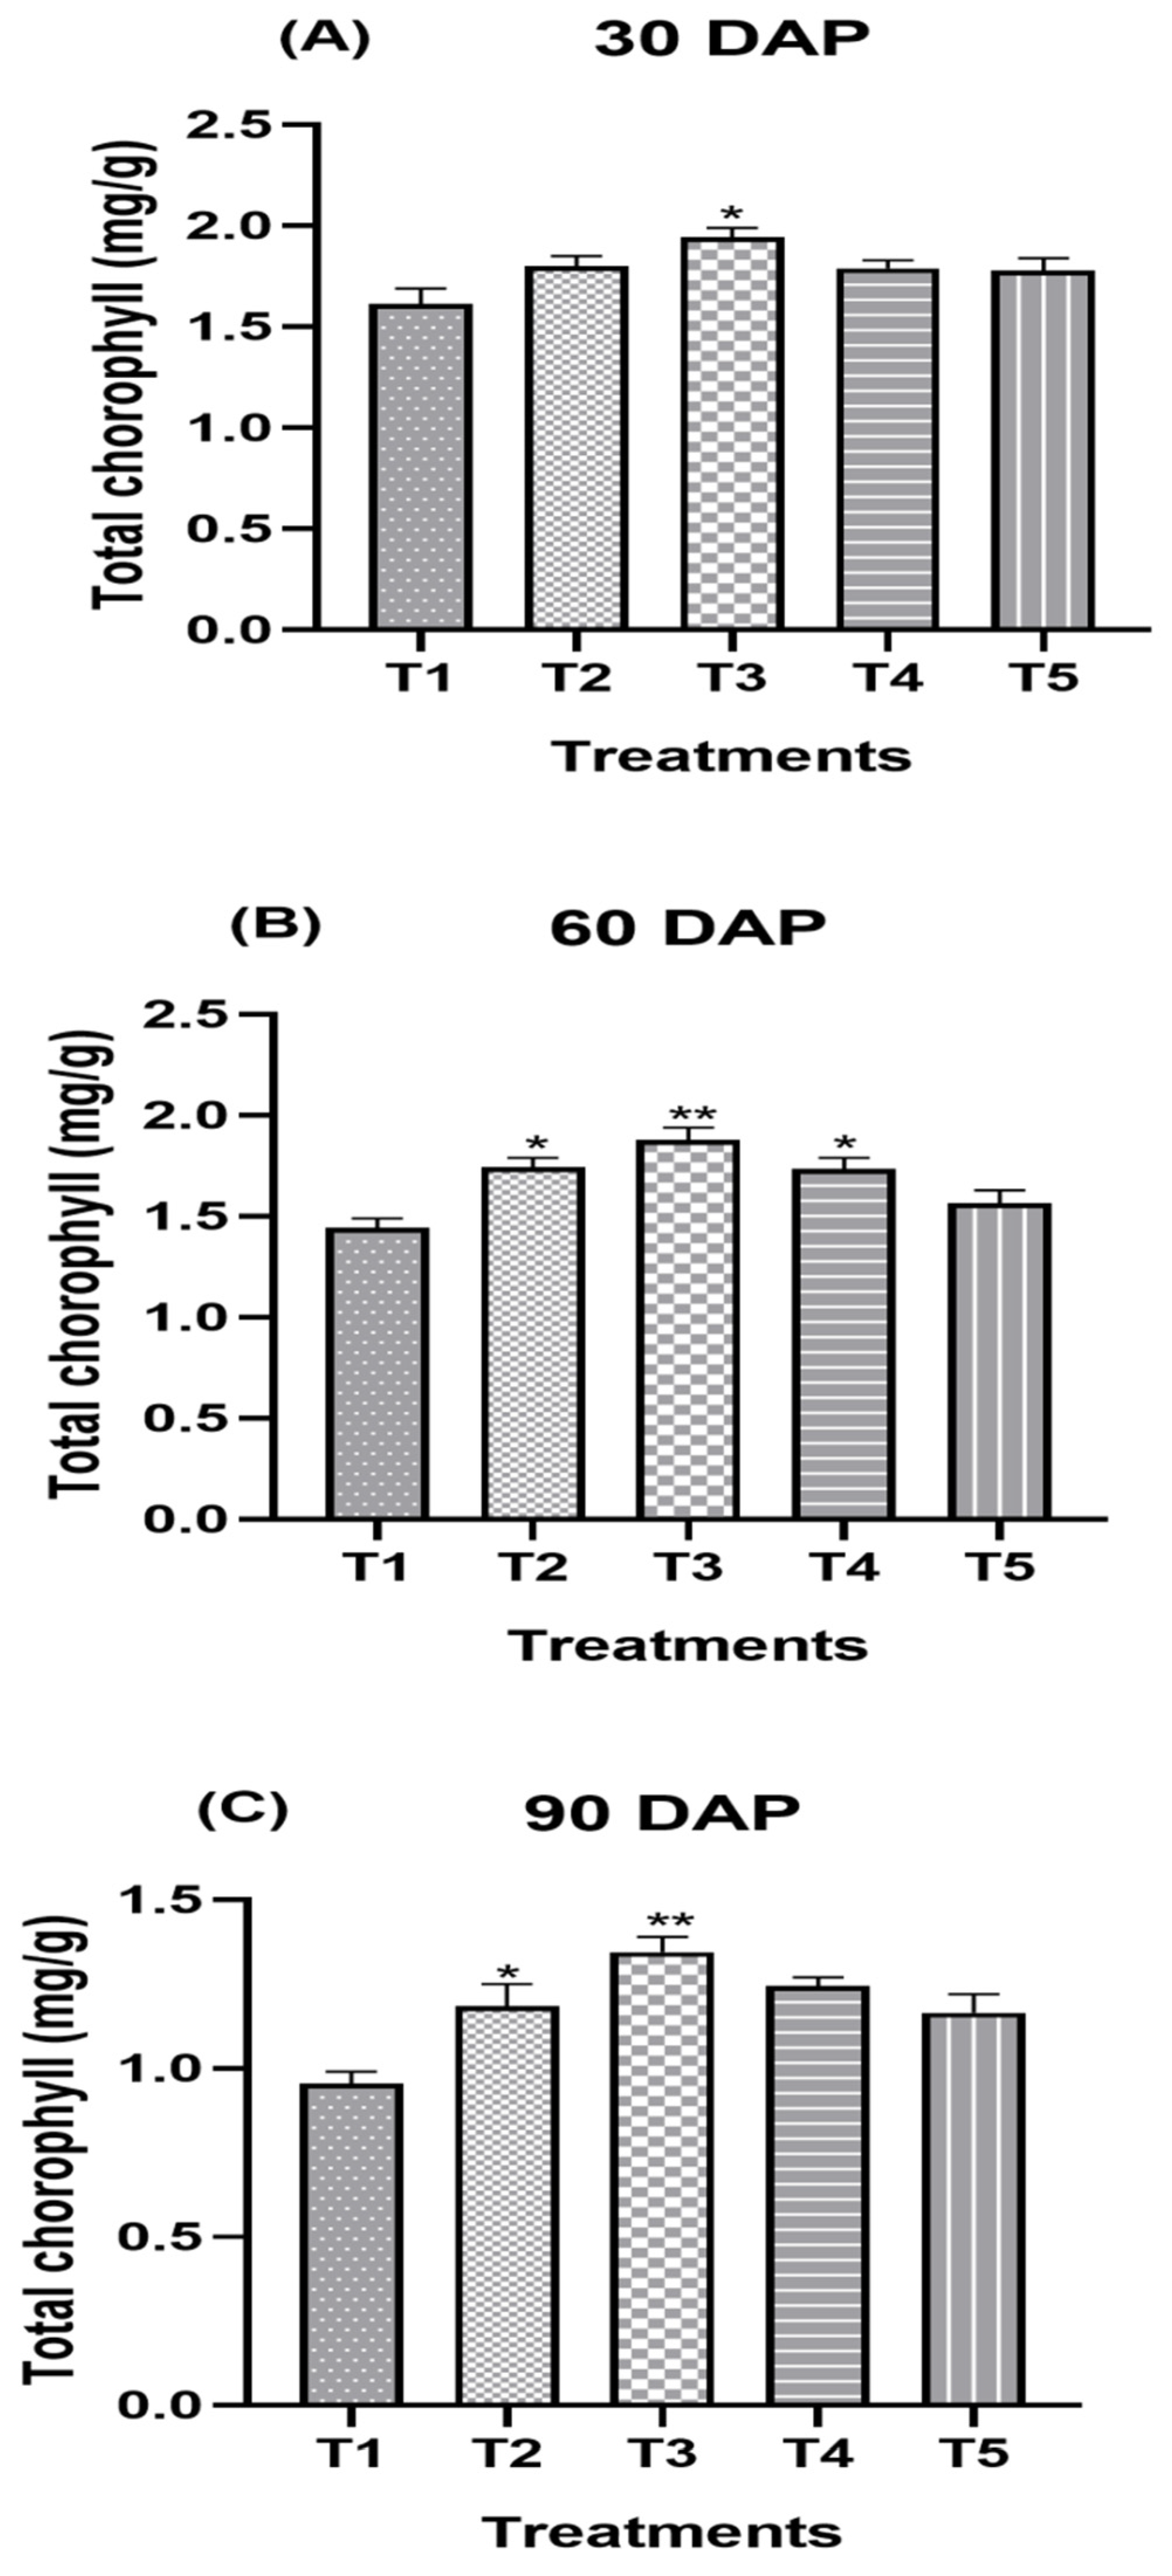
Chlorophyll a content at 30, 60 and 90 days after planting in chrysanthemum plants with T3 treatment was 1.13, 1.05 and 1.17 times greater than the control, respectively. The effects of treatments T4 (1.47, 1.43 and 1.01 mg/g) and T2 (1.46, 1.42 and 0.94 mg/g) were similar to each other. The minimum value (1.37, 1.23 and 0.80 mg/g) was obtained in the control (Table 8, Figure 4A–C). Chrysanthemum plants treated with T3 showed enhanced chlorophyll b content by 1.59-, 1.76- and 1.64-fold compared with untreated plants. Maximum chlorophyll b content was recorded in the plants with T3 treatment (0.38, 0.37 and 0.28 mg/g), followed by T2 (0.35, 0.35 and 0.26 mg/g), T4 (0.33, 0.31 and 0.25 mg/g) and T5 (0.29, 0.27 and 0.23 mg/g). The chrysanthemum plant experienced 6.06%, 12.90% and 4.00% increases in chlorophyll b content when treated with T2 treatment as compared to T4 at the three intervals (Table 9, Figure 5A–C). At 30, 60 and 90 days after planting, the application of T3 treatment was linked to 19.87%, 29.86% and 40.20% increments in total chlorophyll content as compared to the control, respectively. Minimum total chlorophyll content (1.61, 1.44 and 0.97 mg/g) was recorded in the control (Table 10, Figure 6A–C). For carotene content of inflorescence, plants treated with T3 had the highest carotene value (69.56%) and plants that did not receive any treatment (untreated) had the lowest carotene content. T4, T5 and T2 treatments increased the carotene content of inflorescence by 47.82%, 43.47% and 39.13%, respectively, compared to the corresponding control (Table 11, Figure 7).

3.4. Effect of Split Supplication of NPK through Drip Fertigation on Soil Nutrient Status

The chrysanthemum plants treated with T3 showed increased soil organic carbon by 1.22-fold compared with T1 treatment. The organic carbon in soil was 17.54% higher with application of T2 treatment than that of the control. Available nitrogen content in soil under T3 treatment was the highest, 7.46% higher than under the T1 treatment. Similarly, the chrysanthemum plants showed 6.72% and 2.37% increases in available nitrogen content of soil when treated with T2 and T4, respectively. The minimum available nitrogen content in soil was measured in T1, the control (270.31 kg/ha), which was statistically at par with T4 (276.73 kg/ha) and T5 (271.85 kg/ha) (Table 12).
Chrysanthemum plants treated with T3 and T5 showed increased available phosphorus content in soil by 1.19- and 1.14-fold compared with untreated plants, respectively. The application of T2 treatment showed a 14.03% increment in available phosphorus content in soil as compared to the control. The maximum value of available potassium (152.11 kg/ha) was observed in chrysanthemum plants treated with T3, which was 1.14-fold greater than those of untreated plants (Figure 2A). Similarly, the plants treated with T4 showed the maximum available potassium content in soil, 6.94% higher as compared to T5 treatments. The minimum value of available potassium was recorded in the control (132.79 kg/ha). However, treatments T2 and T5 were statistically comparable with each other (Table 13).

4. Discussion

4.1. Effect of Split Supplication of NPK through Drip Fertigation on Inflorescence Attributes

The improved performance after T3 treatment was ascribed to lower nutritional losses due to leaching and improved nutrient absorption, resulting in proper food material translocation, and, as a result, overall enhanced inflorescence parameters compared to other treatments [47,48]. In addition, the plants were able to use moisture and nutrients effectively from the limited wetted area due to the maintenance of a favorable soil moisture status in the root zone [49].
In African marigolds, phosphorus has a significant function in the commencement of floral primordial creation, which leads to a rise in flower diameter [50]. In a similar study, it was discovered that nitrogen administration at 300 kg/ha resulted in the most buds per plant in chrysanthemums [51]. In addition, the highest number of buds per plant with application of NPK @ 16:4:16 g/m2 in chrysanthemum cv. Punch was also recorded [52].

4.2. Effect of Split Supplication of NPK through Drip Fertigation on Yield Attributes

The maximum yield might be due an optimal level of moisture in the rhizosphere zone by the controlled application of water through drip that favored the mineralization of inorganic nutrients and resulted in better growth and development of the crop; alternatively, this might be due to the application of water-soluble forms of nutrients under each treatment, while treatments that received higher fertigation levels at optimal stage showed more yield [53].
The increasing levels of fertigation limited the fertilizers to the moist zone of the soil, where the active root zones are concentrated, thus leading to an enhanced availability of optimal dosages of nutrients in accessible form, which may have led to improved absorption and quicker transfer of assimilates from source to sink, resulting in more cut inflorescence per hectare [54]. More photosynthates increased food accumulation, which could have resulted in improved plant development and, as a result, more inflorescence.
It is evident from the results that the number of inflorescences per hectare was directly correlated with the number of inflorescences per plot and, accordingly, the number of inflorescences per plant, which was substantially influenced by the application of NPK through fertigation [55].
Maximum numbers of inflorescences per hectare were also recorded with application of NPK @ 200:150:100 kg/ha in chrysanthemum [56]. A similar study found that the optimal amount of fertigation at various stages of plant growth resulted in a considerable enhancement in the number of blooms per hectare in chrysanthemums [52].
Overall, drip fertigation is a highly efficient method for fertilizer application, as it minimizes losses and mitigates adverse environmental effects on crop production. Both water and nutrients applied through irrigation will be efficiently used by the plants for photosynthesis, thereby causing greater synthesis, translocation and accumulation of carbohydrates [57]. Various studies have evaluated that fertigation is the only replacement of the conventional method that can achieve higher fertilizer use efficiency, reduce water and fertilizer application and lead to higher crop yield [58].

4.3. Effect of Split Supplication of NPK through Drip Fertigation on Biochemical Attributes

The higher chlorophyll content might be due to due to adequate application of NPK nutrients through drip in the vicinity of the root zone, leading to more availability and uptake of nitrogen, enhancing the turgidity of mesophyll cells and chloroplasts and thereby resulting in increased chlorophyll content and carotene content in crops [59,60]. Nitrogen is involved in the production of chlorophyll and protein molecules, and hence influences the creation of chloroplasts and chlorophyll accumulation [20]. Furthermore, potassium is required for the stability of chlorophyll biosynthesis in a variety of physiological and biochemical activities, including the stimulation of protein and carbohydrate synthesis, the activation of key enzyme reactions, and the increased water use efficiency [20]. The increased carotene content in inflorescence might be attributed to the role of nitrogen and phosphorous, which are indirectly included in the synthesis of nucleic acids, DNA, RNA and proteins [61]. A similar kind of research [62] also reported that chlorophyll a, b, total chlorophyll content and carotene content in Tagetus erecta increased with optimal dosage of nitrogen application.

4.4. Effect of Split Supplication of NPK through Drip Fertigation on Soil Nutrient Status

The steady accumulation of root exudates degrading dead roots in soil under continuous and adequate flow of water and nutrients by drip fertigation could explain the rise in soil organic carbon content with NPK treatment through fertigation [63,64]. Because of the consistent supply of soil moisture provided by drip irrigation, more roots develop laterally and concentrate at the surface, increasing soil organic carbon [65,66,67].
The majority of the applied nutrition in traditional fertilizer application is either fixed in the soil profile or lost to leaching losses owing to flooding irrigation [68]. The flower crop irrigation through the sprinkler method causes much more serious problems, i.e., leaching and seepage losses of nutrients, when the system is also used for the application of fertilizers [69]. The application of NPK fertilizers via drip fertigation had a substantial influence on the amount of macronutrients that remained in the soil following chrysanthemum crop harvest, according to the findings. The maximum available nitrogen, phosphorus and potassium content under an optimal dose of NPK administered through drip might be ascribed to the balanced distribution of nutrients near the root zone, which reduces nutrient leaching losses and increases nutrient fixation [70,71].
The application of NPK @ 30 g/m2 substantially provided additional phosphorus in chrysanthemums, according to a similar study [72]. In similar research, the application of NPK through drip fertigation substantially enhanced the available nitrogen, phosphorus and potassium content in Dianthus L. cv. Master [73].

5. Conclusions

The present study provides new experimental data on the comparison of five treatments on flowering, yield, biochemical activity and soil nutrient status of Chrysanthemum morifolium L. According to the results, it can be concluded that the treatment T3 increased the floral bud diameter, number of inflorescences per branch diameter of inflorescence, weight of inflorescence, stem diameter, inflorescence stem length, number of inflorescences per plant, number of inflorescences per hectare, chlorophyll a content, chlorophyll b content, total chlorophyll content carotene content of inflorescence (%), organic carbon, available nitrogen, available phosphorus and available potassium as compared to the control. The larger number of inflorescences per branch, flowering per plant and per plot and fertilizer use efficiency in fertigation resulted in higher floral output. In T3 treatments, the optimal quantity of nutrients was applied through emitters directly into the zone of maximum root activity, and consequently, fertilizer use efficiency was improved over the conventional method of fertilizer application. Generally, chrysanthemum crop response to fertilizer application through drip irrigation has been excellent, and frequent nutrient applications have improved the fertilizer use efficiency and decreased NO3-N and K leaching into the soil’s deeper layers.
Overall, split application of NPK through drip irrigation at optimal quantity and proper stage may improve the flowering attributes, yield biochemical activity and soil nutrient status of chrysanthemum inflorescence, and further research is needed in this domain.

Author Contributions

Conceptualization, A.C. and A.K.; methodology, A.C. and B.R.; software, U.K.; validation, R.K., R.J. and P.N.; formal analysis, U.K.; investigation, A.A.H.; resources, A.K.; data curation, A.C.; writing—original draft preparation, A.C.; writing—review and editing, R.C. and B.R.; visualization, U.K. and B.R.; supervision, A.K.; project administration, A.K.; funding acquisition, M.A.A.-D., Y.A.A.-W. and R.R. All authors have read and agreed to the published version of the manuscript.

Funding

This work was supported by the National Research Foundation of Korea (NRF) grant funded by the Korean Government (MSIT) (No. 2020R1G1A1012069). The authors also extend their appreciation to the Researchers Supporting Project (number RSP-2021/316) of King Saud University, Riyadh, Saudi Arabia.

Institutional Review Board Statement

Not applicable.

Informed Consent Statement

Not applicable.

Data Availability Statement

Not applicable.

Acknowledgments

This work was supported by the National Research Foundation of Korea by the Korean Government (MSIT) (2020R1G1A1012069). We are thankful to the Model Floriculture Centre, Department of Horticulture, G.B. Pant University of Agriculture and Technology, Pantnagar, for successful conduct of the experiment and for providing necessary laboratory facilities. The authors also extend their appreciation to the Researchers Supporting Project (number RSP-2021/316) of King Saud University, Riyadh, Saudi Arabia.

Conflicts of Interest

The authors declare no conflict of interest.

References

  1. Van Huylenbroeck, J. Status of floriculture in Europe. In Protocols for In Vitro Propagation of Ornamental Plants; Springer: Berlin/Heidelberg, Germany, 2010; pp. 365–376. [Google Scholar]
  2. Wani, M.A.; Nazki, I.T.; Din, A.; Iqbal, S.; Wani, S.A.; Khan, F.U. Floriculture sustainability initiative: The dawn of new era. In Sustainable Agriculture Reviews 27; Springer: Berlin/Heidelberg, Germany, 2018; pp. 91–127. [Google Scholar]
  3. Van Rijswick, C. World Floriculture Map 2015. Gearing up Stronger Compet Rabobank Ind Note. 2015, p. 475. Available online: https://research.rabobank.com/far/en/sectors/regional-foodagri/world_floriculture_map_2015.html (accessed on 12 March 2021).
  4. Adebayo, I.A.; Pam, V.K.; Arsad, H.; Samian, M.R. The Global Floriculture Industry: Status and Future Prospects. In The Global Floriculture Industry; Apple Academic Press: Waretown, NJ, USA, 2020; pp. 1–14. [Google Scholar]
  5. Darras, A.I. Implementation of sustainable practices to ornamental plant cultivation worldwide: A critical review. Agronomy 2020, 10, 1570. [Google Scholar] [CrossRef]
  6. Anderson, N.O. Chrysanthemum. In Flower Breeding and Genetics; Springer: Berlin/Heidelberg, Germany, 2007; pp. 389–437. [Google Scholar]
  7. Li, T.S.C. Chinese and Related North American Herbs: Phytopharmacology and Therapeutic Values; CRC Press: Boca Raton, FL, USA, 2016. [Google Scholar]
  8. Youssef, F.S.; Eid, S.Y.; Alshammari, E.; Ashour, M.L.; Wink, M.; El-Readi, M.Z. Chrysanthemum indicum and Chrysanthemum morifolium: Chemical composition of their essential oils and their potential use as natural preservatives with antimicrobial and antioxidant activities. Foods 2020, 9, 1460. [Google Scholar] [CrossRef] [PubMed]
  9. Ohmiya, A. Molecular mechanisms underlying the diverse array of petal colors in chrysanthemum flowers. Breed Sci. 2018, 68, 17075. [Google Scholar] [CrossRef] [PubMed] [Green Version]
  10. Sasaki, K.; Mitsuda, N.; Nashima, K.; Kishimoto, K.; Katayose, Y.; Kanamori, H.; Ohmiya, A. Generation of expressed sequence tags for discovery of genes responsible for floral traits of Chrysanthemum morifolium by next-generation sequencing technology. BMC Genom. 2017, 18, 683. [Google Scholar]
  11. Cheng, W.; Li, J.; You, T.; Hu, C. Anti-inflammatory and immunomodulatory activities of the extracts from the inflorescence of Chrysanthemum indicum Linne. J. Ethnopharmacol. 2005, 101, 334–337. [Google Scholar] [CrossRef]
  12. Shahrajabian, M.H.; Sun, W.; Zandi, P.; Cheng, Q. A review of Chrysanthemum, the eastern queen in traditional Chinese medicine with healing power in modern pharmaceutical sciences. Appl. Ecol. Environ. Res. 2019, 17, 13355–13369. [Google Scholar] [CrossRef]
  13. Shao, Y.; Sun, Y.; Li, D.; Chen, Y. Chrysanthemum indicum L.: A comprehensive review of its botany, phytochemistry and pharmacology. Am. J. Chin. Med. 2020, 48, 871–897. [Google Scholar] [CrossRef]
  14. Cha, J.Y.; Nepali, S.; Lee, H.Y.; Hwang, S.W.; Choi, S.Y.; Yeon, J.M.; Song, B.-J.; Kim, D.-K.; Lee, Y.-M. Chrysanthemum indicum L. ethanol extract reduces high-fat diet-induced obesity in mice. Exp. Ther. Med. 2018, 15, 5070–5076. [Google Scholar]
  15. Zhang, X.; Wu, J.Z.; Lin, Z.X.; Yuan, Q.J.; Li, Y.C.; Liang, J.L.; Zhan, J.Y.; Xie, Y.; Su, Z.; Liu, Y. Ameliorative effect of supercritical fluid extract of Chrysanthemum indicum Linnén against D-galactose induced brain and liver injury in senescent mice via suppression of oxidative stress, inflammation and apoptosis. J. Ethnopharmacol. 2019, 234, 44–56. [Google Scholar] [CrossRef]
  16. De, L.C.; Bhattacharjee, S.K. Ornamental Crop Breeding; Aavishkar Publishers & Distributors: Jaipur, India, 2011. [Google Scholar]
  17. Malik, R.S.; Kumar, K.; Bhandari, A.R. Effect of urea application through drip irrigation system on nitrate distribution in loamy sand soils and pea yield. J. Indian Soc. Soil Sci. 1994, 42, 6–10. [Google Scholar]
  18. Dimri, D.C.; Lal, G. Effect of Nitrogen Fertilization, Spacing and Method of Planting on Yield Parameters and Quality of Tomato Cultivar Pant Bahar; Indian Society of Vegetable Science: New Delhi, India, 1988. [Google Scholar]
  19. Jeyabaskaran, K.J.; Shirgure, P.S.; Pandey, V.; Srivastava, A.K.; Uma, S. Fertigation in Horticulture: A Guarantee to Economized Quality Production. Indian J. Fertil. 2021, 17, 364–383. [Google Scholar]
  20. Rolaniya, M.K.; Khandelwal, S.K.; Choudhary, A.; Jat, P.K. Response of african marigold to NPK, biofertilizers and spacings. J. Appl. Nat. Sci. 2017, 9, 593–597. [Google Scholar] [CrossRef] [Green Version]
  21. Kumar, R.; Pareek, N.K.; Rathore, V.S.; Nangiya, V.; Yadava, N.D.; Yadav, R.S. Effect of water and nitrogen levels on yield attributes, water productivity and economics of cluster bean (Cyamopsis tetragonoloba) in hot arid region. Legume Res. Int. J. 2020, 43, 702–705. [Google Scholar] [CrossRef] [Green Version]
  22. Kumar, R.; Pareek, N.K.; Rathore, V.S.; Nangiya, V. Effect of irrigation and nitrogen application on water productivity and performance of Cotton (Gossypium sp.). J. Soil Water Conserv. 2019, 18, 282–287. [Google Scholar] [CrossRef]
  23. Plaxton, W.C.; Tran, H.T. Metabolic adaptations of phosphate-starved plants. Plant Physiol. 2011, 156, 1006–1015. [Google Scholar] [CrossRef] [Green Version]
  24. Tisdale, S.L.; Nelson, W.L. Soil fertility and fertilizers. Soil Sci. 1966, 101, 346. [Google Scholar] [CrossRef]
  25. Bergmann, W. Nutritional Disorders of Plants: Visual and Analytical Diagnosis (English, French, Spanish); Gustav Fischer Verlag: Jena, Germany, 1992. [Google Scholar]
  26. Luthra, K.L.; Saha, S.K.; Awasthi, P.K. Role of rock phosphate in present day agriculture. Indian J. Agric. Chem. 1983, 15, 13–27. [Google Scholar]
  27. Pattanaaik, S.K. Response of Drip Irrigatedbanana to Differentirrigationregimes. In Micro Irrigation Scheduling and Practices; Apple Academic Press: Oakville, ON, Canada, 2017; pp. 85–98. [Google Scholar]
  28. Raina, J.N.; Thakur, B.C.; Suman, S.; Spehia, R.S. Effect of fertigation through drip system on nitrogen dynamics, growth, yield and quality of apricot. Acta Hortic. 2005, 696, 227–231. [Google Scholar] [CrossRef]
  29. Jat, R.A.; Wani, S.P.; Sahrawat, K.L.; Singh, P.; Dhaka, P.L. Fertigation in vegetable crops for higher productivity and resource use efficiency. Indian J. Fertil. 2011, 7, 22–37. [Google Scholar]
  30. Tu, J.C.; Liptay, A.; Tan, C.S.; Drury, C.F.; Reynolds, D. Effect of drip irrigation and drip fertigation on yield of processing tomato in South-Western Ontario. In Proceedings of the XXVI International Horticultural Congress: Managing Soil-Borne Pathogens: A Sound Rhizosphere to Improve Productivity in 635, Toronto, ON, Canada, 11–17 August 2002; pp. 195–200. [Google Scholar]
  31. Neilsen, G.; Neilsen, D. Strategies for nutrient and water management of high density apple orchards on coarse-textured soils. Ann. Wars. Agric. Univ. Hortic. Landsc. Archit. 2006, 27, 181–192. [Google Scholar]
  32. Neilsen, G.H.; Neilsen, D.; Peryea, F. Response of soil and irrigated fruit trees to fertigation or broadcast application of nitrogen, phosphorus, and potassium. Horttechnology 1999, 9, 393–401. [Google Scholar] [CrossRef]
  33. Gardenas, A.I.; Hopmans, J.W.; Hanson, B.R.; Simunek, J. Two-dimensional modeling of nitrate leaching for various fertigation scenarios under micro-irrigation. Agric. Water Manag. 2005, 74, 219–242. [Google Scholar] [CrossRef]
  34. William, M.; Shenker, M. Pulverized Tires as Soil Amendment for Plant Growth. Int. J. Sci. Eng. Res. 2016, 7, 161–167. [Google Scholar]
  35. McLean, E.O. Soil pH and lime requirement. In Methods of Soil Analysis, Part 2: Microbiological and Biochemical Properties; Wiley: Hoboken, NJ, USA, 1983; Volume 9, pp. 199–224. [Google Scholar]
  36. Singh, D.; Chhonkar, P.K.; Pande, R.N. Soil reaction in soil, plant, water analysis method: Manual. IARI ICAR New Delhi 1999, 1, 11–13. [Google Scholar]
  37. Bower, C.A.; Wilcox, L.V. Soluble salts. In Methods of Soil Analysis, Part 2: Microbiological and Biochemical Properties; Wiley: Hoboken, NJ, USA, 1965; Volume 9, pp. 933–951. [Google Scholar]
  38. Bache, B.W. The measurement of cation exchange capacity of soils. J. Sci. Food Agric. 1976, 27, 273–280. [Google Scholar] [CrossRef]
  39. Bauyoucens, G.J. The hydrometer as a new method for the mechanical analysis of soil. Soil Sci. 1927, 23, 343–353. [Google Scholar]
  40. Farooq, T.H.; Kumar, U.; Mo, J.; Shakoor, A.; Wang, J.; Rashid, M.H.U.; Tufail, M.A.; Chen, X.; Yan, W. Intercropping of peanut–Tea enhances soil enzymatic activity and soil nutrient status at different soil profiles in subtropical southern China. Plants 2021, 10, 881. [Google Scholar] [CrossRef]
  41. Subbiah, B.V.; Asija, G.L. A rapid method for the estimation of nitrogen in soil. Curr. Sci. 1956, 26, 259–260. [Google Scholar]
  42. Olsen, S.R. Estimation of Available Phosphorus in Soils by Extraction with Sodium Bicarbonate; US Department of Agriculture: Washington, DC, USA, 1954. [Google Scholar]
  43. Nelson, L.B.; Heidel, H. Soil Analysis Methods as Used in the Iowa State College Soil Testing Laboratory; Iowa State College, Agronomy Department: Ames, IA, USA, 1952. [Google Scholar]
  44. Hiscox, J.D.; Israelstam, G.F. A method for the extraction of chlorophyll from leaf tissue without maceration. Can. J. Bot. 1979, 57, 1332–1334. [Google Scholar] [CrossRef]
  45. Walkley, A.; Black, I.A. An examination of the Degtjareff method for determining soil organic matter, and a proposed modification of the chromic acid titration method. Soil Sci. 1934, 37, 29–38. [Google Scholar] [CrossRef]
  46. Wheatley, R.E.; MacDonald, R.; Smith, A.M. Extraction of nitrogen from soils. Biol. Fertil. Soils 1989, 8, 189–190. [Google Scholar] [CrossRef]
  47. Sundar, S.T.B.; Kannan, M.; Jawaharlal, M. Off season flower induction through fertigation and biostimulant spray in Jasminum sambac Ait. Asian J. Hortic. 2014, 9, 32–35. [Google Scholar]
  48. Ganesh, S.; Kannan, M.; Jawaharlal, M. Optimization of fertigation schedule for cut chrysanthemum (Dendranthema grandiflora Tzvelev). Hort Flora Res. Spectr. 2011, 3, 344–348. [Google Scholar]
  49. Phene, C.J.; Beale, O.W. High-frequency irrigation for water nutrient management in humid regions. Soil Sci. Soc. Am. J. 1976, 40, 430–436. [Google Scholar] [CrossRef]
  50. Sharma, A.K.; Chaudhary, S.V.S.; Gupta, Y.C. Effect of nitrogen and phosphorus on flowering and yield of African marigold (Tagetes erecta Linn.). Prog. Agric. 2010, 10, 158–160. [Google Scholar]
  51. Joshi, N.S.; Varu, D.K.; Barad, A.V.; Pathak, D.M. Performance of varieties and chemical fertilizers on growth and flowering in chrysanthemum. Int. J. Agric. Sci. 2013, 9, 182–188. [Google Scholar]
  52. Ganesh, S.; Kannan, M.; Jawaharlal, M.; Arulmozhiyan, R.; Jeyakumar, P. Enhancement of physiological response in spray chrysanthemum through fertigation. J. Ornam. Hortic. 2013, 16, 108–116. [Google Scholar]
  53. Jangir, R.P.; Jat, B.L.; Rathore, M.S. Comparative efficacy of sprinkler and surface methods of irrigation in cumin (Cuminum cyminum) under arid western Rajasthan conditions. Indian J. Agron. 2007, 52, 83–85. [Google Scholar]
  54. Gopinath, G.; Chandrashekar, S.Y. Yield of carnation as influenced by levels of fertigation and sources of nutrients of growing standard carnation cv. Trendy under cost greenhouse. J. Ornam. Hortic. 2009, 12, 251–255. [Google Scholar]
  55. Abrol, A. Effect of Integrated Nutrient Management Studies and Planting Dates on Commercial Flower Production in China Aster (Callistephus chinensis (l.) Nees). Trends Biosci. 2014, 7, 1217–1221. [Google Scholar]
  56. Teja, P.R.; Bhaskar, V.V.; Dorajeerao, A.V.D.; Subbaramamma, P. Effect of Graded Levels of Nitrogen and Potassium on Growth and Flower Yield of Annual Chrysanthemum (Chrysanthemum coronariuml.). Plant Arch. 2017, 17, 1371–1376. [Google Scholar]
  57. Loganathan, V.; Latha, K.R. Effect of drip fertigation on nutrient uptake and seed yield of pigeonpea [Cajanus Cajan (L.) Millsp.] under westeren agroclimatic zones of Tamil Nadu. Legume Res. Int. J. 2016, 39, 780–785. [Google Scholar] [CrossRef] [Green Version]
  58. Harisha, C.B.; Diwakar, Y.; Aishwath, O.P.; Singh, R.; Asangi, H. Soil fertility and micronutrient uptake by fennel (Foeniculum vulgare Mill.) as influenced by micronutrients fertilization. Environ. Ecol. 2017, 35, 514–518. [Google Scholar]
  59. Mozafariyan, M.; Saghafi, K.; Bayat, A.E.; Bakhtiari, S. The effects of different sodium Chloride concentrations on the growth and photosynthesis parameters of tomato (Lycopersicum esculentum cv. Foria). Int. J. Agric. Crop Sci. 2013, 6, 203. [Google Scholar]
  60. Teixeira, L.A.J.; Natale, W.; Bettiol Neto, J.E.; Martins, A.L.M. Nitrogen and potassium application on banana plant by fertirrigation and conventional fertilization-soil chemical properties. Rev. Bras. Frutic. 2007, 29, 143–152. [Google Scholar] [CrossRef]
  61. Sheela, V.L. Flowers for Trade; New India Publishing: Delhi, India, 2008; Volume 10. [Google Scholar]
  62. Yadav, P.K. Effect of N and FYM on chlorophyll and nutrient content in leaf of African marigold (Tagetes erecta L.) at flower bud initiation stage. Environ. Ecol. 1999, 17, 188–190. [Google Scholar]
  63. Chandra Kumar, S.S. Growth and Productivity of Robusta Banana under Nitrogen and Potassium Fertigation. Master’s Thesis, Indian Institute of Horticultural Research, Bagalore, India, 1998. [Google Scholar]
  64. Sainju, U.M.; Singh, B.P.; Yaffa, S. Soil organic matter and tomato yield following tillage, cover cropping, and nitrogen fertilization. Agron. J. 2002, 94, 594–602. [Google Scholar] [CrossRef]
  65. Yoshida, C.; Iwasaki, Y.; Makino, A.; Ikeda, H. Effects of irrigation management on the growth and fruit yield of tomato under drip fertigation. Hortic. Res. 2011, 10, 325–331. [Google Scholar] [CrossRef] [Green Version]
  66. Meena, A.K.; Singh, D.K.; Pandey, P.C.; Nanda, G. Growth, yield, economics, and nitrogen use efficiency of transplanted rice (Oryza sativa L.) as influenced by different nitrogen management practices through neem (Azadirachta indica) coated urea. Int. J. Chem. Stud. 2018, 6, 1388–1395. [Google Scholar]
  67. Farooq, T.H.; Kumar, U.; Shakoor, A.; Albasher, G.; Alkahtani, S.; Rizwana, H.; Tayyab, M.; Dobaria, J.; Hussain, M.I.; Wu, P. Influence of Intraspecific Competition Stress on Soil Fungal Diversity and Composition in Relation to Tree Growth and Soil Fertility in Sub-Tropical Soils under Chinese Fir Monoculture. Sustainability 2021, 13, 10688. [Google Scholar] [CrossRef]
  68. Hazarika, T.K.; Nautiyal, B.P.; Bhattacharya, R.K. Effect of INM on productivity and soil characteristics of tissue cultured banana cv. Grand Naine in Mizoram, India. Prog. Hortic. 2011, 43, 30–35. [Google Scholar]
  69. Sujatha, K.; Gowda, J.V.N.; Khan, M.M. Effects of different fertigation levels on gerbera under low cost greenhouse. J. Ornam. Hortic. 2002, 5, 54–59. [Google Scholar]
  70. Ahmad, I.; Asif, M.; Amjad, A.; Ahmad, S. Fertilization enhances growth, yield, and xanthophyll contents of marigold. Turk. J. Agric. For. 2011, 35, 641–648. [Google Scholar]
  71. Angadi, A.P. Effect of integrated nutrient management on yield, economics and nutrient uptake of garland chrysanthemum (Chrysanthemum coronarium L.). Asian J. Hortic. 2014, 9, 132–135. [Google Scholar]
  72. Laishram, N.; Dhiman, S.R.; Gupta, Y.C.; Bhardwaj, S.K.; Singh, A. Microbial dynamics and physico-chemical properties of soil in the rhizosphere of chrysanthemum (Dendranthema grandiflora) as influenced by integrated nutrient management. Indian J. Agric. Sci. 2013, 83, 447–455. [Google Scholar]
  73. Singh, A.; Laishram, N.; Gupta, Y.C.; Sharma, B.P.; Dilta, B.S.; Bhardwaj, S.K. Influence of NPK fertigation and foliar application on flower quality, media physico-chemical properties and foliar nutrient content in carnation (Dianthus caryophyllus) cv. Master Indian J. Agric. Sci. 2015, 85, 1461–1465. [Google Scholar]
Figure 1. Month-wise weather parameters during cropping seasons.
Sustainability 14 04561 g001
Figure 2. The effect of different levels of fertilization on inflorescence attributes of chrysanthemum. (A) Inflorescence bud diameter. (B) Inflorescence diameter. (C) Number of inflorescences per branch. (D) Number of inflorescence buds per plant. Each treatment was compared with the control, and the asterisks on bars show the significant differences (p < 0.05) with vertical bars as standard errors (n = 4).
Sustainability 14 04561 g002
Figure 3. The effect of the different levels of fertilization on inflorescence attributes of chrysanthemum. (A) Number of inflorescences per plot. (B) Number of inflorescences per hectare. Each treatment was compared with the control and the asterisks on bars show the significant differences (p < 0.05) with vertical bars as standard errors (n = 4). * and ** indicate a significant level at p < 0.05 and p < 0.01 respectively.
Sustainability 14 04561 g003
Figure 4. The effect of drip fertigation treatments on leaf chlorophyll a (mg/g) content of Chrysanthemum morifolium ‘Thai Chen Queen’: (A) 30 days; (B) 60 days; (C) 90 days. Each treatment was compared with the control and the asterisks on bars show the significant differences (p < 0.05) with vertical bars as standard errors (n = 4). * and ** indicate a significant level at p < 0.05 and p < 0.01 respectively. DAP stands for days after planting.
Sustainability 14 04561 g004
Figure 5. The effect of drip fertigation treatments on leaf chlorophyll b (mg/g) content of Chrysanthemum morifolium ‘Thai Chen Queen’: (A) 30 days; (B) 60 days; (C) 90 days. Each treatment was compared with the control and the asterisks on bars show the significant differences (p < 0.05) with vertical bars as standard errors (n = 4). DAP stands for days after planting.
Sustainability 14 04561 g005
Figure 6. The effect of drip fertigation treatments on total leaf chlorophyll (mg/g) content of Chrysanthemum morifolium ‘Thai Chen Queen’: (A) 30 days; (B) 60 days; (C) 90 days. Each treatment was compared with the control and the asterisks on bars show the significant differences (p < 0.05) with vertical bars as standard errors (n = 4). * and ** indicate a significant level at p < 0.05 and p < 0.01 respectively. DAP stands for days after planting.
Sustainability 14 04561 g006
Figure 7. The effect of drip fertigation treatments on carotene content of Chrysanthemum morifolium ‘Thai Chen Queen’ flowers. Each treatment was compared with the control and the asterisks on bars show the significant differences (p < 0.05) with vertical bars as standard errors (n = 4).
Sustainability 14 04561 g007
Table 1. Pre-experiment soil characteristics.
Soil PropertyMethodSoil StatusCategoryReference
pH (1:2 soil water suspension)Digital pH meter6.95NeutralMcLean, 1983 [35] Singh, 1999 [36]
Electrical conductivity (1:2 soil water suspension)Conductivity meter0.38 dS/m-Bower and Wilcox, 1965 [37]
Cation-exchange capacityAmmonium acetate method32.49(cmol (p+) kg−1 soil)-Bache, 1976 [38]
SandHydrometer method49.12%-Bauyoucens, 1927 [39]
SiltHydrometer method25.72%-Bauyoucens, 1927 [39]
ClayHydrometer method25.16%-Bauyoucens, 1927 [39]
Organic carbonWalkley–Black Modified method0.52%-Farooq, 2021 [40]
Available nitrogenAlkaline KMnO4216.65 kg ha−1LowSubbiah and Asija, 1956 [41]
Available phosphorusOlsen’s extraction method21.03 kg ha−1MediumOlsen et al., 1954 [42]
Available potassiumFlame photometer112.05 kg ha−1MediumNelson and Heidel, 1952 [43]
Table 2. Treatment details characteristics.
TreatmentsFertilizer DoseDoseStage
T1 (Control)100:150:100 kg NPK/ha/year100% P and KFull dose of P and K as basal
Split application @ 33.3% eachN in three equal splits—first dose as basal, second dose at first pinching and third dose at one month after pinching
T2100:150:100 kg NPK/ha/year33.3:33.3:33.3%Vegetative stage
33.3:33.3:33.3%Bud stage
33.3:33.3:33.3%Inflorescence stage
T3100:150:100 kg NPK/ha/year40:20:20%Vegetative stage
30:40:40%Bud stage
30:40:40%Inflorescence stage
T475:112.5:75 kg NPK/ha/year
(75% RDF)
33.3:33.3:33.3% Vegetative stage
33.3:33.3:33.3% Bud stage
33.3:33.3:33.3% Inflorescence stage
T575:112.5:75 kg NPK/ha/year
(75% RDF)
40:20:20%Vegetative stage
30:40:40%Bud stage
30:40:40%Inflorescence stage
RDF, recommended dose of fertilizers.
Table 3. Effect of different levels of fertigation on inflorescence bud diameter and inflorescence diameter in Chrysanthemum morifolium ‘Thai Chen Queen’. Values marked by at least a common letter do not differ significantly according to LSD test (p = 0.05).
Treatment CombinationInflorescence Bud Diameter (mm)Inflorescence Diameter (cm)
2019–20202020–2021Pooled Mean2019–20202020–2021Pooled Mean
T1 (Control)16.49 c15.86 b16.18 d7.04 b8.36 c7.70 c
T2 20.35 ab17.85 b19.10 b8.80 a9.88 ab9.34 ab
T3 22.26 a20.29 a21.27 a9.02 a10.75 a9.89 a
T4 17.26 c17.24 b17.25 cd8.28 a9.47 bc8.88 b
T5 18.75 bc17.49 18.12 bc8.46 a9.74 ab9.10 b
Table 4. Effect of different levels of fertigation on the number of inflorescences per branch and number of inflorescence buds per plant in Chrysanthemum morifolium ‘Thai Chen Queen’. Values marked by at least a common letter do not differ significantly according to LSD test (p = 0.05).
Treatment CombinationNumber of Inflorescences per BranchNumber of Inflorescence Buds per Plant
2019–20202020–2021Pooled Mean2019–20202020–2021Pooled Mean
T1 (Control)6.30 b4.77 b6.30 c9.17 c9.51 b9.42 c
T2 7.13 ab5.67 ab7.13 b12.66 b12.42 ab12.54 b
T3 7.84 a5.75 a7.84 a17.32 a13.88 a15.60 a
T4 6.38 b4.92 ab6.38 c11.79 bc9.67 b10.65 bc
T5 6.39 b4.97 b6.39 c12.44 bc10.92 ab11.68 bc
Table 5. Effect of different levels of fertigation on weight of inflorescence and number of inflorescences per plant in Chrysanthemum morifolium ‘Thai Chen Queen’. Values marked by at least a common letter do not differ significantly according to LSD test (p = 0.05).
Treatment CombinationWeight of Inflorescence (g)Number of Inflorescences per Plant
2019–20202020–2021Pooled Mean2019–20202020–2021Pooled Mean
T1 (Control)10.79 b10.04 b10.41 b7.12 c5.31 c6.21 c
T2 11.88 ab12.09 ab11.41 bc8.90 b7.50 a7.40 ab
T3 12.99 a12.90 a12.9411.03 a8.03 a9.53 a
T4 11.50 b10.93 ab11.79 ab7.29 c5.79 bc7.14 bc
T5 11.65 b11.97 ab11.81 ab8.48 bc6.26 ab7.58 ab
Table 6. Effect of different levels of fertigation on inflorescence stem diameter and inflorescence in stem length in Chrysanthemum morifolium ‘Thai Chen Queen’. Values marked by at least a common letter do not differ significantly according to LSD test (p = 0.05).
Treatment CombinationInflorescence Stem Diameter (mm)Inflorescence Stem Length (cm)
2019–20202020–2021Pooled Mean2019–20202020–2021Pooled Mean
T1 (Control)4.23 a4.09 a4.29 b5.57 b4.72 a5.14 b
T24.52 a4.41 a4.40 b5.85 ab5.12 a5.39 ab
T3 4.92 a4.87 a4.89 a6.04 a5.16 a5.60 a
T44.40 a4.36 a4.25 b5.71 ab4.93 a5.42 ab
T54.41 a4.39 a4.45 b5.74 ab5.10 a5.42 ab
Table 7. Effect of different levels of fertigation on number of inflorescences per plot and number of inflorescences per hectare in Chrysanthemum morifolium ‘Thai Chen Queen’. Values marked by at least a common letter do not differ significantly according to LSD test (p = 0.05).
Treatment CombinationNumber of Inflorescences per PlotNumber of Inflorescences per ha. (Thousand)
2019–20202020–2021Pooled Mean2019–20202020–2021Pooled Mean
T1 (Control)305.95 c228.12 e267.03 d339,940.00 c253,460.00 c296,700.00 d
T2382.70 b322.50 b352.60 b425,220.00 b358,330.00 a391,775.00 b
T3 474.29 a345.29 a409.79 a526,990.00 a383,660.00 a455,325.00 a
T4313.47 c248.97 d281.22 d348,300.00 c276,630.00 bc312,465.00 dc
T5364.65 bc269.28 c316.96405,170.00 bc299,200.00 b352,185.00 c
Table 8. Effect of different levels of fertigation on chlorophyll a at 30, 60 and 90 days after planting of Chrysanthemum morifolium ‘Thai Chen Queen’. Values marked by at least a common letter do not differ significantly according to LSD test (p = 0.05).
Treatment CombinationChlorophyll a (mg/g)
30 DAP60 DAP90 DAP
2019–20202020–2021Pooled Mean2019–20202020–2021Pooled Mean2019–20202020–2021Pooled Mean
T1 (Control)1.35 c1.40 c1.37 c1.20 c1.26 d1.23 b0.81 c0.79 d0.80 c
T2 1.47 b1.45 bc1.46 b1.44 a1.40 bc1.42 a0.95 abc0.93 c0.94 b
T3 1.55 a1.54 a1.55 a1.47 a1.51 a1.49 a1.08 a1.10 a1.09 a
T4 1.43 bc1.50 ab1.47 b1.43 a1.43 ab1.43 a1.01 ab1.01 b1.01 b
T5 1.48 ab1.492 b1.492 b1.313 b1.32 cd1.320.900.97 bc0.94 b
Table 9. Effect of different levels of fertigation on chlorophyll b at 30, 60 and 90 days after planting of Chrysanthemum morifolium ‘Thai Chen Queen’. Values marked by at least a common letter do not differ significantly according to LSD test (p = 0.05).
Treatment CombinationChlorophyll b (mg/g)
30 DAP60 DAP90 DAP
2019–20202020–2021Pooled Mean2019–20202020–2021Pooled Mean2019–20202020–2021Pooled Mean
T1 (Control)0.20 c0.28 ± 0.01 d0.24 d0.21 c0.21 e0.21 d0.17 c0.17 d0.17 d
T2 0.35 a0.36 ± 0.01 b0.35 b0.33 ab0.37 b0.35 a0.25 ab0.26 b0.26 ab
T3 0.37 a0.40 ± 0.01 a0.38 a0.35 a0.38 a0.37 a0.28 a0.28 a0.28 a
T4 0.34 a0.33 ± 0.01 c0.33 b0.30 ab0.32 c0.31 b0.25 ab0.25 bc0.25 bc
T5 0.29 b0.30 d0.29 c0.27 bc0.27 d0.27 c0.22 bc0.24 c0.23 c
Table 10. Effect of different levels of fertigation on total chlorophyll at 30, 60 and 90 days after planting of Chrysanthemum morifolium ‘Thai Chen Queen’. Values marked by at least a common letter do not differ significantly according to LSD test (p = 0.05).
Treatment CombinationTotal Chlorophyll (mg/g)
30 DAP60 DAP90 DAP
2019–20202020–2021Pooled Mean2019–20202020–2021Pooled Mean2019–20202020–2021Pooled Mean
T1 (Control)1.54 ± 0.02 c1.69 ± 0.02 c1.61 ± 0.01 d1.41 ± 0.03 c1.47 ± 0.03 d1.44 ± 0.02 d0.97 ± 0.04 d0.97 ± 0.01 d0.97 ± 0.02 d
T2 1.81 ± 0.02 b1.80 ± 0.02 b1.81 ± 0.01 b1.78 ± 0.03 a1.76 ± 0.03 b1.77 ± 0.02 b1.20 ± 0.04 bc1.20 ± 0.01 c1.20 ± 0.02 bc
T3 1.92 ± 0.02 a1.94 ± 0.02 a1.93 ± 0.01 a1.83 ± 0.03 a1.90 ± 0.03 a1.87 ± 0.02 a1.36 ± 0.04 a1.37 ± 0.01 a1.36 ± 0.02 a
T4 1.77 ± 0.02 b1.83 ± 0.02 b1.80 ± 0.01 bc1.73 ± 0.031.76 ± 0.03 b1.74 ± 0.02 b1.26 ± 0.04 ab1.27 ± 0.01 b1.26 ± 0.02 b
T5 1.76 ± 0.02 b1.80 ± 0.02 b1.78 ± 0.01 c1.59 ± 0.03 b1.59 ± 0.03 c1.59 ± 0.02 c1.11 ± 0.04 c1.22 ± 0.01 c1.17 ± 0.02 c
Table 11. Effect of different levels of fertigation on carotene content of inflorescence in Chrysanthemum morifolium ‘Thai Chen Queen’. Values marked by at least a common letter do not differ significantly according to LSD test (p = 0.05).
Treatments CombinationCarotene Content of Inflorescence (mg/g)
2019–20202020–2021Pooled Mean
T1 (Control)0.24 c0.22 d0.23 c
T2 0.35 a0.39 c0.32 b
T3 0.37 a0.41 a0.39 a
T4 0.28 bc0.29 a0.34 b
T5 0.31 ab0.36 b0.33 b
Table 12. Effect of different levels of fertigation on organic carbon and available N content of soil. Values marked by at least a common letter do not differ significantly according to LSD test (p = 0.05).
Treatment CombinationOrganic Carbon (%)Available Soil N Content (kg/ha)
2019–20202020–2021Pooled Mean2019–20202020–2021Pooled Mean
T1 (Control)0.56 c0.58 d0.57 b265.54 b275.07 ± 6.48 b270.31 b
T2 0.65 ab0.68 ab0.67281.21 ab295.76 ± 6.48 ab288.48 a
T3 0.68 a0.72 a0.70 a299.42 a313.32 ± 6.48 b290.49 a
T4 0.58 bc0.62 cd0.61 b240.14 c277.54 ± 6.48 a276.73 ab
T5 0.61 c0.65 bc0.61 b266.16 b281.56 ± 6.48 b271.85 b
Initial0.52216.65
Table 13. Effect of different levels of fertigation on available P and available K content of soil. Values marked by at least a common letter do not differ significantly according to LSD test (p = 0.05).
Treatment CombinationAvailable Soil P Content (kg/ha)Available Soil K Content (kg/ha)
2019–20202020–2021Pooled Mean2019–20202020–2021Pooled Mean
T1 (Control)26.79 c29.76 d28.28 c131.07 c134.51 c132.79 c
T2 32.39 b34.15 c32.25 b142.65 b147.54 b143.94 b
T3 36.99 a38.98 d33.78 a156.67 a162.54 b152.11 a
T4 28.56 c30.56 a33.77 a140.26 bc141.10 a151.40 a
T5 30.56 b32.11 b32.36 b142.04 b145.23 bc141.57 b
Initial21.03112.05
Publisher’s Note: MDPI stays neutral with regard to jurisdictional claims in published maps and institutional affiliations.