Article

Measurement of China’s Building Energy Consumption from the Perspective of a Comprehensive Modified Life Cycle Assessment Statistics Method

1
School of Management, Wuhan Institute of Technology, Wuhan 430205, China
2
The Second Construction Co., Ltd., China Construction Third Engineering Bureau, Wuhan 430074, China
3
College of Environmental & Civil Engineering, Chengdu University of Technology, Chengdu 610059, China
*
Author to whom correspondence should be addressed.
Sustainability 2022, 14(8), 4587; https://doi.org/10.3390/su14084587
Submission received: 16 February 2022 / Revised: 24 March 2022 / Accepted: 7 April 2022 / Published: 12 April 2022
(This article belongs to the Special Issue Sustainable Supply Chain Management and Optimization)

Abstract

:
This paper proposes a new life cycle assessment (LCA) statistics method to calculate the energy consumption of Chinese buildings from the perspective of LCA under the sustainable supply chain system. We divide the life cycle of buildings into the materialization stage, the construction stage, and the operation stage. Based on the new LCA statistics method, we obtain the following findings. First, the growth of total building energy consumption has slowed down since 2014, and its share of the Chinese total energy consumption levels off, remaining at about 40%. In 2018, the stages of materialization, construction, and operation account for about 34.02%, 4.65%, and 61.33% in total building energy consumption, respectively. Second, the materialization and operation stages are the main sources of energy consumption in the whole supply chain. Energy consumption in the materialization stage has been declining year by year since 2014, due to the impact of energy-saving policy. Moreover, we find that energy consumption in the operation and construction stages has been increasing year by year. Finally, in the life cycle of Chinese buildings, energy consumption in the operation stage plays a dominant role. This paper puts forward some managerial suggestions to relevant departments and provides some measures to optimize energy consumption in the Chinese building industry.

1. Introduction

Nowadays, energy shortage and excessive emission of greenhouse gas have become hot topics in the world [1,2]. After more than 30 years of rapid economic development, China has become the world’s largest carbon transfer site and has surpassed the United States as the world’s largest carbon emitter since 2005 [3,4]. Economic development is inevitably accompanied by an increase in energy consumption [5]. In 2017, China’s total energy consumption reached 4.49 billion tons of standard coal, 6.9 times higher than 1978, with an average annual growth rate of about 5.4% [6]. The Chinese Revolutionary Action Plan on Energy Production and Consumption has set a goal of limiting total energy consumption to 6 billion tons of coal equivalent, with non-fossil energy accounting for no less than 20% by 2030 [7]. As a result, China faces serious challenges in reducing energy consumption and coping with increasing environmental problems [8].
With the above attention to energy issues, the energy transformation of China has achieved great progress in recent years. The development of new energy and renewable energy is gradually improving [9,10,11]. However, energy problems such as excessive production, unreasonable energy consumption, energy shortage, and lack of effective regulation still exist [12,13]. In addition to energy transformation and the active promotion of new energy development, energy conservation and emission reduction are also very important to solve energy problems [14,15,16].
Specifically, the construction industry is one of the most energy and carbon-intensive industries, accounting for about 30% to 40% of the global total energy consumption and more than one-third of the global CO2 emissions [16]. China has become the second-largest country in terms of building energy consumption. With the urbanization in China in recent years, total building energy consumption keeps increasing. As demonstrated in Guo et al. [17], building energy consumption in China has grown continually from 2001 to 2014. By the end of 2015, China’s overall floorage had exceeded 60 billion square meters. According to the new Urbanization Plan (2014–2020), China’s overall floorage will exceed 70 billion square meters by 2030, and the government sector will face a more severe situation regarding energy conservation and emission reduction [18,19].
To achieve the goal of energy conservation and emission reduction in the building sector, it is necessary to have an accurate baseline evaluation of building energy consumption, and a clear goal of building energy consumption control. Evaluation and accurate data of building energy consumption are also essential to provide a benchmark for policy-making of the construction sector, which can serve as an important reference for evaluating the measures of energy conservation and emission reduction.
In previous literature, several energy conversion methods have been designed with changes in statistical range to calculate building energy consumption [20,21]. This microscopic view provides detailed data for the energy consumption planning of a specific building. However, building energy consumption is inseparable from other industries as all industries cannot exist independently of buildings. The heterogeneity of the existing literature hinders the government’s efforts in energy planning and policy assessment from a macrolevel. A more comprehensive perspective should be considered when measuring and evaluating building energy consumption [22]. Some researchers have calculated the energy consumption generated by the whole supply chain of the Chinese construction industry and then determined the energy consumption of the Chinese buildings [23,24]. Therefore, it is worth using the LCA theory from the national level of the supply chain of the construction industry to evaluate the energy consumption of the Chinese buildings.
LCA has been applied to the construction industry for about 10 years [25,26]. As it takes a comprehensive and systematic approach to environmental assessment; LCA methods have been incorporated into the construction industry to select eco-friendly products [27], evaluate performance [1], and optimize construction processes [28]. In the specific LCA steps, a building can be subdivided into the materialization stage, transportation stage, construction stage, operation stage, and demolition stage [28,29,30]. However, most studies focus on civil building and operation energy consumption, few of them cover the construction and demolition stages.
Moreover, there are some studies about the building energy consumption at the national level [6,23]. By tracing sources along the supply chains, Li et al. [6] find that the effects of China’s building construction at the national and global scales are calculated as 55.21% and 5.67% of energy consumption, respectively. Some studies have found that energy consumption in the operation stage of buildings accounts for about 70% of the building’s total energy consumption [23]; however, for the remaining 30%, which also has the potential to be optimized, there is a lack of attention. In other words, the calculation method of building energy consumption is fragmented [31]. Some researchers choose to accept or renounce all of the indexes and calculation methods from industrial enterprises when incorporating them into building energy consumption. Others mainly compute the energy consumption of building materials in the construction field but ignore the building energy consumption of industrial enterprises.
Based on the above discussions, this paper focuses on the following questions: First, how should the Chinese building energy consumption be calculated more comprehensively and accurately? Second, what are the differences among the materialization stage, construction stage, and operation stage of Chinese building energy consumption during recent years? Third, what policies should be kept or strengthened to control building energy consumption effectively?
To answer the aforementioned questions, we consider the building energy consumption within related industries, such as mineral mining, building materials manufacturing, and construction-related transportation, and incorporate them all into the calculation of the materialization, construction, and the operation stages of building energy consumption, based on LCA. A calculation model, which includes the materialization, construction, and the operation stages, is proposed to calculate the total energy consumption in various industries, from the perspective of the whole life cycle.
Based on the new LCA statistics method, several novel findings are obtained, as follows. Our first finding is that Chinese building energy consumption continues to grow. Since 2014, Chinese building energy consumption at each stage has been stable. The growth of total building energy consumption has slowed down, and its share of China’s total energy consumption has leveled off, remaining at about 40%. Second, we find that the materialization and operation stages are the main sources of energy consumption in the whole supply chain. Energy consumption at the materialization stage is affected by energy-saving policy, and has been decreasing year by year since 2014. Third, the energy consumption in the operation and the construction stages has been increasing year by year. In the life cycle of Chinese buildings, energy consumption in the operation stage plays a dominant role.
This paper contributes to the extant studies in the following three aspects. First, we propose a novel calculation model to calculate the total energy consumption of different building stages in various industries from the perspective of the whole life cycle. Second, this paper focuses on building energy consumption within related industries and takes them all into consideration. The related industries include mineral mining, building materials manufacturing, construction-related transportation, construction, and so on. Third, we propose a new LCA statistics method to calculate the energy consumption of the Chinese buildings under the sustainable supply chain system.
Some managerial implications of this paper can be summarized as the following four aspects. First, we need to pay more attention to the recovery and reuse of construction waste and greatly encourage the use of construction waste recycling in prefabricated buildings. Second, it is hopeful to use BIM technology to promote the development of the construction industry and pave the way for energy conservation and emission reduction in the whole life cycle of buildings. Third, the application of hybrid renewable energy systems in ultra-low and near-zero energy consumption buildings should be vigorously promoted. Finally, improving people’s consciousness of energy conservation is one of the most effective ways to reduce energy consumption in the building operation stage.
The remainder of the paper is structured as follows. In Section 2, compared with the existing literature on building energy consumption and life-cycle methods, this paper uses LCA statistics method to measure the building energy consumption, with a comprehensive consideration related to the construction industry. To be more in line with actual practice, the LCA-based evaluation model is constructed in Section 3 to cover the materialization, construction, and operation stages. Results and analysis of Chinese building energy consumption are provided in Section 4. Strategies to reduce energy consumption and carbon emissions are proposed for each stage in Section 5. In Section 6, we provide several theoretical contributions and managerial implications and outline some future research directions.

2. Literature Review

2.1. Scopes and Methods of Building Energy Consumption

There are different explanations of building energy consumption in academic literature, such as materialization, construction, operation, and energy consumption of the whole life cycle of buildings [27]. Generally, construction energy consumption refers to the energy consumption in the construction stage of the building [32], and materialization energy consumption refers to the total energy consumption involved in mining, processing, and manufacturing and transportation from the mining of raw materials to building materials, which are transported to the construction site [33]. Building operation energy consumption refers to the energy consumption in the operation stage [34,35,36]. Some scholars collectively refer to the sum of materialization and construction energy consumption as building energy consumption [37].
In the existing literature, there are many papers about different stages of building energy consumption. The materialization energy consumption of Chinese buildings calculated by Hong et al. [24] includes direct and indirect energy input in the whole supply chain of the construction industry. Zhang et al. [31] estimate the total energy consumption of the materialization, construction, and operation stages. Zhang and Wang [23] divide the building life cycle into three stages, namely, the construction, operation, and disposal stages. Zhang et al. [33] study the energy consumption of the construction stage, and that of the extraction, manufacturing, and transportation of building materials in China. Huo et al. [38] define Chinese building energy consumption as the operation energy consumption of domestic buildings, which excludes construction and industrial buildings. In general, energy consumption in the construction and operation stages is rarely studied by existing works.
Firstly, for the macro data, the basic idea is to separate the energy consumption associated with the building from the statistical data and then add them together [31]. Specifically, Zhang and Wang [23] calculate the direct energy consumption of Chinese buildings at different stages, the indirect energy consumption of electricity and heat, and the energy consumption generated by the supply chain, based on domestic macro statistics. Huo et al. [38] calculate the operation energy consumption of Chinese buildings by cutting the energy balance sheet in the Chinese Energy Statistics Yearbook. Li et al. [6] systematically quantify the embodied energy consumption of case buildings in Beijing based on the multi-scale intensity databases. Secondly, based on the comprehensive energy intensity method, the energy intensity of various buildings is investigated and calculated according to the energy dissipation characteristics and building area [39]. Thirdly, a model-based approach can be used to calculate or simulate energy consumption, and include top-down and bottom-up models based on the different levels of available input data. For instance, based on previous studies, Zhang et al. [33] discuss the energy consumption of the construction industry by adopting the modeling method of energy consumption calculation of extraction, manufacturing, and transportation. Hong et al. [24] calculate the materialization energy consumption of Chinese buildings by combining relevant economic and energy consumption data in the statistical yearbook. Recently, Wenninger et al. [40] put forward a new method, namely the QLattice method, to predict the annual energy consumption of German residential buildings. It should be noticed that the energy consumption of the construction industry has been recorded as energy consumption in the construction stage, without considering the transportation part in the energy statistical yearbook.
Our paper differs from the above papers in the following aspects. First, most of the data used in the previous papers come from the China Energy Statistical Yearbook, but only some parts of the data are selected for one stage. This ignores the potential energy consumption of other related industries. Therefore, we propose a novel calculation model to calculate the total energy consumption of different stages in various industries from the perspective of the whole life cycle. Second, most of existing studies mainly consider the energy consumption of materials or the operation stage of the building, there is little research on the construction stage. Different from the previous studies, this paper focuses on building energy consumption within related industries and takes them all into consideration. The related industries include mineral mining, building materials manufacturing, construction-related transportation, construction, and so on.

2.2. Energy Consumption Analysis Based on the LCA

Life cycle energy consumption of buildings refers to the total energy consumption in the whole life cycle of a building, including energy consumption in building material production, construction, building operation, and building demolition [28,29]. Therefore, life-cycle building energy consumption is more in line with the actual situation.
Many attempts have been made by scholars to evaluate the relationship between materials, components, systems of buildings, and the environment from the LCA perspective. Ramesh et al. [41] conduct a rigorous review of the analysis of building life-cycle energy generated by 73 cases in 13 countries and find that energy consumption in the operation and the materialization stages is the most important in the building life cycle. Hong et al. [42] develop an integrated framework for the embodied energy quantification of Chinese buildings from a multi-regional perspective. In the study of Chen et al. [43], building energy consumption refers to the terminal energy consumption in the transportation, construction, and operation stages of building materials. Motalebi et al. [44] propose a new framework combining mathematical optimization, building information modeling (BIM), and LCA to improve the energy efficiency of existing buildings through the application of energy retrofitting measures.
Three approaches of carrying LCA are mainly used. The first one is the Process-LCA. Based on the process analysis, different subsystems of the study subjects are divided, and the input of energy and resources, the output of emissions in each subsystem, and environmental impact are quantitatively analyzed. Each process is analyzed “from top to bottom” throughout the overall target system [45]. Felmer et al. [46] use LCA to evaluate the carbon footprint of a medium-rise, low-energy residential building in central Chile by using a large amount of wood products. The second approach is the Economic Input-Output based LCA (EIO-LCA), which is a combination of LCA and the input-output analysis method of environmental quantitative assessment, by adding environmental impact factors to the economic input-output model. EIO-LCA is often used to estimate the environmental impact of material manufacturing in infrastructure construction with a national average public data set. Chen et al. [47] use the EIO-LCA approach to quantify the net transfer of energy consumption and identify the transfer of energy consumption pressure in various sectors of economic activities. The third approach is the Hybrid-LCA that synthesizes the process LCA and EIO-LCA method [6,42]. It focuses on the advantages of these two methods together and considers the comprehensiveness, integrity, and particularity of the whole system, making results more reasonable and reliable [48]. The research on building energy consumption with LCA has been mature in the world; however, there are few pieces of research on the application of LCA to building energy consumption in China. The Chinese statistical statement system is also conducive to the study of LCA from a macro perspective.
Different from the previous studies, which rarely discuss the form of mixed existence of building energy consumption with other industries, this paper considers the building energy consumption within related industries, such as the mineral mining, building materials manufacturing, and construction-related transportation, and takes them all into calculation of the materialization, construction, and operation stages of building energy consumption, based on LCA.

2.3. Summary of Literature Review

Section 2.1 and Section 2.2 review and summarize the research on scopes and methods of building energy consumption and energy consumption analysis, based on LCA. We find that there are three deficiencies in existing research. First, the existing literature mainly consider the energy consumption of materials or the operation stages of the building. There is a lack of comprehensive studies about the three-stage framework for the life cycle of buildings (i.e., materialization, construction, and operation stages). Second, most of the aforementioned papers do not take the mixed existence of building energy consumption with other industries into consideration. Third, the previous studies rarely discuss the form of a mixed existence of building energy consumption with other industries.
Table 1 demonstrates a summary of the above-mentioned literature, which is classified based on the scope of building energy consumption, whether the calculation of energy consumption covers other related industries and methods of calculation for building energy consumption. Compared with relevant works, the most important contributions of this paper are in the following four aspects. First, we focus on investigating a new model to calculate the total energy consumption of different building stages. Second, unlike some prior studies assuming that the building energy consumption does not contain other related industries, we investigate building energy consumption from the perspective of the whole life cycle by considering the energy consumption of other related industries. Third, we propose a new LCA statistics method to calculate the energy consumption of Chinese buildings, from the perspective of life cycle assessment under the sustainable supply chain system. These unique features make the present work different from the existing literature.

3. LCA-Based Calculation Model

3.1. Identification and Division

By summarizing the existing studies of LCA, Zhang et al. [31] and Chen et al. [43], the whole life cycle of buildings is divided into three stages: the materialization, construction, and operation stages. The first is the materialization stage, which usually means product life cycle (namely, raw material supply, mining, manufacturing, transportation to the production site, and manufacturing). It is mainly the mining and processing of building materials in the industry, the production energy consumption of component manufacturing, and transportation. The second stage is the construction stage, which mainly refers to the total energy consumption of the construction site for various construction processes, mechanical operation, and related production auxiliary facilities, transportation to the construction site and construction, and energy consumption in the construction process of building demolition and waste transportation. The third stage is the operation stage, which includes the energy consumption involved in the use of the building for maintenance, repair, replacement, heating, ventilation, air conditioning, lighting, household appliances, elevators, cooking, etc.

3.2. Data Collection

As there are many types of direct and indirect energy consumption involved in building energy consumption at the macro level, it is difficult to calculate them under the life cycle of the buildings. In terms of various data sources, the relevant data in the Chinese Statistical Yearbook is comprehensive and easy to access. Therefore, this paper puts forward a calculation method of various related industries based on it.
In the Chinese Statistical Yearbook, the Chinese energy consumption industry is divided into seven categories: (1) agriculture, forestry, animal husbandry, and fishery, (2) industry, (3) construction industry, (4) transportation, warehousing, and postal services, (5) wholesale, retail, accommodation, and catering industries, (6) other industries, and (7) living expenses. The daily operation of these seven industries is closely related to building energy consumption; therefore, it can well reflect the building energy consumption by proper treatment of these data.
The primary data in this paper are obtained from the Chinese Statistical Yearbook, the Chinese Energy Statistical Yearbook, and the Chinese Urban Construction Yearbook. The latest data of the energy part of the three data sources are all from 2018.

3.3. Building Energy Consumption

3.3.1. Building Energy Consumption of the Construction Industry

According to the statistical yearbook, the energy consumption of the construction industry mainly refers to the energy consumption of construction units, construction installation, main projects, temporary projects, affiliated industrial production units, and part of the building operation stage. Here, the energy consumption of each project and the affiliated industrial production unit are counted into the construction stage. Energy consumption of the construction industry in the statistical yearbook is used to represent the energy consumption in the construction stage:
E a = E 1
where E a is building energy consumption of the construction industry and E 1 is total energy consumption of the construction industry.

3.3.2. Building Energy Consumption of the Engineering Industry

Energy consumption of the industrial industry mainly includes building energy consumption in the materialization and the operation stage. It includes all kinds of energy consumption used by industrial enterprises for production and non-production, no matter whether the energy products are used as fuel or as raw materials. It can be divided into three parts: (1) energy consumption of mining of building and raw materials, processing of building materials, production of machinery, (2) energy use of ancillary production departments that serve the main production system, and (3) energy consumption of non-productive sectors of industry, such as affiliated research institutes, schools, hospitals, canteens, nurseries, and construction teams.
The above energy consumption should be included in the measurement model. However, in the existing available statistics, only the final energy consumption were counted due to a lack of detailed statistical data. In this paper, building energy consumption of the industrial part is stated as follows:
E b = ( E 211 + E 223 ) X + ( E 212 + E 224 ) Y + ( E 213 + E 222 ) Z
where
  • E b : energy consumption of industrial buildings,
  • E 211 denotes total energy consumption of the ferrous metal mining industry,
  • E 212 represents total energy consumption of the non-ferrous metal mining industry,
  • E 213 denotes total energy consumption of the non-metallic ore mining industry,
  • E 222 captures total energy consumption of the non-metallic mineral manufacturing industry,
  • E 223 represents total energy consumption of the metal smelting and rolling processing industries,
  • E 224 stands for total energy consumption of the non-ferrous metal smelting and rolling processing industries, and
  • X , Y , Z represent the ferrous/non-ferrous/non-metallic industries related to the ratio of building consumption. The detailed values of X , Y , and Z over the years are summarized in Table 2.

3.3.3. Building Energy Consumption of the Transportation and Storage Industry

In the statistical yearbook, energy consumption is counted by type. In this paper, building energy consumption of the transportation and storage industry refers to the energy consumption of business premises, warehouses, and affiliated units of transportation enterprises. On the one hand, coal consumption in transportation and warehousing is mainly used for the heating of related buildings. Therefore, the energy consumption of transportation and warehousing should be classified as building energy consumption. On the other hand, electricity consumption in transportation and warehousing is concentrated in three areas: railways, pipeline transportation, and urban public transportation. In addition to these three electricity consumptions, the rest of the consumption can be designated as building electricity consumption. Hence, the building energy consumption of the transportation and storage industry can be described as the following:
E c = E 31 α 1 + E 32 M α 2
where
  • E c represents building energy consumption of transportation and storage,
  • E 31 denotes coal consumption of transportation and storage,
  • E 32 captures electricity consumption of transportation and storage, and
  • M stands for building electricity consumption of transportation and warehousing. This paper takes 40% [38].
  • α 1 denotes coal conversion coefficient and standard coal coefficient of raw coal. It is 0.7143 million tons of standard coal/ton (China Energy Statistics Yearbook).
  • α 2 denotes electric power conversion coefficient, and the conversion coefficient of thermal power generation is 122.9 million tons/100 million kWh (China Energy Statistics Yearbook).

3.3.4. Building Energy Consumption in Wholesale, Retail, Accommodation, and Catering Industries

Energy consumption of wholesale, retail, accommodation, and catering industries includes building, transportation, and electrical energy consumption. Here, transportation energy consumption should be deducted when calculating building energy consumption in these industries:
E d = E 4 E 41
E 41 = E 411 × 95 % × α 3 + E 412 × 35 % × α 4  
where
  • E d represents building energy consumption in the wholesale, retail, accommodation, and catering industries,
  • E 4 captures total energy consumption of the wholesale, retail, accommodation, and catering industries,
  • E 41 denotes transportation energy consumption in the wholesale, retail, accommodation, and catering industries;
  • E 411 represents gasoline consumption in the wholesale, retail, accommodation, and catering industries;
  • E 412 stands for diesel consumption in the wholesale, retail, accommodation, and catering industries;
  • α 3 is the standard coal coefficient of gasoline, which is 14,714 tons of standard coal/ton (China Energy Statistics Yearbook), and
  • α 4 is the standard coal coefficient of diesel oil, which is 144.571 million tons of standard coal/10 thousand tons (China Energy Statistics Yearbook).

3.3.5. Building Energy Consumption in Other Related Industries

Energy consumption of other related industries is also mainly concentrated in building, transport, and electrical energy consumption. As electricity energy consumption is often difficult to divide from building energy consumption, especially in the case of such a wide range of industries, electric energy consumption is included in building energy consumption in the calculation method:
E e = E 5 E 51
E 51 = E 511 × 95 % × α 3 + E 512 × 35 % × α 4
where
  • E e represents other industries related to building energy consumption,
  • E 5 stands for the total energy consumption of other industries,
  • E 51 denotes the transportation energy consumption in other industries,
  • E 511 represents the amount of gasoline consumed by other industries, and
  • E 512 denotes diesel consumption in other industries.

3.3.6. Building Energy Consumption of Residential Consumption Part

In the statistical yearbook, domestic energy consumption is composed of coal, coke, gasoline, kerosene, diesel, natural gas, and electricity, among which gasoline and diesel are mainly used for transportation. Therefore, except for those usages of transportation, the energy consumption of daily life can be counted as building energy consumption:
E f = E 6 E 61 α 3 E 62 × 95 % × α 4
where
  • E f represents the building energy consumption contained in living consumption,
  • E 6 denotes the total consumption of domestic energy,
  • E 61 captures the gasoline consumption in daily consumption, and
  • E 62 denotes the consumption of diesel in daily consumption.

3.3.7. The Heating Energy Consumption

Heating energy consumption mainly refers to the urban central heating data in the China Urban Construction Yearbook:
E g = ( E 71 + E 72 ) α 5
where
  • E g represents the building energy consumption of heating,
  • E 71 denotes total steam heating,
  • E 72 denotes total hot water heating, and
  • α 5 is the thermal standard coal coefficient, which is 0.03412 million tons of standard coal/10,000 (China Energy Statistical Yearbook).

3.3.8. Building Energy Consumption Calculation Model

Based on the above calculation equations of building energy consumption in various industries, the calculation model of building energy consumption can be stated by stages, as follows:
E y = E c + E d + E e + E f + E g
E z = E a + E b + E c + E d + E e + E f + E g
where E y is building energy consumption in the operation stage and E z is building energy consumption.

4. Results and Analysis

The conversion coefficient of standard coal for energy used in this paper is from the Chinese Energy Statistics Yearbook. The public data of the Chinese Energy Statistical Yearbook is dealt with by the thermal power plant equivalent method. Therefore, the coal-fired power plant equivalent method is adopted in this study as a method of converting electric power into the standard coal equivalent. Table 3 displays the estimated results of building energy consumption in China from 2000 to 2018.

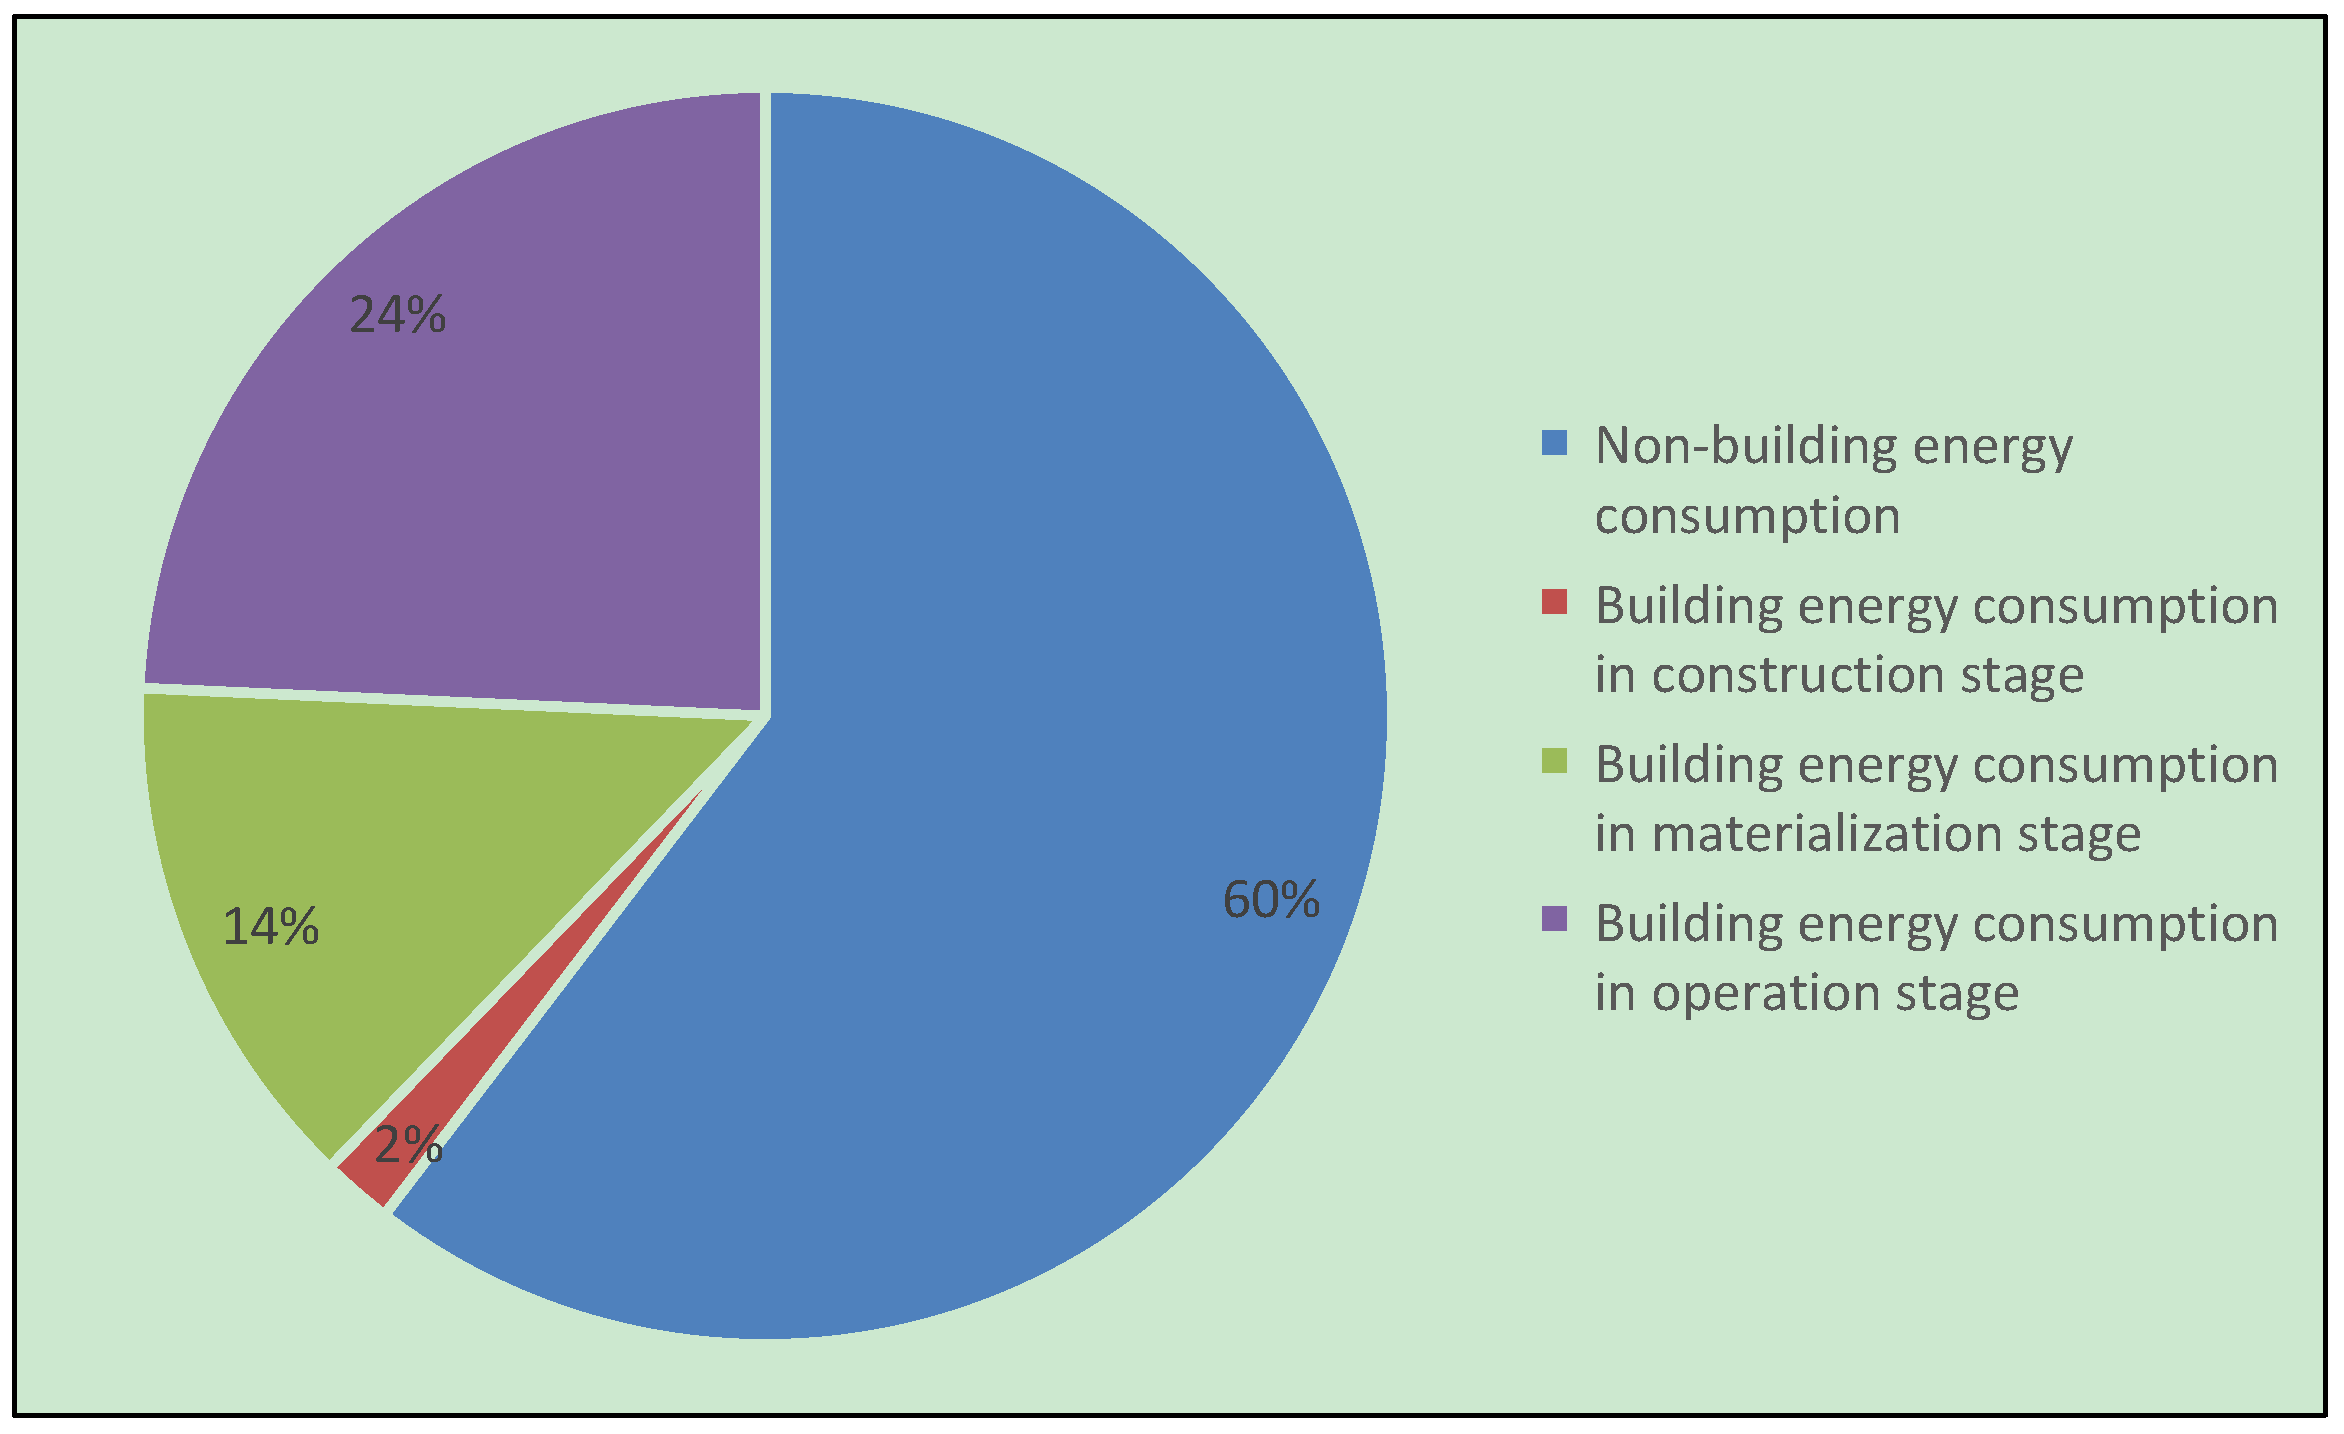
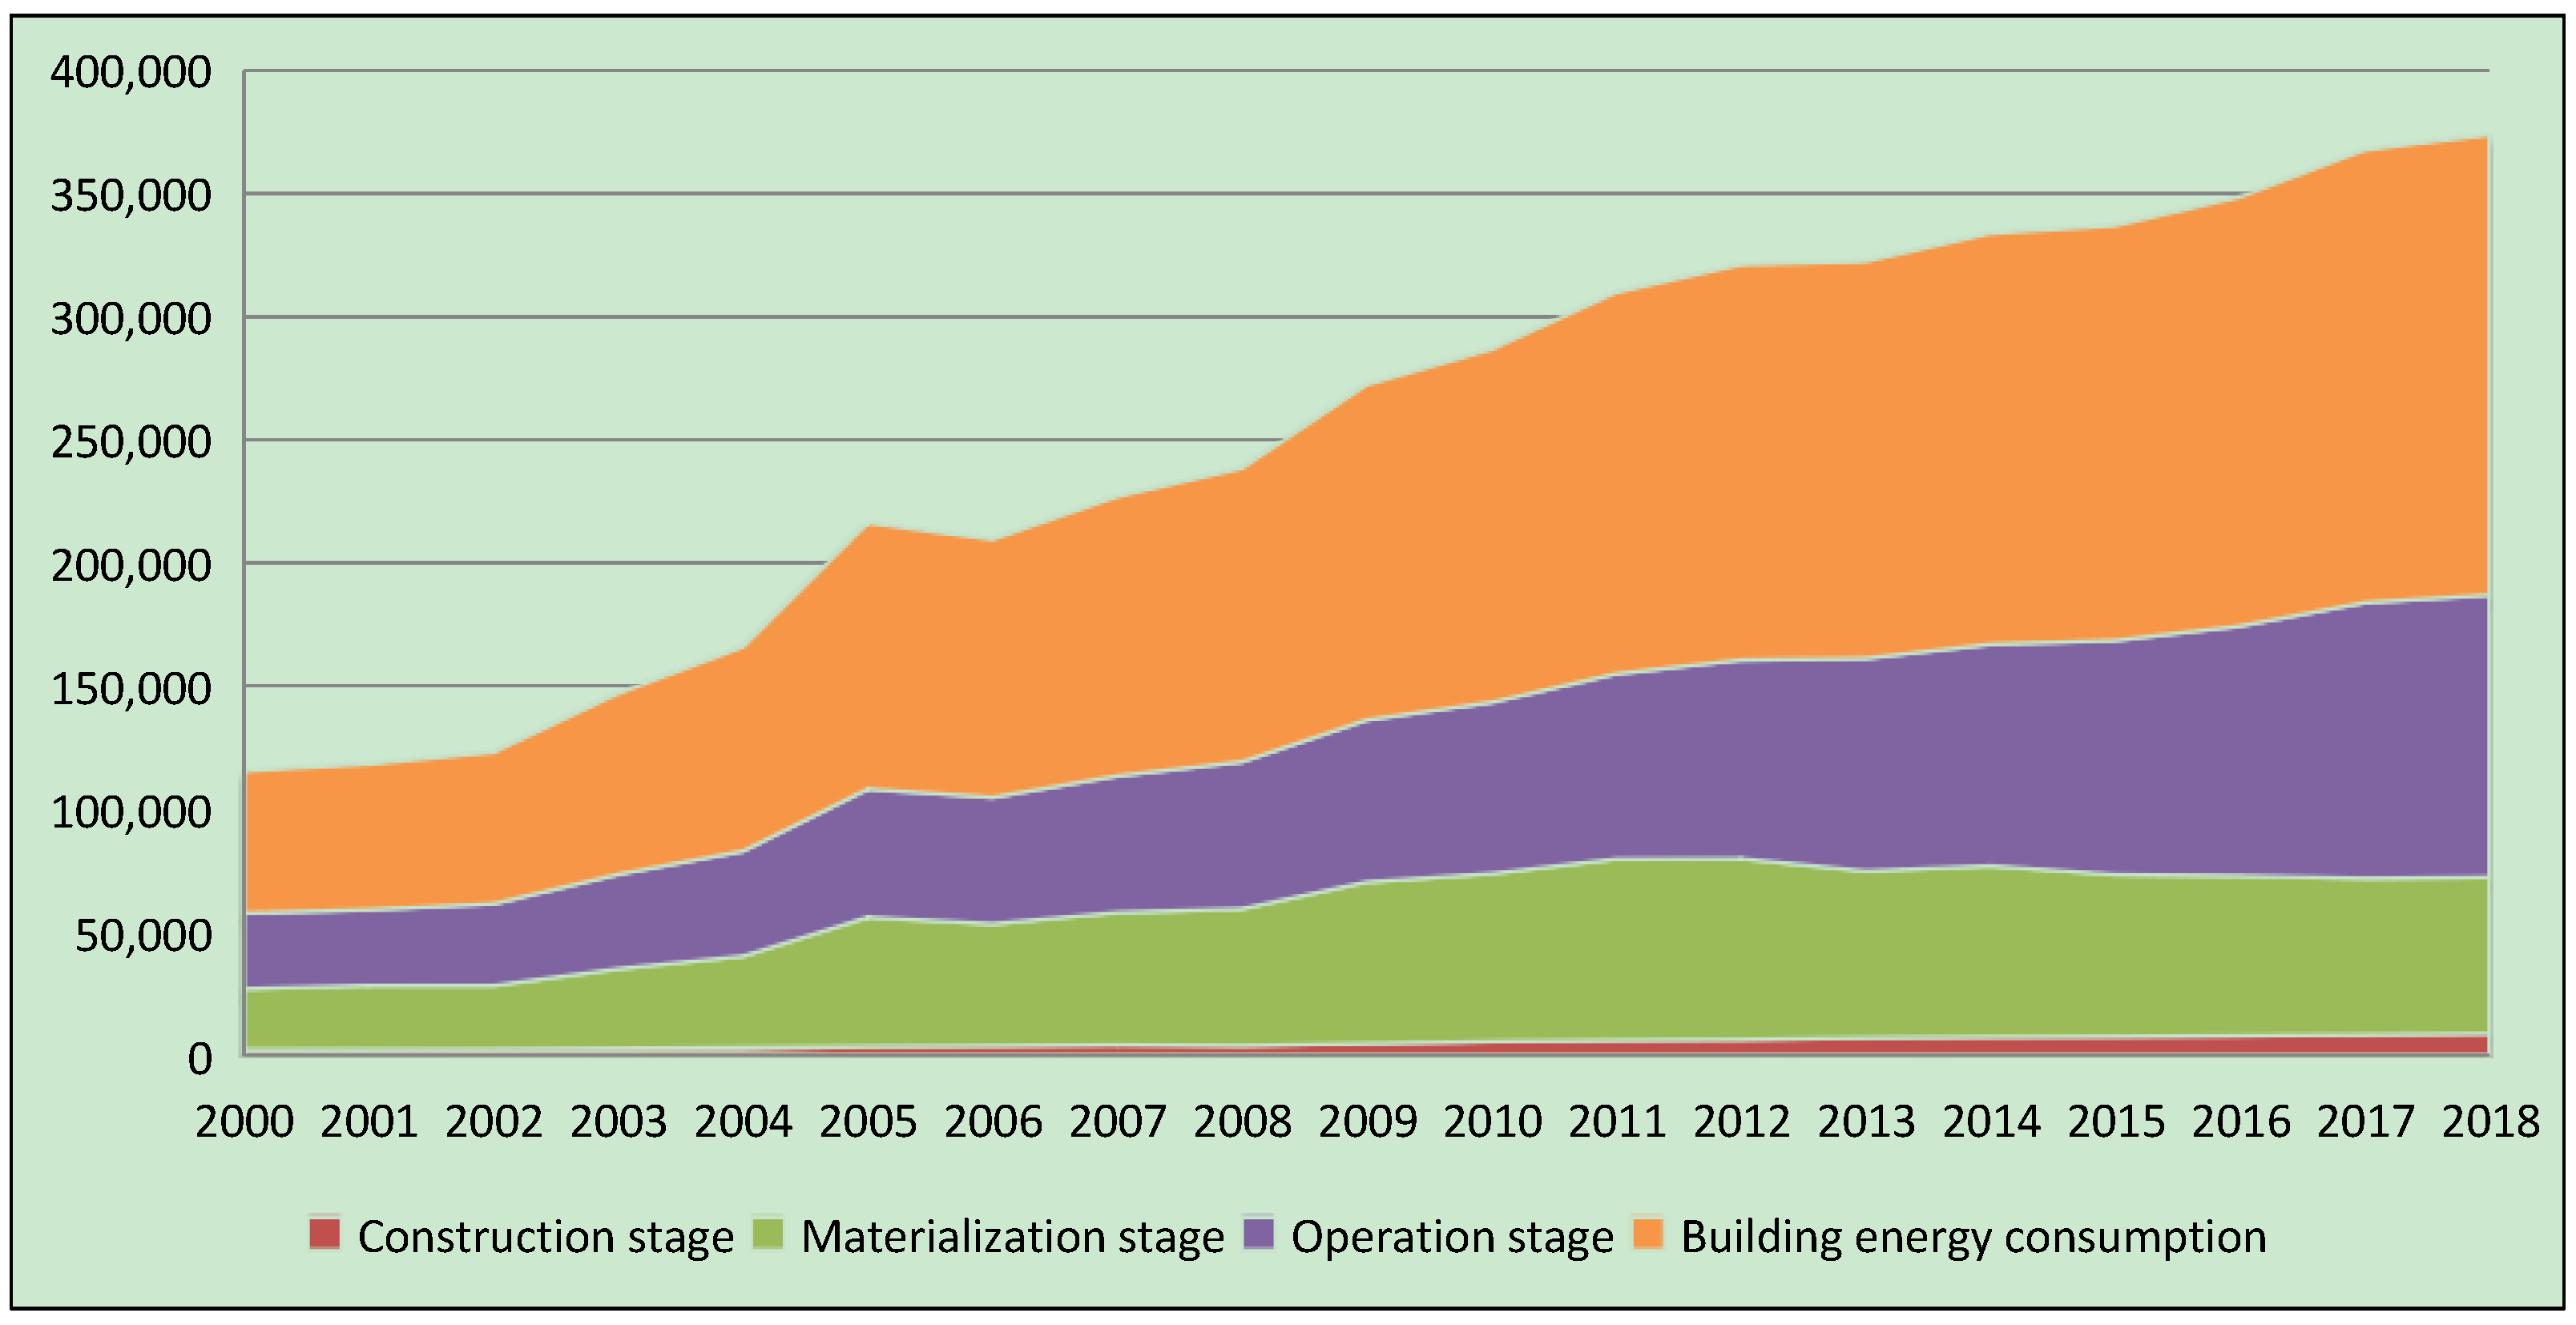
4.1. Current Situation of Building Energy Consumption in China

The Chinese building energy consumptions of the materialization, construction, and the operation stages in 2018 are provided in Figure 1. In 2018, the Chinese building energy consumption is about 1.869 billion tce, accounting for 40% of the total energy consumption. Energy consumption in the materialization stage is about 635.77 million tce, accounting for about 34.02% of building total energy consumption. Energy consumption in the construction stage is about 86.85 million tce, accounting for about 4.65% of total building energy consumption. Energy consumption in the operation stage is about 1146.37 million tce, accounting for 61.34% of the total building energy consumption.
From 2000 to 2018, the Chinese total building energy consumption keeps growing (see Figure 2). The total energy consumption of buildings has increased by 3.24 times, from 577 million tce in 2000 to 1.869 billion tce in 2018, with an average annual growth rate of 6.38%. Since 2014, its growth rate has slowed down to 2.29% annually, which is 26 million tce coal per year.
From 2000 to 2009, building energy consumption accounted for about 36% to 41% total energy consumption. In 2005 and 2009, the proportion of building energy consumption increased significantly, reaching 41%. From 2010 to 2018, the proportion of building energy consumption remained between 39% and 40% of total Chinese energy consumption. In general, the proportion of building energy consumption in total energy consumption fluctuated slightly between 36% and 41% from 2000 to 2009, and then tended to be stable around 39% and 40% from 2010 to 2018.
From 2000 to 2018, the average proportion of the materialization, construction, and operation stages in total building energy consumption is 4.02%, 42.77%, and 53.20%, respectively. Furthermore, the annual growth rates of building energy consumption in the materialization, construction, and operation stages are 5.09%, 7.48%, and 7.17%, respectively. Although building energy consumption of the construction stage accounts for about 4% of the building energy consumption, its annual growth rate is the highest in those 19 years. Therefore, building energy consumption in the construction stage should be also paid attention to, to control its growth.

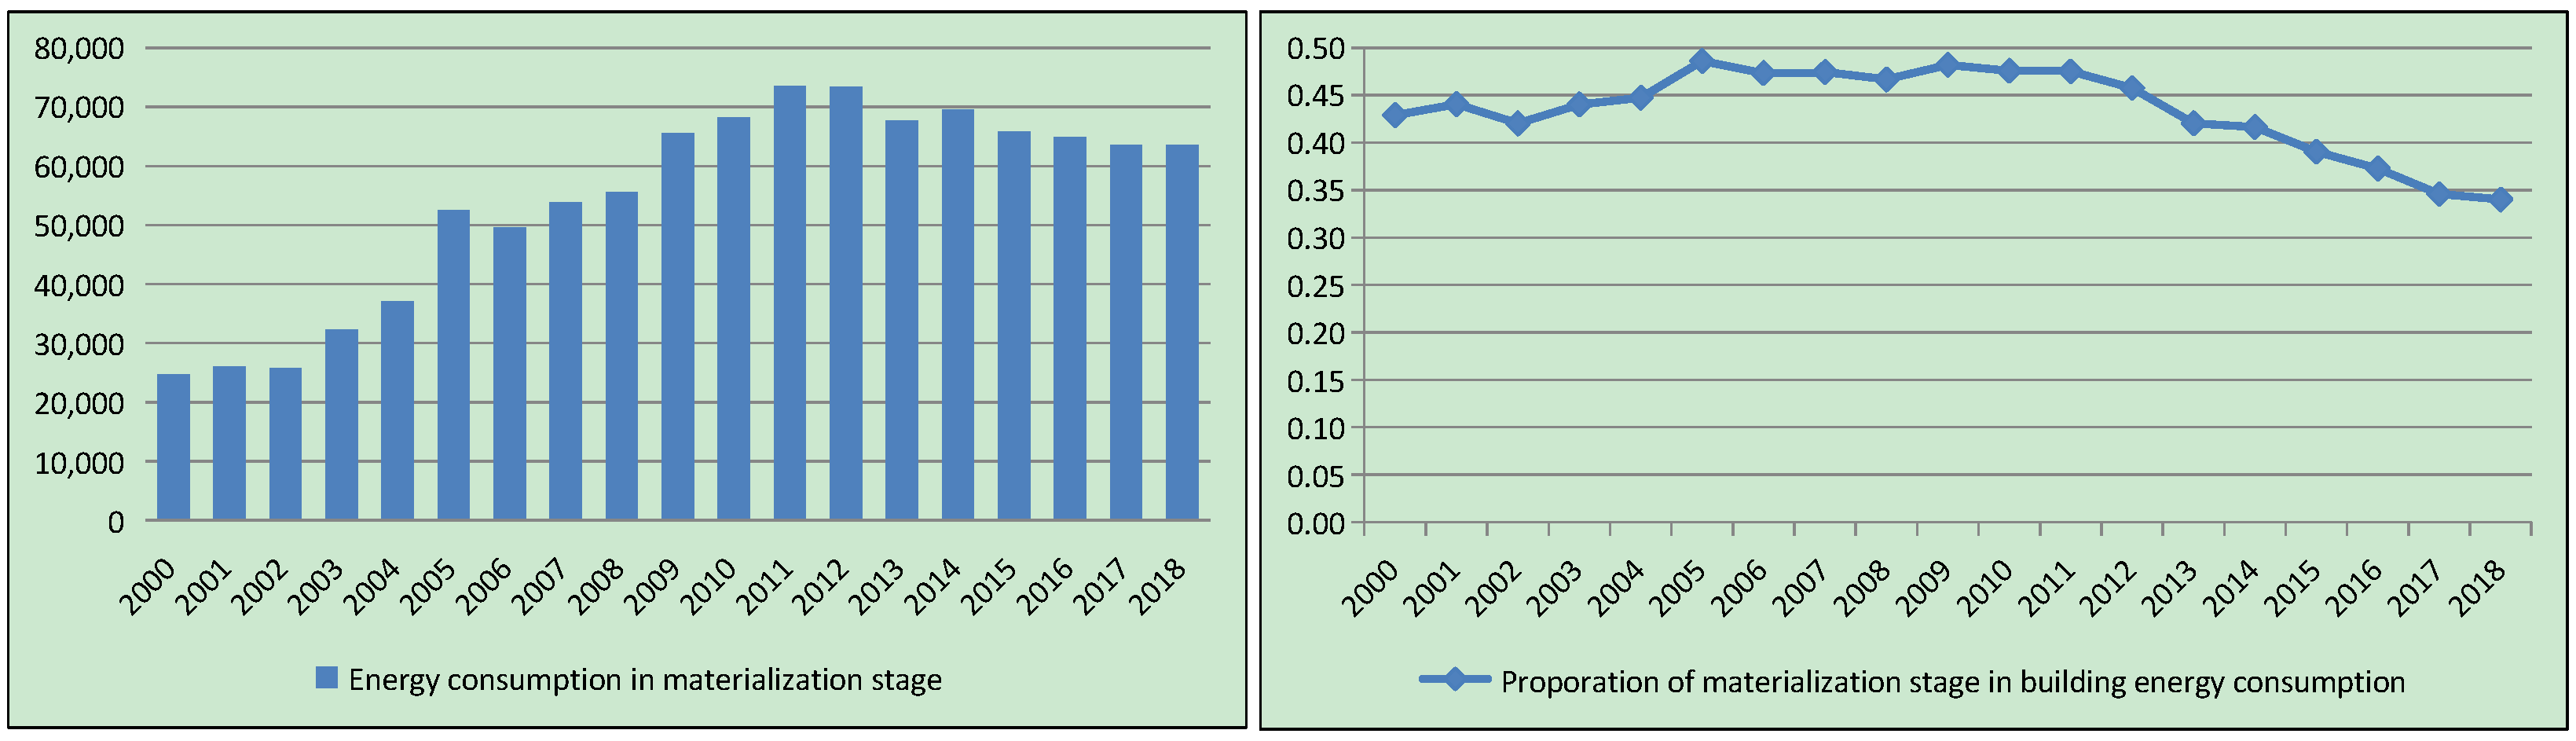
4.2. Energy Consumption in the Materialization Stage

From 2000 to 2012, the Chinese building energy consumption in the materialization stage kept increasing, from 247.4 million tons of standard coal in 2000 to 734.5 million tce in 2012, an increase of 2.97 times, with an average annual growth rate of 8.73% (see Figure 3). Meanwhile, the energy consumption of the materialization stage has decreased from 695 million to 635.8 million tce per year since 2014, with a decrease of 11.84 million tce per year. During these 19 years, energy consumption in the materialization stage has been maintained within the range of 39.90% to 48.06% of total building energy consumption.
It is worth noticing that, since its peak in 2012 and 2014, energy consumption in the materialization stage as well as its proportion in building energy consumption have continued to decline speedily. This proves that the energy policy implemented in 2012 and 2014 has provided great help to energy conservation and emission reduction in the materialization stage of buildings. Some instructive policies related to the building industries are listed in the next section of strategies.

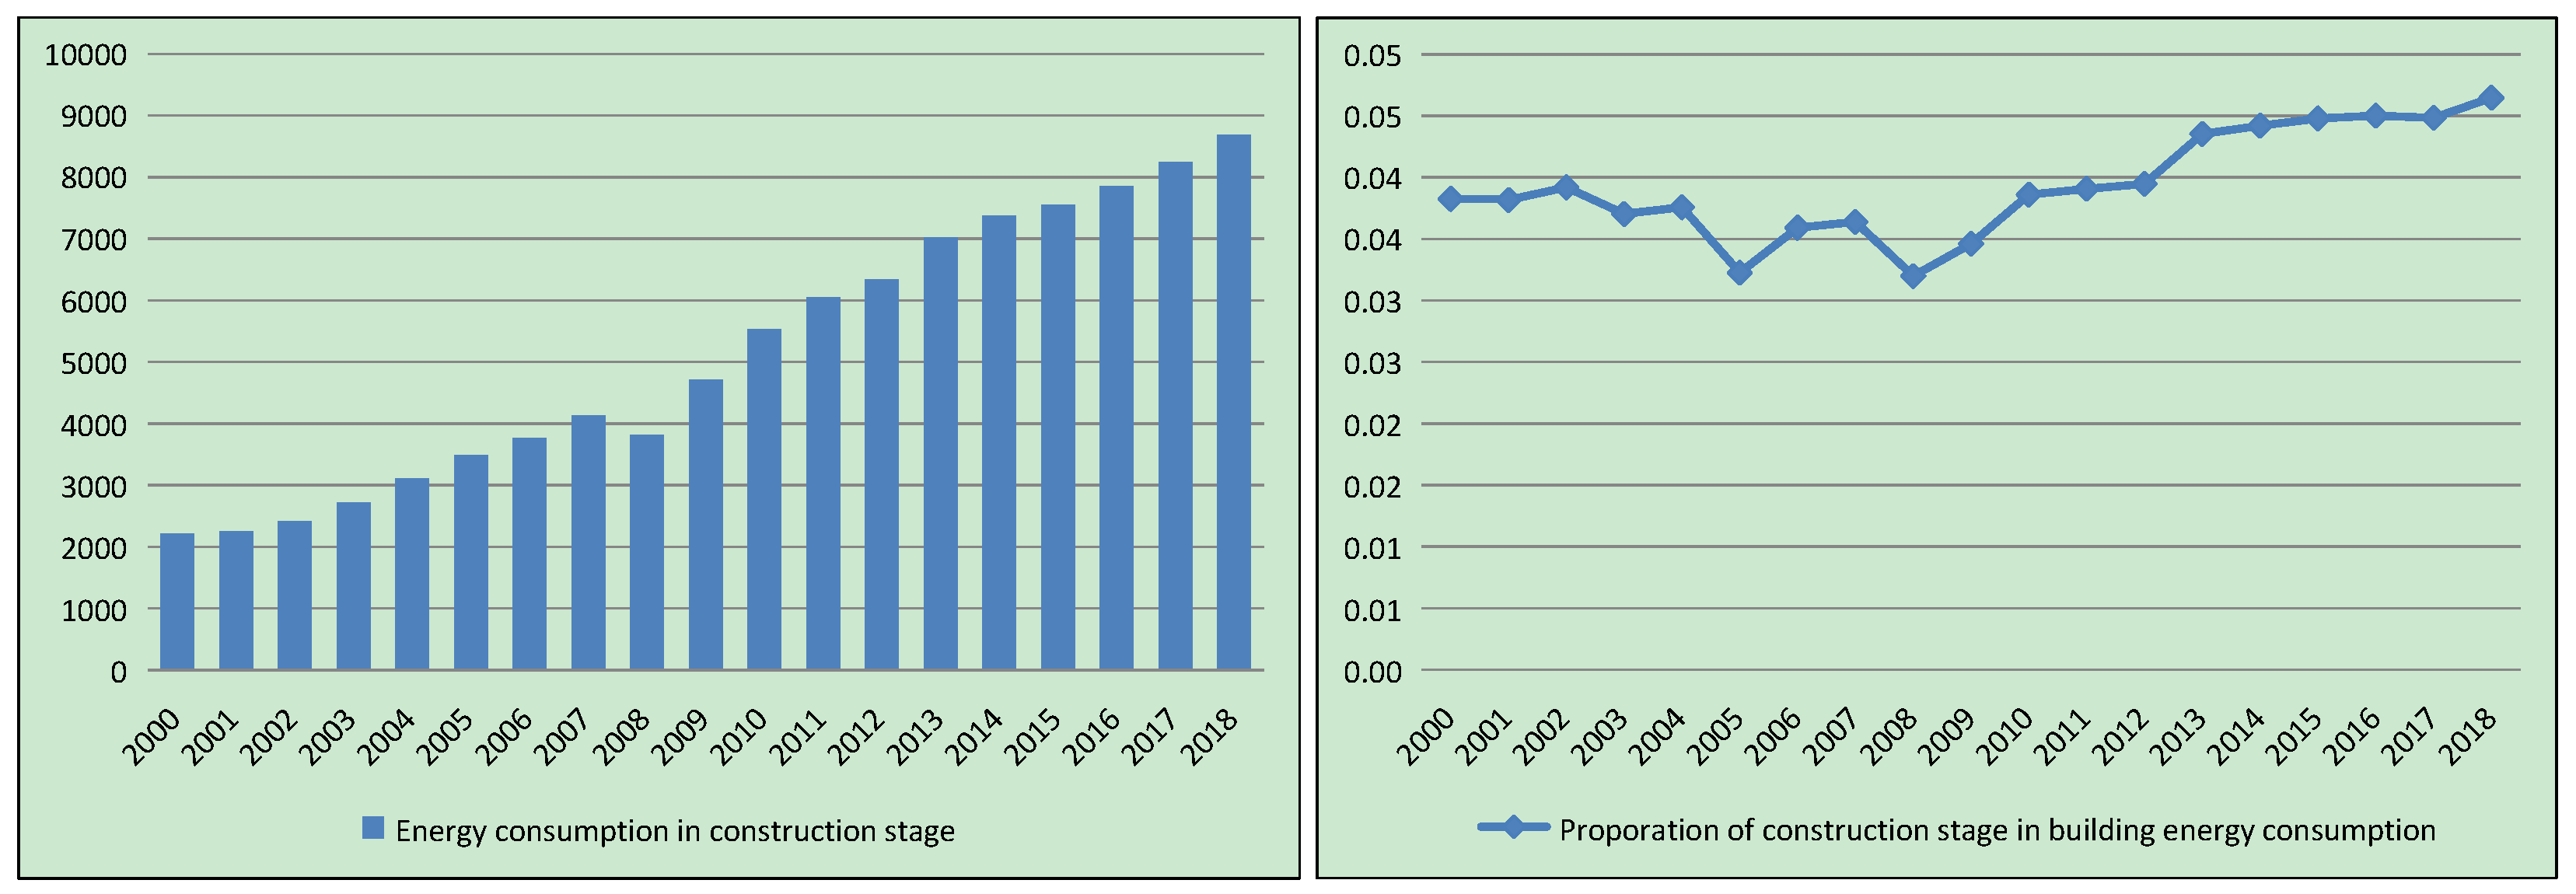
4.3. Energy Consumption in the Construction Stage

From 2000 to 2018, total Chinese building energy consumption in the construction stage continued to grow by four times, from 0.2 billion tons of standard coal in 2000 to 0.8 billion tce in 2018, with an increase about 0.03 billion tons of standard coal per year (see Figure 4). From 2000 to 2008, the energy consumption of the construction stage accounted for 1.19–1.48% of the total national energy consumption, and 3.40–4.34% of the total building energy consumption, illustrating a decreasing trend. On the other hand, from 2009 to 2018, the energy consumption of the construction stage accounted for 1.36% to 1.91% of national total energy consumption, and 3.80% to 4.71% of building energy consumption, indicating an increasing trend; therefore, its proportion in the total building energy consumption increases by 1.14% per year from 2000 to 2018.
Although energy consumption in the construction stage is relatively low, accounting for a relatively low proportion of total building energy consumption, it has been growing at a stable level, which is 7.48% annually. Energy consumption in the construction stage is greatly related to the national construction scale; therefore, its growth may be related to the rapid development of urbanization in China. Energy consumption of the construction stage is less affected by the outside world but is mainly related to the construction scale. Therefore, the best way to save energy during the construction stage is to improve construction technology and strengthen construction management.

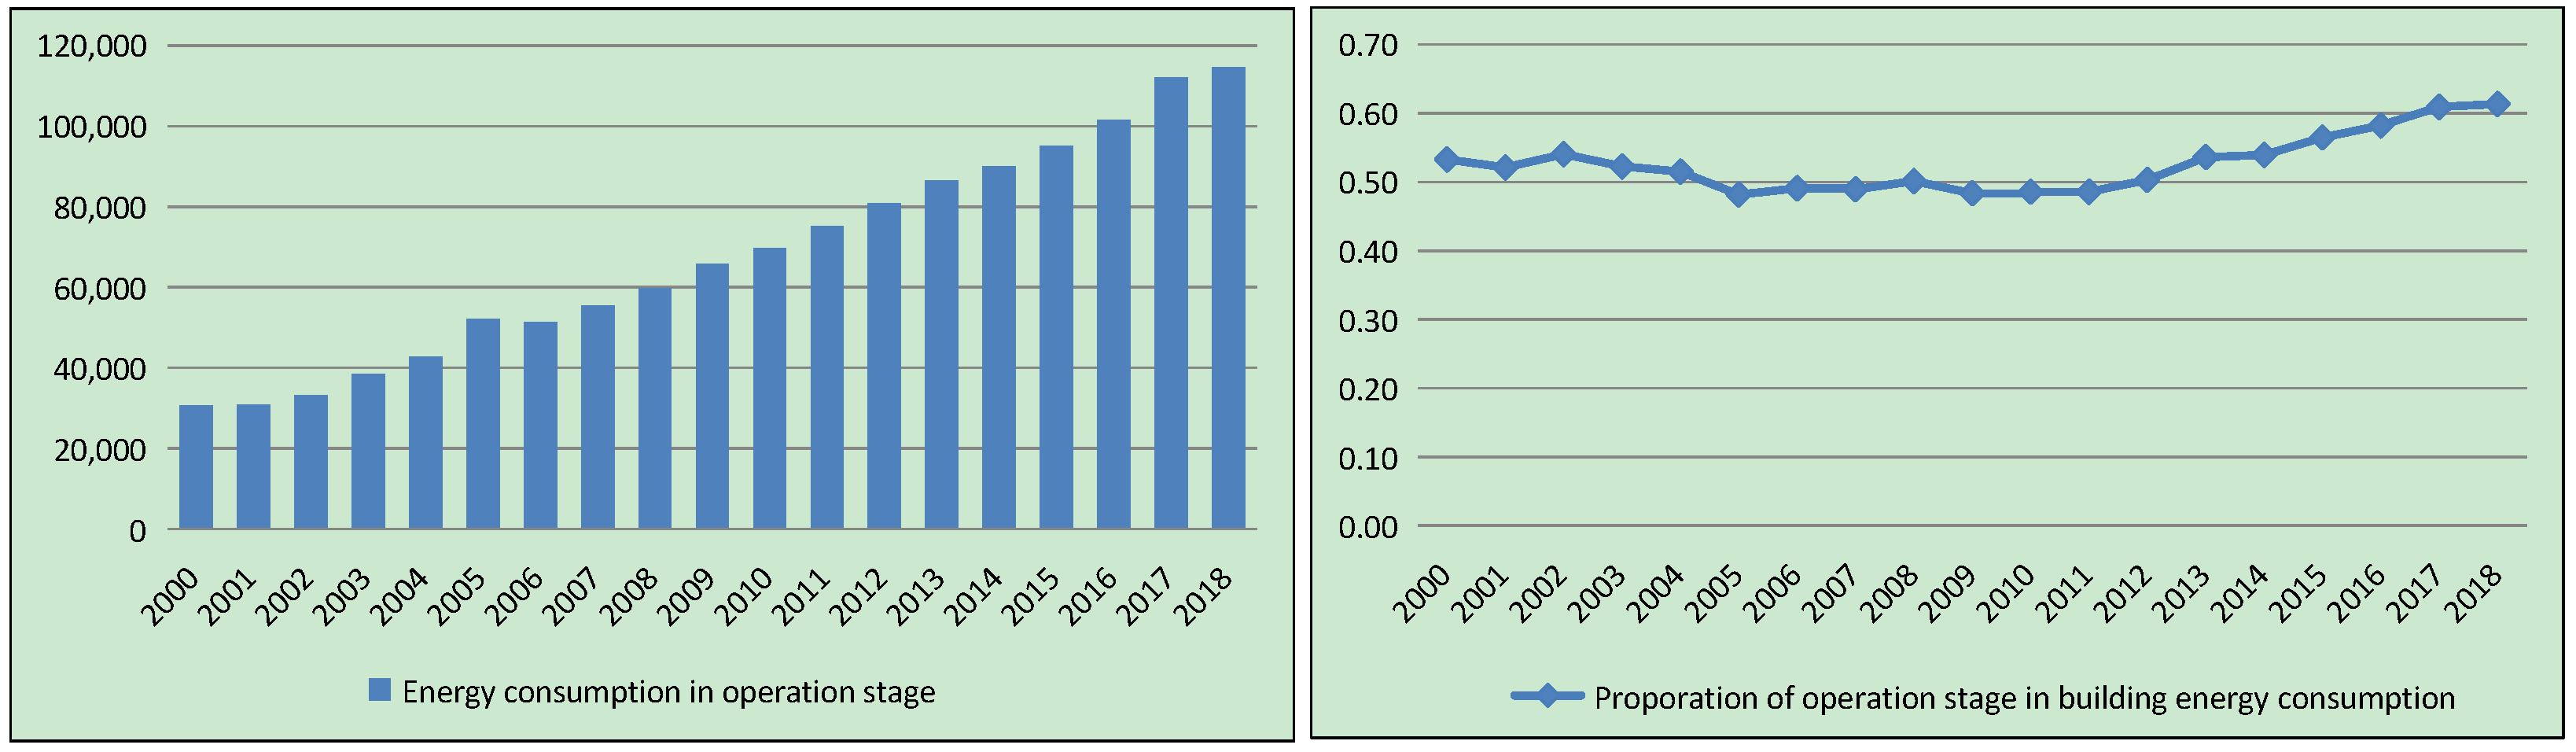
4.4. Energy Consumption in the Operation Stage

From 2000 to 2018, the Chinese building energy consumption in the operation stage continued to increase from 307.3 million tons to 1146.36 million tons of standard coal. Building energy consumption has increased by 3.73 times, with an average annual growth rate of 7.17% (see Figure 5). From 2000 to 2011, the proportion of energy consumption of the building operation stage in building energy consumption fluctuated between 48.17% and 54.05%. Then, from 2011 to 2018, the proportion of building energy consumption of the operation stage in building energy consumption displayed an increasing trend, which increased significantly from 48.57% to 61.33%, with an annual growth rate of 3.29%, or an increase about 49.25 million tons of standard coal per year.
Therefore, the change in building energy consumption is mainly caused by the energy consumption of the operation stage in recent years. The reduction of building energy consumption should start by restraining energy consumption in the operation stage.

5. Optimization Strategies

5.1. Optimization Strategies for the Materialization Stage

From the above analysis, energy consumption in the materialization stage demonstrates a downward trend while the energy consumption in other stages continues to increase, which proves that the production efficiency of building materials in China has been improving in recent years. This is owed to the Chinese government’s adoption of many powerful command-controlled supervision measures during 2013 and 2014. For example, in the middle of 2013, the Chinese government implemented ten air pollution-related measures, including the implementation of a new mechanism of energy conservation and emission reductions, the strict control of newly increased energy consumption in high energy consumption industries, and so on [49]. Then, the Chinese government carried out the “2014–2015 action plan for energy conservation, emission reduction, and low carbon development”. The plans are listed as follows:
(1)
Industrial restructuring. Backward capacity should be eliminated, especially in the industries of iron making, steel making, cement (clinker and grinding), and flat glass.
(2)
Transformation and innovation of energy-saving technology. Energy-saving technologies, such as waste heat and pressure utilization, energy system optimization, and energy saving of motor systems, should be applied to reconstruct engineering equipment.
(3)
Industrial energy saving. Energy efficiency benchmarking should be fully implemented in key energy-consuming industries, such as building materials, steel, electricity, and transportation. Energy management and control centers of industrial enterprises should also be established.
(4)
Prefabricated industries should be supported to promote the modernization of the construction industry. Equivalent replacement or decrement replacement of energy consumption should be applied to the new capacity of the steel and building material industries.
However, there is still a gap between Chinese production efficiency and the international level. The extractive industry of raw materials and building materials manufacturing industry should continue to promote technological reform, develop new technology, and improve production efficiency. Research and development of new building materials should also be continued as the usage of new building materials can effectively save energy consumption.
Attention should also be paid to the recovery and reuse of construction wastes. The reuse of metal, wood, and available wastes can greatly reduce the input of raw materials and reduce energy consumption. At the same time, the amount of recycled steel in demolished buildings will keep increasing, which will have a significant impact on energy use and emissions in the construction sector.

5.2. Optimization Strategies for the Construction Stage

(1)
Project management should be improved to reduce energy consumption. There still exists inefficiency or lack of regulation regarding the management of construction projects in China, resulting in accelerated mechanical aging, material damage, and unnecessary energy consumption. The immaturity of construction technology will not only lead to excessive energy consumption in the construction stage, but also lead to more energy consumption in the later operation stage.
(2)
Selection of suppliers within a short distance between the product inventories and the construction site should be considered to reduce energy consumption in transportation.
(3)
Adoption of green buildings. Full implementation of green building standards should be put into action for public welfare and large public buildings. Project capability and environmental impact assessment systems should be strictly implemented. For those regions that have not finished the energy-saving tasks, their new high energy consumption projects should be canceled or delayed.

5.3. Optimization Strategies for the Operation Stage

Energy consumption in the operation stage is the highest in building energy consumption, accounting for about 60%, and it continues to increase. Therefore, the operation stage is key to energy-saving in building energy consumption. The energy-saving strategy of the operation stage is listed as follows:
(1)
Architectural design determines the energy consumption in the operation stage. Through controllable design, eco-friendly or new energy-saving building materials can be selected for the new buildings, which will be an effective method to reduce the consumption of resources and energy, from the perspective of the life cycle. For existing buildings, reasonable energy-saving renovation should also be carried out.
The technology of building information modelling (BIM) has been considered an ideal digital tool to function as the data repository of all information relating to the building lifecycle [50]. The Ministry of Housing and Urban-Rural Development issued the Construction Industry Information Development Outline from 2011 to 2015 in May 2011 and the Architectural Engineering Design Information Model Mapping Standard in 2019, aiming to strengthen the management of projects and standardize building industry data.
(2)
As energy consumption in the operation stage is to meet people’s requirements for normal study, work, and life, the most effective way is to strengthen the management of energy conservation, to implement demand-side management mechanisms of power, and to enhance people’s awareness of energy saving. Electricity and heat take most of the consumption energy in the building operation stage. For instance, reducing the usage of air conditioning is one of the most effective ways to save energy.
(3)
As coal is still the main energy source of power and heat, the energy consumption structure should be adjusted to reduce inefficient and carbon-intensive coal use in electric power and thermal power enterprises. Meanwhile, strategies of energy efficiency are essential in energy policy, which could be created using the various approaches employed for energy savings in buildings [51]. The supply of non-fossil fuels and natural gas should be increased in residents’ life or for the replacement of coal, with a strict replacement policy of equal or reduced coal consumption. Using the potentiality of electric vehicles toward the achievement of the zero-energy target extended to a buildings cluster level is also a measure to reduce coal burning, by exploiting renewable generation on and off-site [52].
(4)
The government can give publicity to the catalog of energy-efficient air conditioners, refrigerators, and other products. They can also make policies to guide the production, purchase, and use of energy-efficient products.

6. Conclusions and Management Insights

6.1. Conclusions

This paper proposes a new statistical method of LCA, based on the Chinese Statistical Yearbook and analysis of Chinese building energy consumption with related industries from 2000 to 2018. The whole life cycle of buildings is divided into three stages: the materialization, construction, and operation stages. Different from other LCA methods, we consider the form of building energy consumption mixed with other industries. Our findings could be summarized as the following four aspects.
Firstly, this study demonstrates that the growth rate of Chinese building energy consumption has slowed down gently and its share in the Chinese total energy consumption is about 40%. This point is different form Zhang et al. [31], which obtained the conclusion that building energy accounted for about 43% of China’s total energy consumption for 2011–2013. With our calculation method, building energy consumption takes about 39.53% of China’s total energy consumption for 2011–2013, and this proportion decreased slightly to 39.43% in the recent five years (2014–2018). Therefore, we come to the conclusion that the share of building energy consumption in China’s total energy consumption is nearly 40% for 2011–2018.
Secondly, with our proposed calculation method, which takes into account the building energy consumption in other related industries, Chinese building energy consumption increased with an annual rate of about 7.62% from 2001 to 2013. Comparing with Zhang et al. [31], which states that China’s building energy consumption has increased about 7% annually since 2001 to 2013, the growth rate of China’s building energy consumption obtained in our paper is higher than that in Zhang et al. [31]. Furthermore, we also calculate China’s building energy consumption from 2013 to 2018. We find that the annual growth rate of China’s building energy consumption is about 2.50% since 2013 to 2018. Compared with the growth rate from 2000 to 2013, the growth rate of China’s building energy consumption has slowed down over 60%.
Thirdly, this paper discusses the differences among the different stages of building energy consumption. From 2000 to 2018, the stages of materialization, construction, and operation account for about 42.77%, 4.02%, and 53.20%, respectively, of total building energy consumption. Therefore, the materialization and operation stages are the main sources of building energy consumption. In these 19 years, the annual growth rates of building energy consumption in the materialization, construction, and operation stages are 5.09%, 7.48%, and 7.17%, respectively.
Lastly, another new discovery is that the growth of building energy consumption in recent years is mainly caused by the energy consumption of the operation stage. Energy consumption of the materialization stage has decreased, with 11.84 million tons of standard coal per year since 2014. On the contrary, energy consumption in the operation stage has increased, with 49.25 million tce per year, or with an annual growth rate of 5.40% of total building energy consumption from 2011 to 2018. Therefore, the variance of building energy consumption in 2014 to 2018 is mainly caused by the energy consumption in the operation stage. Controlling the growth of building energy consumption in the operation stage is more essential to energy conservation in the future.

6.2. Management Insights

Some managerial insights to control the building energy consumption are summarized as five aspects: policy orientation in China, how to recover and reuse construction wastes in the physicochemical stage, application of BIM to improve the informatization of the construction industry, emphasizing the application of renewable energy and energy conservation of the operation stage.
(1)
This paper helps with the understanding of Chinese building energy consumption in 2000–2018. Nowadays, China is more eager than ever to save energy and reduce carbon emissions. During 2020 to 2021, the Chinese government has emphasized many times their determination to make efforts to save energy and reduce carbon emissions in international conferences. In 2021, they have put forward their 14th Five-Year Plan, which clearly demonstrates control of the growth of coal consumption. By 2030, China’s civil construction area will exceed 70 billion square meters, their building industry will face a more severe situation of energy conservation. As building energy consumption still takes nearly 40% of their total energy consumption in recent years, the task of energy conservation in the building industry is quite urgent. In this case, the supervision intensity of the building industry has been enhanced. This forces building enterprises to put more attention into energy saving strategies.
(2)
Attention should be paid to the recovery and reuse of construction wastes. The reuse of metal, wood, and available wastes can greatly reduce the input of raw materials and reduce energy consumption. The application of construction waste recycling in prefabricated buildings should be encouraged. Certain preferential tax policies could be applied to the projects that use construction waste recycling. Additionally, intelligent sorting standards should be developed in order to improve the sorting efficiency of construction waste recycling enterprises.
(3)
A new finding is that although building energy consumption in the construction stage is only a small part of total building energy consumption and is often neglected, its growth is the fastest. Therefore, more attention should be paid to control its growth. Energy consumption in the construction stage is less affected by external factors. Improvement of construction technology, management, and design can be useful in energy-saving in the construction and operation stages. It is promising to use BIM to promote the construction industry, paving the way for energy saving and emission reduction in the whole building life cycle.
(4)
The application of hybrid renewable energy systems in ultra-low energy and near-zero energy buildings should be promoted. For example, the hybrid geothermal-photovoltaic system has been used for heating and cooling. Companies should pay more attention to research and development in this field.
(5)
The operation stage not only takes up most of a building’s energy consumption, it also makes the greatest contribution to the growth of Chinese buildings’ energy consumption from 2000 to 2018. Therefore, it is essential to control building energy consumption in the operation stage. Except for the design and application of new eco-friendly technology, an effective way to reduce building energy consumption in the operation stage may be to enhance people’s awareness of energy conservation in their daily life.

6.3. Future Research Directions

There also exist some limitations of this study. First, the calculation method of building energy consumption in this paper is proposed based on the present situation, that there is a lack of well-directed and detailed statistical data on Chinese building energy consumption. Therefore, the first limitation is that the proposed method is more suitable for the macro analysis of building energy consumption. Second, the statistical range of energy of different industries is complex and hard to divide precisely [53]. Therefore, energy consumption in the building operation stage in the construction industry is divided roughly in this paper, which needs to be further studied. Third, there is a great difference in climate, geographical location, and economics among different provinces or regions. The building energy consumption of different Chinese regions such as urban areas is not discussed in this paper. Therefore, the building energy consumption of different provinces [17,49,54] also needs to be investigated in further studies. Last but not least, a future prediction of expected consumption should be further studied.

Author Contributions

Conceptualization, Q.L.; data curation, Q.L., J.H. and T.N.; formal analysis, J.H. and L.C.; investigation, Q.L., J.H. and T.N.; methodology, Q.L., J.H. and L.C.; resources, Q.L., J.H. and T.N.; software, Q.L., J.H. and L.C.; supervision, Q.L. and T.N.; validation, T.N.; visualization, L.C.; writing—original draft, Q.L., J.H. and L.C.; writing—review & editing, Q.L. and L.C. All authors have read and agreed to the published version of the manuscript.

Funding

This research was funded by the Scientific Research Program of Hubei Provincial Department of Education (Grant No. B2021076, Q20211507), the Internal Science Research Foundation of Wuhan Institute of Technology (Grant Nos. K2021050, K2021049), the National Natural Science Foundation of China (Grant No. 72102171), the Humanities and Social Sciences Youth Foundation, Ministry of Education of the People’s Republic of China (Grant No. 21YJC630006), and the Youth Project of Philosophy and Social Science of Higher Education department of Hubei Province (Grant No. 21Q087).

Institutional Review Board Statement

Not applicable.

Informed Consent Statement

Not applicable.

Data Availability Statement

Not applicable.

Acknowledgments

The authors would like to thank the anonymous referees for their comments and suggestions.

Conflicts of Interest

The authors declare no conflict of interest.

References

  1. Luo, X.; Oyedele, L.; Owolabi, H.; Bilal, M.; Ajayi, A.; Akinade, O. Life cycle assessment approach for renewable multi-energy system: A comprehensive analysis. Energy Convers. Manag. 2020, 224, 113354. [Google Scholar] [CrossRef]
  2. Khan, H.R.; Awan, U.; Zaman, K.; Nassani, A.A.; Haffar, M.; Abro, M.M.Q. Assessing hybrid solar-wind potential for industrial decarbonization strategies: Global shift to green development. Energies 2021, 14, 7620. [Google Scholar] [CrossRef]
  3. Wang, Y.; Wu, T.; Li, H.; Skitmore, M.; Su, B. A statistics-based method to quantify residential energy consumption and stock at the city level in China: The case of the Guangdong-Hong Kong-Macao Greater Bay Area cities. J. Clean. Prod. 2019, 251, 119637. [Google Scholar] [CrossRef]
  4. Ikram, M.; Sroufe, R.; Awan, U.; Abid, N. Enabling progress in developing economies: A novel hybrid decision-making model for green technology planning. Sustainability 2022, 14, 258. [Google Scholar] [CrossRef]
  5. Tabrizikahou, A.; Nowotarski, P. Mitigating the energy consumption and the carbon emission in the building structures by optimization of the construction processes. Energies 2021, 14, 3287. [Google Scholar] [CrossRef]
  6. Li, Y.; Han, M.; Liu, S.; Chen, G. Energy consumption and greenhouse gas emissions by buildings: A multi-scale perspective. Build. Environ. 2019, 151, 240–250. [Google Scholar] [CrossRef]
  7. Wen, Q.; Gu, J.; Hong, J.; Shen, G.; Yuan, M. Unfolding interregional energy flow structure of China’s construction sector based on province-level data. J. Environ. Manag. 2019, 253, 109693. [Google Scholar] [CrossRef]
  8. Chen, L.; Nan, G.; Li, M.; Feng, B.; Liu, Q. Manufacturer’s online selling strategies under spillovers from online to offline sales. J. Oper. Res. Soc. 2022. [Google Scholar] [CrossRef]
  9. Yu, H.; Huang, Z.; Pan, Y.; Long, W. Guidelines for Community Energy Planning; Springer Science and Business Media LLC: Berlin, Germany, 2020. [Google Scholar]
  10. Liu, B.; Wang, D.; Xu, Y.; Liu, C.; Luther, M. Vertical specialisation measurement of energy embodied in international trade of the construction industry. Energy 2018, 165, 689–700. [Google Scholar] [CrossRef]
  11. Zhang, W.; Zhao, Y.; Huang, F.; Zhong, Y.; Zhou, J. Forecasting the energy and economic benefits of photovoltaic technology in China’s rural areas. Sustainability 2021, 13, 8408. [Google Scholar] [CrossRef]
  12. Wei, Y.; Liao, H. Energy Economics: Energy Efficiency in China; Springer Science and Business Media LLC: Berlin, Germany, 2016. [Google Scholar]
  13. Xiao, Q.; Chen, L.; Xie, M.; Wang, C. Optimal contract design in sustainable supply chain: Interactive impacts of fairness concern and overconfidence. J. Oper. Res. Soc. 2021, 72, 1505–1524. [Google Scholar] [CrossRef]
  14. Awan, U.; Khattak, A.; Rabbani, S.; Dhir, A. Buyer-driven knowledge transfer activities to enhance organizational sustainability of suppliers. Sustainability 2020, 12, 2993. [Google Scholar] [CrossRef] [Green Version]
  15. Liu, X.; Chen, X.; Shahrestani, M. Optimization of insulation thickness of external walls of residential buildings in hot summer and cold winter zone of China. Sustainability 2020, 12, 1574. [Google Scholar] [CrossRef] [Green Version]
  16. Li, P.; Rao, C.; Goh, M.; Yang, Z. Pricing strategies and profit coordination under a double echelon green supply chain. J. Clean. Prod. 2021, 278, 123694. [Google Scholar] [CrossRef]
  17. Guo, Y.; Bart, D. Optimization of design parameters for office buildings with climatic adaptability based on energy demand and thermal comfort. Sustainability 2020, 12, 3540. [Google Scholar] [CrossRef]
  18. Marchi, B.; Zanoni, S. Supply chain management for improved energy efficiency: Review and opportunities. Energies 2017, 10, 1618. [Google Scholar] [CrossRef] [Green Version]
  19. Morella, P.; Lambán, M.P.; Royo, J.; Sánchez, J.C.; Corrales, L.C.N. Development of a new green indicator and its implementation in a cyber-physical system for a green supply chain. Sustainability 2020, 12, 8629. [Google Scholar] [CrossRef]
  20. Sun, Y.; Haghighat, F.; Fung, B. A review of the-state-of-the-art in data-driven approaches for building energy prediction. Energy Build. 2020, 221, 110022. [Google Scholar] [CrossRef]
  21. Begum, S.; Xia, E.; Ali, F.; Awan, U.; Ashfaq, M. Achieving green product and process innovation through green leadership and creative engagement in manufacturing. J. Manuf. Technol. Manag. 2021. [Google Scholar] [CrossRef]
  22. Yuan, X.; Sun, X.; Zhao, W.; Mi, Z.; Wang, B.; Wei, Y. Forecasting China’s regional energy demand by 2030: A Bayesian approach. Resour. Conserv. Recycl. 2017, 127, 85–95. [Google Scholar] [CrossRef]
  23. Zhang, X.; Wang, F. Hybrid input-output analysis for life-cycle energy consumption and carbon emissions of China’s building sector. Build. Environ. 2016, 104, 188–197. [Google Scholar] [CrossRef]
  24. Hong, J.; Shen, G.; Guo, S.; Xue, F.; Zheng, W. Energy use embodied in China’s construction industry: A multi-regional input-output analysis. Renew. Sustain. Energy Rev. 2016, 53, 1303–1312. [Google Scholar] [CrossRef] [Green Version]
  25. Buyle, M.; Braet, J.; Audenaert, A. Life cycle assessment in the construction sector: A review. Renew. Sustain. Energy Rev. 2013, 26, 379–388. [Google Scholar] [CrossRef]
  26. Degen, F.; Schütte, M. Life cycle assessment of the energy consumption and GHG emissions of state-of-the-art automotive battery cell production. J. Clean. Prod. 2022, 330, 129798. [Google Scholar] [CrossRef]
  27. Asdrubali, F.; Baldassarri, C.; Fthenakis, V. Life cycle analysis in the construction sector: Guiding the optimization of conventional Italian buildings. Energy Build. 2013, 64, 73–89. [Google Scholar] [CrossRef]
  28. Chau, C.; Leung, T.; Ng, W. A review on life cycle assessment, life cycle energy assessment and life cycle carbon emissions assessment on buildings. Appl. Energy 2015, 143, 395–413. [Google Scholar] [CrossRef]
  29. Sartori, I.; Sandberg, N.; Brattebø, H. Dynamic building stock modelling: General algorithm and exemplification for Norway. Energy Build. 2016, 132, 13–25. [Google Scholar] [CrossRef] [Green Version]
  30. Ma, J.; Du, G.; Zhang, Z.; Wang, P.; Xie, B. Life cycle analysis of energy consumption and CO2 emissions from a typical large office building in Tianjin, China. Build. Environ. 2017, 117, 36–48. [Google Scholar] [CrossRef]
  31. Zhang, Y.; He, C.; Tang, B.; Wei, Y. China’s energy consumption in the building sector: A life cycle approach. Energy Build. 2015, 94, 240–251. [Google Scholar] [CrossRef]
  32. Cheng, Z.; Shahmir, N.; Lu, T. BIM-based investigation of total energy consumption in delivering building products. Adv. Eng. Inform. 2018, 38, 370–380. [Google Scholar]
  33. Zhang, Y.; Yan, D.; Hu, S.; Guo, S. Modelling of energy consumption and carbon emission from the building construction sector in China, a process-based LCA approach. Energy Policy 2019, 134, 110949. [Google Scholar] [CrossRef]
  34. Zhou, N.; Lin, J. The reality and future scenarios of commercial building energy consumption in China. Energy Build. 2008, 40, 2121–2127. [Google Scholar] [CrossRef] [Green Version]
  35. Cai, W.; Wu, Y.; Zhong, Y.; Ren, H. China building energy consumption: Situation, challenges and corresponding measures. Energy Policy 2009, 37, 2054–2059. [Google Scholar] [CrossRef]
  36. McNeil, M.; Feng, W.; Can, S.; Khanna, N.; Ke, J.; Zhou, N. Energy efficiency outlook in China’s urban buildings sector through. Energy Policy 2016, 97, 532–539. [Google Scholar] [CrossRef] [Green Version]
  37. Basbagill, J.; Flager, F.; Lepech, M.; Fischer, M. Application of life-cycle assessment to early stage building design for reduced embodied environmental impacts. Build. Environ. 2013, 60, 81–92. [Google Scholar] [CrossRef]
  38. Huo, T.; Ren, H.; Zhang, X.; Cai, W.; Feng, W.; Zhou, N.; Wang, X. China’s energy consumption in the building sector: A Statistical Yearbook-Energy Balance Sheet based splitting method. J. Clean. Prod. 2018, 185, 665–679. [Google Scholar] [CrossRef]
  39. Abrahamse, W.; Steg, L.; Vlek, C.; Rothengatter, T. A review of intervention studies aimed at household energy conservation. J. Environ. Psychol. 2005, 25, 273–291. [Google Scholar] [CrossRef]
  40. Wenninger, S.; Kaymakci, C.; Wiethe, C. Explainable long-term building energy consumption prediction using QLattice. Appl. Energy 2022, 308, 118300. [Google Scholar] [CrossRef]
  41. Ramesh, T.; Prakash, R.; Shukla, K. Life cycle energy analysis of buildings: An overview. Energy Build. 2010, 42, 1592–1600. [Google Scholar] [CrossRef]
  42. Hong, J.; Shen, G.; Li, C.; Liu, G.; Wu, Z.; Zhong, X. An integrated framework for embodied energy quantification of buildings in China: A multi-regional perspective. Resour. Conserv. Recycl. 2018, 138, 183–193. [Google Scholar] [CrossRef]
  43. Chen, S.; Zhang, G.; Xia, X.; Setunge, S.; Shi, L. A review of internal and external influencing factors on energy efficiency design of buildings. Energy Build. 2020, 216, 109944. [Google Scholar] [CrossRef]
  44. Motalebi, M.; Rashidi, A.; Nasiri, M.M. Optimization and BIM-based lifecycle assessment integration for energy efficiency retrofit of buildings. J. Build. Eng. 2022, 49, 104022. [Google Scholar] [CrossRef]
  45. SäYnäJoki, A.; Heinonen, J.; Junnila, S.; Horvath, A. Can life-cycle assessment produce reliable policy guidelines in the building sector? Environ. Res. Lett. 2017, 12, 013001. [Google Scholar] [CrossRef] [Green Version]
  46. Felmer, G.; Morales-Vera, R.; Astroza, R.; González, I.; Puettmann, M.; Wishnie, M. A lifecycle assessment of a low-energy mass-timber building and mainstream concrete alternative in central Chile. Sustainability 2022, 14, 1249. [Google Scholar] [CrossRef]
  47. Chen, J.; Guo, Y.; Su, H.; Ma, X.; Zhang, Z.; Chang, B. Empirical analysis of energy consumption transfer in China’s national economy from the perspective of production and demand. Environ. Sci. Pollut. Res. 2021, 28, 19202–19221. [Google Scholar] [CrossRef] [PubMed]
  48. Kwok, K.; Kim, J.; Chong, W.; Ariaratnam, S. Structuring a comprehensive carbon-emission framework for the whole life cycle of building, operation, and construction. J. Archit. Eng. 2016, 22, 04016006. [Google Scholar] [CrossRef]
  49. Yang, R.; Chen, W. Spatial correlation, influencing factors and environmental supervision mechanism construction of atmospheric pollution: An empirical study on SO2 emissions in China. Sustainability 2019, 11, 1742. [Google Scholar] [CrossRef] [Green Version]
  50. Marzouk, M.; Azab, S.; Metawie, M. BIM-based approach for optimizing life cycle costs of sustainable buildings. J. Clean. Prod. 2018, 188, 217–226. [Google Scholar] [CrossRef]
  51. Aldhshan, S.R.S.; Abdul Maulud, K.N.; Wan Mohd Jaafar, W.S.; Karim, O.A.; Pradhan, B. Energy consumption and spatial assessment of renewable energy penetration and building energy efficiency in Malaysia: A review. Sustainability 2021, 13, 9244. [Google Scholar] [CrossRef]
  52. Barone, G.; Buonomano, A.; Forzano, C.; Giuzio, G.F.; Palombo, A. Increasing self-consumption of renewable energy through the Building to Vehicle to Building approach applied to multiple users connected in a virtual micro-grid. Renew. Energy 2020, 159, 1165–1176. [Google Scholar] [CrossRef]
  53. Gao, M.; Yang, H.; Xiao, Q.; Goh, M. A novel method for carbon emission forecasting based on Gompertz’s law and fractional grey model: Evidence from American industrial sector. Renew. Energy 2022, 181, 803–819. [Google Scholar] [CrossRef]
  54. Rao, C.; He, Y.; Wang, X. Comprehensive evaluation of non-waste cities based on two-tuple mixed correlation degree. Int. J. Fuzzy Syst. 2021, 23, 369–391. [Google Scholar] [CrossRef]
Figure 1. Building energy consumption in 2018.
Sustainability 14 04587 g001
Figure 2. Total building energy consumption in China.
Sustainability 14 04587 g002
Figure 3. Chinese building energy consumption analysis of the materialization stage, from 2000 to 2018 (Unit: 10,000 tons of standard coal).
Sustainability 14 04587 g003
Figure 4. Analysis of Chinese building energy consumption in the construction period from 2000 to 2018 (Unit: 10,000 tons of standard coal).
Sustainability 14 04587 g004
Figure 5. Energy consumption analysis of the Chinese building operation stage from 2000 to 2018 (Unit: 10,000 tons of standard coal).
Sustainability 14 04587 g005
Table 1. Comparison of previous literature with this paper.
ArticlesScopes of the Building Energy ConsumptionWhether the Calculation Covers Related IndustriesMethods of Building Energy ConsumptionLCA-Based Calculation Method
Hong et al. [42]MaterializationNoModel-basedEIO-LCA
Zhang et al. [33]ConstructionNoModel-basedProcess-LCA
Huo et al. [38]OperationYesMacro dataHybrid-LCA
Zhang et al. [31]MaterializationYesMacro dataProcess-LCA
Construction
Operation
Zhang and Wang [23]ConstructionYesMacro dataHybrid-LCA
Operation
This paperMaterializationYesMacro dataProcess-LCA
Construction
Operation
Table 2. X , Y , and Z values over the year.
Year200020012002200420052006200720082009
X0.410.410.410.410.410.500.500.500.50
Y0.250.250.250.250.250.280.280.280.28
Z0.900.900.900.900.900.900.900.900.90
Year20102011201220142015201620172018
X0.550.550.550.580.580.580.580.58
Y0.280.320.320.320.320.350.350.35
Z0.900.900.900.900.900.900.900.90
Table 3. Calculation results of building energy in China Unit: 10,000 tons of standard coal (tce).
YearConstructionMaterializationOperationBuilding Energy ConsumptionProportion
2000220724,739.9230,731.3557,678.270.39
20012255.0226,024.8730,788.3959,068.280.38
20022409.5725,836.1233,223.2361,468.920.36
20032720.6632,329.2738,393.5673,443.490.37
20043114.6037,076.3242,684.2582,875.160.36
2005348652,521.0552,050.82108,057.870.41
20063760.7349,550.3451,397.95104,709.020.37
20074127.5253,809.2555,482.27113,419.040.36
20083812.5355,619.2459,733.9119,165.670.37
2009471265,618.9265,821.35136,152.270.41
2010553368,178.9669,611.29143,323.250.40
2011605273,602.1475,241.48154,895.620.40
2012633773,455.2680,740.18160,532.440.40
2013701767,756.9886,405.02161,179.000.39
2014737769,499.4890,008.44166,884.920.39
2015754565,770.5795,133.35168,448.920.39
2016784764,958.22101,485.70174,290.950.39
2017824363,576.50111,994.30183,813.820.40
2018868563,576.94114,636.60186,898.540.40
Publisher’s Note: MDPI stays neutral with regard to jurisdictional claims in published maps and institutional affiliations.

