
A Comparative Study of Cooling Performance and Thermal Comfort under Street Market Shades and Tree Canopies in Tropical Savanna Climate


Abstract
:1. Introduction
2. Studies of Outdoor Shade Structures
2.1. Effects of Tree Canopies and Artificial Shade Structures on Cooling Benefits and Improving Thermal Comfort Conditions
2.2. Environmental Factors Affecting the Cooling Performance under Artificial Shade Structures
3. Methods
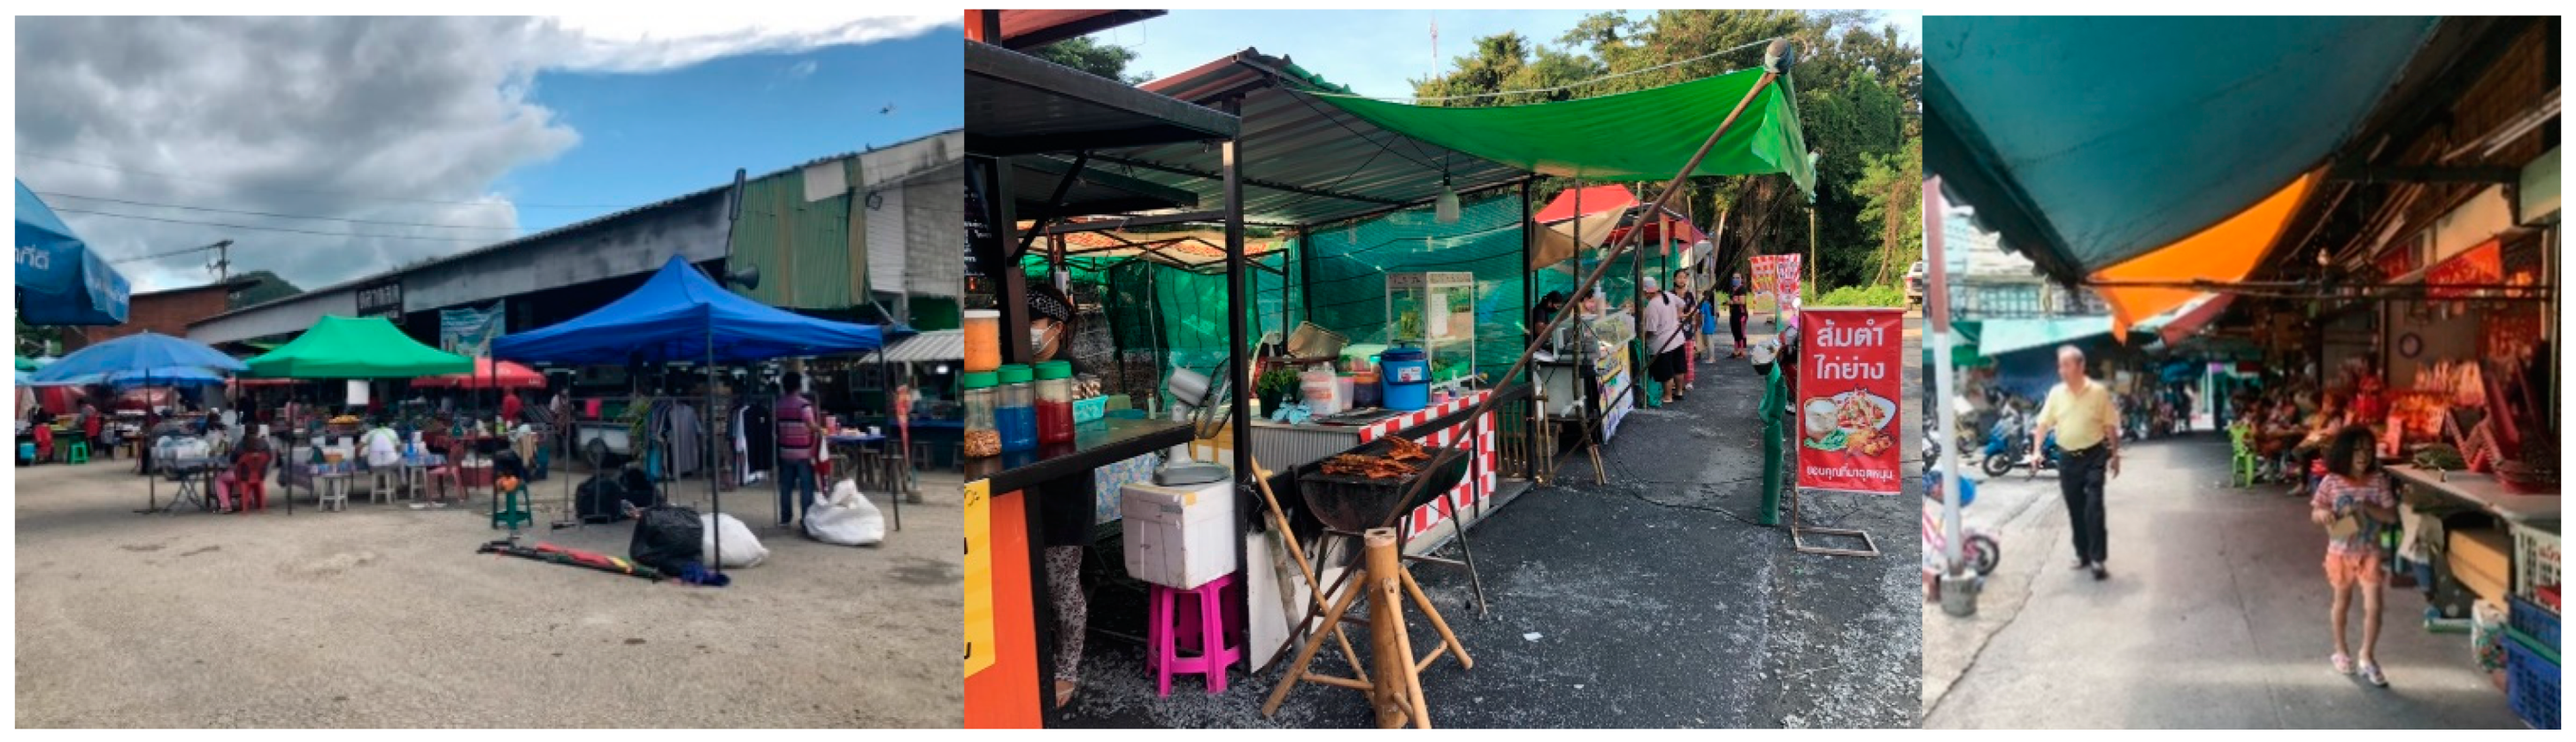
3.1. Study Location
3.2. Characteristics of Shade Structures and Instrumentation Installation
3.2.1. Shade Structure Setting with Different Roofing Materials
3.2.2. Shade Structure Setting with Different Roof Shapes
3.3. Thermal Comfort Evaluation Calculation
4. Results
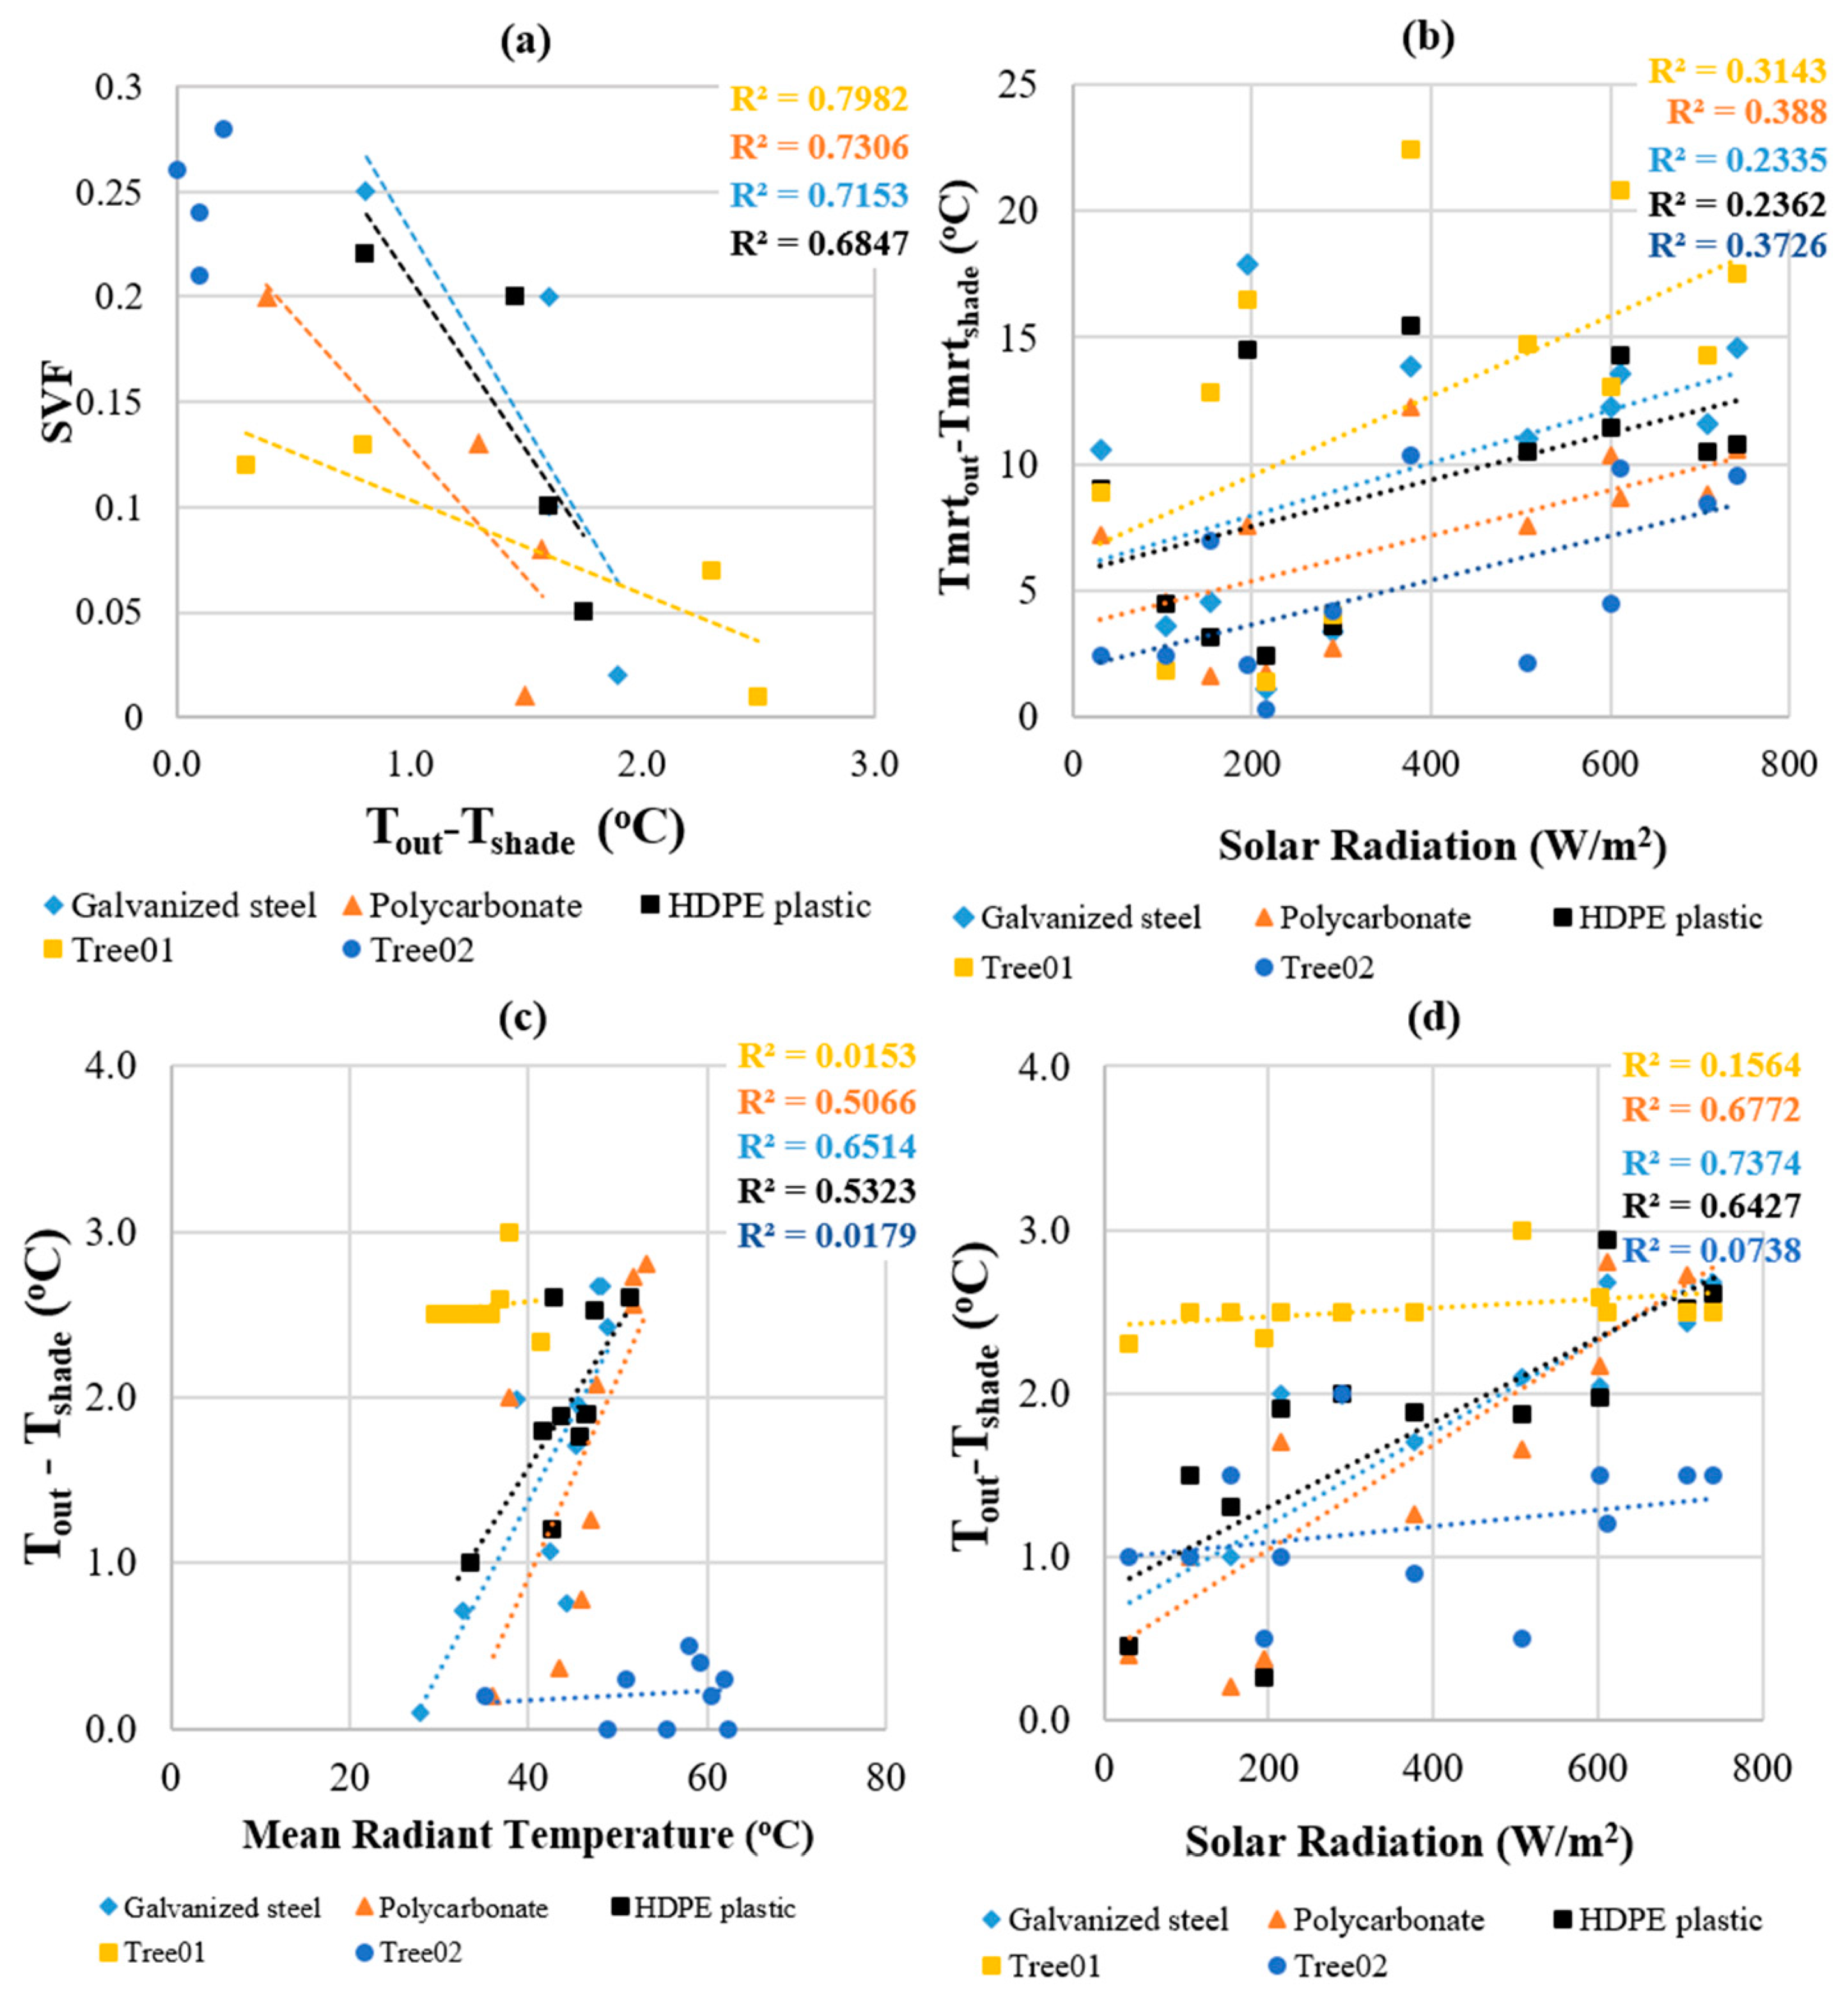
4.1. Sky View Factor (SVF)
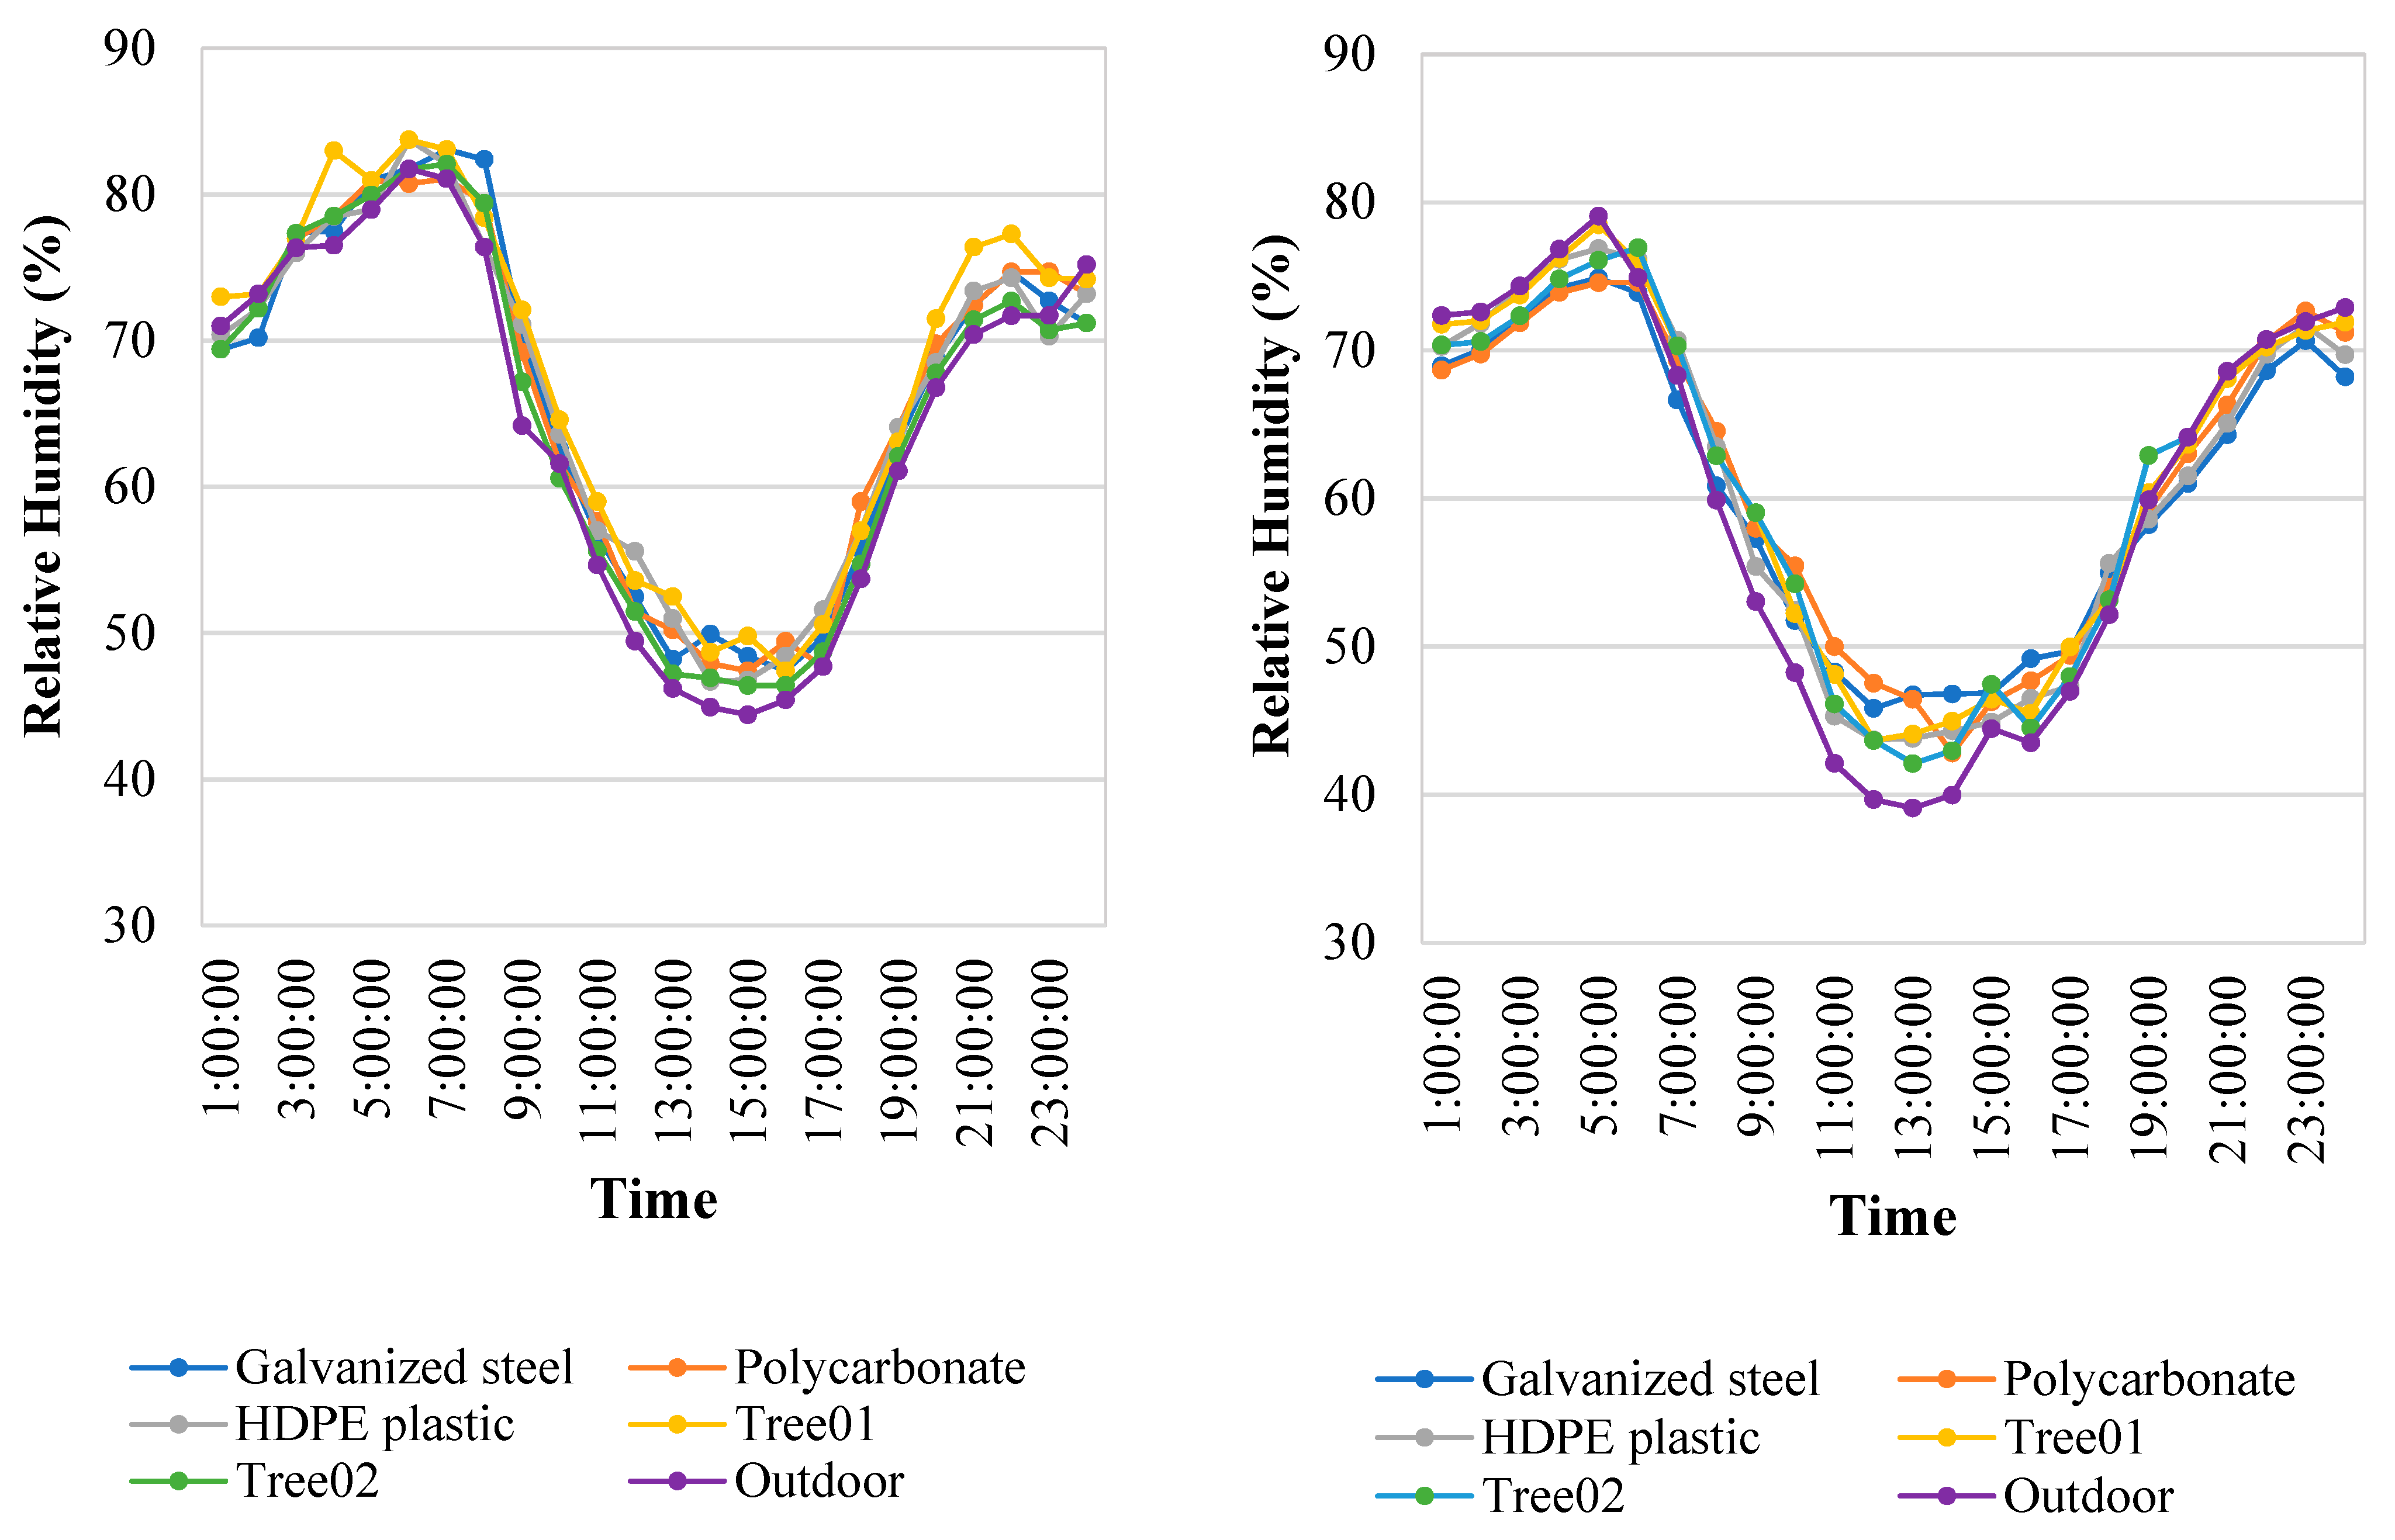
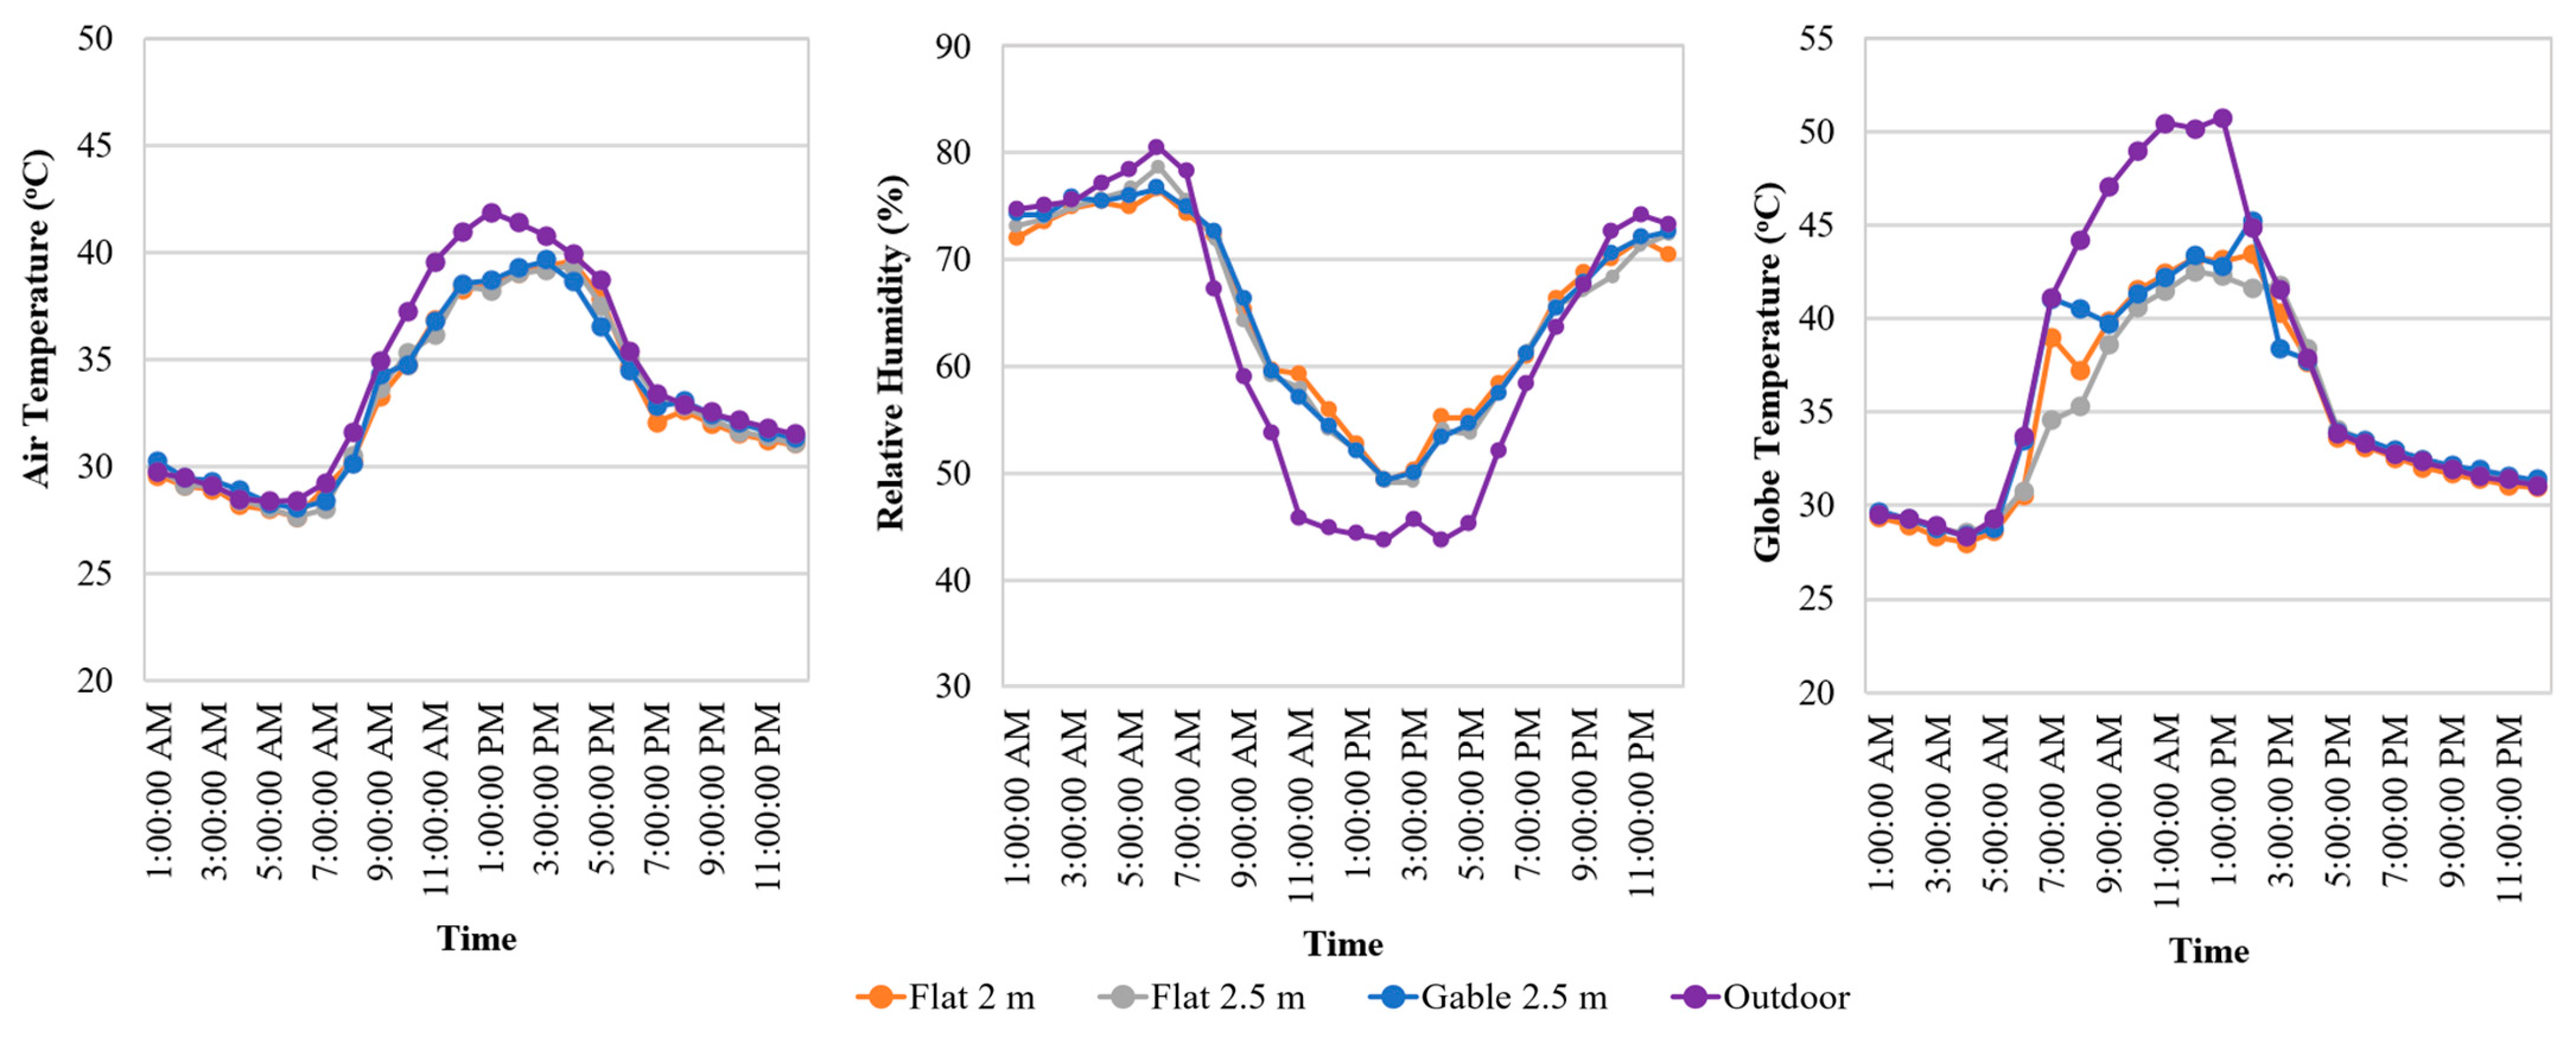
4.2. Effect of Roofing Materials on Thermal Condition and Cooling Performance Underneath
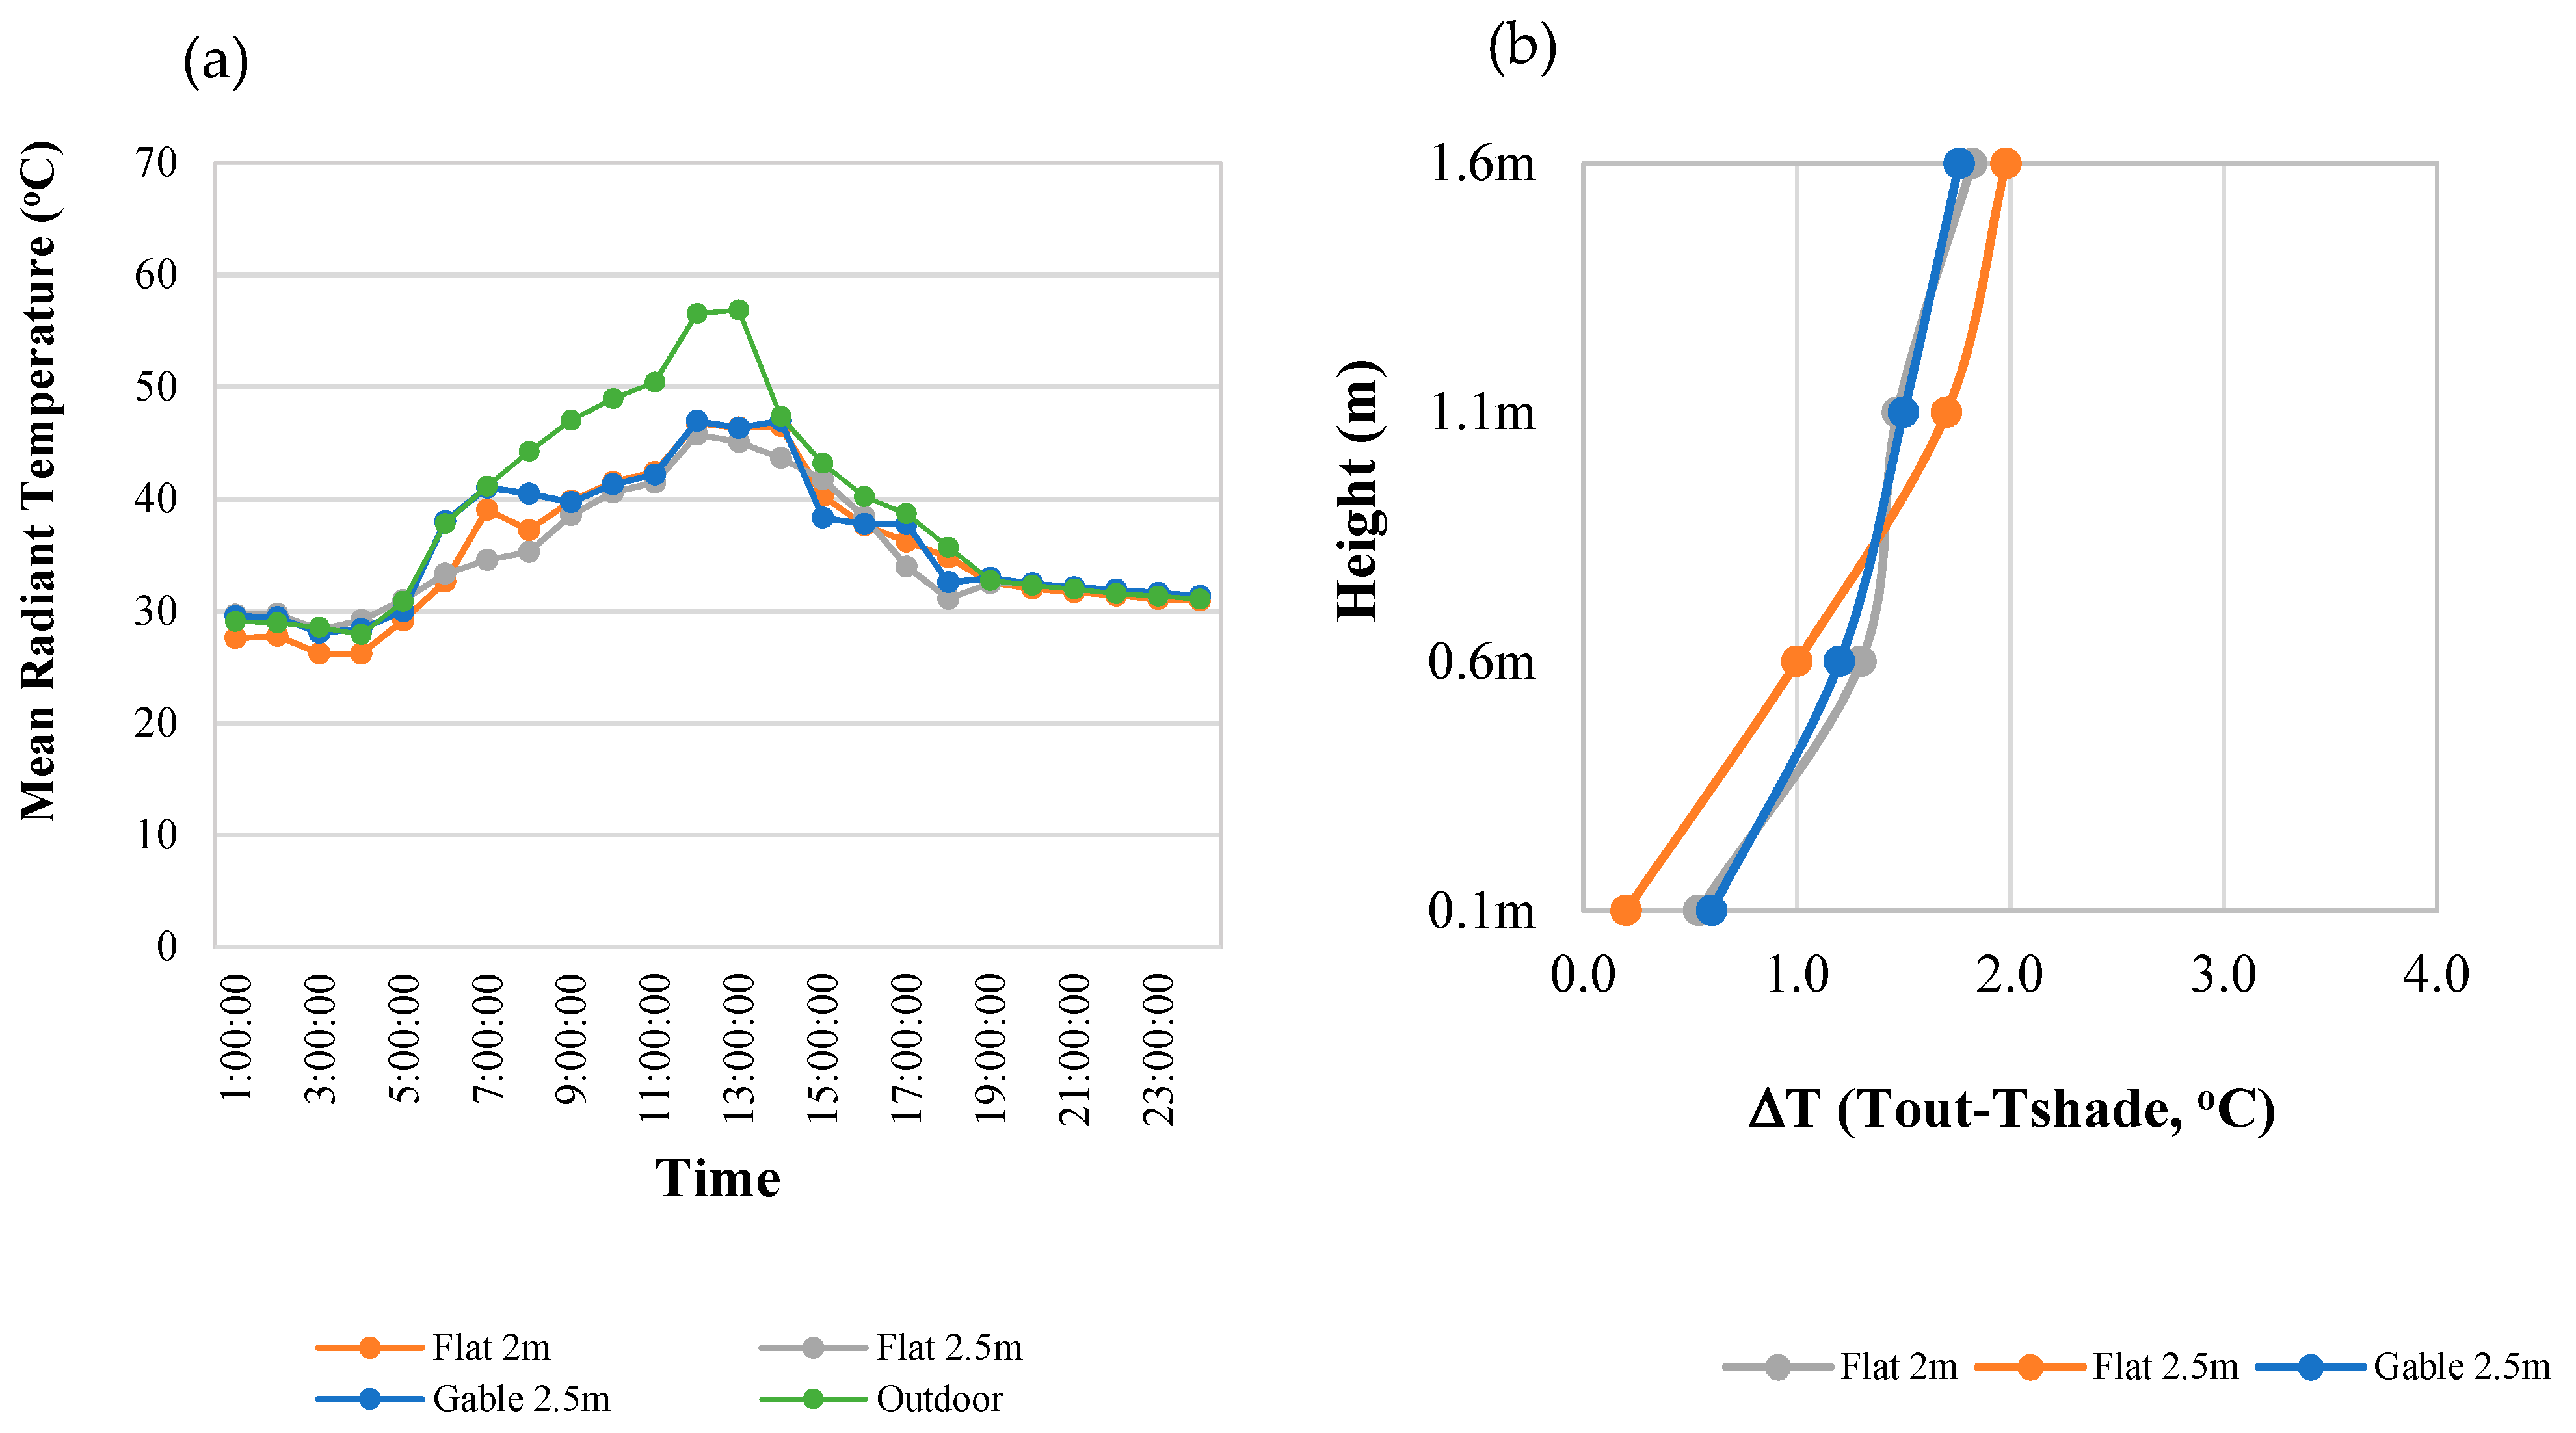
4.3. Vertical Cooling Performance under Artificial Shades and Tree Canopies
4.4. Thermal Comfort Performance Calculation
4.5. Relationship between Environmental Factors, Air Temperature, and Mean Radiant Temperature Reductions Beneath the Canopies
5. Discussion
6. Conclusions
Author Contributions
Funding
Institutional Review Board Statement
Informed Consent Statement
Data Availability Statement
Acknowledgments
Conflicts of Interest
Appendix A

| Roof Material | Specific Heat Capacity | Thermal Conductivity | Source |
|---|---|---|---|
| Galvanized steel roof sheet | 470 J/kg-°C | 52.0 W/m-K | Manufacturing data |
| Polycarbonate sheet | 1200 J/kg-°C | 0.19–0.22 W/m-K | Manufacturing data |
| HDPE plastic sheet | 1750–1810 J/kg-°C | 0.45–0.52 W/m-K @23C | Manufacturing data |
Appendix B
| Date: 11 April 2020, Time: 12 p.m. | |||
|---|---|---|---|
| Unshaded area 0.1 m__SVF = 0.49 | Unshaded area 0.6 m_SVF = 0.49 | Unshaded area 1.1 m_SVF = 0.49 | Unshaded area 1.6 m_SVF = 0.49 |
 |  |  |  |
| Fabric 0.1 m_SVF = 0.23 | Fabric 0.6 m_SVF = 0.19 | Fabric 1.1 m_SVF = 0.11 | Fabric 1.6 m_SVF = 0.06 |
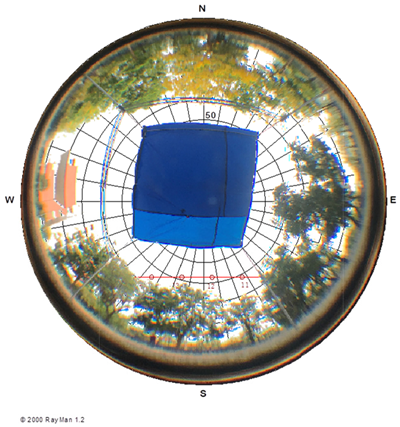 |  | 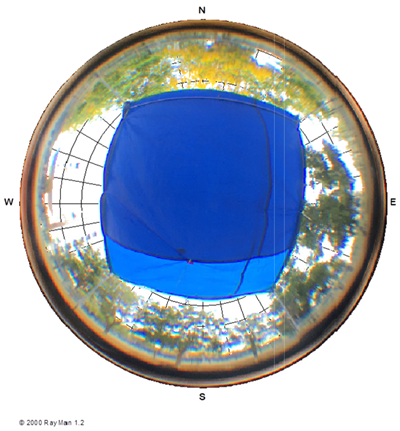 | 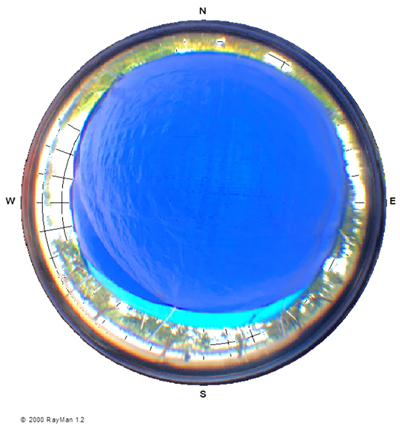 |
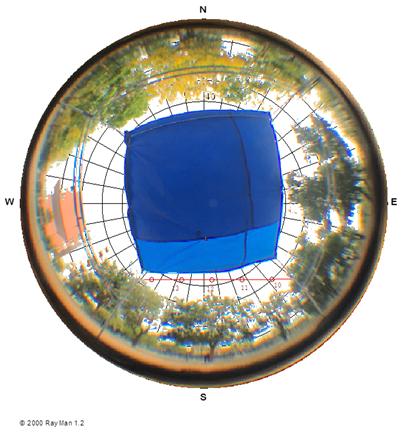
| Metal 0.1 m_SVF = 0.25 | Metal 0.6 m_SVF = 0.19 | Metal 1.1 m_SVF = 0.11 | Metal 1.6 m_SVF = 0.03 |
 | 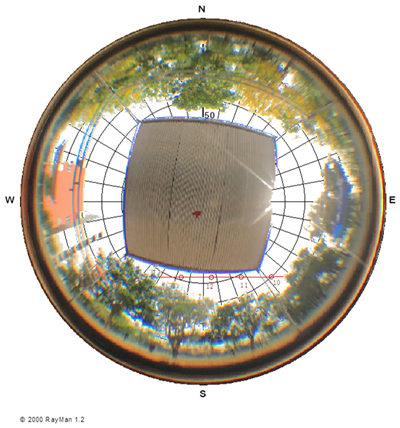 |  | 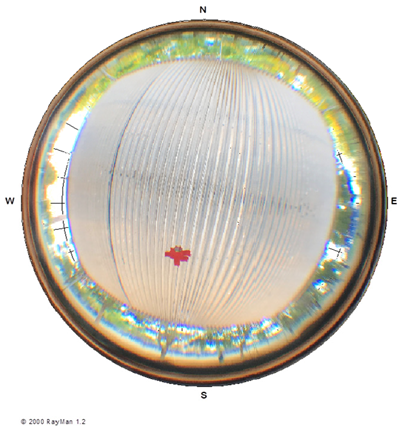 |
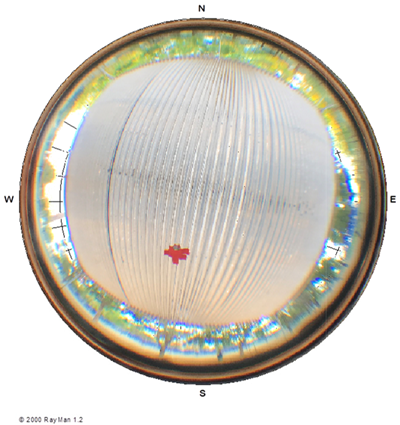
| Poly 0.1 m_SVF = 0.20 | Poly 0.6 m_SVF = 0.12 | Poly 1.1 m_SVF = 0.05 | Poly 1.6 m_SVF = 0.01 |
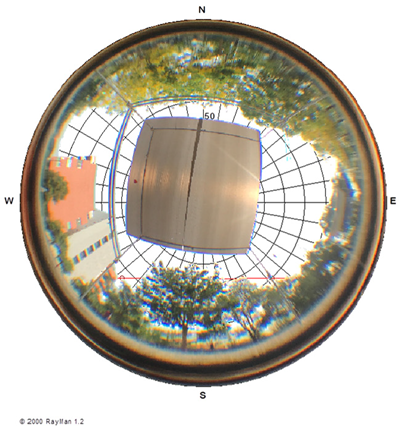 |  | 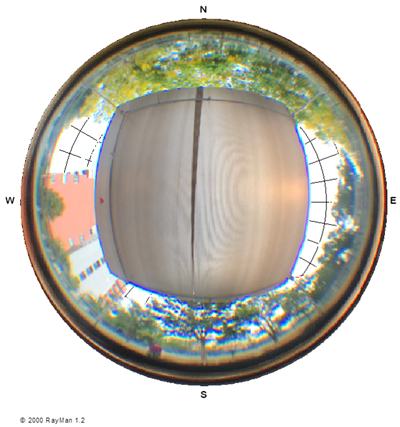 | 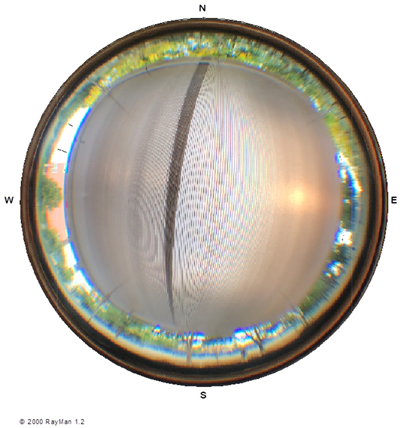 |
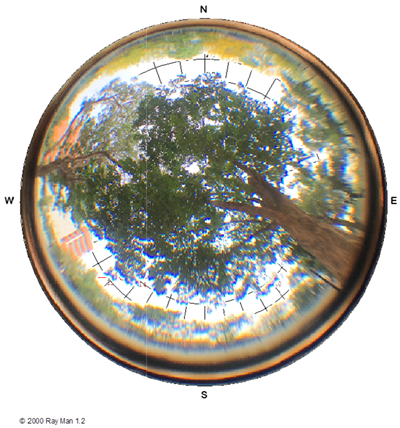
| Tree01 0.1 m_SVF = 0.13 | Tree01 0.6 m_SVF = 0.13 | Tree01 1.1 m_SVF = 0.07 | Tree01 1.6 m_SVF = 0.02 |
 |  |  |  |
| Tree02 0.1 m_SKV = 0.22 | Tree02 0.6 m_SKV = 0.28 | Tree02 1.1 m_SKV = 0.27 | Tree02 1.6 m_SKV = 0.24 |
 |  |  |  |
Appendix C
| Winter Season | Unshaded Condition–Shaded Condition 20–22 December 2019 | ||||||||
|---|---|---|---|---|---|---|---|---|---|
| Unit | Galvanized Steel | Polycarbonate | HDPE Plastic | Tree01 | Tree02 | ||||
| Air temperature | °C | 2.3 ± 2.1 | 2.0 ± 2.0 | 2.3 ± 2.0 | 3.0 ± 2.3 | 1.4 ± 2.3 | |||
| Globe temperature | °C | 12.9 ± 9.3 | 12.4 ± 9.4 | 11.8 ± 9.3 | 13.5 ± 8.6 | 11.6 ± 8.8 | |||
| Relative humidity | % | −3.3 ± 1.8 | −2.7 ± 1.6 | −3.3 ± 2.1 | −4.2 ± 1.9 | −1.5 ± 1.2 | |||
| Mean radiant temperature | °C | 4.8 ± 4.3 | 3.8 ± 3.1 | 4.6 ± 3.2 | 6.3 ± 3.3 | 2.9 ± 2.1 | |||
| Summer Season | Unshaded Condition–Shaded Condition 10–12 April 2020 | Unshaded Condition–Shaded Condition 14–16 April 2020 | |||||||
| Unit | Galvanized Steel | Polycarbonate | HDPE Plastic | Tree01 | Tree02 | Flat 2 m | Flat 2.5 m | Gable 2.5 m | |
| Air temperature | °C | 1.6 ± 1.1 | 1.6 ± 1.3 | 1.6 ± 1.0 | 2.3 ± 0.6 | 1.2 ± 0.4 | 1.5 ± 1.0 | 1.7 ± 1.0 | 1.5 ± 1.0 |
| Globe temperature | °C | 3.6 ± 2.4 | 2.8 ± 2.0 | 2.9 ± 2.1 | 4.8 ± 2.4 | 2.5 ± 2.6 | 4.0 ± 3.1 | 4.1 ± 4.0 | 3.9 ± 3.7 |
| Relative humidity | % | −3.9 ± 5.3 | −4.5 ± 2.9 | −5.3 ± 3.2 | −3.8 ± 1.8 | −3.0 ± 1.7 | −5.7 ± 4.6 | −5.6 ± 4.3 | −5.9 ± 5.2 |
| Mean radiant temperature | °C | 8.5 ± 7.2 | 4.6 ± 5.6 | 6.9 ± 5.4 | 11.6 ± 7.7 | 4.1 ± 8.1 | 4.4 ± 4.3 | 4.9 ± 5.5 | 4.3 ± 5.0 |
Appendix D
References
- Jenerette, G.D.; Harlan, S.L.; Stefanov, W.L.; Martin, C.A. Ecosystem Services and Urban Heat Riskscape Moderation: Water, Green Spaces, and Social Inequality in Phoenix, USA. Ecol. Appl. 2011, 21, 2637–2651. [Google Scholar] [CrossRef] [PubMed]
- Colter, K.R.; Middel, A.C.; Martin, C.A. Effects of Natural and Artificial Shade on Human Thermal Comfort in Residential Neighborhood Parks of Phoenix, Arizona, USA. Urban. For. Urban. Green. 2019, 44, 126429. [Google Scholar] [CrossRef]
- Xu, M.; Hong, B.; Jiang, R.; An, L.; Zhang, T. Outdoor Thermal Comfort of Shaded Spaces in an Urban Park in the Cold Region of China. Build. Environ. 2019, 155, 408–420. [Google Scholar] [CrossRef]
- Hwang, R.-L.; Lin, T.-P.; Matzarakis, A. Seasonal Effects of Urban Street Shading on Long-Term Outdoor Thermal Comfort. Build. Environ. 2011, 46, 863–870. [Google Scholar] [CrossRef]
- Ali-Toudert, F.; Mayer, H. Effects of Asymmetry, Galleries, Overhanging Façades and Vegetation on Thermal Comfort in Urban Street Canyons. Sol. Energy 2007, 81, 742–754. [Google Scholar] [CrossRef]
- Shashua-Bar, L.; Hoffman, M.E. Vegetation as a Climatic Component in the Design of an Urban Street: An Empirical Model for Predicting the Cooling Effect of Urban Green Areas with Trees. Energy Build. 2000, 31, 221–235. [Google Scholar] [CrossRef]
- Takkanon, P.; Chantarangul, P. Effects of Urban Geometry and Green Area on Thermal Condition of Urban Street Canyons in Bangkok. Archit. Sci. Rev. 2019, 62, 35–46. [Google Scholar] [CrossRef]
- Nasrollahi, N.; Namazi, Y.; Taleghani, M. The Effect of Urban Shading and Canyon Geometry on Outdoor Thermal Comfort in Hot Climates: A Case Study of Ahvaz, Iran. Sustain. Cities Soc. 2021, 65, 102638. [Google Scholar] [CrossRef]
- Park, Y.; Guldmann, J.-M.; Liu, D. Impacts of Tree and Building Shades on the Urban Heat Island: Combining Remote Sensing, 3D Digital City and Spatial Regression Approaches. Comput. Environ. Urban. Syst. 2021, 88, 101655. [Google Scholar] [CrossRef]
- Xie, Y.; Huang, T.; Li, J.; Liu, J.; Niu, J.; Mak, C.M.; Lin, Z. Evaluation of a Multi-Nodal Thermal Regulation Model for Assessment of Outdoor Thermal Comfort: Sensitivity to Wind Speed and Solar Radiation. Build. Environ. 2018, 132, 45–56. [Google Scholar] [CrossRef]
- Lin, T.-P.; Tsai, K.-T.; Liao, C.-C.; Huang, Y.-C. Effects of Thermal Comfort and Adaptation on Park Attendance Regarding Different Shading Levels and Activity Types. Build. Environ. 2013, 59, 599–611. [Google Scholar] [CrossRef]
- Srivanit, M.; Jareemit, D. Modeling the Influences of Layouts of Residential Townhouses and Tree-Planting Patterns on Outdoor Thermal Comfort in Bangkok Suburb. J. Build. Eng. 2020, 30, 101262. [Google Scholar] [CrossRef]
- Koerniawan, M.D.; Gao, W. Investigation and Evaluation of Thermal Comfort and Walking Comfort in Hot-Humid Climate Case Study: The Open Spaces of Mega Kuningan-Superblock in Jakarta. Int. J. Build. Urban. Inter. Landsc. Technol. 2015, 6, 53–72. [Google Scholar]
- Garcia-Nevado, E.; Duport, N.; Bugeat, A.; Beckers, B. Benefits of Street Sun Sails to Limit Building Cooling Needs in a Mediterranean City. Build. Environ. 2021, 187, 107403. [Google Scholar] [CrossRef]
- Middel, A.; Selover, N.; Hagen, B.; Chhetri, N. Impact of Shade on Outdoor Thermal Comfort—a Seasonal Field Study in Tempe, Arizona. Int. J. Biometeorol. 2016, 60, 1849–1861. [Google Scholar] [CrossRef] [Green Version]
- Jafarian, S.; Sarkardehee, E.; Monsefi Parapari, D.; Mojahedi, M.R. Introducing an Optimal Model and Dimensions of Lightweight Membrane Canopy for Hot and Dry Climate of City of Semnan in Iran. Renew. Energy Res. Appl. 2021, 2, 101–110. [Google Scholar] [CrossRef]
- Lee, I.; Voogt, J.A.; Gillespie, T.J. Analysis and Comparison of Shading Strategies to Increase Human Thermal Comfort in Urban Areas. Atmosphere 2018, 9, 91. [Google Scholar] [CrossRef] [Green Version]
- Cheng, V.; Ng, E.; Chan, C.; Givoni, B. Outdoor Thermal Comfort Study in a Sub-Tropical Climate: A Longitudinal Study Based in Hong Kong. Int. J. Biometeorol. 2012, 56, 43–56. [Google Scholar] [CrossRef]
- Chen, L.; Ng, E. Outdoor Thermal Comfort and Outdoor Activities: A Review of Research in the Past Decade. Cities 2012, 29, 118–125. [Google Scholar] [CrossRef]
- Vanos, J.K.; Herdt, A.J.; Lochbaum, M.R. Effects of Physical Activity and Shade on the Heat Balance and Thermal Perceptions of Children in a Playground Microclimate. Build. Environ. 2017, 126, 119–131. [Google Scholar] [CrossRef] [Green Version]
- Santos, I.R.; Friedrich, A.C.; Ivar do Sul, J.A. Marine Debris Contamination along Undeveloped Tropical Beaches from Northeast Brazil. Environ. Monit Assess. 2009, 148, 455–462. [Google Scholar] [CrossRef] [PubMed]
- Elgheznawy, D.; Eltarabily, S. The Impact of Sun Sail-Shading Strategy on the Thermal Comfort in School Courtyards. Build. Environ. 2021, 202, 108046. [Google Scholar] [CrossRef]
- Shashua-Bar, L.; Pearlmutter, D.; Erell, E. The Influence of Trees and Grass on Outdoor Thermal Comfort in a Hot-Arid Environment. Int. J. Climatol. 2011, 31, 1498–1506. [Google Scholar] [CrossRef]
- Watanabe, S.; Ishii, J. Effect of Outdoor Thermal Environment on Pedestrians’ Behavior Selecting a Shaded Area in a Humid Subtropical Region. Build. Environ. 2016, 95, 32–41. [Google Scholar] [CrossRef]
- Elnabawi, M.H.; Hamza, N. Outdoor Thermal Comfort: Coupling Microclimatic Parameters with Subjective Thermal Assessment to Design Urban Performative Spaces. Buildings 2020, 10, 238. [Google Scholar] [CrossRef]
- Lopes, L.B.; Eckstein, C.; Pina, D.S.; Carnevalli, R.A. The Influence of Trees on the Thermal Environment and Behaviour of Grazing Heifers in Brazilian Midwest. Trop. Anim. Health Prod. 2016, 48, 755–761. [Google Scholar] [CrossRef] [Green Version]
- Kántor, N.; Chen, L.; Gál, C.V. Human-Biometeorological Significance of Shading in Urban Public Spaces—Summertime Measurements in Pécs, Hungary. Landsc. Urban. Plan. 2018, 170, 241–255. [Google Scholar] [CrossRef]
- Rahman, M.A.; Dervishi, V.; Moser-Reischl, A.; Ludwig, F.; Pretzsch, H.; Rötzer, T.; Pauleit, S. Comparative Analysis of Shade and Underlying Surfaces on Cooling Effect. Urban. For. Urban. Green. 2021, 63, 127223. [Google Scholar] [CrossRef]
- Sayad, B.; Alkama, D.; Ahmad, H.; Baili, J.; Aljahdaly, N.H.; Menni, Y. Nature-Based Solutions to Improve the Summer Thermal Comfort Outdoors. Case Stud. Therm. Eng. 2021, 28, 101399. [Google Scholar] [CrossRef]
- Abdallah, A.S.H.; Hussein, S.W.; Nayel, M. The Impact of Outdoor Shading Strategies on Student Thermal Comfort in Open Spaces between Education Building. Sustain. Cities Soc. 2020, 58, 102124. [Google Scholar] [CrossRef]
- Pham, J.V.; Baniassadi, A.; Brown, K.E.; Heusinger, J.; Sailor, D.J. Comparing Photovoltaic and Reflective Shade Surfaces in the Urban Environment: Effects on Surface Sensible Heat Flux and Pedestrian Thermal Comfort. Urban. Clim. 2019, 29, 100500. [Google Scholar] [CrossRef]
- Azcarate, I.; Acero, J.Á.; Garmendia, L.; Rojí, E. Tree Layout Methodology for Shading Pedestrian Zones: Thermal Comfort Study in Bilbao (Northern Iberian Peninsula). Sustain. Cities Soc. 2021, 72, 102996. [Google Scholar] [CrossRef]
- Sabrin, S.; Karimi, M.; Nazari, R.; Pratt, J.; Bryk, J. Effects of Different Urban-Vegetation Morphology on the Canopy-Level Thermal Comfort and the Cooling Benefits of Shade Trees: Case-Study in Philadelphia. Sustain. Cities Soc. 2021, 66, 102684. [Google Scholar] [CrossRef]
- Speak, A.; Montagnani, L.; Wellstein, C.; Zerbe, S. Forehead Temperatures as an Indicator of Outdoor Thermal Comfort and the Influence of Tree Shade. Urban. Clim. 2021, 39, 100965. [Google Scholar] [CrossRef]
- Paolini, R.; Mainini, A.G.; Poli, T.; Vercesi, L. Assessment of Thermal Stress in a Street Canyon in Pedestrian Area with or without Canopy Shading. Energy Procedia 2014, 48, 1570–1575. [Google Scholar] [CrossRef] [Green Version]
- Johansson, E.; Thorsson, S.; Emmanuel, R.; Krüger, E. Instruments and Methods in Outdoor Thermal Comfort Studies—The Need for Standardization. Urban. Clim. 2014, 10, 346–366. [Google Scholar] [CrossRef] [Green Version]
- Liu, J.; Heidarinejad, M.; Gracik, S.; Srebric, J.; Yu, N. An indirect validation of convective heat transfer coefficients (CHTCs) for external building surfaces in an actual urban environment. Build. Simul. 2015, 8, 337–352. [Google Scholar] [CrossRef]
- Matzarakis, A.; Rutz, F.; Mayer, H. Modelling Radiation Fluxes in Simple and Complex Environments: Basics of the RayMan Model. Int. J. Biometeorol 2010, 54, 131–139. [Google Scholar] [CrossRef] [Green Version]
- Nouri, A.S.; Costa, J.P. Addressing Thermophysiological Thresholds and Psychological Aspects during Hot and Dry Mediterranean Summers through Public Space Design: The Case of Rossio. Build. Environ. 2017, 118, 67–90. [Google Scholar] [CrossRef]
- Höppe, P. The physiological equivalent temperature—A universal index for the biometeorological assessment of the thermal environment. Int. J. Biometeorol. 1999, 43, 71–75. [Google Scholar] [CrossRef]
- Matzarakis, A.; Mayer, H.; Iziomon, M.G. Applications of a universal thermal index: Physiological equivalent temperature. Int. J. Biometeorol. 1999, 43, 76–84. [Google Scholar] [CrossRef] [PubMed]
- Srivanit, M.; Jareemit, D. Human Thermal Perception and Outdoor Thermal Comfort under Shaded Conditions in Summer—A Field Study in an Institutional Campus. In Proceedings of the 6th International Conference on Sustainable Energy and Environment (SEE 2016), Bangkok, Thailand, 28–30 November 2016. [Google Scholar]
- ISO 7726:1998. Available online: https://www.iso.org/cms/render/live/en/sites/isoorg/contents/data/standard/01/45/14562.html (accessed on 18 November 2021).
- Thorsson, S.; Lindberg, F.; Eliasson, I.; Holmer, B. Different methods for estimating the mean radiant temperature in an outdoor urban setting. Int. J. Climatol. 2007, 27, 1983–1993. [Google Scholar] [CrossRef]
- Zaki, S.A.; Toh, H.J.; Yakub, F.; Mohd Saudi, A.S.; Ardila-Rey, J.A.; Muhammad-Sukki, F. Effects of Roadside Trees and Road Orientation on Thermal Environment in a Tropical City. Sustainability 2020, 12, 1053. [Google Scholar] [CrossRef] [Green Version]
- Armson, D.; Asrafur Rahman, M.; Roland Ennos, A. A Comparison of the Shading Effectiveness of Five Different Street Tree Species in Manchester, UK. AUF 2013, 39, 157–164. [Google Scholar] [CrossRef]
- Rahman, M.A.; Moser, A.; Gold, A.; Rötzer, T.; Pauleit, S. Vertical Air Temperature Gradients under the Shade of Two Contrasting Urban Tree Species during Different Types of Summer Days. Sci. Total Environ. 2018, 633, 100–111. [Google Scholar] [CrossRef]
- Rahman, M.A.; Moser, A.; Rötzer, T.; Pauleit, S. Comparing the Transpirational and Shading Effects of Two Contrasting Urban Tree Species. Urban. Ecosyst. 2019, 22, 683–697. [Google Scholar] [CrossRef]
- Zölch, T.; Rahman, M.A.; Pfleiderer, E.; Wagner, G.; Pauleit, S. Designing Public Squares with Green Infrastructure to Optimize Human Thermal Comfort. Build. Environ. 2019, 149, 640–654. [Google Scholar] [CrossRef]


| Instrument | Measurement Range | Accuracy | Height |
|---|---|---|---|
| Temperature/RH smart sensor (S-THB-M00x) | −40 °C to 75 °C 0–100% RH at −40° to 75 °C | 0.2 °C over 0° to 50 °C ±2.5% from 10% to 90% RH | 1.1 m (unshaded condition) |
| Globe temperature T-type thermocouple sensor attached to HOBO-U12-014 data logger | −250° to 350 °C | ±1 °C or ±0.75% | 1.1 m (shaded and unshaded conditions) |
| Wind speed/direction smart sensor (Part-S-WCA-M003) | 0 to 44 m/s (0 to 99 mph) | ±0.5 m/s ( ±1.1 mph) ±3% 17 to 30 m/s | 1.6 m (unshaded condition) |
| iButton data logger DS1923 | −20 °C to +85 °C 0 to 100% humidity | ±0.5 °C: −10 °C to +65 °C ±5%RH | 1.1 m (shaded condition) |
| iButton data logger DS1922L | −40 °C to +85 °C | ±0.5 °C: −10 °C to +65 °C | 0.1, 0.6, 1.6 m, and surface material (shaded condition) |
| SVF using a fisheye lens | - | - | 0.1, 0.6, 1.1, and 1.6 m (shaded and unshaded condition) |
| Test Dates | Air Temperature (°C) | Relative Humidity (%) | Solar Radiation (Watt/m2) | Wind Speed (m/s) | ||||||||
|---|---|---|---|---|---|---|---|---|---|---|---|---|
| Max | Average | Min | Max | Average | Min | Max | Mean | Min | Max | Mean | Min | |
| Winter condition 20–22 December 2019 | 39.5 | 36.9 | 27.7 | 88.8 | 53.4 | 44.4 | 620.7 | 321.5 | 0 | 0.8 | 0.4 | 0.0 |
| Summer condition 10–13 April 2020 | 39.4 | 38.2 | 27.2 | 78.9 | 47 | 39.1 | 836.8 | 300.0 | 0.4 | 0.9 | 0.7 | 0.2 |
| Summer condition 14–16 April 2020 | 39.9 | 38.7 | 28.4 | 80.4 | 45.8 | 41.7 | 839.0 | 329.6 | 2.6 | 0.5 | 0.3 | 0.0 |
| Date: 11 April 2020, Time: 12 p.m. | |||
|---|---|---|---|
| Fabric 0.1 m_SVF = 0.23 | Fabric 0.6 m_SVF = 0.19 | Fabric 1.1 m_SVF = 0.11 | Fabric 1.6 m_SVF = 0.06 |
 |  |  |  |
| Metal 0.1 m_SVF = 0.25 | Metal 0.6 m_SVF = 0.19 | Metal 1.1 m_SVF = 0.11 | Metal 1.6 m_SVF = 0.03 |
 |  |  |  |
| Tree01 0.1 m_SVF = 0.13 | Tree01 0.6 m_SVF = 0.13 | Tree01 1.1 m_SVF = 0.07 | Tree01 1.6 m_SVF = 0.02 |
 |  |  |  |
Publisher’s Note: MDPI stays neutral with regard to jurisdictional claims in published maps and institutional affiliations. |
© 2022 by the authors. Licensee MDPI, Basel, Switzerland. This article is an open access article distributed under the terms and conditions of the Creative Commons Attribution (CC BY) license (https://creativecommons.org/licenses/by/4.0/).
Share and Cite
Jareemit, D.; Srivanit, M. A Comparative Study of Cooling Performance and Thermal Comfort under Street Market Shades and Tree Canopies in Tropical Savanna Climate. Sustainability 2022, 14, 4653. https://doi.org/10.3390/su14084653
Jareemit D, Srivanit M. A Comparative Study of Cooling Performance and Thermal Comfort under Street Market Shades and Tree Canopies in Tropical Savanna Climate. Sustainability. 2022; 14(8):4653. https://doi.org/10.3390/su14084653
Chicago/Turabian StyleJareemit, Daranee, and Manat Srivanit. 2022. "A Comparative Study of Cooling Performance and Thermal Comfort under Street Market Shades and Tree Canopies in Tropical Savanna Climate" Sustainability 14, no. 8: 4653. https://doi.org/10.3390/su14084653
APA StyleJareemit, D., & Srivanit, M. (2022). A Comparative Study of Cooling Performance and Thermal Comfort under Street Market Shades and Tree Canopies in Tropical Savanna Climate. Sustainability, 14(8), 4653. https://doi.org/10.3390/su14084653