
Root Traits and Erosion Resistance of Three Endemic Grasses for Estuarine Sand Drift Control

Abstract
:1. Introduction
2. Materials and Methods
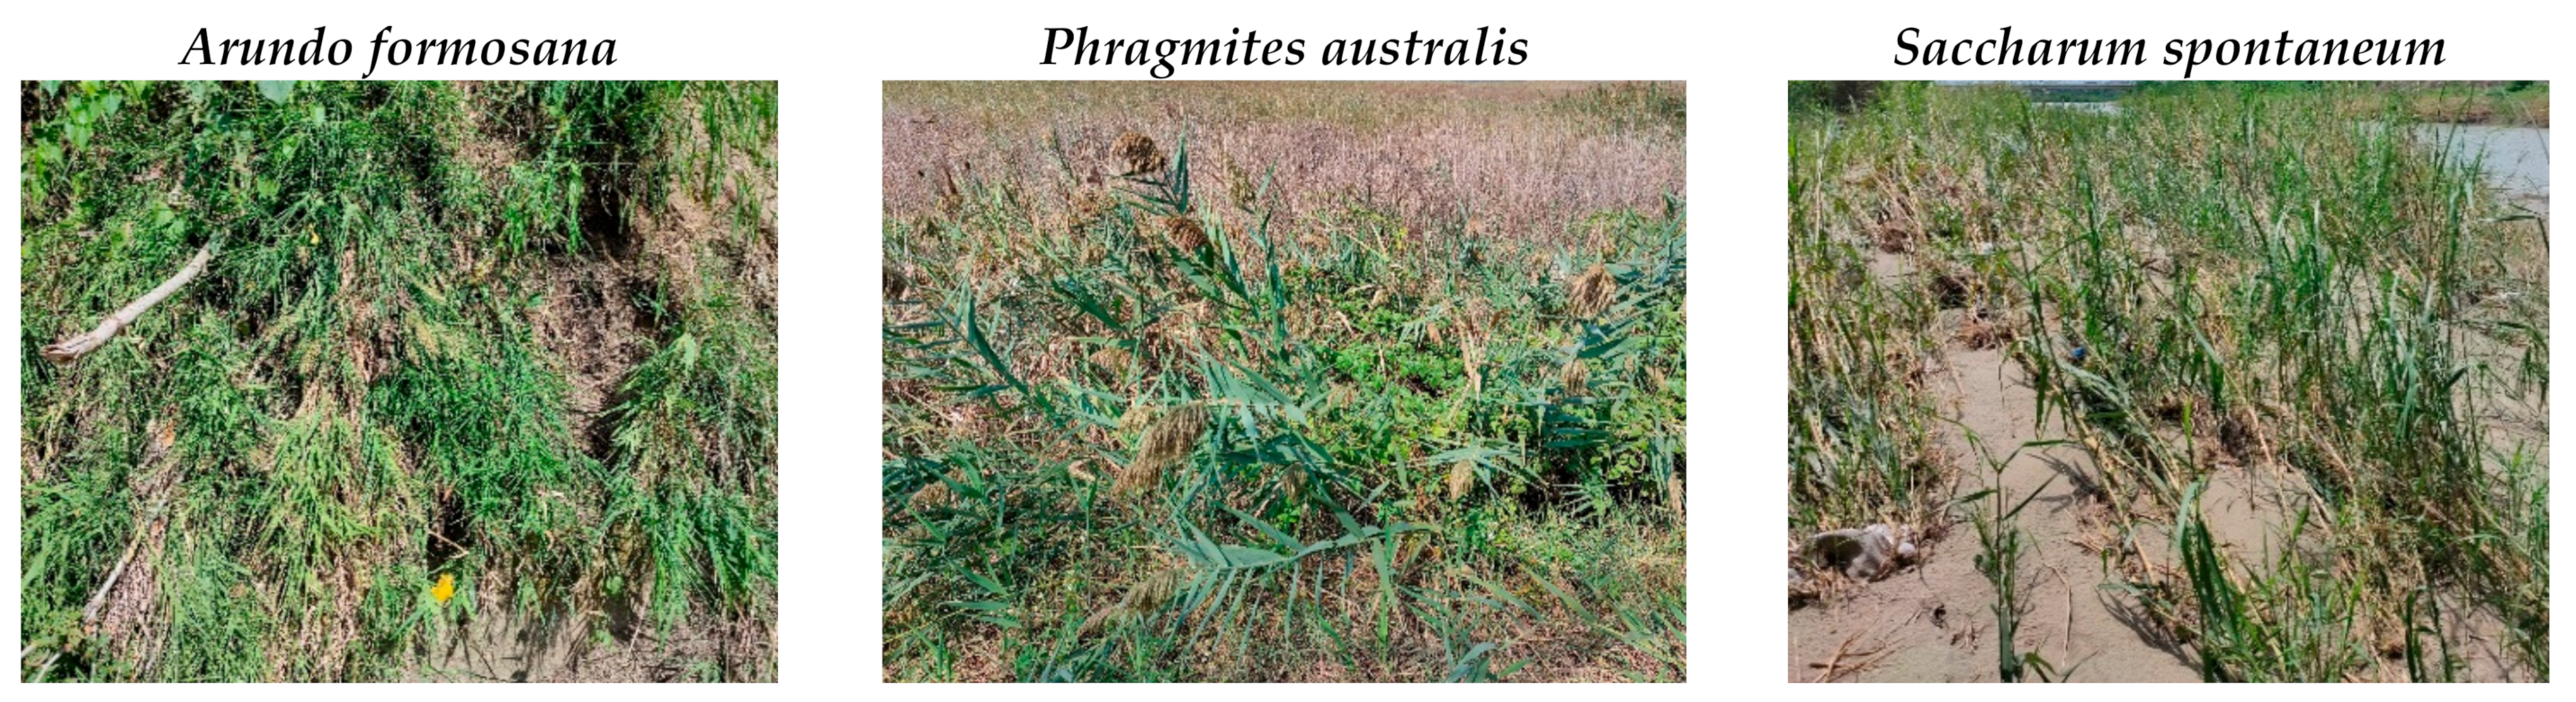
2.1. Plant Sampling and Raising
2.2. Growth Traits
2.3. Vertical Pullout Test
2.4. Root Tensile Test
2.5. Wind Tunnel Test
2.6. Statistical Data Analysis
3. Results
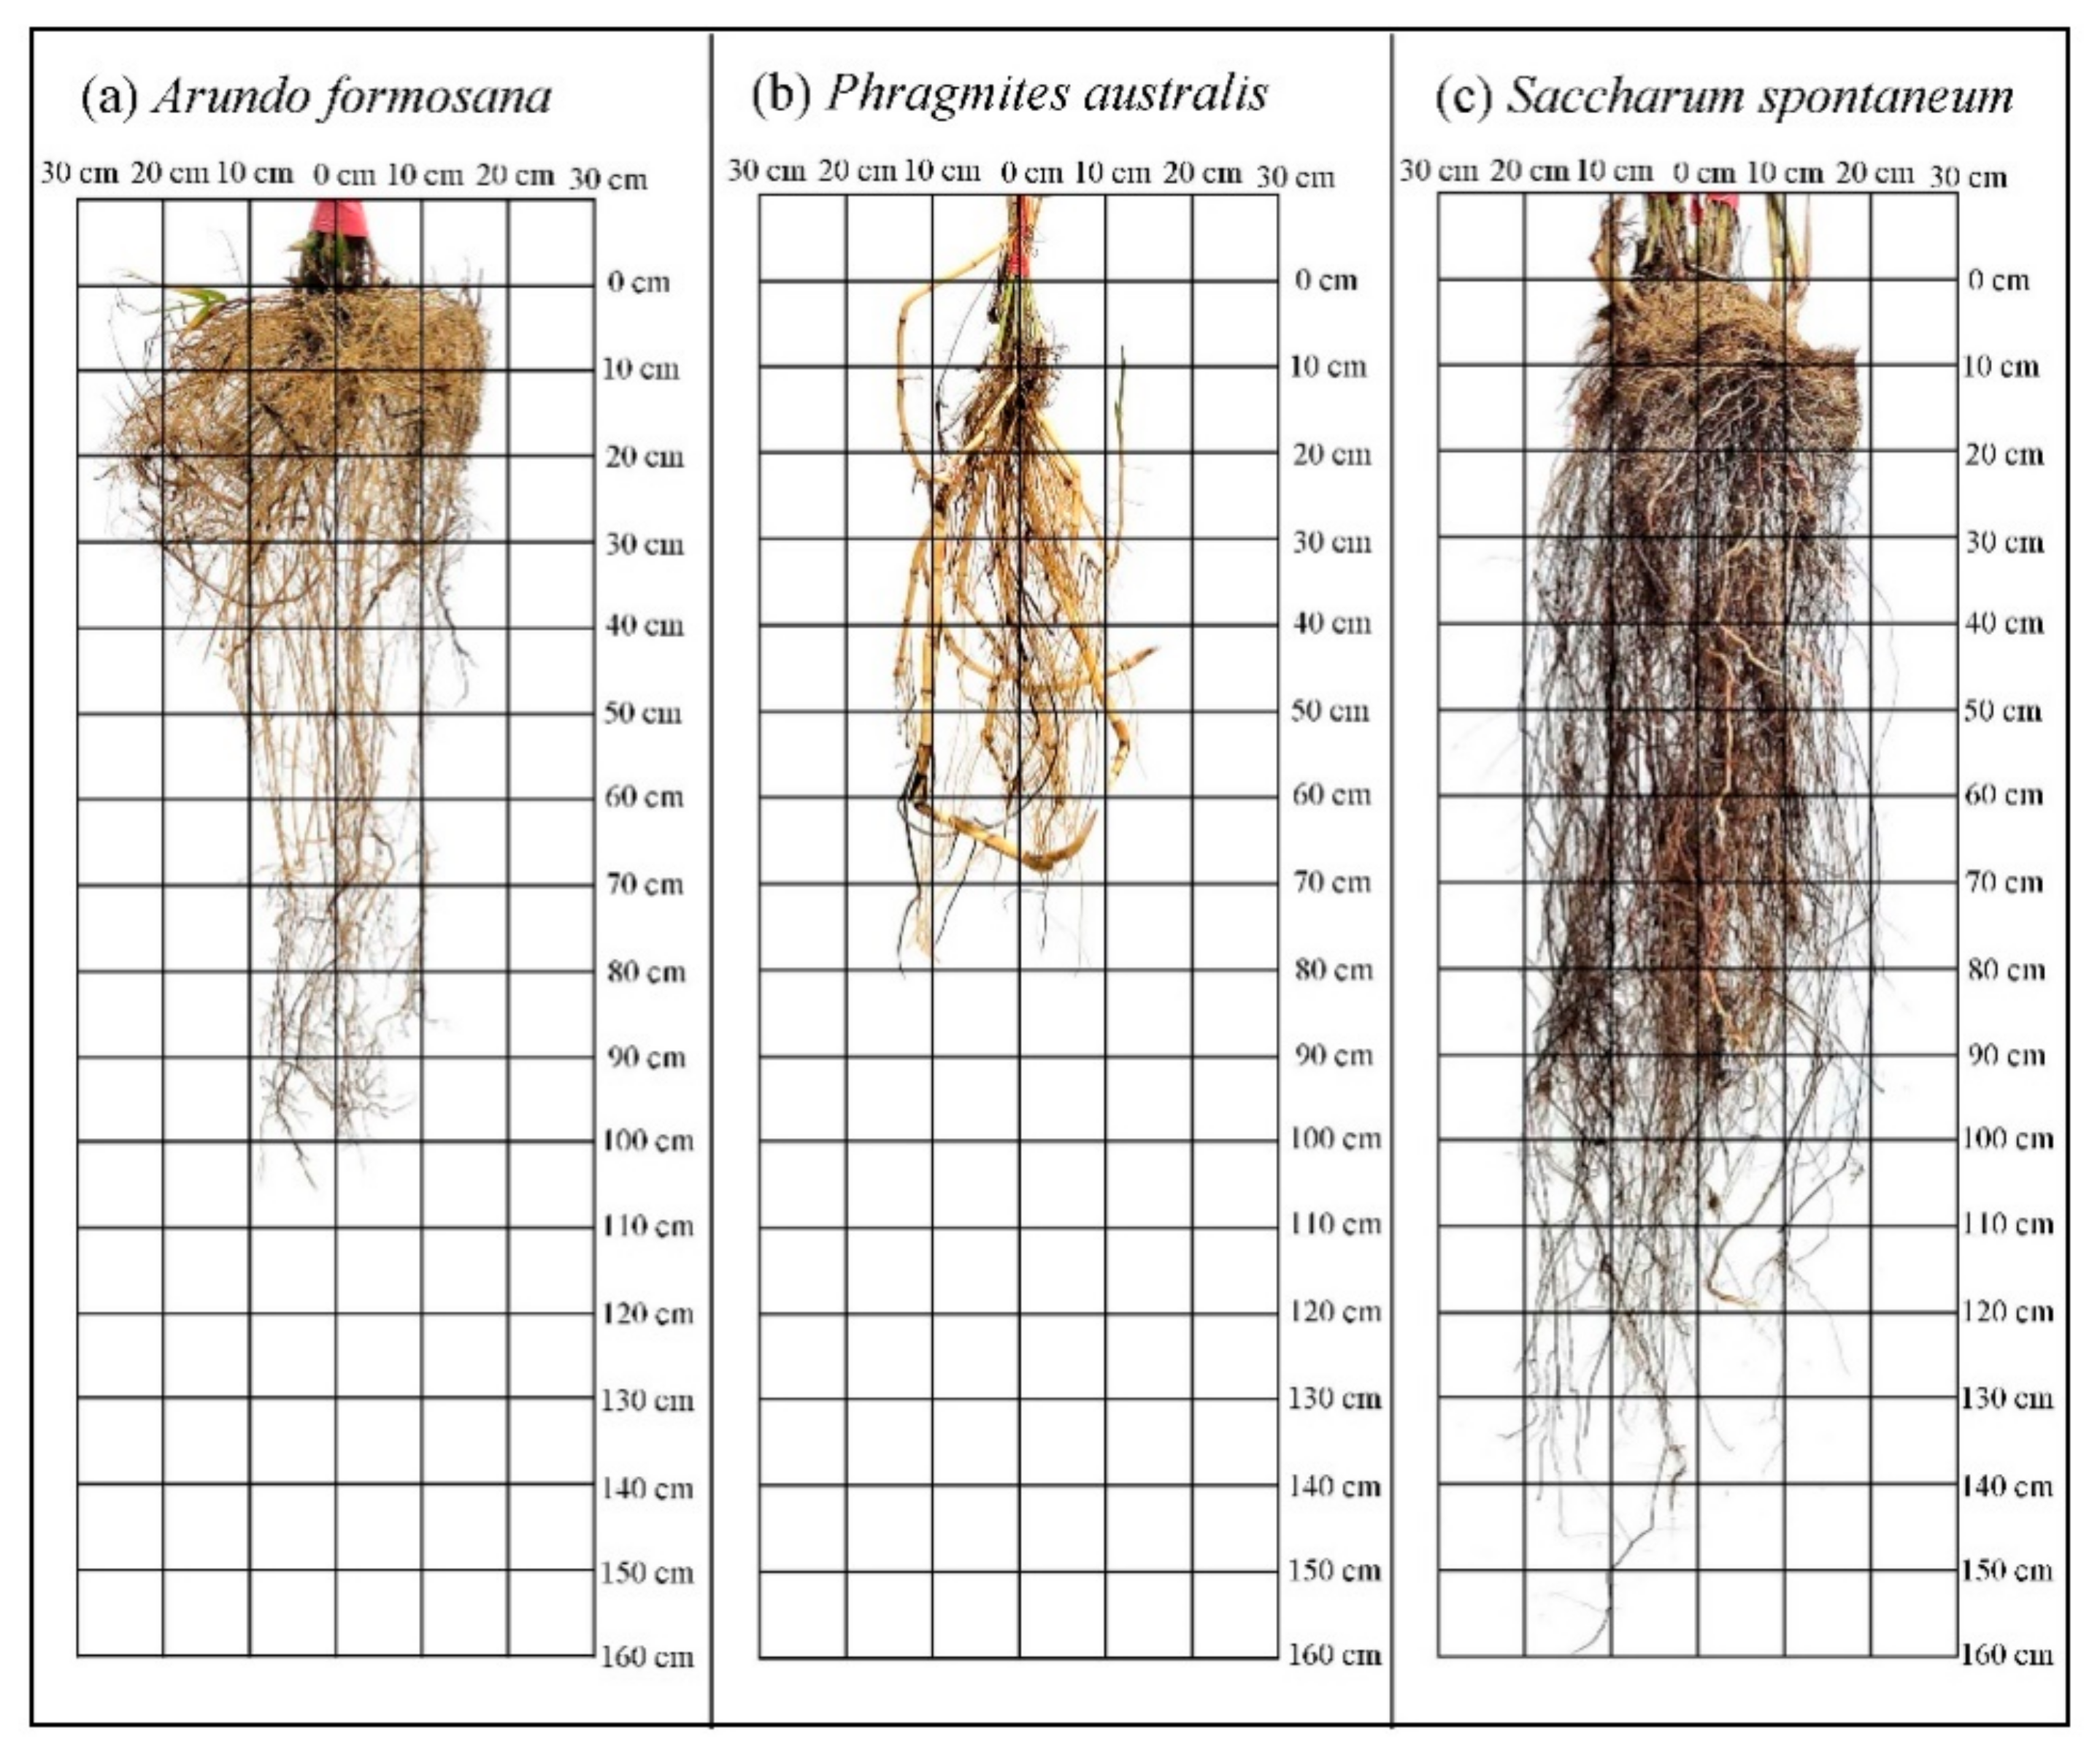
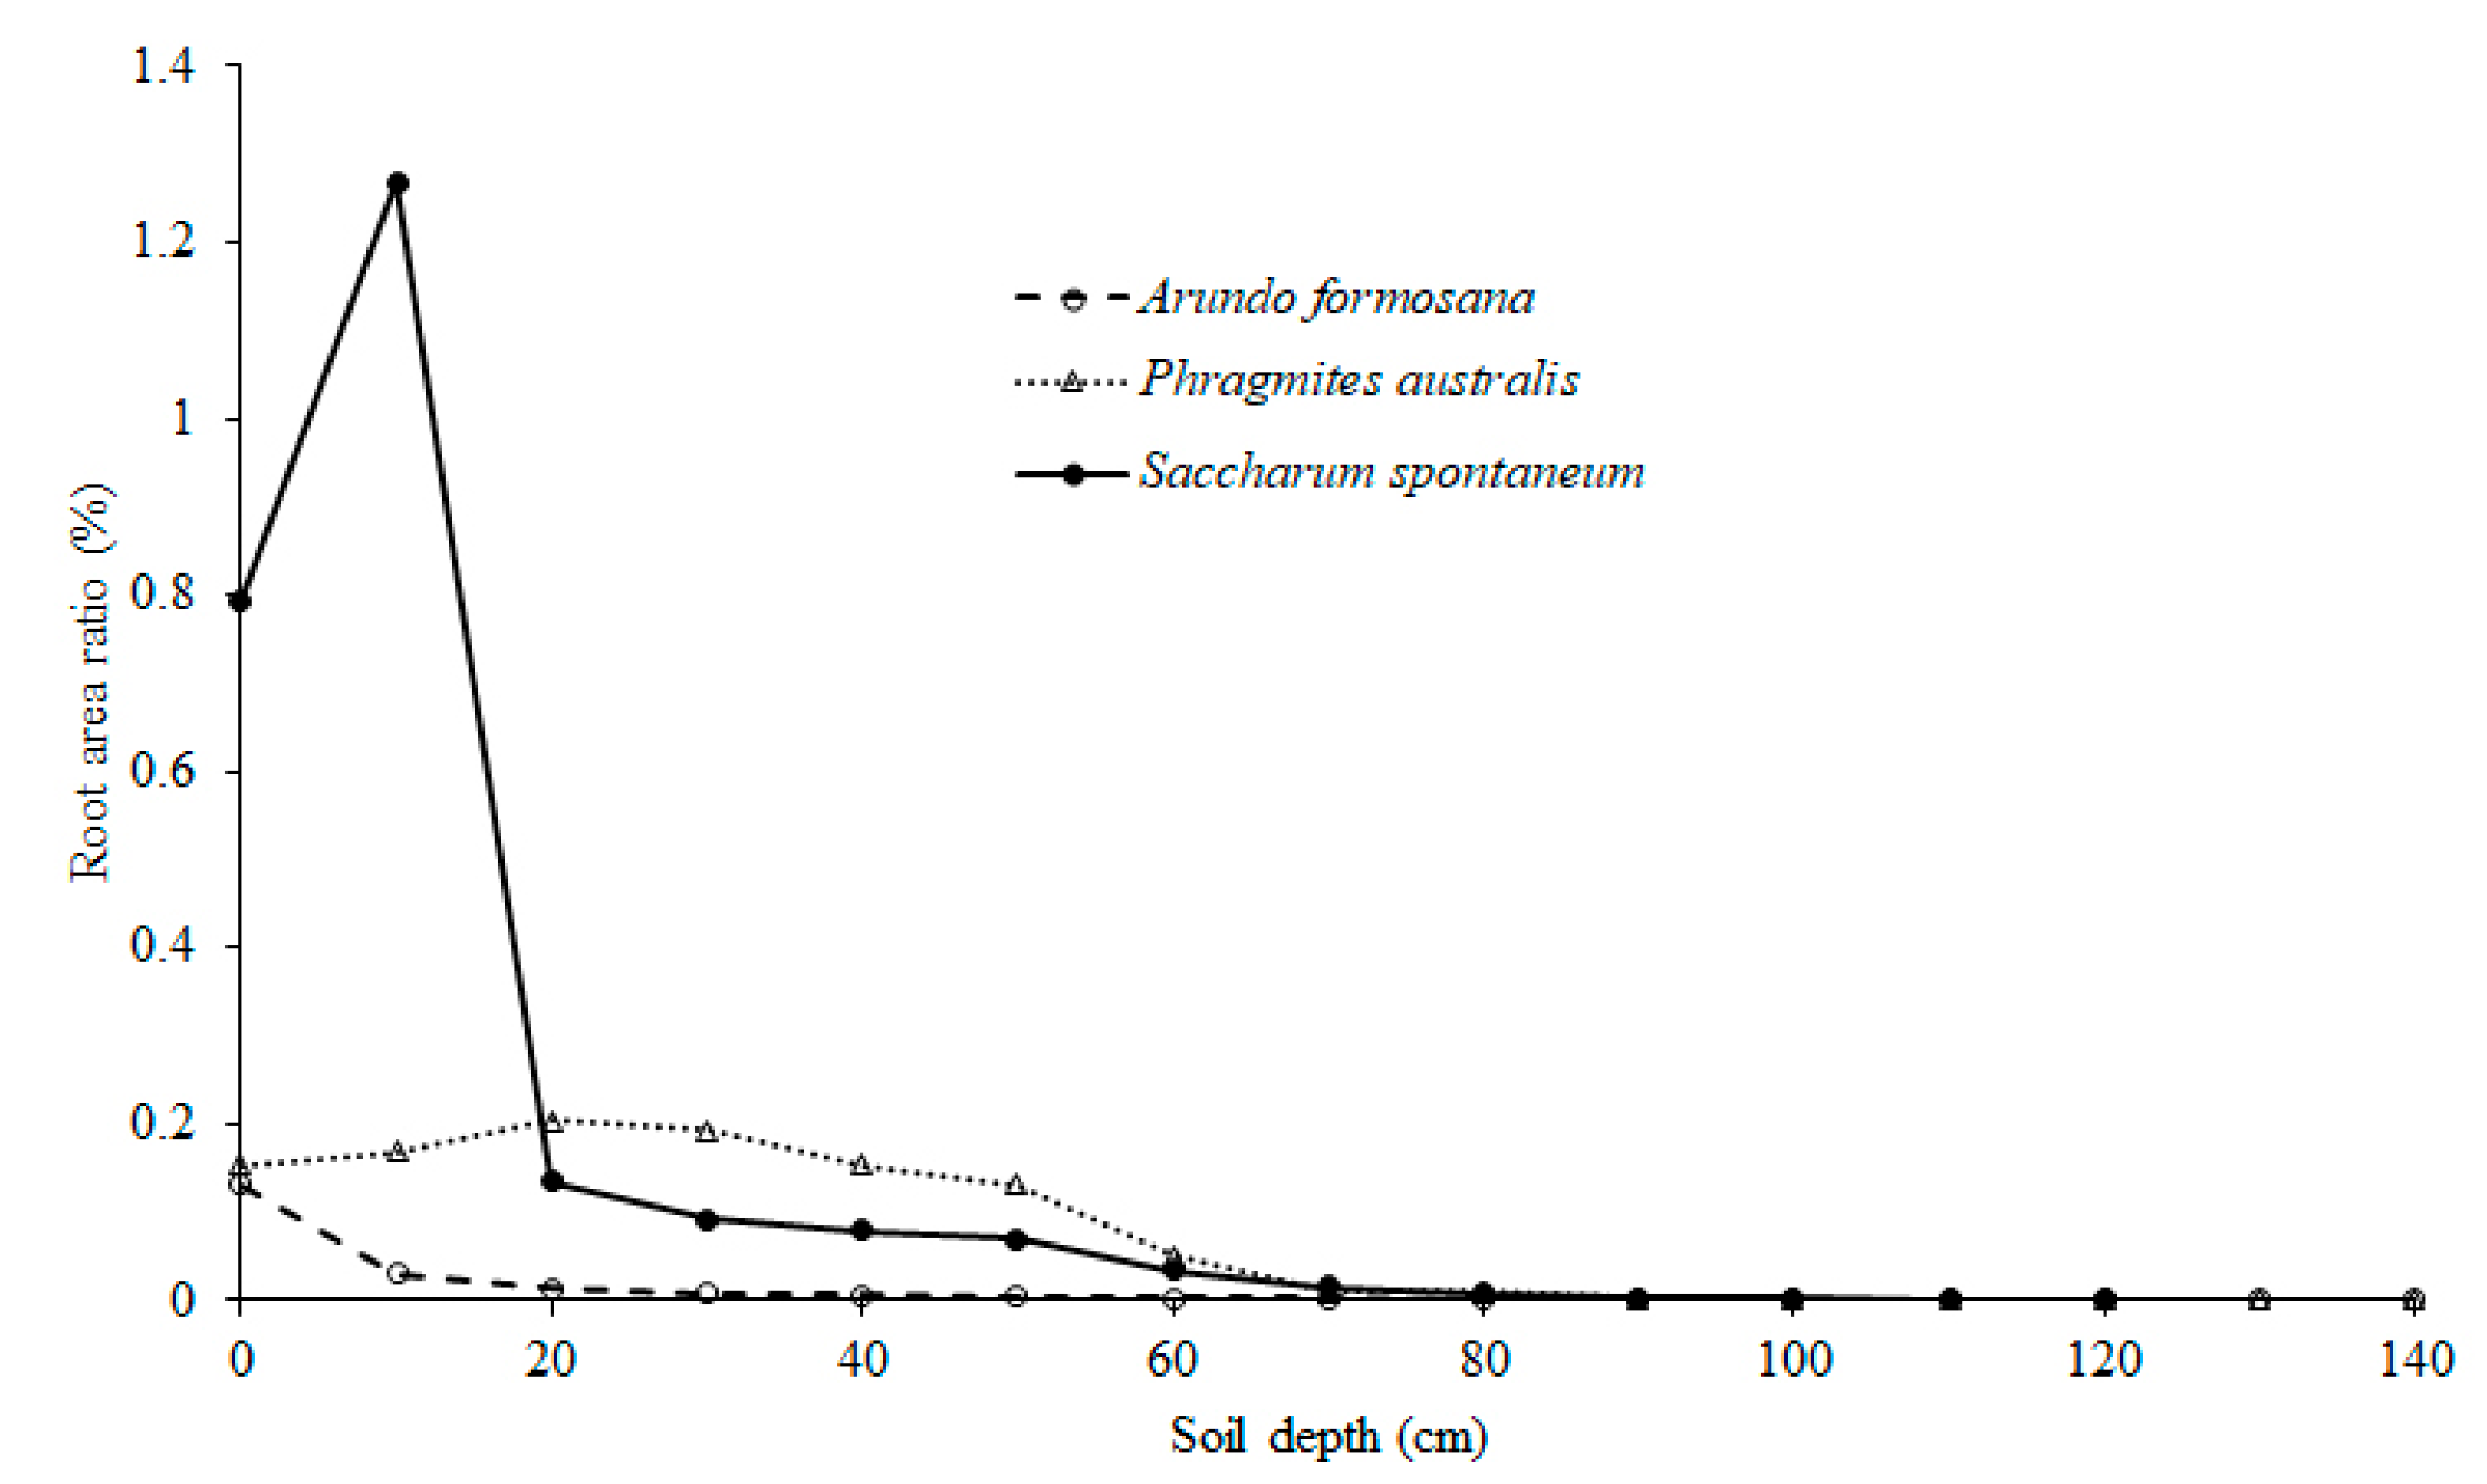
3.1. Growth Traits
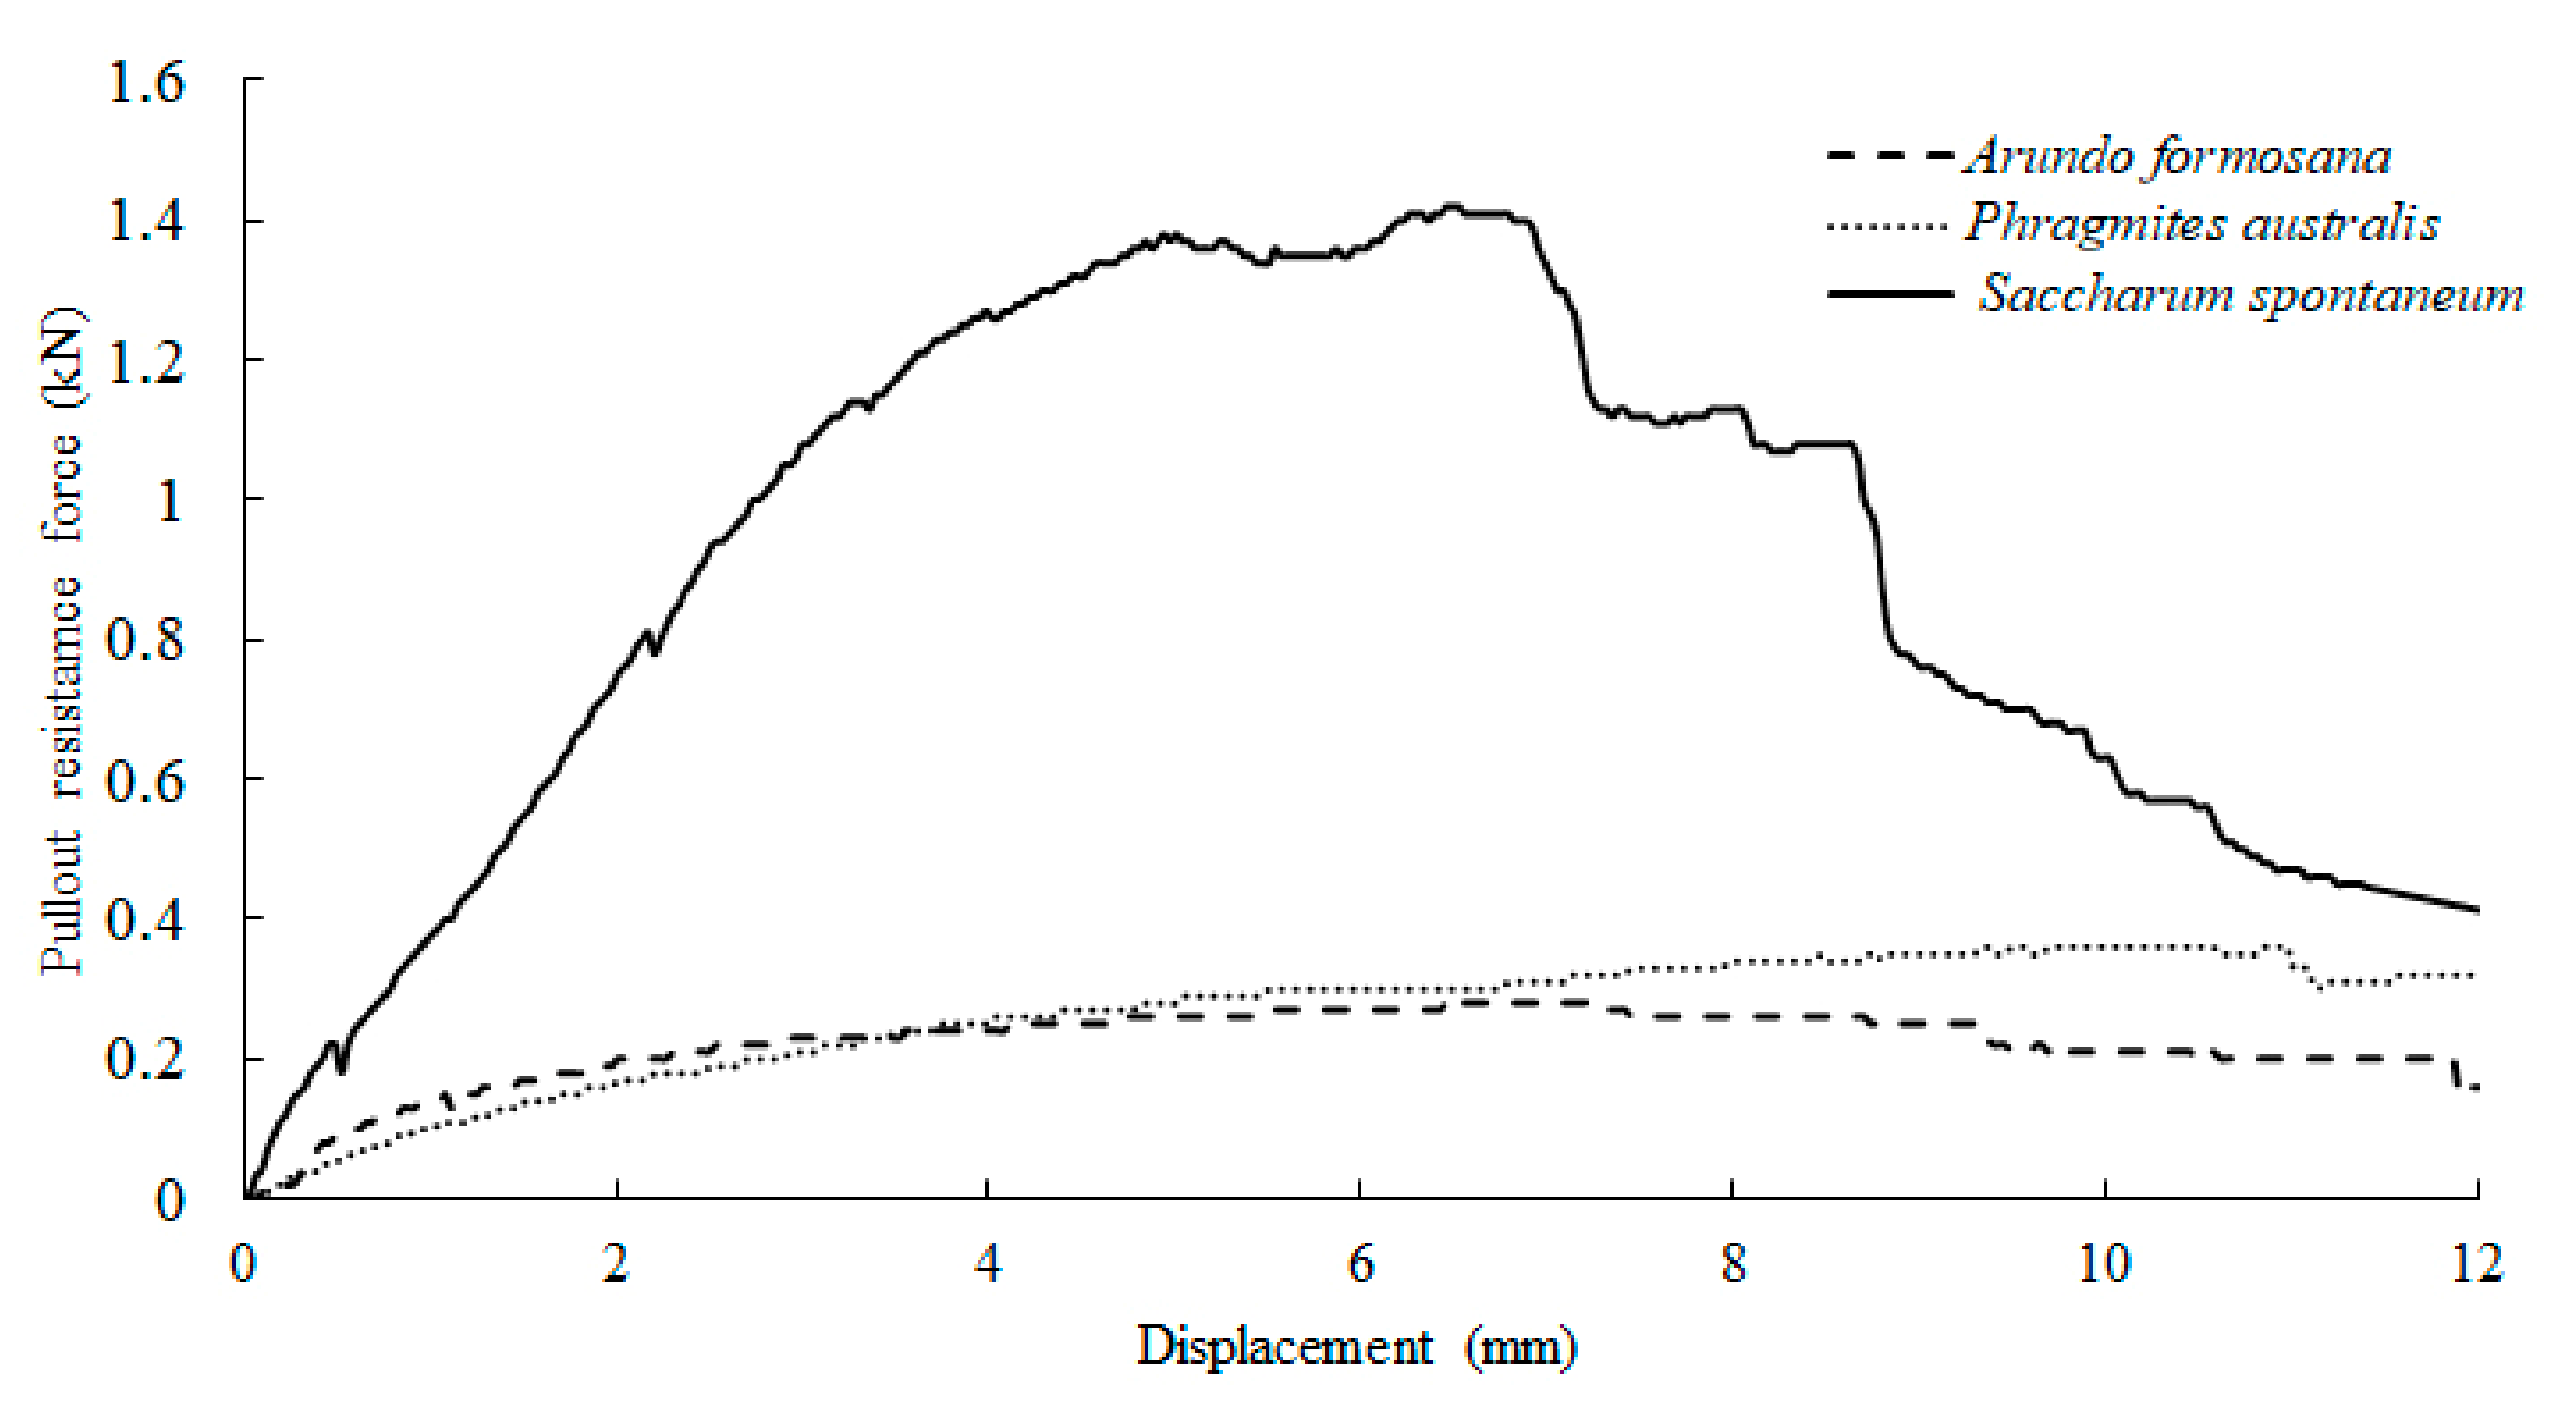
3.2. Pullout Resistance
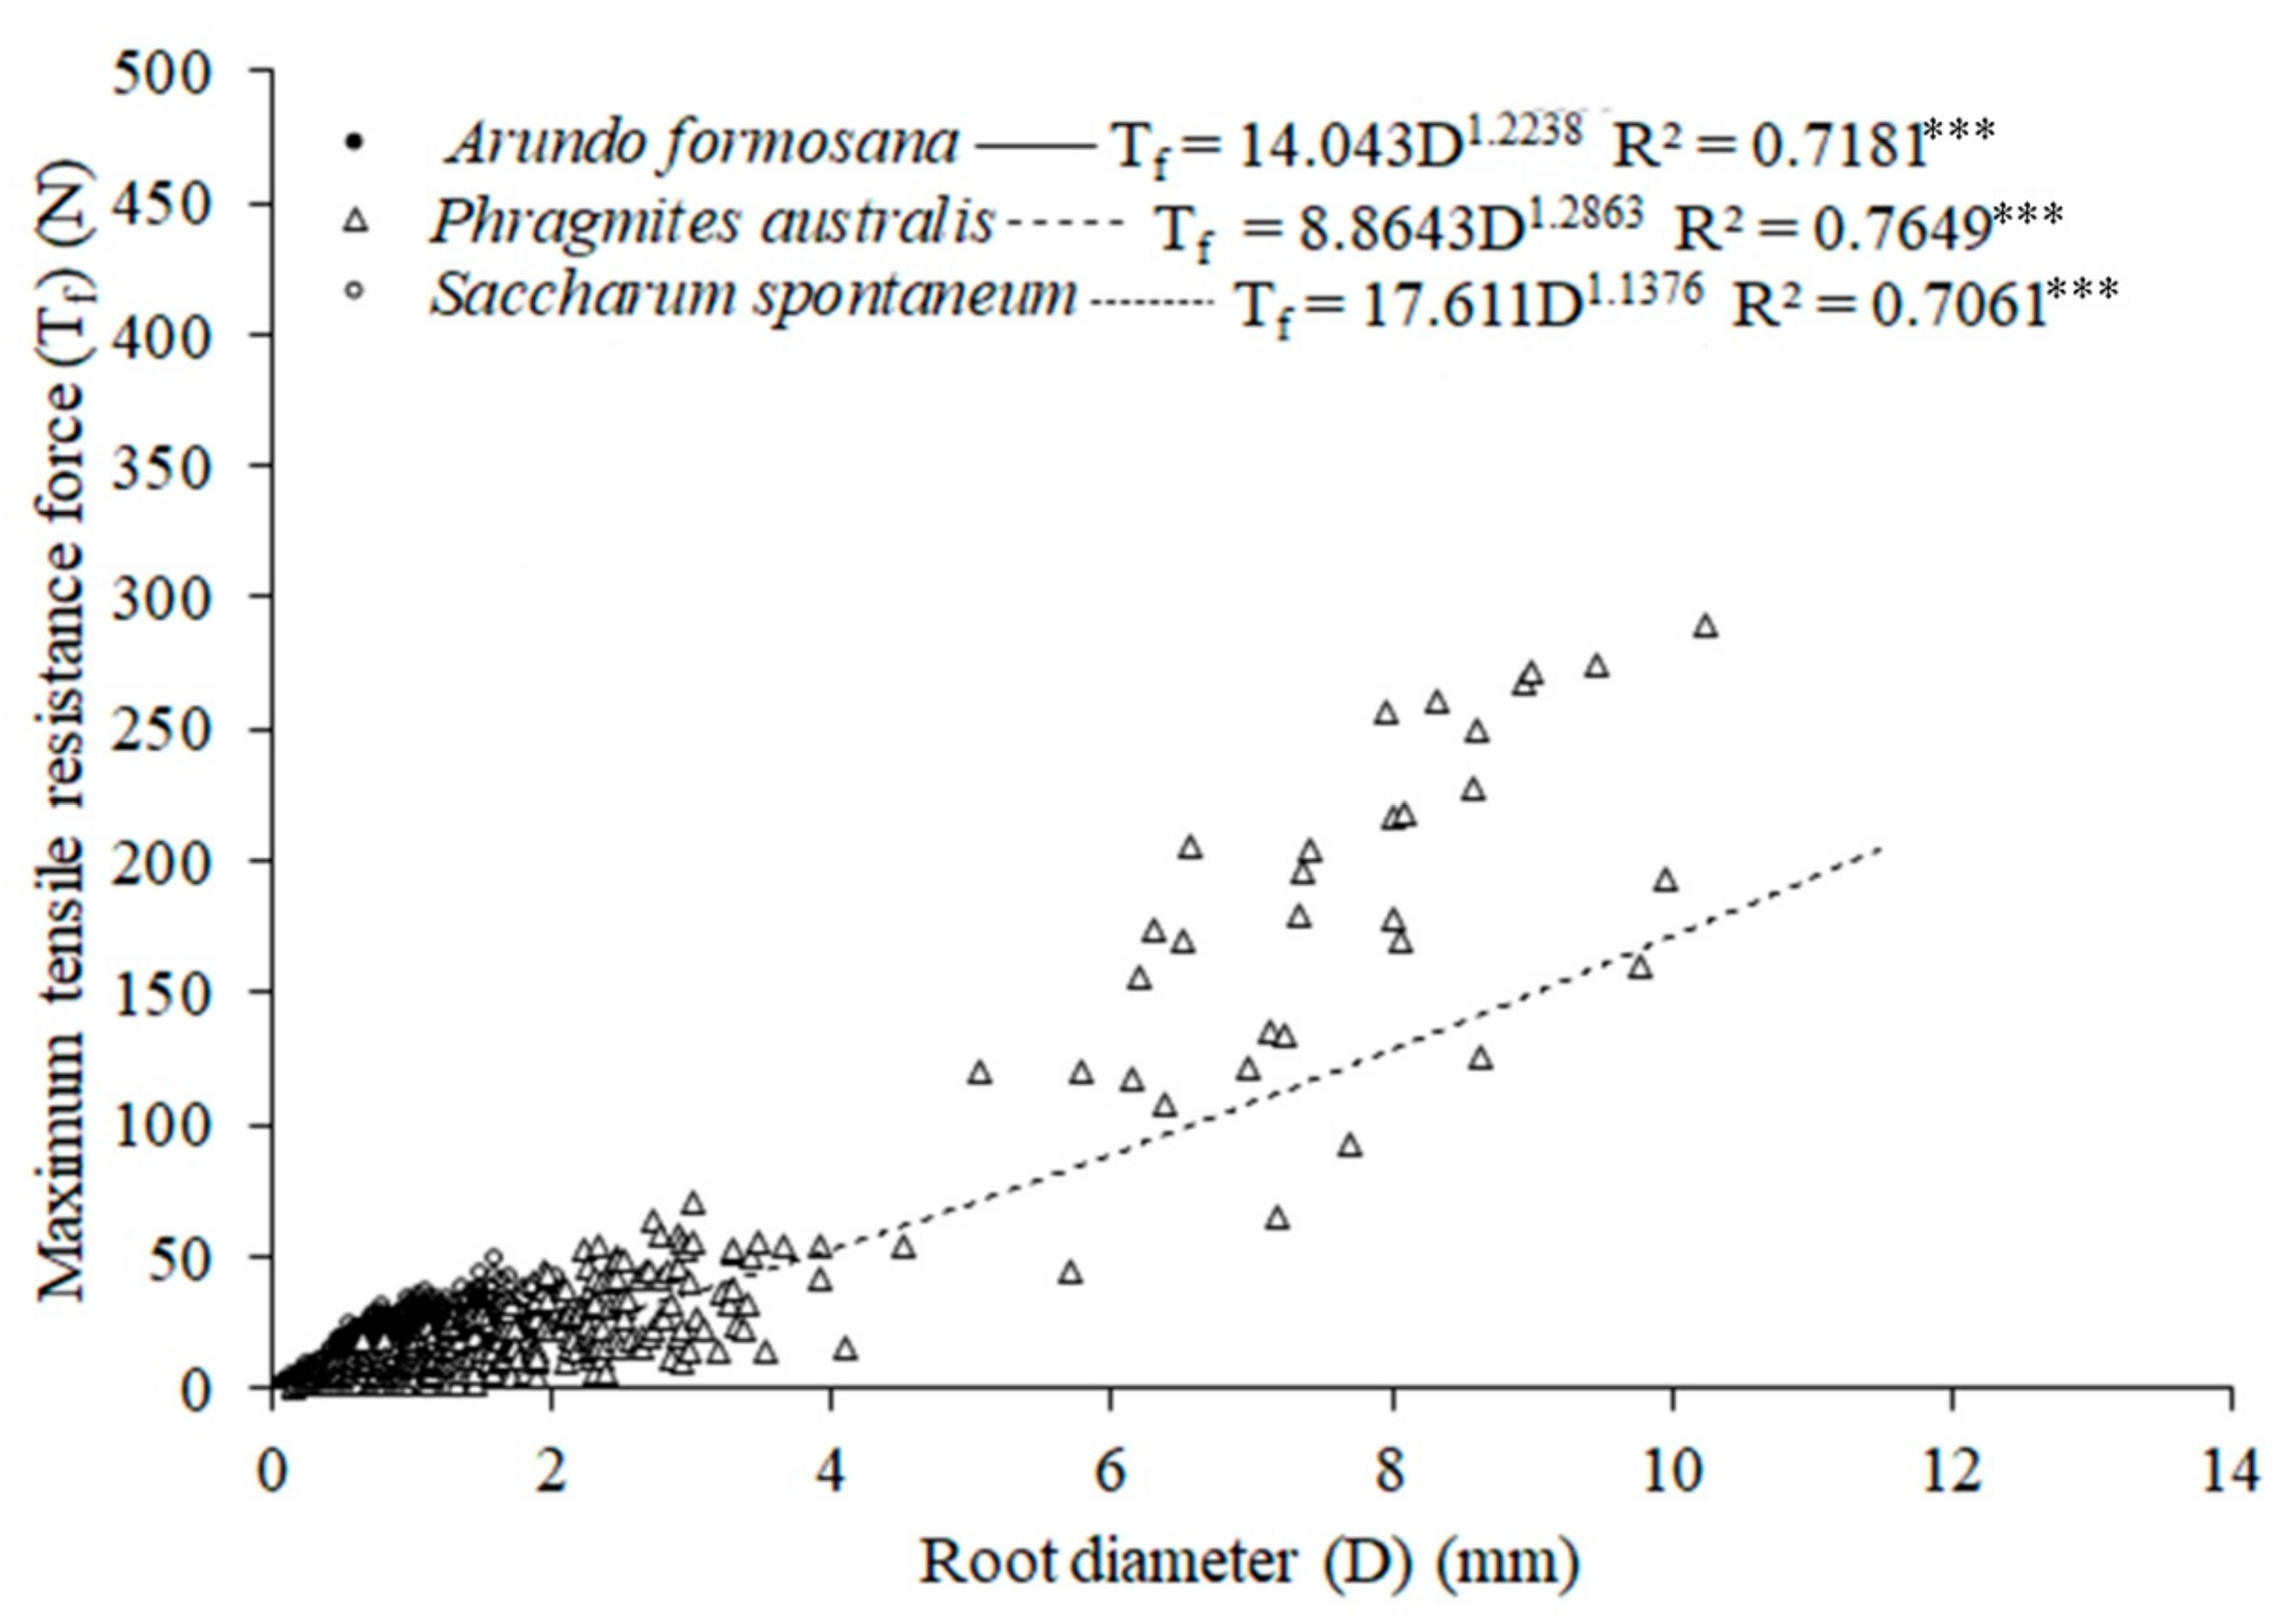
3.3. Root Tensile Strength
3.4. Wind Erosion Resistance
4. Discussion
4.1. Growth Traits
4.2. Pullout Resistance
4.3. Root Tensile Strength
4.4. Wind Erosion Resistance
5. Conclusions
Author Contributions
Funding
Institutional Review Board Statement
Informed Consent Statement
Data Availability Statement
Acknowledgments
Conflicts of Interest
References
- Chang, J.C. Natural hazards in Taiwan. GeoJournal 1996, 38, 251–257. [Google Scholar] [CrossRef]
- Ma, K.F.; Lee, C.T.; Tsai, Y.B.; Shin, T.C.; Mori, J. The Chi-Chi, Taiwan earthquake: Large surface displacements on an inland thrust fault. Trans. Am. Geophys. Union. 2011, 80, 605–611. [Google Scholar] [CrossRef]
- Shih, D.S.; Lai, T.Y.; Hsu, Z.M. Applying biomineralization technology to study the effects of rainfall induced soil erosion. Water 2019, 11, 2555. [Google Scholar] [CrossRef] [Green Version]
- Lin, C.Y.; Tsai, S.F.; Chuang, C.W. Delineation and management of dust emission potential areas on riverbed. J. Chin. Soil Water Conserv. 2008, 39, 367–377. [Google Scholar]
- Lin, C.Y.; Chang, M.I.; Chuang, C.W. Effects of Aeolian dust on the fine airborne particles (PM10) at the estuary of Zhoushui River. J. Chin. Soil Water Conserv. 2009, 41, 285–296. [Google Scholar]
- Syu, J.Y.; Cheng, Y.C.; Kao, Y.Y.; Liang, C.S.; Yan, Y.L.; Lai, C.Y.; Chang, C.T.; Chen, C.C.; Young, C.Y.; Wu, Y.L. The horizontal and vertical characteristics of Aeolian dust from riverbed. Aerosol Air Qual. Res. 2016, 16, 3026–3036. [Google Scholar] [CrossRef] [Green Version]
- Lin, C.Y.; Lee, Y.H.; Kuo, C.Y.; Chen, W.C.; Sheng, Y.F.; Su, C.J. Impact of river dust events on air quality of western Taiwan during winter monsoon: Observed evidence and model simulation. Atmos. Environ. 2018, 192, 160–172. [Google Scholar] [CrossRef]
- Hsieh, T.C.; Ding, Y.; Yeh, K.C.; Jhong, R.K. Investigation of morphological changes in the Tamsui River estuary using an integrated coastal and estuarine processes model. Water 2020, 12, 1084. [Google Scholar] [CrossRef]
- Wainger, L.A.; Secor, D.H.; Gurbisz, C.; Kemp, W.M.; Glibert, P.M.; Houde, E.D.; Richkus, J.; Barber, M.C. Resilience indicators support valuation of estuarine ecosystem restoration under climate change. Ecosyst. Health Sustain. 2017, 3, e01268. [Google Scholar] [CrossRef]
- Mamun, A.A.; Islam, A.R.M.T.; Alam, E.; Pal, S.C.; Alam, G.M.M. Assessing riverbank erosion and livelihood resilience using traditional approaches in northern Bangladesh. Sustainability 2022, 14, 2348. [Google Scholar] [CrossRef]
- Miri, A.; Dragovich, D.; Dong, Z. Vegetation morphologic and aerodynamic characteristics reduce aeolian erosion. Sci Rep. 2017, 7, 12831. [Google Scholar] [CrossRef]
- Capobianco, M.; Stive, M.J.F. Soft intervention technology as a tool for integrated estuary zone management. J. Coast. Conserv. 2000, 6, 33–40. [Google Scholar] [CrossRef]
- Lee, J.T.; Yen, L.Z.; Chu, M.Y.; Lin, Y.S.; Chang, C.C.; Lin, R.S.; Chao, K.H.; Lee, M.J. Growth characteristics and anti-wind erosion ability of three tropical foredune pioneer species for sand dune stabilization. Sustainability 2020, 12, 3353. [Google Scholar] [CrossRef] [Green Version]
- Antunes, C.; Pereira, A.J.; Fernandes, P.; Ramos, M.; Ascensao, L.; Correia1, O.; Maguas, C. Understanding plant drought resistance in a Mediterranean estuary sand dune ecosystem: Differences between native and exotic invasive species. J. Plant Ecol. 2018, 11, 26–38. [Google Scholar] [CrossRef] [Green Version]
- Lissner, J.; Schierup, H.-H. Effects of salinity on the growth of Phragmites australis. Aquatic Botany 1997, 55, 247–260. [Google Scholar] [CrossRef]
- Gandonou, C.; Abrini, J.; Idaomar, M.; Skali-Senhaji, N. Effects of NaCl on growth, ions and proline accumulation in sugarcane (Saccharum sp.) callus culture. Belg. J. Bot. 2005, 138, 173–180. [Google Scholar]
- Zheng, W.J.; Zheng, X.P.; Zhang, C.L. A survey of photosynthetic carbon metabolism in 4 ecotypes of Phragmites australis in northwest China: Leaf anatomy, ultrastructure, and activities of ribulose 1,5-bisphosphate carboxylase, phosphoenolpyruvate carboxylase and glycollate oxidase. Physiol. Plant. 2000, 110, 201–208. [Google Scholar] [CrossRef]
- Hsu, C.C. Poaceae. In Flora of Taiwan, 2nd ed.; Editorial Committee of Flora of Taiwan: Taipei, Taiwan, 2000; Volume 5, pp. 326–574. [Google Scholar]
- Sigren, J.M.; Figlus, J.; Armitage, A.R. Estuary sand dunes and dune vegetation: Restoration, erosion, and storm protection. Shore Beach 2014, 82, 5–12. [Google Scholar]
- Yen, C.P. Tree root patterns and erosion control. In Proceedings of the International Workshop on Soil Erosion and Its Counter-Measures, Chiang Mai, Thailand, 11–19 November 1984; pp. 92–111. [Google Scholar]
- Mickovski, S.B.; van Beek, L.P.H.; Salin, F. Uprooting of vetiver uprooting resistance of vetiver grass (Vetiveria zizanioides). Plant Soil 2005, 278, 33–41. [Google Scholar] [CrossRef]
- Saifuddin, M.; Osman, N.; Rahman, M.M.; Boyce, A.N. Soil reinforcement capability of two legume species from plant morphological traits and mechanical properties. Curr. Sci. 2015, 108, 1340–1347. [Google Scholar]
- Burylo, M.; Rey, F.; Mathys, N.; Dutoit, T. Plant root traits affecting the resistance of soils to concentrated flow erosion. Earth. Surf. Proc. Land. 2012, 37, 1463–1470. [Google Scholar] [CrossRef]
- Hamidifar, H.; Keshavarzi, A.R.; Truong, P. Enhancement of river bank shear strength parameters using Vetiver grass root system. Arab. J. Geosci. 2018, 11, 611. [Google Scholar] [CrossRef]
- Udo, K.; Takewaka, S. Experimental study of blown sand in a vegetated area. J. Coast. Res. 2007, 23, 1175–1182. [Google Scholar] [CrossRef]
- Bouma, T.J.; Nielsen, K.L.; Koutstaal, K. Sample preparation and scanning protocol for computerized analysis of root length and diameter. Plant Soil 2000, 218, 185–196. [Google Scholar] [CrossRef]
- Pang, W.; Crow, W.T.; Luc, J.E.; McSorley, R.; Giblin-Davis, R.M.; Kruse, J.K. Comparison of water displacement and WinRHIZO software for plant root parameter assessment. Plant Dis. 2011, 95, 1308–1310. [Google Scholar] [CrossRef] [Green Version]
- Burylo, M.; Dutoit, T.; Rey, F. Species traits as practical tools for ecological restoration of Marly eroded lands. Restor. Ecol. 2014, 22, 633–640. [Google Scholar] [CrossRef]
- Hales, T.C.; Miniat, C.F. Soil moisture causes dynamic adjustments to root reinforcement that reduce slope stability. Earth Surf. Process Landforms 2017, 42, 803–813. [Google Scholar] [CrossRef] [Green Version]
- Lee, J.T.; Yen, L.Z.; Lee, M.J. Wind affects the growth, root anchorage and tensile strength of Australian pine (Casuarina equisetifolia) seedlings. J. For. Res. 2019, 24, 219–229. [Google Scholar] [CrossRef]
- Bischetti, G.B.; Chiaradia, E.A.; Simonato, T.; Speziali, B.; Vitali, B.; Vullo, P.; Zocco, A. Root strength and root area ratio of forest species in Lombardy (Northern Italy). Plant Soil 2005, 278, 11–22. [Google Scholar] [CrossRef]
- Lee, J.T.; Chu, M.Y.; Lin, Y.S.; Kung, K.N.; Lin, W.C.; Lee, M.J. Root traits and biomechanical properties of three tropical pioneer tree species for forest restoration in landslide areas. Forests 2020, 11, 179. [Google Scholar] [CrossRef] [Green Version]
- Chimungu, J.G.; Loades, K.W.; Lynch, J.P. Root anatomical phenes predict root penetration ability and biomechanical properties in maize (Zea mays). J. Exp. Bot. 2015, 66, 3151–3162. [Google Scholar] [CrossRef] [PubMed] [Green Version]
- Yang, Y.; Chen, L.; Li, N.; Zhang, Q. Effect of root moisture content and diameter on root tensile properties. PLoS ONE 2016, 11, e0151791. [Google Scholar]
- Lee, F.C.; Yu, J.L.; Chiang, W.S.; Wen, J.T. Field measurements of aeolian sand transport at Yunlin estuary area. In Proceedings of the 25th Ocean Engineering Conference, October 2003; National Taiwan Ocean University: Keelung, Taiwan, 2003; pp. 677–684. Available online: http://www.tsoe.org.tw/downloads/thesis/2003D2.pdf (accessed on 20 February 2022).
- Tsakaldimi, M.; Ganatsas, P.; Jacobs, D.F. Prediction of planted seedling survival of five Mediterranean species based on initial seedling morphology. New For. 2013, 44, 327–339. [Google Scholar] [CrossRef]
- Ramirez-Valiente, J.-A.; Aranda, I.; Sanchez-Gomez, D.; Rodriguez-Calcerrada, J.; Valladares, F.; Robson, T.M. Increased root investment can explain the high survival of seedlings of mesic Quercus suber than xeric Quercus ilex in sandy soils during a summer drought. Tree Physiol. 2018, 39, 64–75. [Google Scholar]
- Chou, C.H.; Lee, Y.E.; Chiu, C.Y.; Wang, Y.C.; Hsu, F.H. Population study of Miscanthus IV. Growth performance and their acclimation to temperature and water stresses. Bot. Bull. Academia Sinica 1991, 32, 57–96. [Google Scholar]
- Truong, P.; Loch, R. Vetiver system for erosion and sediment control. In Proceedings of the 13th International Soil Conservation Organization Conference, Brisbane, Australia, 4–8 July 2004; pp. 1–6. [Google Scholar]
- Reubens, B.; Poesen, J.; Danjon, F.; Geudens, G.; Muys, B. The role of fine and coarse roots in shallow slope stability and soil erosion control with a focus on root system architecture: A review. Trees-Struct. Funct. 2007, 21, 385–402. [Google Scholar] [CrossRef]
- Wasson, A.; Richards, R.; Chatrath, R.; Misra, S.; Prasad, S.S.; Rebetzke, G.; Kirkegaard, J.; Christopher, J.; Watt, M. Traits and selection strategies to improve root systems and water uptake in water-limited wheat crops. J. Exp. Bot. 2012, 63, 3485–3498. [Google Scholar] [CrossRef] [Green Version]
- Kiba, T.; Krapp, A. Plant nitrogen acquisition under low availability: Regulation of uptake and root architecture. Plant Cell Physiol. 2016, 57, 707–714. [Google Scholar] [CrossRef] [Green Version]
- Comas, L.H.; Becker, S.R.; Cruz, V.M.V.; Byrne, P.F.; Dierig, D.A. Root traits contributing to plant productivity under drought. Front. Plant Sci. 2013, 4, 442. [Google Scholar] [CrossRef] [Green Version]
- Kramer-Walter, K.R.; Bellingham, P.J.; Millar, T.R.; Smissen, R.D.; Richardson, S.J.; Laughlin, D.C. Root traits are multidimensional: Specific root length is independent from root tissue density and the plant economic spectrum. J. Ecol. 2016, 104, 1299–1310. [Google Scholar] [CrossRef]
- Whalley, W.R.; Zhang, X.; Whalley, P.A.; Ashton, R.W.; Evans, J.; Hawkesford, M.J.; Griffiths, G.; Huang, Z.D.; Zhou, H.; Mooney, S.J. A comparison between water uptake and root length density in winter wheat: Effects of root density and rhizosphere properties. Plant Soil 2020, 451, 345–356. [Google Scholar]
- Burylo, M.; Rey, F.; Roumet, C.; Buisson, E.; Dutoit, T. Linking plant morphological traits to uprooting resistance in eroded marly lands (Southern Alps, France). Plant Soil 2009, 324, 31–42. [Google Scholar] [CrossRef]
- Osman, N.; Abdullah, M.N. Pull-out and tensile strength properties of two selected tropical trees. Sanin Malaysiana 2011, 40, 577–585. [Google Scholar]
- Tosi, M. Root tensile strength relationships and their slope stability implications of three shrub species in Northern Apennines (Italy). Geomorphology 2007, 87, 268–283. [Google Scholar] [CrossRef]
- Preti, F.; Giadrossica, F. Root reinforcement and slope bioengineering stabilization by Spanish Broom (Spartium junceum L.). Hydrol. Earth Syst. Sci. 2009, 13, 1713–1726. [Google Scholar] [CrossRef] [Green Version]
- Operstein, V.; Frydnan, S. The influence of vegetation on soil strength. Ground Improv. 2000, 4, 81–89. [Google Scholar] [CrossRef]
- Lateh, H.; Avani, N.; Bibalani, G.H. Tensile strength and root distribution of Acacia magium and Macaranga tanarius at spatial variation (Case study: East-West highway, Malaysia). Int. J. Biosci. 2015, 6, 18–28. [Google Scholar]
- Genet, M.; Stokes, A.; Salin, F.; Mickovski, S.B. The influence of cellulose content on tensile strength in tree roots. Plant Soil 2005, 278, 1–9. [Google Scholar] [CrossRef]
- Zhang, C.B.; Chen, L.H.; Jiang, J. Why fine tree roots are stronger than thicker roots: The role of cellulose and lignin in relation to slope stability. Geomorphology 2014, 206, 196–202. [Google Scholar] [CrossRef]
- Daniela Ciccarelli, D.; Bona, C. Exploring the functional strategies adopted by coastal plants along an ecological gradient using morpho-functional traits. Estuaries Coasts 2022, 45, 114–129. [Google Scholar] [CrossRef]
- Hong, C.; Liu, C.; Zou, X.; Li, H.; Kang, L.; Liu, B.; Li, J. Wind erosion rate for vegetated soil cover: A prediction model based on surface shear strength. Catena 2020, 187, 104398. [Google Scholar] [CrossRef]
- Liu, B.; Liu, Z.; Wang, L. The colonization of active sand dunes by rhizomatous plants through vegetative propagation and its role in vegetation restoration. Ecol. Eng. 2012, 44, 344–347. [Google Scholar] [CrossRef] [Green Version]


| Growth Parameters | A. formosana | P. australis | S. spontaneum | ANOVA (F) |
|---|---|---|---|---|
| H (cm) | 83.75 ± 4.81 c | 177.92 ± 13.14 b | 375.83 ± 16.91 a | 138.448 *** |
| Sbd (mm) | 6.23 ± 0.26 b | 6.84 ± 0.55 b | 11.91 ± 0.32 a | 61.586 *** |
| RT | 1421.42 ± 240.01 a | 1226.33 ± 212.61 a | 1813.75 ± 156.68 a | 2.108 ns |
| TRL (m) | 31.91 ± 4.54 b | 22.34 ± 2.84 c | 39.32 ± 3.65 a | 5.177 ** |
| Rb (g) | 82.58 ± 15.76 b | 36.25 ± 6.43 b | 217.33 ± 23.09 a | 32.250 *** |
| Sb (g) | 72.17 ± 10.73 b | 61.58 ± 6.39 b | 427.33 ± 40.39 a | 72.747 *** |
| Root Traits | A. formosana | P. australis | S. spontaneum | ANOVA (F) |
|---|---|---|---|---|
| RD (kg m−3) | 1.53 ± 0.29 b | 0.67 ± 0.12 b | 4.02 ± 0.43 a | 32.250 *** |
| RLD (km m−3) | 0.59 ± 0.08 a | 0.41 ± 0.05 b | 0.73 ± 0.07 a | 5.177 * |
| RSA (cm2) | 2973.47 ± 466.77 b | 1995.13 ± 241.06 b | 5276.63 ± 442.11 a | 18.061 *** |
| RTD (g cm−3) | 0.23 ± 0.02 a | 0.09 ± 0.01 b | 0.20 ± 0.01 a | 18.402 *** |
| RV (cm3) | 343.75 ± 46.82 b | 400.83 ± 72.38 b | 1085.42 ± 83.52 a | 35.469 *** |
| SRL (m g−1) | 0.54 ± 0.12 a | 0.85 ± 0.16 a | 0.21 ± 0.03 b | 7.354 ** |
| SRA (m2 g−1) | 0.0047 ± 0.001 a | 0.0049 ± 0.001 a | 0.0027 ± 0.01 b | 7.334 ** |
| Biomechanical Properties | A. formosana | P. australis | S. spontaneum | One-Way ANOVA (F) |
|---|---|---|---|---|
| Maximal pullout resistance (kN) | 0.28 ± 0.07 b | 0.36 ± 0.68 b | 1.44 ± 0.35 a | 63.775 *** |
| Morphological Traits | Species | Regression Equation | R2 | p |
|---|---|---|---|---|
| TRL (cm) | A. formosana | Pr = 0.009TRL − 0.691 | 0.329 | 0.051 |
| P. australis | Pr = 0.008TRL + 18.284 | 0.02 | 0.295 | |
| S. spontaneum | Pr = 0.019TRL + 68.499 | 0.43 * | 0.012 | |
| RLD (km/m3) | A. formosana | Pr = 48.297RLD − 0.706 | 0.33 | 0.051 |
| P. australis | Pr = 42.64RLD + 18.285 | 0.02 | 0.295 | |
| S. spontaneum | Pr = 104.089RLD + 68.473 | 0.45 * | 0.010 |
| Root Parameters | A. formosana | P. australis | S. spontaneum | One-Way ANOVA (F) |
|---|---|---|---|---|
| Root diameter (mm) | 0.81 ± 0.02 c | 2.08 ± 0.11 a | 0.92 ± 0.02 b | 126.01 *** |
| Tensile resistance force (N) | 11.70 ± 0.38 c | 32.33 ± 2.90 a | 17.09 ± 0.39 b | 36.15 *** |
| Tensile strength (MPa) | 26.02 ± 0.99 b | 12.19 ± 0.61 c | 32.51 ± 1.08 a | 117.74 *** |
| Species | Leeward Soil Surface Wind Speed (m s−1) | |||
|---|---|---|---|---|
| Vegetation Cover | ||||
| 0% | 20% | 40% | 60% | |
| A. formosana | 2.99 ± 0.09 a | 2.17 ± 0.08 a | 1.61 ± 0.07 b | 0.29 ± 0.03 c |
| P. australis | 2.99 ± 0.09 a | 1.90 ± 0.02 b | 1.63 ± 0.02 b | 1.02 ± 0.02 b |
| S. spontaneum | 2.99 ± 0.09 a | 1.97 ± 0.03 b | 1.80 ± 0.04 a | 1.21 ± 0.08 a |
| Species | Leeward Soil Surface Wind Speed (m s−1) | |||
|---|---|---|---|---|
| Vegetation Cover | ||||
| 0% | 20% | 40% | 60% | |
| A. formosana | 5.62 ± 0.07 a | 3.32 ± 0.10 a | 2.73 ± 0.06 a | 0.97 ± 0.06 c |
| P. australis | 5.62 ± 0.07 a | 3.05 ± 0.04 b | 2.45 ± 0.03 b | 1.96 ± 0.03 a |
| S. spontaneum | 5.62 ± 0.07 a | 2.39 ± 0.04 c | 2.07 ± 0.06 c | 1.45 ± 0.06 b |
| Species | Wind Erosion Rate (g m−2 s−1) | |||
|---|---|---|---|---|
| Vegetation Cover | ||||
| 0% | 20% | 40% | 60% | |
| A. formosana | 17.87 ± 0.26 a | 4.63 ± 0.1 c | 1.02 ± 0.04 b | 0.24 ± 0.01 c |
| P. australis | 17.87 ± 0.26 a | 7.43 ± 0.05 a | 3.29 ± 0.08 a | 0.46 ± 0.02 b |
| S. spontaneum | 17.87 ± 0.26 a | 6.41 ± 0.08 b | 0.72 ± 0.03 c | 0.53 ± 0.02 a |
| Species | Wind Erosion Rate (g m−2 s−1) | |||
|---|---|---|---|---|
| Vegetation Cover | ||||
| 0% | 20% | 40% | 60% | |
| A. formosana | 38.79 ± 0.23 a | 21.73 ± 0.35 a | 6.95 ± 0.09 c | 1.30 ± 0.03 c |
| P. australis | 38.79 ± 0.23 a | 22.22 ± 0.25 a | 19.89 ± 0.30 a | 12.49 ± 0.47 a |
| S. spontaneum | 38.79 ± 0.23 a | 17.51 ± 0.30 b | 10.21 ± 0.25 b | 4.23 ± 0.16 b |
Publisher’s Note: MDPI stays neutral with regard to jurisdictional claims in published maps and institutional affiliations. |
© 2022 by the authors. Licensee MDPI, Basel, Switzerland. This article is an open access article distributed under the terms and conditions of the Creative Commons Attribution (CC BY) license (https://creativecommons.org/licenses/by/4.0/).
Share and Cite
Lee, J.-T.; Shih, C.-Y.; Wang, J.-T.; Liang, Y.-H.; Hsu, Y.-S.; Lee, M.-J. Root Traits and Erosion Resistance of Three Endemic Grasses for Estuarine Sand Drift Control. Sustainability 2022, 14, 4672. https://doi.org/10.3390/su14084672
Lee J-T, Shih C-Y, Wang J-T, Liang Y-H, Hsu Y-S, Lee M-J. Root Traits and Erosion Resistance of Three Endemic Grasses for Estuarine Sand Drift Control. Sustainability. 2022; 14(8):4672. https://doi.org/10.3390/su14084672
Chicago/Turabian StyleLee, Jung-Tai, Cheng-Ying Shih, Jia-Tsung Wang, You-Hua Liang, Yu-Shan Hsu, and Ming-Jen Lee. 2022. "Root Traits and Erosion Resistance of Three Endemic Grasses for Estuarine Sand Drift Control" Sustainability 14, no. 8: 4672. https://doi.org/10.3390/su14084672