Article

To Adopt CCU Technology or Not? An Evolutionary Game between Local Governments and Coal-Fired Power Plants

1
Guangzhou Institute of Energy Conservation, Chinese Academy of Sciences, Guangzhou 510640, China
2
The Key Laboratory of Renewable Energy, Chinese Academy of Sciences, Guangzhou 510640, China
3
Guangdong Provincial Key Laboratory of New and Renewable Energy Research and Development China, Guangzhou 510640, China
4
University of Chinese Academy of Sciences, Beijing 100049, China
5
Dalian National Laboratory for Clean Energy, Dalian 116023, China
6
School of Journalism, Communication University of China, Beijing 100024, China
7
School of Energy Science and Engineering, University of Science and Technology of China, Hefei 230026, China
*
Author to whom correspondence should be addressed.
Sustainability 2022, 14(8), 4768; https://doi.org/10.3390/su14084768
Submission received: 10 March 2022 / Revised: 12 April 2022 / Accepted: 13 April 2022 / Published: 15 April 2022
(This article belongs to the Special Issue Environmental Impact Assessment and Green Energy Economy)

Abstract

:
Carbon dioxide capture and utilization (CCU) technology is a significant means by which China can achieve its ambitious carbon neutrality goal. It is necessary to explore the behavioral strategies of relevant companies in adopting CCU technology. In this paper, an evolutionary game model is established in order to analyze the interaction process and evolution direction of local governments and coal-fired power plants. We develop a replicator dynamic system and analyze the stability of the system under different conditions. Based on numerical simulation, we analyze the impact of key parameters on the strategies of stakeholders. The simulation results show that the unit prices of hydrogen and carbon dioxide derivatives have the most significant impact: when the unit price of hydrogen decreases to 15.9 RMB/kg or the unit price of carbon dioxide derivatives increases to 3.4 RMB/kg, the evolutionary stabilization strategy of the system changes and power plants shift to adopt CCU technology. The results of this paper suggest that local governments should provide relevant support policies and incentives for CCU technology deployment, as well as focusing on the synergistic development of CCU technology and renewable energy hydrogen production technology.

1. Introduction

China has attached great importance to the issue of climate change. In September 2020, China proposed to the UN General Assembly the ambitious goals of achieving peak carbon emissions by 2030 and carbon neutrality by 2060 [1]. Carbon dioxide capture, utilization, and storage (CCUS) technology is considered one of the critical means by which to achieve this goal, along with clean energy replacement technology, electric energy replacement technology, energy-efficiency improvement technology, and negative emissions technology [2]. The International Energy Agency (IEA) indicated, in its report, that the amount of CO 2 captured worldwide is expected to be 1.67 billion tons/year by 2030 and 7.6 billion tons/year by 2050 [3]. Among the technical routes covered by CCUS technology, carbon dioxide capture and utilization (CCU) technology is in line with the concept of circular economy advocated in China [4,5] and is expected to bring economic benefits under certain conditions while achieving CO 2 reductions. The feasibility of the CCU technology route for CO 2 reduction has been demonstrated in related works [6,7,8,9,10]. This paper focuses on the discussion and analysis of CCU technology.
China has a massive coal-fired power generation infrastructure, with a total installed capacity of 1080 GW [11]. Coal-fired power plants are considered one of the most important sources of CO 2 emissions in different sectors, with coal-fired power and heat emissions accounting for 44% of carbon emissions from energy activities [12]. With the Chinese government taking a strong stance on corporate carbon dioxide emissions, the use of carbon dioxide capture technology is critical to ensure the sustainable operation of coal-fired power plants. Relative measures have been taken by the Chinese government to promote the deployment of CCU technology, including building relevant policy frameworks and investing in pilot demonstration projects [13] such as the National Energy Group Carbon Capture Demonstration Project. However, compared with developed countries, China’s relevant policies are not sufficient to support the further development of CCU technology, and there are still problems, including a lack of financial subsidies and insufficient market stimulation [14]. Consequently, faced with high costs and a lack of financial support, power plants are not motivated to deploy CCU technology [15,16].
Based on the above context, in this paper we construct an evolutionary game model of the interaction between the stakeholders of CCU technology—that is, local governments and coal-fired power plants—as shown in Figure 1. Through an analysis of the evolutionary game model, we attempt to reveal the influences of different factors on the behavioral strategies of stakeholders, as well as the conditions under which power plants will choose to adopt CCU technology. The remainder of this paper is structured as follows: Section 2 provides a review of the recent advances in CCU technology and evolutionary game theory in the literature. Section 3 details the construction of an evolutionary game model for the stakeholders of CCU technology and stability analyses for various cases. In Section 4, the simulation of the behavioral strategies of stakeholders is discussed and a sensitivity analysis of the key variables is provided. Section 5 concludes the paper and presents policy recommendations based on the results of the analysis.

2. Literature Review

CCU technology treats CO 2 as a resource, and aims to convert it into derivatives with higher energy density and economic value, such as liquid fuels, polymers, minerals, and so on [17]. Aldaco et al. [18] have conducted a life-cycle evaluation of formic acid production from carbon dioxide captured by coal-fired power plants using electroreduction. Their evaluation results indicated that deriving chemicals from CO 2 is a promising decarbonization option for coal-fired power plants. Cormos et al. [19] have evaluated the application of CCU technology in several energy-intensive industrial scenarios, including coal-fired power plants, steel plants, cement plants, and chemical plants. Their results validated the advantages of CCU technology in enhancing environmental benefits. Chen et al. [20] have investigated the application of CCU technology in the steel industry, and discovered that a steel-making process incorporating CO 2 hydrogenation has significant advantages in terms of CO 2 emissions, energy efficiency, and economic benefits. The application of CCU technology in the cement industry has been investigated by Farfan et al. [21], who claimed that carbon capture is the only means for the partial decarbonization of cement production. Their research demonstrated potential for the production of synthetic hydrocarbon fuels from carbon dioxide in cement plants combined with hydrogen from renewable energy sources. Lu et al. [22] have creatively applied CCU technology to wastewater treatment. Preliminary estimates suggested that a combination of the two may fully offset this industry’s greenhouse gas footprint, becoming a significant contributor to negative global emissions.
Evolutionary game theory is a new, multidisciplinary convergence theory that is currently used in ecology, socioeconomics, energy policy, environmental sciences, and other fields [23]. Gao et al. [24] have conducted an evolutionary game analysis of the behavioral strategies of watershed ecological compensation stakeholders, and provided a literature basis for the realistic problem of how ecological benefits are distributed between upstream and downstream governments. Shan et al. [25] have explored the sustainability of photovoltaic poverty alleviation in China. An evolutionary game model has also been applied to characterize the behavioral dynamics of economic standstill and protective immunity during the COVID-19 pandemic [26]. Wang et al. [27] have applied evolutionary game theory to the exploration of behavioral strategies among solar thermal plants, nuclear plants, and investment companies. Wang and Yi [28] have applied evolutionary game theory to analyze the impact of consumer behavior and firm decisions on the energy transition, and confirmed the decisive role of the strategic choices of consumers and firms in the effective implementation of the energy transition.
In summary, evolutionary game theory has been widely used to study the behavioral strategies of stakeholders, while CCU technology has been applied to a variety of industrial scenarios and demonstrated to be technically feasible. To the best of our knowledge, no scholars have conducted evolutionary game analysis on the deployment of CCU technology to date. Thus, the incremental contributions to the literature made in this paper are mainly as follows: we establish an evolutionary game model between local governments and coal-fired power plants for the CCU technology deployment problem; and, in comparison with previous work, we add variables to the model, such as expenditure on hydrogen purchases and proceeds from the sale of carbon dioxide derivatives.

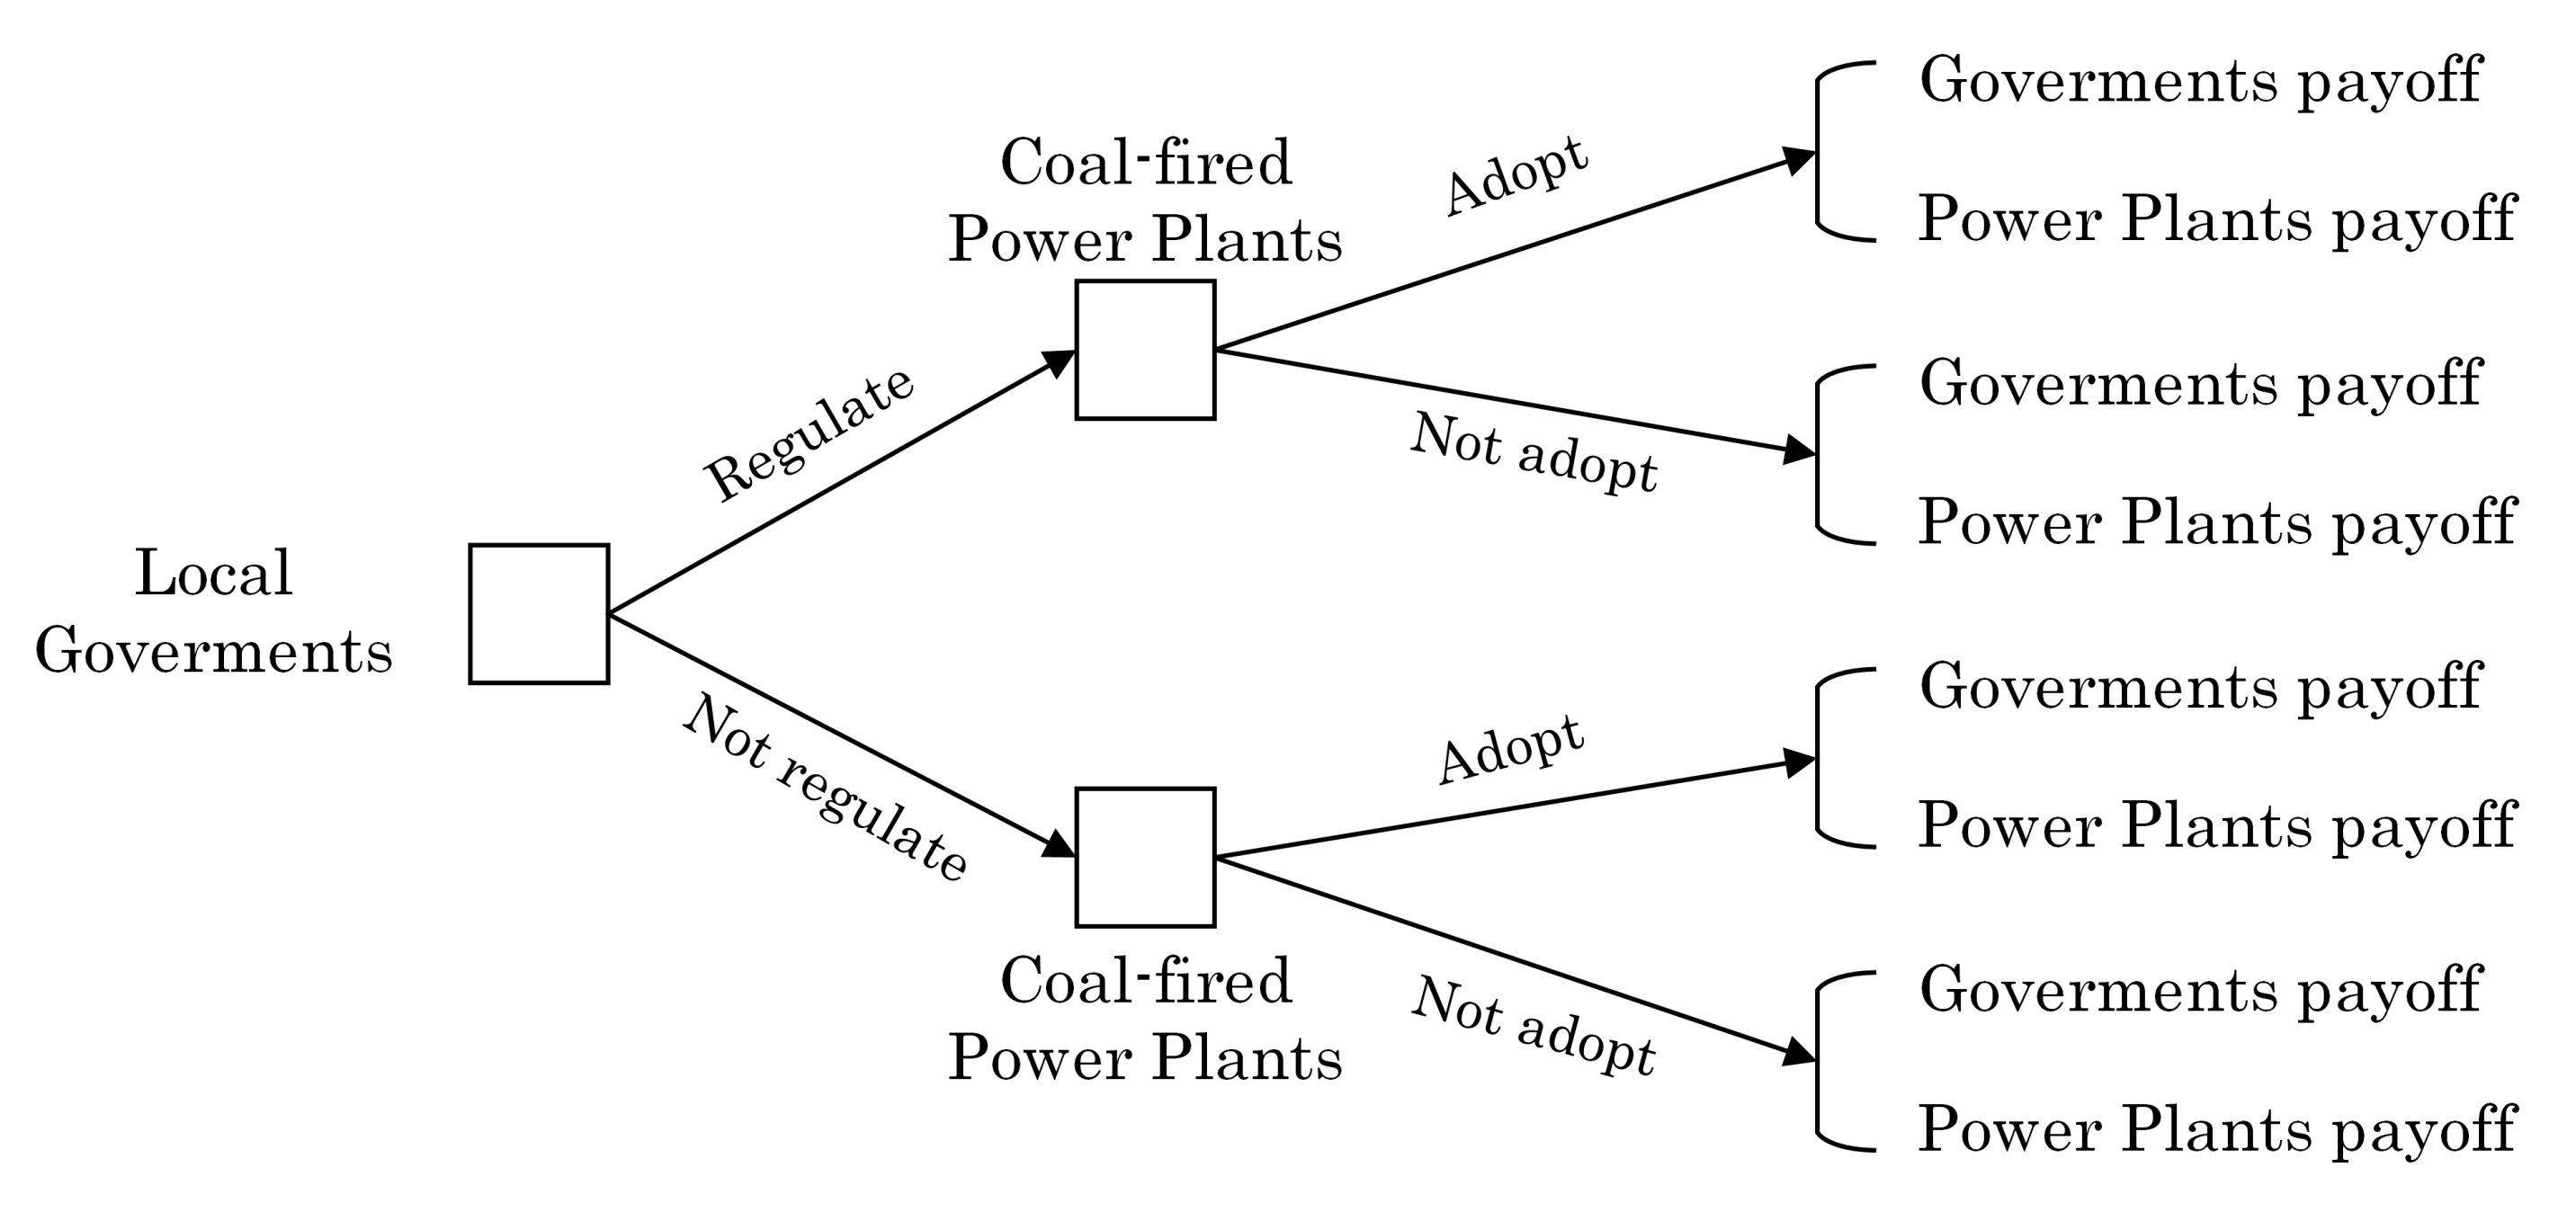
3. Evolutionary Game Model

3.1. Model Assumption

According to [29] and the generally stable domestic environment, we define the stakeholders of CCU technology deployment as two large and finite populations: Local governments (G) and coal-fired power plants (P). We suppose that the participants are relatively rational, economic persons who can continuously optimize their strategies through learning and imitation, and find better strategies through trial-and-error in the game.
Faced with the problem of promoting the application of CCU technology, local governments may choose to regulate power plants to adopt CCU technology, or not to take any regulatory measures. If local governments choose to regulate, they must pay the corresponding regulatory costs ( G 1 ) and, at the same time, they will also obtain the corresponding political achievement benefits ( R 1 ) on the basis of initial social welfare (R). In the other case, if local governments choose not to adopt regulatory measures, there is a corresponding environmental cost ( G 2 ). Assume that the probability of local governments taking regulatory measures is x ( 0 < x < 1 ); then, the probability of local governments not taking regulatory measures is ( 1 x ).
Coal-fired power plants can choose to adopt CCU technology to avoid government penalties and receive related subsidies or not. If power plants choose to adopt the CCU technology, they will need to pay the CCU equipment cost ( C 1 ), carbon capture cost ( C 2 ), hydrogen purchase cost ( C 3 ), and other extra costs ( C 4 ); however, power plants can also be exempted from penalties (P) and receive corresponding subsidies (W). Power plants use CCU technology to convert the captured carbon dioxide combined with hydrogen into carbon dioxide-derived chemicals, which are sold for corresponding profits (D). Suppose the amount of captured carbon dioxide is n, the efficiency of carbon dioxide conversion to derivatives is η , the unit price of hydrogen is j, and the unit price of carbon dioxide-derived chemicals is k. Assume that the probability of the power plants adopting CCU technology is y ( 0 < y < 1 ); then, the probability of the power plants not adopting CCU technology is ( 1 y ).
The parameter and variable symbols and their meanings are provided in the Abbreviations part.

3.2. Payoffs of Players

Based on the above assumptions and each participant’s strategy set, four possible scenarios can be derived, as shown in Figure 2.
In the case that the local governments choose to regulate and coal-fired power plants choose to adopt, due to the active adoption of regulatory measures, local governments gain additional performance on the basis of the original social welfare; at the same time, they pay the corresponding regulatory costs. The local government’s initiative to promote CCU—a low-carbon technology—improves the social environment and avoids environmental costs. As power plants adopt CCU technology, they also receive government subsidies while investing in the employment of related equipment. The local government’s total payoff is defined as a 1 , while the coal-fired power plant’s total payoff is defined as a 2 . For brevity, let C 1 + C 2 + C 3 + C 4 D L = α .
a 1 = R + R 1 G 1 W , a 2 = W α + S .
In the case that local governments choose to regulate and coal-fired power plants choose not to adopt, the coal-fired power plants still do not adopt CCU technology while local governments take regulatory measures, and the environment continues to deteriorate. The power plant firmly chooses the strategy of not adopting the CCU technology and must pay the associated fines. The local governments must also pay environmental costs while spending management costs. The local government’s total payoff is defined as b 1 , while the coal-fired power plant’s total payoff is defined as b 2 .
b 1 = R G 1 G 2 + P , b 2 = S P .
In the case that local governments choose not to regulate, and coal-fired power plants choose to adopt, as the power plants actively adopt CCU technology without being regulated, the local governments have neither regulatory nor environmental costs. However, enterprises will no longer receive corresponding subsidies in the process of deploying CCU technology. The local government’s total payoff is defined as c 1 , while the coal-fired power plant’s total payoff is defined as c 2 .
c 1 = R , c 2 = S α .
In the case that local governments choose not to regulate, and coal-fired power plants choose not to adopt, the power plant will receive the original benefit while the local governments must pay the environmental cost due to environmental degradation. The local government’s total payoff is defined as d 1 , while the coal-fired power plant’s total payoff is defined as d 2 .
d 1 = R G 2 , d 2 = S .
Through analysis of each scenario, the payoff matrix for local governments and coal-fired power plants was constructed, as shown in Table 1.

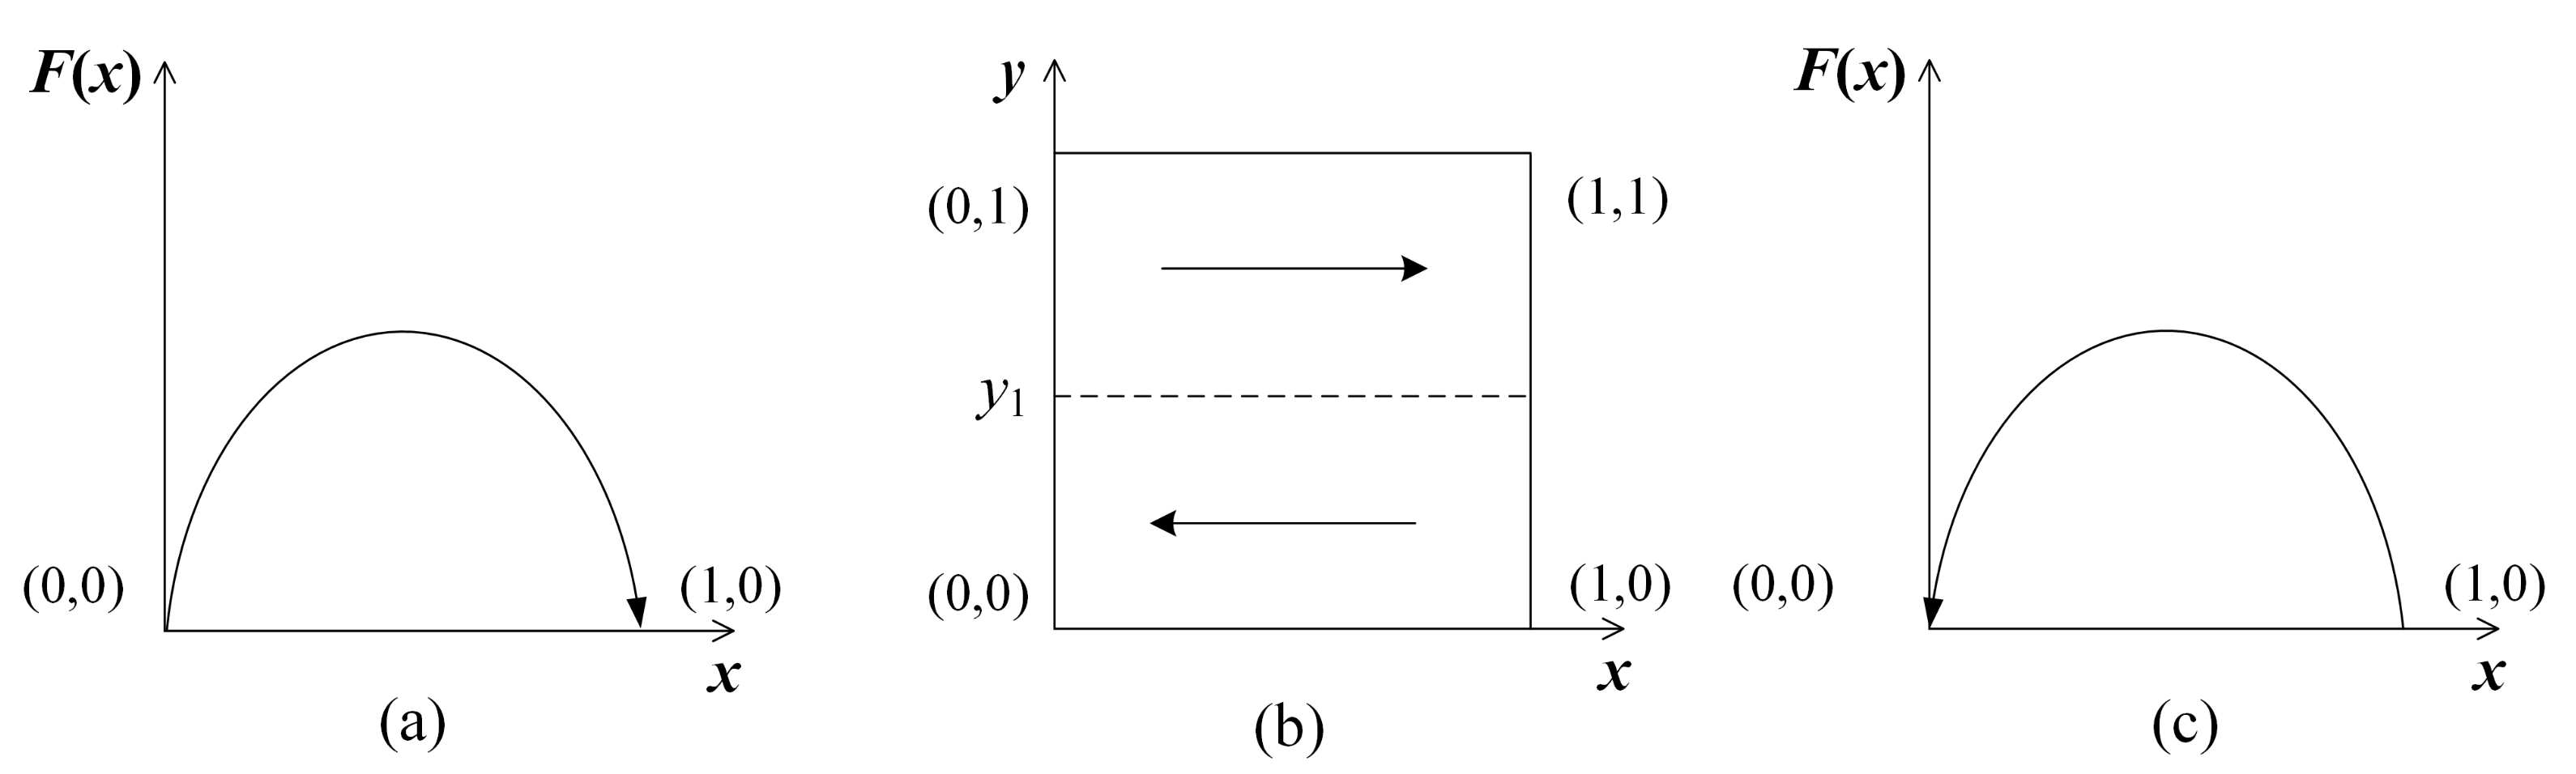
3.3. Strategy Stability Analysis

3.3.1. Strategy Stability Analysis of Local Governments

According to the above assumptions and analysis, the payoff matrices for the local governments and power plants can be obtained, respectively. The payoff matrix for local governments is defined as A, as follows:
A = R + R 1 G 1 W R G 1 G 2 + P R R G 2 .
When local governments choose to regulate, their expected utility is defined as follows:
π g 1 = eAy = 1 0 R + R 1 G 1 W R G 1 G 2 + P R R G 2 y 1 y = y ( R + r G 1 W ) + ( 1 y ) ( R G 1 G 2 + P ) .
The average expected utility of local governments is as follows:
π g ¯ = x Ay = x 1 x R + R 1 G 1 W R G 1 G 2 + P R R G 2 y 1 y = x [ y ( R + r G 1 W ) + ( 1 y ) ( R G 1 G 2 + P ) ] + ( 1 x ) [ y R + ( 1 y ) ( R G 2 ) ] .
According to the Malthusian equation [30], the replicator dynamics equation of the “regulate” strategy by governments is
F ( x ) = d x d t = x ( π g 1 π g ¯ ) = x ( 1 x ) [ y ( R 1 W P ) + P G 1 ] .
The partial derivative of the function F ( x ) , with respect to x, can be obtained as:
F ( x ) x = ( 1 2 x ) [ y ( R 1 W P ) + P G 1 ] .
By analyzing Equation (8), we find that F ( x ) = d x / d t = 0 is constant when y = ( G 1 P ) / ( R 1 W P ) ; that is, local governments always have an evolutionary stable strategy (ESS), regardless of the strategy adopted. If y ( G 1 P ) / ( R 1 W P ) , x = 0 , x = 1 will be the two stable points of the local government replication dynamic equation and, according to evolutionary game theory, local governments have ESS only if the condition F ( x ) / x < 0 holds. For the sake of analysis, we assume that R 1 W P > 0 and discuss the following three cases for the value of G 1 P .
Case a: G 1 P < 0 < R 1 W P . In this case, it can be easily deduced that y ( R 1 W P ) + P G 1 > 0 ; to satisfy the condition F ( x ) / x < 0 , it can be obtained that x = 1 is the only ESS for local governments. This means that when the penalty value imposed on the power plant is greater than the cost of government regulation, taking regulatory measures will be a stable strategy for local governments. The dynamic evolutionary path of the local government’s strategy is shown in Figure 3a.
Case b: 0 < G 1 P < R 1 W P . In this case, if y < ( G 1 P ) / ( R 1 W P ) , we can obtain that x = 0 is the ESS for the local government; if y > ( G 1 P ) / ( R 1 W P ) , x = 1 is the ESS for the local government. The results of the analysis suggest that the strategy of choosing regulation in the situation of elevated regulatory costs is no longer the only ESS for local governments; the local government’s ESS will also change as the strategy chosen by the power plant changes. The dynamic evolutionary path of the local government’s strategy is shown in Figure 3b.
Case c: G 1 P > R 1 W P . In this case, ( G 1 P ) / ( R 1 W P ) > 1 , which means y < ( G 1 P ) / ( R 1 W P ) is established. Based on this premise, we can obtain that x = 0 is the only ESS for local governments. As the cost of regulation gradually rises, the evolutionary stabilization strategy of local governments will shift to “not regulate”. The dynamic evolutionary path of the local government’s strategy is shown in Figure 3c.

3.3.2. Strategy Stability Analysis of Coal-Fired Power Plants

Similarly, the payoff matrix for power plants is defined as B, which is presented as follows:
B = W α + S S P S α S .
When power plants choose to adopt, their expected revenue is defined as follows:
π p 1 = e B x = 1 0 W α + S S α S P S x 1 x = x ( W α + S ) + ( 1 x ) ( S α ) .
The average expected revenue of the power plants is as follows:
π p ¯ = y B x = y 1 y W α + S S α S P S x 1 x = y [ x ( W α + S ) + ( 1 x ) ( S α ) ] + ( 1 y ) [ x ( S P ) + ( 1 x ) S ] .
The replicator dynamics equation under the “adopt” strategy by the power plants is
F ( y ) = d y d t = y ( π p 1 π p ¯ ) = y ( 1 y ) [ x ( W + P ) α ] .
The partial derivative of the function F ( y ) , with respect to y, can be obtained as
F ( y ) y = ( 1 2 y ) [ x ( W + P ) α ] .
It can be demonstrated that the roots of the equation F ( y ) = d y / d t = 0 are y = 0 , y = 1 , x = α / ( W + P ) . When x = α / ( W + P ) , power plants have an evolutionary stable strategy, regardless of the value of y. When x α / ( W + P ) , power plants have ESS only if the condition F ( y ) / y < 0 holds. Under the premise that W + P > 0 , we discuss the value of A in the following three cases.
Case d: α < 0 < W + P . In this case, we can deduce that x ( W + P ) α > 0 ; to satisfy the condition F ( y ) / y < 0 , it can be obtained that y = 1 is the only ESS for power plants. Power plants have the initiative to deploy CCU technology when the profitability of deploying CCU technology is greater than the sum of the costs. The dynamic evolutionary path of the power plant’s strategy is shown in Figure 4a.
Case e: 0 < α < W + P . In this case, if x < α / ( W + P ) , we can obtain that y = 0 is the ESS for power plants; if x > α / ( W + P ) , y = 1 is the ESS for power plants. When the sum of the costs associated with deploying CCU technology outweighs the sum of the profits—which is more realistic—deploying CCU technology is no longer the only evolutionary stable strategy for power plants. The dynamic evolutionary path of the power plants’ strategy is shown in Figure 4b.
Case f: α > W + P . In this case, α / ( W + P ) > 1 , which means x < α / ( W + P ) is established. Based on this premise, it is easy to deduce that y = 0 is the only ESS for power plants. This situation means that the ESS of the power plants switches to “not adopt”, due to the high cost of deploying CCU technology. The dynamic evolutionary path of the power plant’s strategy is shown in Figure 4c.

3.3.3. ESS Analysis between Local Governments and Coal-Fired Power Plants

In the evolutionary game model, the bounded rationality of the participants and the behavior of learning from the dominant strategy are mainly reflected in the form of dynamic differential equations. According to Equations (8) and (13), a two-dimensional nonlinear replicator dynamic system can be obtained, as follows:
F ( x ) = d x d t = x ( 1 x ) [ y ( R 1 W P ) + P G 1 ] F ( y ) = d y d t = y ( 1 y ) [ x ( W + P ) α ] .
According to the stability analysis of strategies of the local government and the power plant, respectively, ( 0 , 0 ) , ( 0 , 1 ) , ( 1 , 0 ) , ( 1 , 1 ) , ( x 1 , y 1 ) are the five equilibrium points of this replicator dynamic system. However, the strategies represented by the five equilibrium points of the replicator dynamic system obtained above are not necessarily ESS. We must still construct the Jacobian matrix to determine the stability of each equilibrium point. The Jacobian matrix is constructed as follows:
J = F ( x ) x F ( x ) y F ( y ) x F ( y ) y = ( 1 2 x ) [ y ( R 1 W P ) + P G 1 ] x ( 1 x ) ( R 1 W P ) y ( 1 y ) ( W + P ) ( 1 2 y ) [ x ( W + P ) α ] .
The determinant and trace of the Jacobian matrix can be calculated by the following equations, respectively:
det J = ( 1 2 x ) ( 1 2 y ) [ y ( R 1 W P ) + P G 1 ] [ x ( W + P ) α ] x y ( 1 x ) ( 1 y ) ( R 1 W P ) ( W + P ) ,
tr J = ( 1 2 x ) [ y ( R 1 W P ) + P G 1 ] + ( 1 2 y ) [ x ( W + P ) α ] .
If an equilibrium point satisfies the conditions det J > 0 and tr J > 0 , the Jacobian matrix has two positive eigenvalues and the point is an unstable point in the evolutionary game. Meanwhile, if an equilibrium point satisfies the conditions det J > 0 and tr J < 0 , the Jacobian matrix has two negative eigenvalues and the point is an ESS point [31]. If the above conditions are not met, the equilibrium point is a saddle point. The values of det J and tr J for each equilibrium point are given in the Table 2.
Nine cases were derived by combining Case a, Case b, Case c with Case d, Case e, Case f, where Case 1: G 1 P < 0 , α < 0 ; Case 2: G 1 P < 0 , 0 < α < W + P ; Case 3: G 1 P < 0 , α > W + P ; Case 4: 0 < G 1 P < R 1 W P , α < 0 ; Case 5: 0 < G 1 P < R 1 W P , 0 < α < W + P ; Case 6: 0 < G 1 P < R 1 W P , α > W + P ; Case 7: G 1 P > R 1 W P , α < 0 ; Case 8: G 1 P > R 1 W P , 0 < α < W + P ; and Case 9: G 1 P > R 1 W P , α > W + P . We determined the stability of the five equilibrium points under various scenarios by using the Jacobian matrix. The calculation results are summarized in Table 3.
Based on the calculation results given in Table 3, the evolutionary path of the replicated dynamic system in each case is summarized in Figure 5. Point ( 0 , 0 ) is the ESS point of this replicator dynamic system in Cases 6, 8, and 9, and the strategy set is {Not regulate, Not adopt}. In these cases, the regulatory cost of government regulation is greater than the benefit of fines for plants that do not adopt CCU technology; thus, government regulatory incentives are hindered. In the absence of active government regulation, enterprises also lack enthusiasm for active deployment, due to the high cost of deploying CCU technology.
In Case 5, in addition to ( 0 , 0 ) , the point ( 1 , 1 ) is also an ESS point. The initial strategic choices of local governments and power plants determine the direction of strategic evolution. If the initial state of the player is within the area enclosed by ( 0 , 0 ) ( 1 , 0 ) ( x 1 , y 1 ) ( 0 , 1 ) , the system will eventually converge to the strategy {Not regulate, Not adopt}; otherwise, the system will converge to the strategy {Regulate, Adopt}.
The point ( 0 , 1 ) is the only ESS point of this replicator dynamic system in Case 7; the strategy set is {Not regulate, Adopt}. In this case, the cost of government regulation far outweighs the benefit of penalizing the plant, while the cost of deploying CCU technology at the plant is less than the sum of the sale of CO 2 -derived products and other low-carbon profits. Thus, power plants deploy CCU technology on their own, without being regulated.
The point ( 1 , 0 ) is the only ESS point of this replicator dynamic system in Case 3; the strategy set is {Regulate, Not adopt}. In this case, the net cost of deploying CCU technology at a power plant is even higher than in Case 2. In this context, power plants are reluctant to deploy CCU technology, even if the government takes punitive measures.
The point ( 1 , 1 ) is the only ESS point of this replicator dynamic system in Cases 1, 2, and 4; the strategy set is {Regulate, Adopt}. In these cases, the net cost of deploying CCU technology is at a relatively low level, while government penalties for not adopting CCU technology are at a fairly high level. Against this backdrop, power plants are willing to choose the “Adopt” strategy. At the same time, the subsidy level of local governments for the adoption of CCU technology is comparatively high which, to a certain extent, promotes the motivation of power plants to deploy CCU technology.

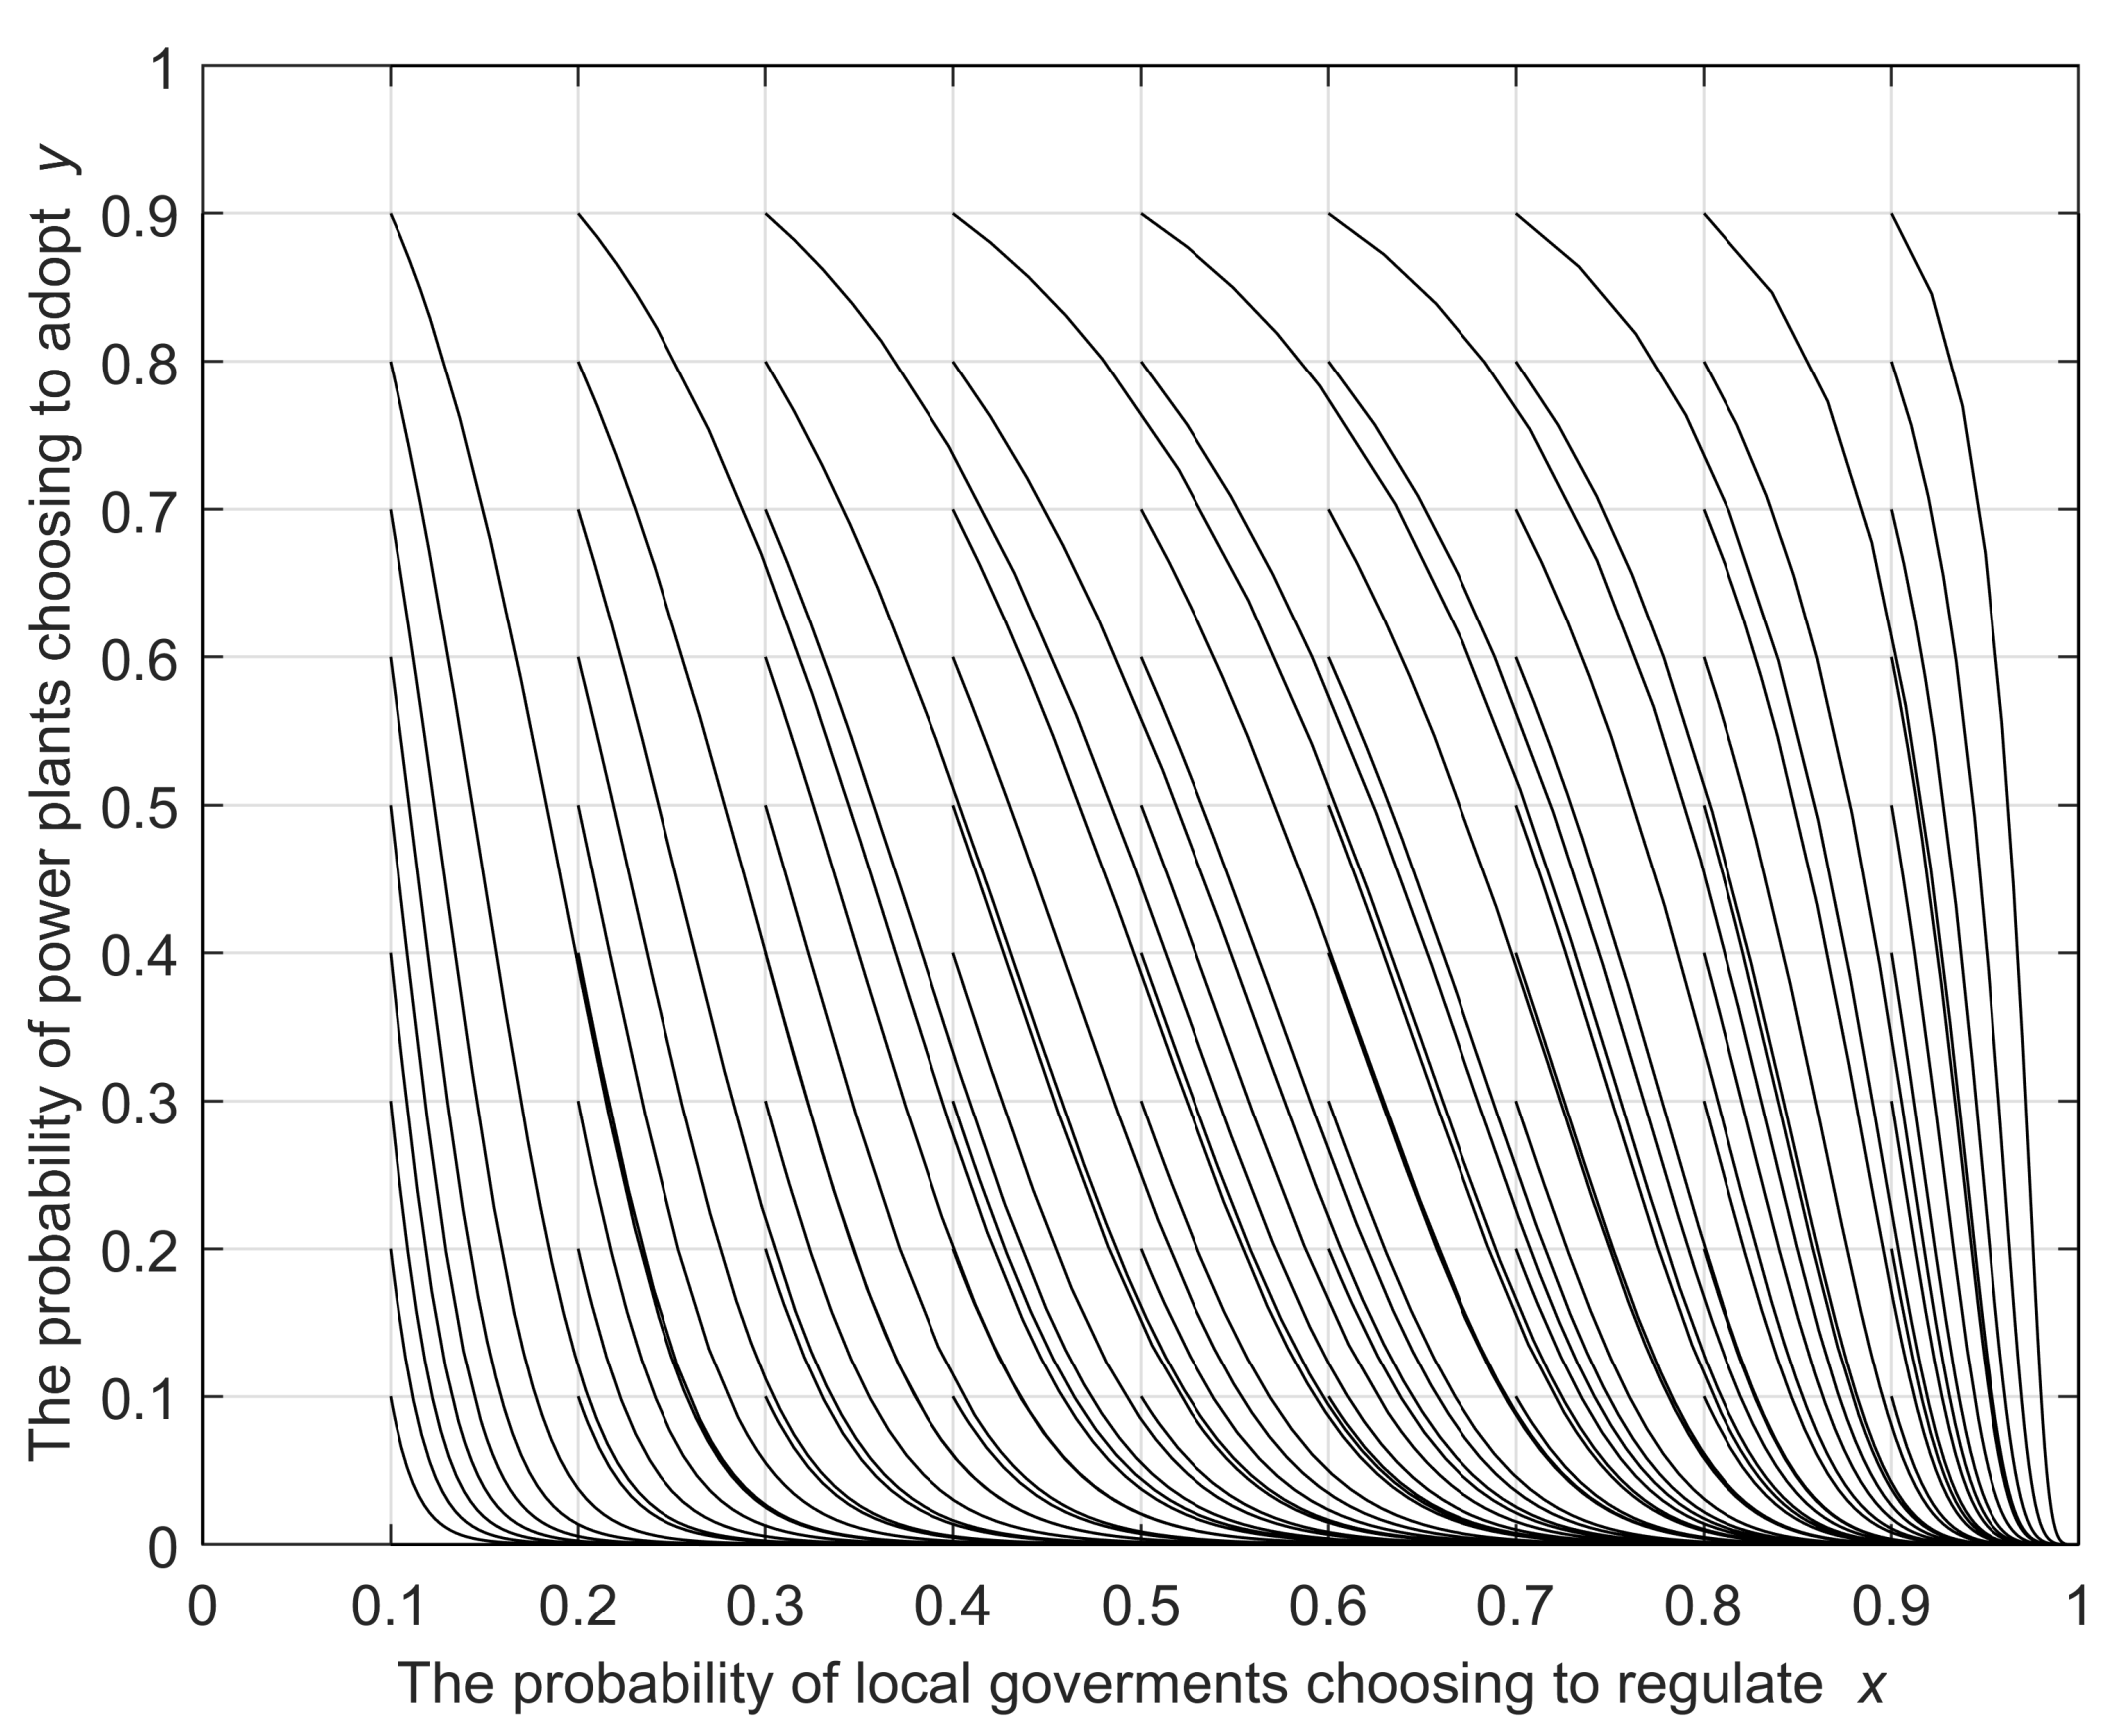
4. System Simulation Analysis

4.1. Simulation Results

We investigated the annual CO 2 emissions of China Shenhua Co., Ltd. Huizhou Thermal Power Branch (Huizhou, China), Guangdong Honghaiwan Power Generation Co., Ltd. (Shanwei, China), and Guangdong Huizhou Pinghai Power Plant Co., Ltd. (Huizhou, China), and concluded that their annual average emissions were 7.3 million tons of CO 2 . Based on the results of [11] for 584 coal-fired power plants in China, the average amount of CO 2 emissions set in this paper was considered reliable. Assume that thermal power plants can reduce their carbon emissions by 5% through CCU technology, which means that 365,000 tons of CO 2 are used as feedstock for the production of CO 2 -derived chemicals. According to [32], the cost of the 10,000-ton carbon dioxide capture device deployed by the China Power Investment Corporation is CNY 12.35 million, and the service life of the equipment is 25 years [33]. After calculation, the annual converted cost of CCU equipment considered in this paper was CNY 18.03 million. As described in [34], it takes 0.02 kWh of electricity and 1.20 kWh of heat to capture 1 kg of CO 2 . Based on the average cost of electricity and heat in China, we can calculate the average cost of capturing CO 2 at 0.133 RMB per kg.
Methanol is selected as a representative for carbon dioxide-derived chemicals in the analysis. It has been stated [35] that it takes 1.37 tons of captured carbon dioxide and 0.187 tons of industrial hydrogen to produce one ton of methanol. Based on this, we calculated the associated cost of buying hydrogen and the profit from selling methanol. The unit prices of hydrogen and methanol were mainly determined according to [33] and actual market conditions. We set the government penalty for not adopting CCU technology in power plants referring to the assumptions for carbon tax in [36]. Zhao et al. [29] developed an evolutionary game model for the diffusion of carbon capture and storage technology, and we took their settings into account to define the values of government subsidies for power plants and the environmental benefits from the deployment of CCU technology. Moreover, data for regulatory costs was adopted from reference [30]. The key parameter values are summarized in Table 4.
The evolutionary path of the replicator dynamic system is shown in Figure 6. The evolutionary path with different initial probabilities eventually converges to the point ( 1 , 0 ) ; namely, the final policy set of the system is { R e g u l a t e , N o t a d o p t } . Based on the initial data in the baseline scenario in Table 4, we can conclude that the cost of local government regulation is less than the penalty to the power plants and the annual cost to power plants of deploying CCU technology is greater than the sum of the total benefits and penalties; thus, the baseline scenario falls under Case 3: G 1 P < 0 , α > W + P . The fact that the evolutionary path of the system converges to the point ( 1 , 0 ) also verifies the analysis of Case 3 in the previous section, which is in line with the current reality of the high costs faced in deploying CCU technology and a lack of financial subsidies. The power plants will not change their strategy unless the replicator dynamic system switches from case 3 to another case. To reveal the impact of different factors on the strategies of the stakeholders, a sensitivity analysis was conducted for the key variables in the replicator dynamic system. The probability that the local governments follow the “Regulate” strategy (x) and the probability that the power plants take the “Adopt” strategy (y) were set as 0.62 and 0.35, respectively.

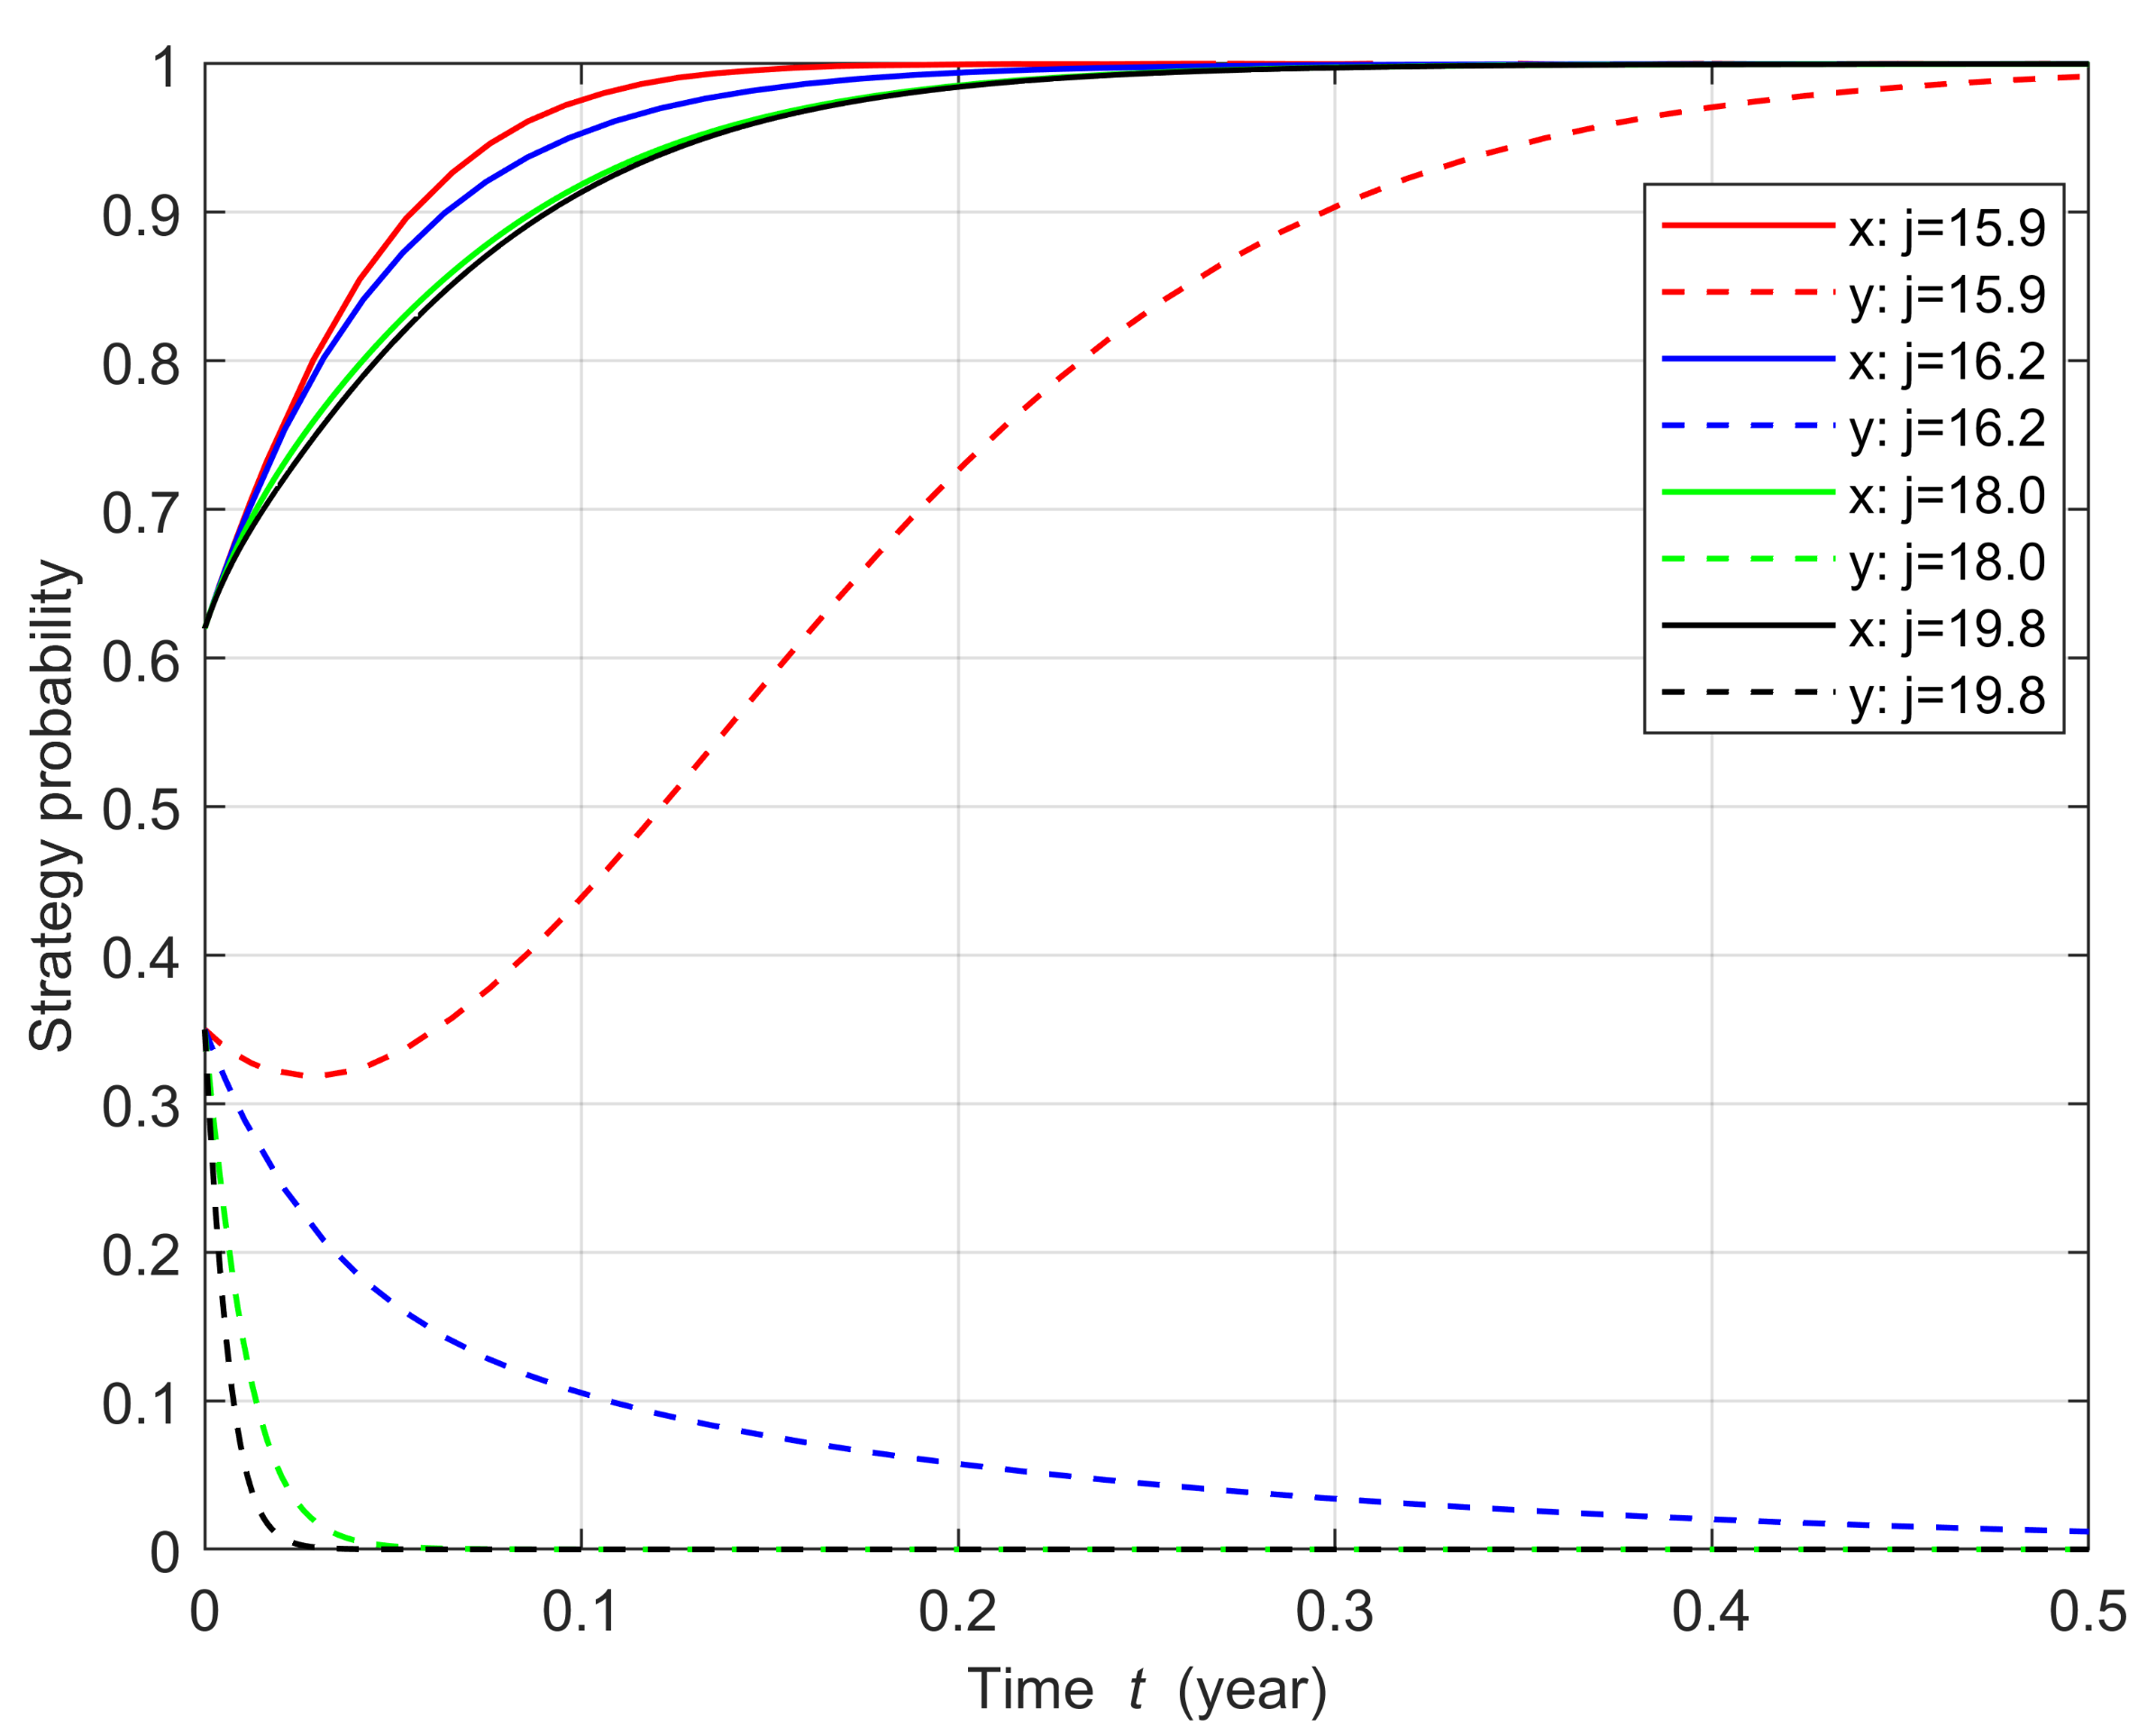
4.2. Sensitivity Analysis

4.2.1. Unit Price of Hydrogen (j)

The sensitivity of the system evolution path to changes in unit hydrogen cost is shown in Figure 7. When the price per unit of hydrogen increases by 10% (from 18.0 RMB/kg to 19.8 RMB/kg), the probability that a power plant will adopt CCU technology evolves faster, from 0.35 to 0. As the unit price of hydrogen gradually decreases, the evolution of the strategy of the thermal power plant slows down; when the unit price decreases by 12% (from 18.0 RMB/kg to 15.9 RMB/kg), the strategy of the plant changes and the probability of taking the “Adopt” strategy gradually converges to 1 over time. The willingness of a power plant to deploy CCU technology gradually increases as the total cost of hydrogen decreases, suggesting that government measures to promote lower hydrogen prices will have a significant positive effect on the proliferation of CCU technology. According to a report by the Hydrogen Energy Council [37], the cost of hydrogen will drop dramatically over the next decade, and is expected to drop by as much as 50% by 2030. The cost of hydrogen production from coal has been reported to be 7.24–19.4 RMB per kg under different conditions [38]. Although the cost of hydrogen production from renewable energy by electrolytic water is still at a high level, it is expected to be reduced to a competitive level in the future, compared with traditional methods of hydrogen production, as technology advances [7,39]. Research on hydrogen preparation is in full swing; as such, government departments should consider the synergistic development of hydrogen production technology and CO 2 capture and utilization technology as an important means to promote the application of CCU technology.

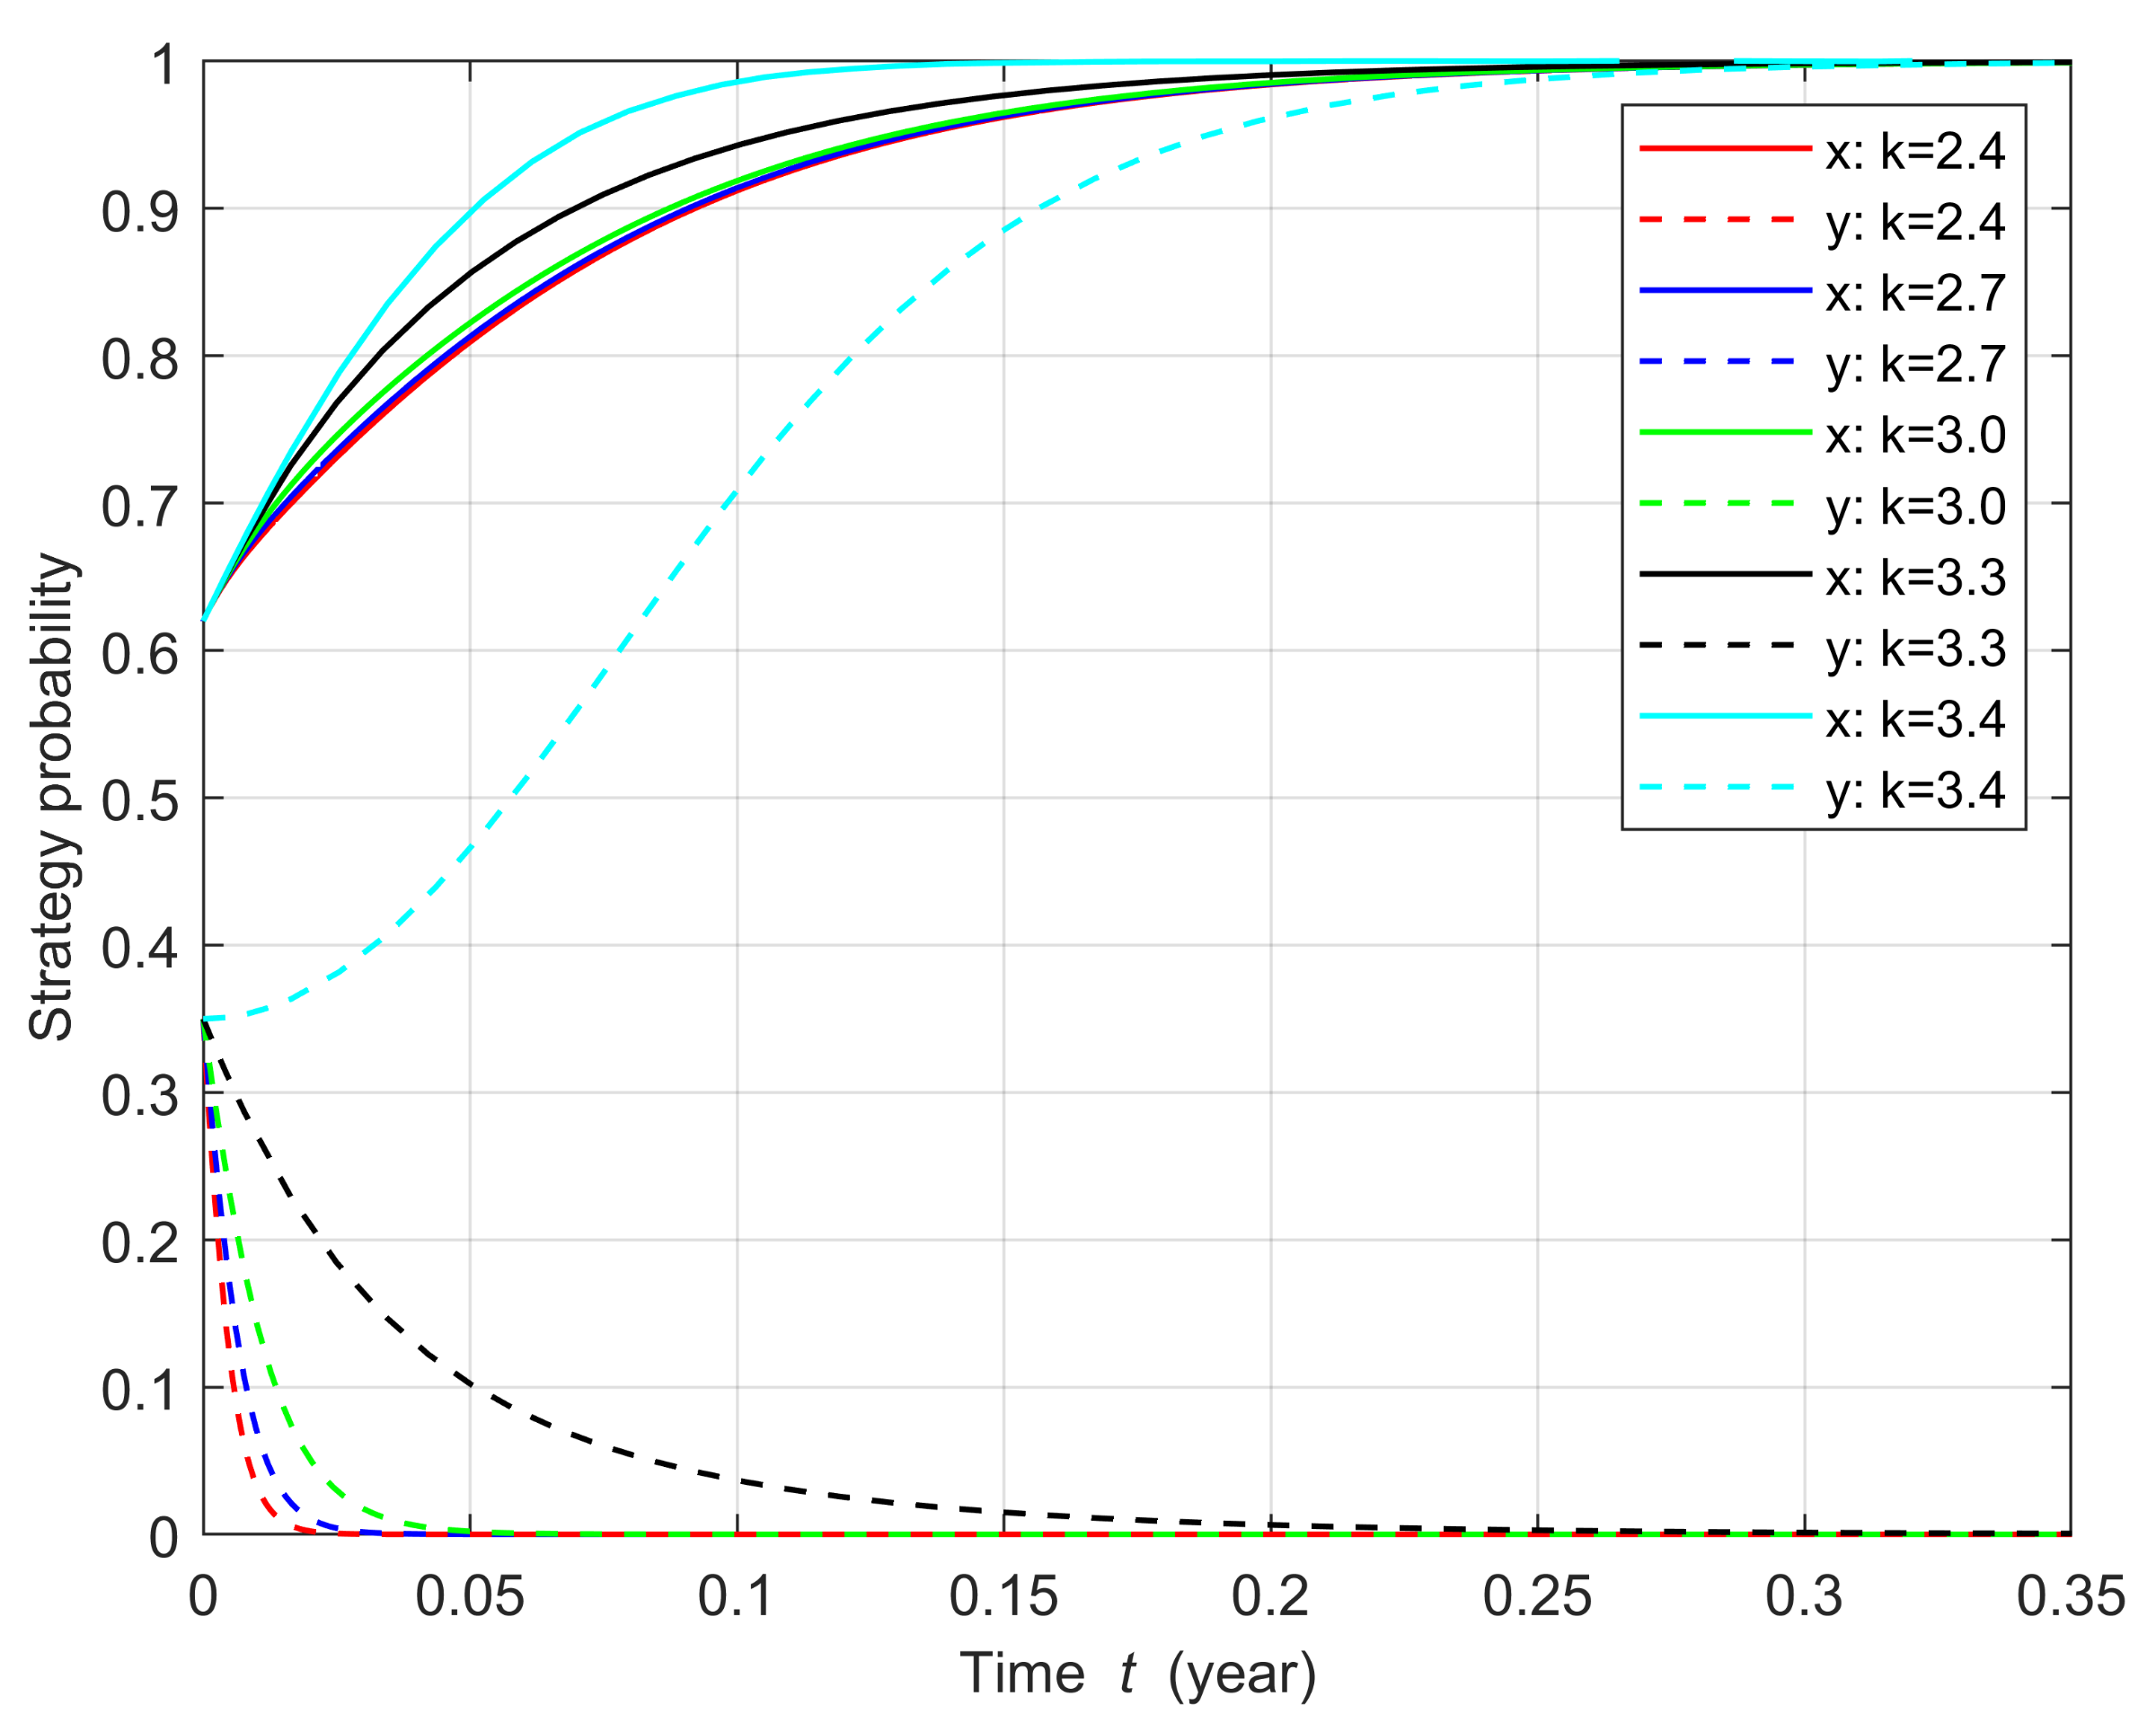
4.2.2. Unit Price of Carbon Dioxide-Derived Chemicals (k)

The sensitivity of the system evolution path to changes in unit price of carbon-dioxide-derived chemicals is shown in Figure 8. As the price of carbon dioxide-derived chemicals increases, the rate at which y converges to 0 gradually slows down and the rate at which x converges to 1 accelerates. The ESS of the replicator dynamic system shifts from ( 1 , 0 ) to ( 1 , 1 ) when the unit price of the product is increased by 14% (from 3 RMB/kg to 3.4 RMB/kg). The production of higher value-added CO 2 -derivatives can enhance the benefits of deploying CCU technology and increase the proactivity of power plants to take the “Adopt” strategy.

4.2.3. Regulatory Cost ( G 1 )

The sensitivity of the system evolution path to changes in regulatory cost is shown in Figure 9. The regulatory cost G 1 was set to 7.5, 15, or 22.5. We can observe that the rate of evolution of the thermal plant strategy does not change significantly as the regulatory cost increases, but the rate of evolution of the local government strategy decreases significantly. Therefore, it is necessary to improve the administrative efficiency of the government and reduce the cost of regulation appropriately.

4.2.4. Punishments on Power Plants (P)

The sensitivity of the system evolution path to changes in punishments on power plants is shown in Figure 10. As the penalty amount gradually increases, compared with the baseline scenario, the rate of evolution of the local government’s strategy increases while the evolution of the power plant’s strategy slows down slightly. Only when the penalty increases to four times the baseline scenario does the ESS of the system slowly switch from ( 1 , 0 ) to ( 1 , 1 ) , and the power plants choose to deploy CCU technology under the government regulations. Penalties for power plants that refuse to deploy CCU technology can have a catalytic effect in promoting the diffusion of CCU technology; however, it is not wise to use penalties as a single policy tool.

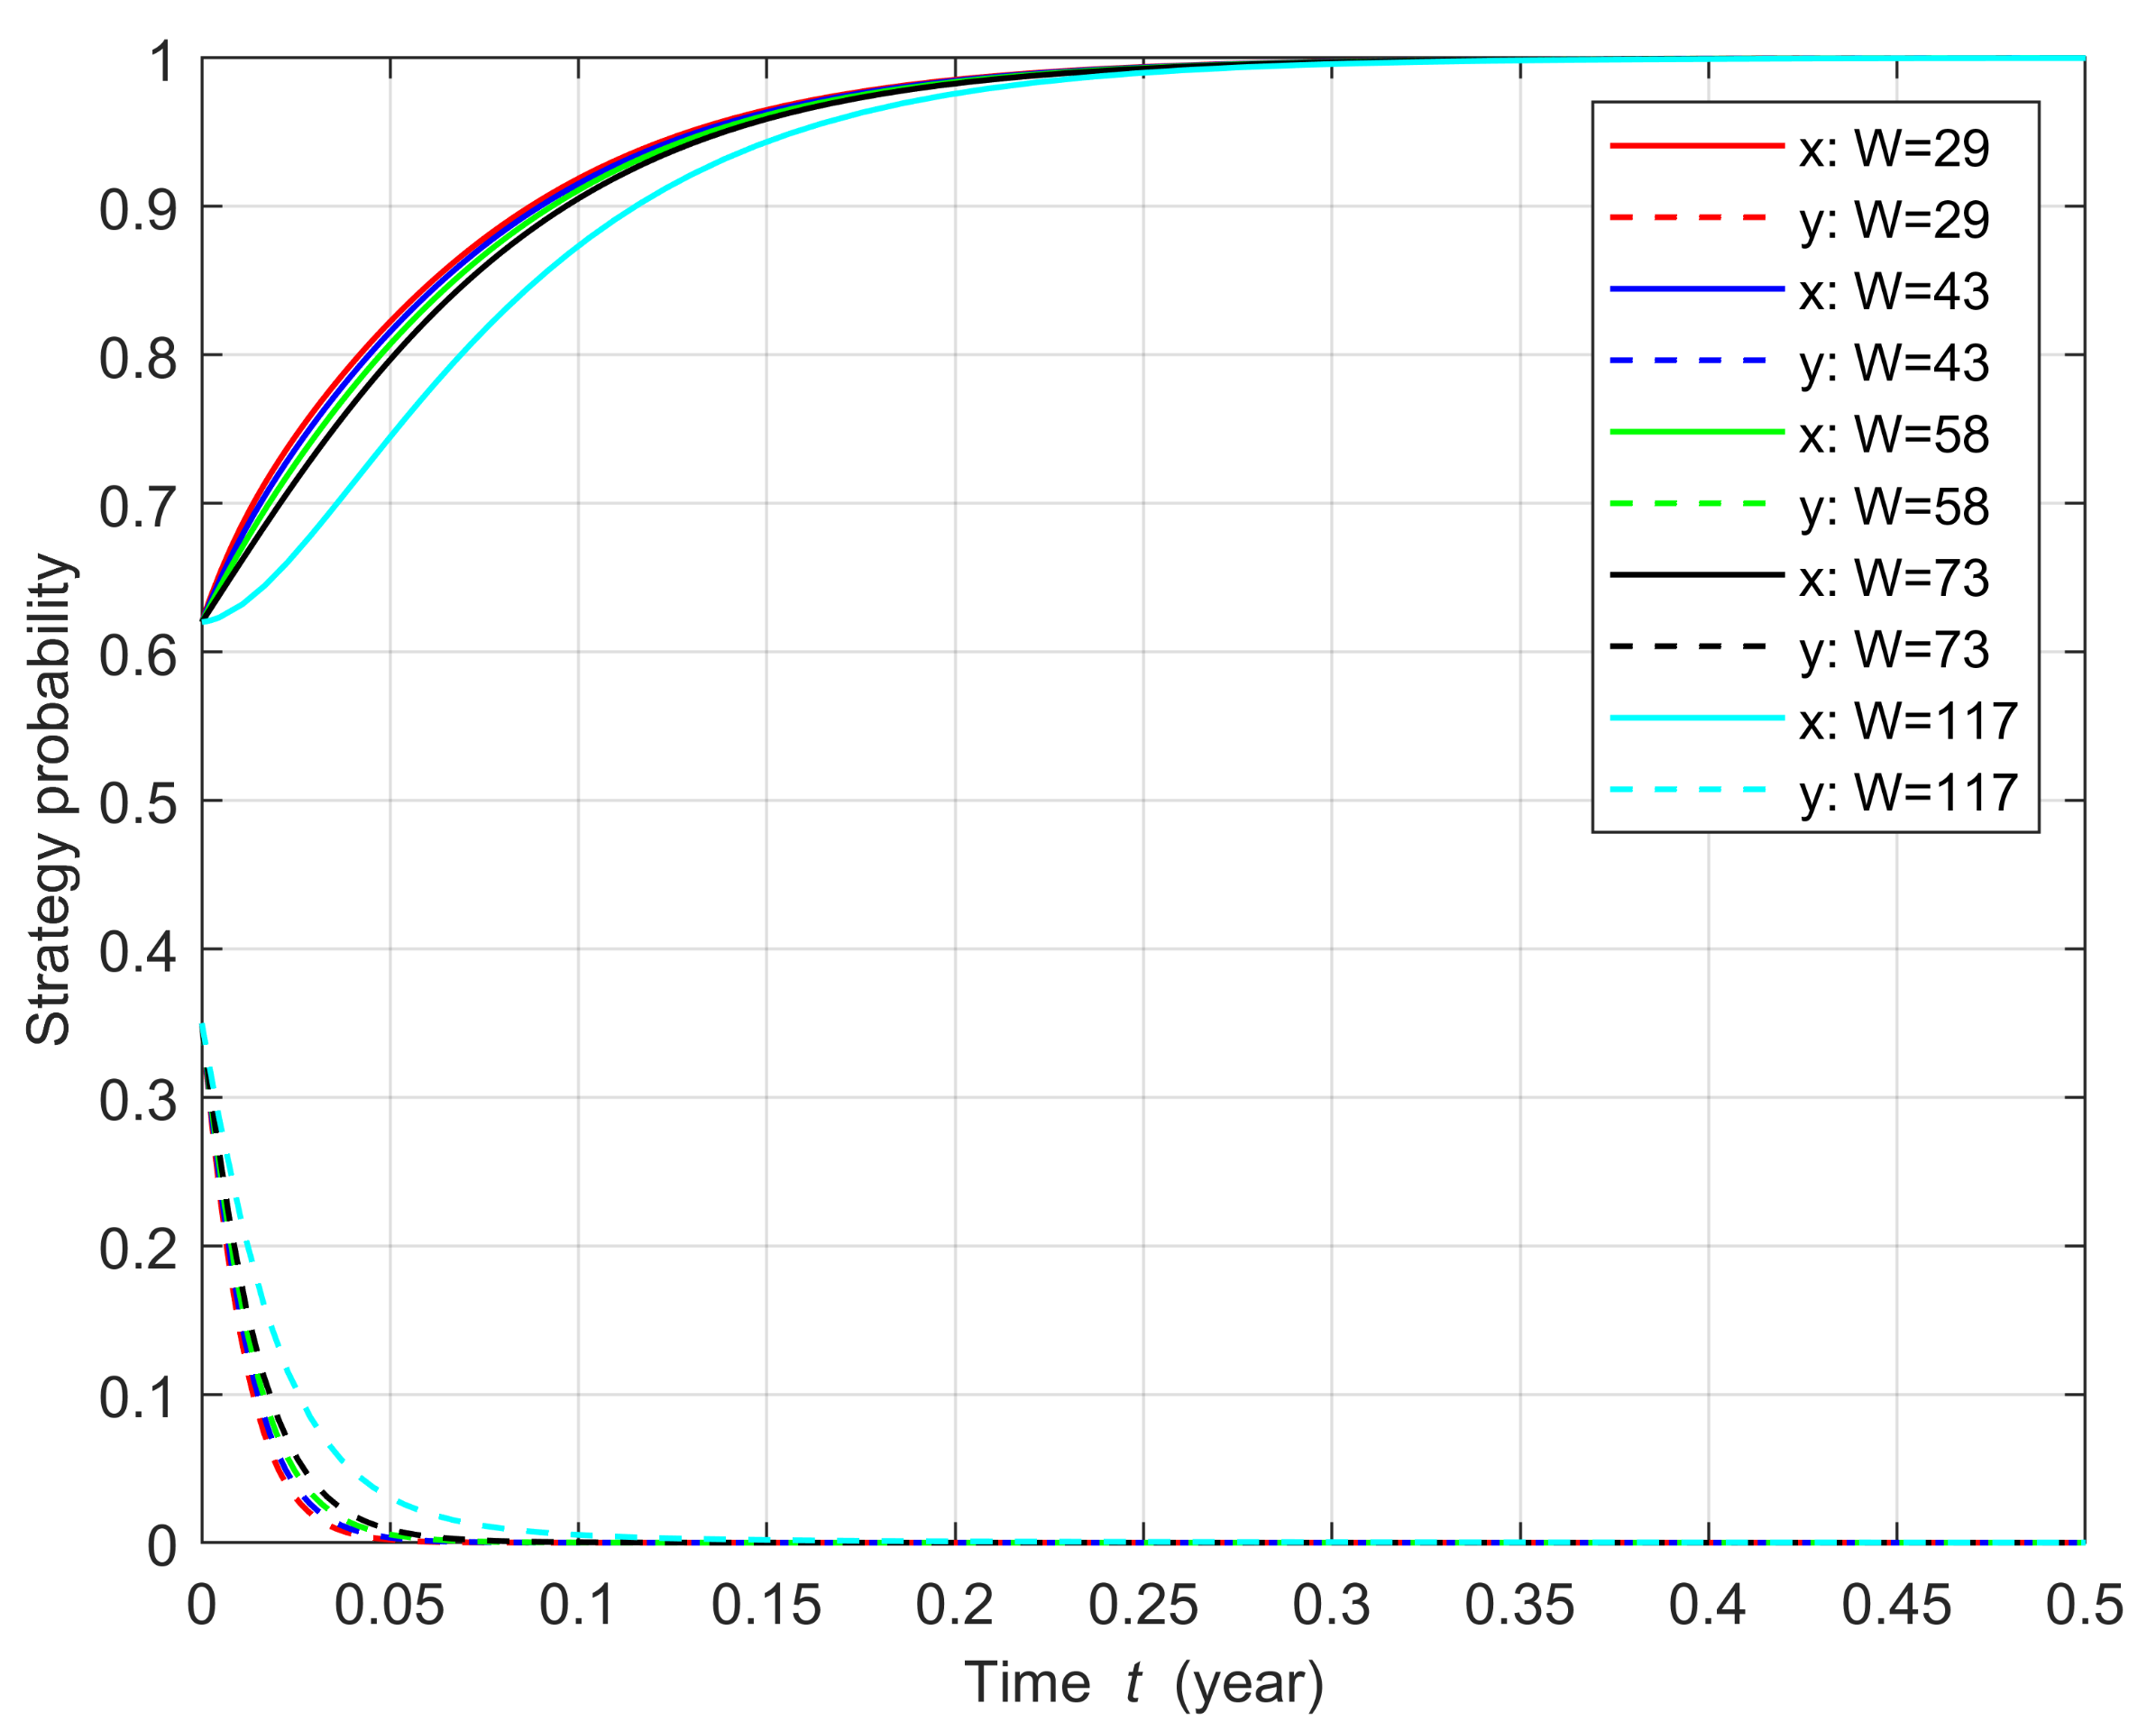
4.2.5. Subsidies on Power Plants (W)

The sensitivity of the system evolution path to changes in subsidies on power plants is shown in Figure 11. The amount of subsidy is small, compared with the cost of CCU technology deployment; thus, fluctuation of the subsidy does not cause much change in the evolutionary path of the system. Therefore, appropriate subsidies can be used as an aid to facilitate the deployment of CCU technology.
From the above sensitivity analysis, it is clear that the unit prices of hydrogen and carbon dioxide derivatives have the most significant effects on the evolutionary path of the system. A 12% reduction in the unit price of hydrogen or a 15% increase in the unit price of CO 2 -derivatives is all that is needed to change the ESS of the replicator dynamic system from a “Not adopt” to “Adopt” power plant strategy. The importance of hydrogen production cost reduction for the promotion of green methanol production has also been mentioned by Hank et al. [40], in their research work on CO 2 -to-methanol. Therefore, the government should also take measures to develop hydrogen production technology, in order to reduce the price of hydrogen and promote the adoption of CCU technology by power plants through market guidance. Appropriate financial subsidies and penalties can also play an important role in facilitating a change in the direction of the evolutionary path of power plants; this argument has been verified in the works of Chen et al. [36] and Zhao et al. [29]. They demonstrated the roles of subsidies and penalties in promoting the adoption of low-carbon production technologies and CCS technologies by firms, respectively. Nevertheless, excessive penalty amounts are not conducive to power plant development. If the attempt is to induce the plant to choose the “Adopt” strategy through penalties only, the penalty amount needs to be increased to four times the baseline scenario. In addition, similar to the conclusion reached by Gao et al. [41], the simulation results in this paper showed that the increase in regulatory costs can cause a longer convergence time of government strategies; therefore, the improvement of administrative efficiency deserves to be taken seriously.

5. Conclusions and Policy Implications

5.1. Conclusions

Advancing the deployment of CCU technology is important for both the sustainable development of coal-fired power plants and for local governments to achieve their carbon reduction mandates. In this paper, evolutionary game theory was applied to construct an evolutionary game model between local governments and coal-fired power plants, where the benchmark scenario of the evolutionary game was constructed based on data obtained from research and with reference to the relevant literature.
Through numerical analysis involving the analysis of key variables and retrograde sensitivity, we found that, in the baseline scenario, the replicator dynamic system eventually converges to the point ( 1 , 0 ) . Power plants are reluctant to adopt CCU technology and are even willing to accept government penalties due to the high cost of deploying CCU technology under existing conditions. The results of the sensitivity analysis indicate that the evolutionary path of the replicator dynamical system is most sensitive to the price of hydrogen and carbon dioxide derivatives. The ESS of the system will change from ( 1 , 0 ) to ( 1 , 1 ) when the unit price of hydrogen is lower than 15.9 RMB/kg or the unit price of carbon dioxide-derivatives is higher than 3.4 RMB/kg. Moreover, increasing policy support and regulation for the deployment of CCU technology in thermal power plants, improving administrative efficiency, and reducing regulatory costs are also important for the transformation of the system evolution path.

5.2. Implications for Stakeholders

Governments should clarify the strategic positioning of CCU technology and focus on the synergistic development of CCU technology and renewable energy hydrogen production technology. At present, the cost of hydrogen production from renewable energy is still high and is not competitive with traditional hydrogen production processes, such as coal-to-hydrogen; however, the fact that the traditional hydrogen production process is accompanied by high implied CO 2 emissions means that renewable energy hydrogen production technology has much room for progress to be made in the future. Carbon dioxide capture and utilization technology provides a huge hydrogen consumption space for renewable energy hydrogen production. Lower hydrogen market prices, due to the large-scale development of renewable energy hydrogen production technologies, will also contribute to the further proliferation of CCU technology. The synergy of these two advanced technologies will open up the precedent of green chemicals.
The government should issue relevant documents in a timely manner in order to provide policy support for the huge costs required for the pre-deployment of CCU technology. There remains a lack of relevant policy guidelines and incentives in China, resulting in the low motivation of enterprises. Local governments should provide appropriate policy support, such as tax incentives for power plants that actively adopt CCU technology. At the same time, the inclusion of the amount of CO 2 captured by power plants in the carbon trading market and the development of a suitable pricing mechanism are important tools to promote the development of CCU technology. It is also necessary to take punitive measures, such as increasing carbon taxes on companies with high CO 2 emissions.
Given the Chinese government’s strong stance on achieving carbon neutrality, coal-fired power plants need to proactively adopt CO 2 reduction measures in order to ensure their sustainable development. Currently, however, many coal-fired power plants refuse to adopt CCU technology because they are unwilling to take the risks and costs. Power plants should recognize the environmental and economic benefits that CCU technology will bring after the cost of hydrogen production from renewable energy is reduced, rather than being myopic and only concerned with immediate benefits. In the initial stage of market application of this emission reduction technology, applying for subsidies from the government can effectively reduce the expenditure of power plants. Furthermore, the adoption of CCU technology in power plants also avoids government penalties for high CO 2 emissions, which could lead to a reduction in corporate reputation.

5.3. Limitations

There were some limitations to this paper. First, we did not consider the implementation of dynamic subsidies or penalties by the government; in practice, government subsidies for promoting a new technology do not last continuously. Second, the data settings for key parameters were not entirely derived from primary data due to data accessibility limitations. The data for some parameters were set by referring to the relevant literature and cases. Combining the proposed evolutionary game model with data obtained from the LCA method may lead to more realistic simulation results. Finally, in this paper, the stakeholders of CCU technology deployment were set as local governments and coal-fired power plants. However, in reality, investment companies, research institutes, hydrogen production companies, carbon emission trading agencies, and chemical plants that purchase CO 2 derivatives are also relevant stakeholders. It remains to be explored how to build an evolutionary game model with more stakeholders in order to reveal more issues. We believe that it would be a promising research direction to integrate the green hydrogen producers and research institutions into the evolutionary game model. In addition, more detailed modeling of CCU technology in different CO 2 emission scenarios, such as cement plants and steel plants, may also lead to new discoveries.

Author Contributions

Conceptualization, S.N. and Y.C.; data curation, R.B.; funding acquisition, G.C.; methodology, S.N. and Y.L.; software, S.N. and Y.L.; supervision, G.C.; writing—original draft, S.N.; writing—review and editing, G.C., Y.C., R.B., L.G. and X.C. All authors have read and agreed to the published version of the manuscript.

Funding

We thank the support of the DNL Cooperation Fund, CAS (DNL 202024), the Chinese Academy of Engineering Projects (2020-FJ-XY-9), the Key Research and Development Project of Guangdong Province (2021B0101230004), Guangzhou Basic and Applied Basic Research Project (No.202002030189).

Institutional Review Board Statement

Not applicable.

Informed Consent Statement

Not applicable.

Data Availability Statement

The data presented in this study are available on request from the author.

Conflicts of Interest

The authors declare no conflict of interest.

Abbreviations

The following abbreviations are used in this manuscript:
RLocal government’s initial revenue
R 1 Additional environmental benefits for local governments from CCU technology deployment
G 1 Annual regulatory cost of local governments
G 2 Annual environmental cost of local governments
WSubsidies power plants receive for CCU technology deployment
C 1 CCU equipment cost
C 2 Carbon capture cost
C 3 Annual cost for purchasing hydrogen
C 4 Extra cost for CCU technology deployment
DProceeds from the sale of CCU derivatives
LExtra profit for CCU technology deployment
SInitial income of power plant
PPenalties for power plants from local governments
nAmount of captured carbon dioxide
η Efficiency of carbon dioxide conversion to derivatives
jUnit price of hydrogen
kUnit price of carbon dioxide-derived chemicals
xProbability that local governments choose the “regulate” strategy
yProbability that power plants choose the “adopt” strategy

References

  1. He, J.; Li, J.; Zhao, D.; Chen, X. Does oil price affect corporate innovation? Evidence from new energy vehicle enterprises in China. Renew. Sustain. Energy Rev. 2022, 156, 111964. [Google Scholar] [CrossRef]
  2. Mikulčić, H.; Skov, I.R.; Dominković, D.F.; Alwi, S.R.W.; Manan, Z.A.; Tan, R.; Duić, N.; Mohamad, S.N.H.; Wang, X. Flexible Carbon Capture and Utilization technologies in future energy systems and the utilization pathways of captured CO2. Renew. Sustain. Energy Rev. 2019, 114, 109338. [Google Scholar] [CrossRef]
  3. IEA. Net Zero by 2050. 2021. Available online: https://www.iea.org/reports/net-zero-by-2050/ (accessed on 9 March 2022).
  4. Mennicken, L.; Janz, A.; Roth, S. The German R&D program for CO2 utilization—Innovations for a green economy. Environ. Sci. Pollut. Res. 2016, 23, 11386–11392. [Google Scholar]
  5. Meylan, F.D.; Moreau, V.; Erkman, S. CO2 utilization in the perspective of industrial ecology, an overview. J. CO2 Util. 2015, 12, 101–108. [Google Scholar] [CrossRef]
  6. Thonemann, N.; Zacharopoulos, L.; Fromme, F.; Nühlen, J. Environmental impacts of carbon capture and utilization by mineral carbonation: A systematic literature review and meta life cycle assessment. J. Clean. Prod. 2022, 332, 130067. [Google Scholar] [CrossRef]
  7. Mallapragada, D.S.; Gençer, E.; Insinger, P.; Keith, D.W.; O’Sullivan, F.M. Can industrial-scale solar hydrogen supplied from commodity technologies Be cost competitive by 2030? Cell Rep. Phys. Sci. 2020, 1, 100174. [Google Scholar] [CrossRef]
  8. Psarras, P.C.; Comello, S.; Bains, P.; Charoensawadpong, P.; Reichelstein, S.; Wilcox, J. Carbon capture and utilization in the industrial sector. Environ. Sci. Technol. 2017, 51, 11440–11449. [Google Scholar] [CrossRef]
  9. Ho, H.J.; Iizuka, A.; Shibata, E. Carbon capture and utilization technology without carbon dioxide purification and pressurization: A review on its necessity and available technologies. Ind. Eng. Chem. Res. 2019, 58, 8941–8954. [Google Scholar] [CrossRef]
  10. Ravikumar, D.; Keoleian, G.; Miller, S. The environmental opportunity cost of using renewable energy for carbon capture and utilization for methanol production. Appl. Energy 2020, 279, 115770. [Google Scholar] [CrossRef]
  11. Li, K.; Shen, S.; Fan, J.L.; Xu, M.; Zhang, X. The role of carbon capture, utilization and storage in realizing China’s carbon neutrality: A source-sink matching analysis for existing coal-fired power plants. Resour. Conserv. Recycl. 2022, 178, 106070. [Google Scholar] [CrossRef]
  12. Jia, Z.; Lin, B. How to achieve the first step of the carbon-neutrality 2060 target in China: The coal substitution perspective. Energy 2021, 233, 121179. [Google Scholar] [CrossRef]
  13. Cai, B.; Li, Q.; Zhang, X. China CCUS Annual Report (2021)-China CCUS Path Research. 2021. Available online: http://www.cityghg.com/a/news/2021/0726/194.html (accessed on 9 March 2022).
  14. Jiang, K.; Ashworth, P.; Zhang, S.; Liang, X.; Sun, Y.; Angus, D. China’s carbon capture, utilization and storage (CCUS) policy: A critical review. Renew. Sustain. Energy Rev. 2020, 119, 109601. [Google Scholar] [CrossRef]
  15. Bowen, F. Carbon capture and storage as a corporate technology strategy challenge. Energy Policy 2011, 39, 2256–2264. [Google Scholar] [CrossRef]
  16. Arning, K.; Offermann-van Heek, J.; Sternberg, A.; Bardow, A.; Ziefle, M. Risk-benefit perceptions and public acceptance of Carbon Capture and Utilization. Environ. Innov. Soc. Transit. 2020, 35, 292–308. [Google Scholar] [CrossRef]
  17. Bruhn, T.; Naims, H.; Olfe-Kräutlein, B. Separating the debate on CO2 utilisation from carbon capture and storage. Environ. Sci. Policy 2016, 60, 38–43. [Google Scholar] [CrossRef]
  18. Aldaco, R.; Butnar, I.; Margallo, M.; Laso, J.; Rumayor, M.; Dominguez-Ramos, A.; Irabien, A.; Dodds, P.E. Bringing value to the chemical industry from capture, storage and use of CO2: A dynamic LCA of formic acid production. Sci. Total Environ. 2019, 663, 738–753. [Google Scholar] [CrossRef]
  19. Cormos, A.M.; Dinca, C.; Petrescu, L.; Chisalita, D.A.; Szima, S.; Cormos, C.C. Carbon capture and utilisation technologies applied to energy conversion systems and other energy-intensive industrial applications. Fuel 2018, 211, 883–890. [Google Scholar] [CrossRef]
  20. Chen, Q.; Gu, Y.; Tang, Z.; Wei, W.; Sun, Y. Assessment of low-carbon iron and steel production with CO2 recycling and utilization technologies: A case study in China. Appl. Energy 2018, 220, 192–207. [Google Scholar] [CrossRef]
  21. Farfan, J.; Fasihi, M.; Breyer, C. Trends in the global cement industry and opportunities for long-term sustainable CCU potential for Power-to-X. J. Clean. Prod. 2019, 217, 821–835. [Google Scholar] [CrossRef]
  22. Lu, L.; Guest, J.S.; Peters, C.A.; Zhu, X.; Rau, G.H.; Ren, Z.J. Wastewater treatment for carbon capture and utilization. Nat. Sustain. 2018, 1, 750–758. [Google Scholar] [CrossRef]
  23. Wang, G.; Chao, Y.; Chen, Z. Promoting developments of hydrogen powered vehicle and solar PV hydrogen production in China: A study based on evolutionary game theory method. Energy 2021, 237, 121649. [Google Scholar] [CrossRef]
  24. Gao, X.; Shen, J.; He, W.; Sun, F.; Zhang, Z.; Guo, W.; Zhang, X.; Kong, Y. An evolutionary game analysis of governments’ decision-making behaviors and factors influencing watershed ecological compensation in China. J. Environ. Manag. 2019, 251, 109592. [Google Scholar] [CrossRef] [PubMed]
  25. Shan, H.; Yang, J. Sustainability of photovoltaic poverty alleviation in China: An evolutionary game between stakeholders. Energy 2019, 181, 264–280. [Google Scholar] [CrossRef]
  26. Kabir, K.A.; Tanimoto, J. Evolutionary game theory modelling to represent the behavioural dynamics of economic shutdowns and shield immunity in the COVID-19 pandemic. R. Soc. Open Sci. 2020, 7, 201095. [Google Scholar] [CrossRef] [PubMed]
  27. Wang, G.; Chao, Y.; Jiang, T.; Chen, Z. Facilitating developments of solar thermal power and nuclear power generations for carbon neutral: A study based on evolutionary game theoretic method. Sci. Total Environ. 2021, 814, 151927. [Google Scholar] [CrossRef]
  28. Qiao, W.; Yin, X. Understanding the impact on energy transition of consumer behavior and enterprise decisions through evolutionary game analysis. Sustain. Prod. Consum. 2021, 28, 231–240. [Google Scholar] [CrossRef]
  29. Zhao, T.; Liu, Z. A novel analysis of carbon capture and storage (CCS) technology adoption: An evolutionary game model between stakeholders. Energy 2019, 189, 116352. [Google Scholar] [CrossRef]
  30. Ji, S.; Zhao, D.; Luo, R. Evolutionary game analysis on local governments and manufacturers’ behavioral strategies: Impact of phasing out subsidies for new energy vehicles. Energy 2019, 189, 116064. [Google Scholar] [CrossRef]
  31. Friedman, D. Evolutionary games in economics. Econom. J. Econom. Soc. 1991, 59, 637–666. [Google Scholar] [CrossRef] [Green Version]
  32. Daily, F.F. CPI Carbon Capture Device Officially Put into Operation. 2010. Available online: https://www.in-en.com/article/html/energy-559116.shtml (accessed on 9 March 2022).
  33. Nyári, J.; Magdeldin, M.; Larmi, M.; Järvinen, M.; Santasalo-Aarnio, A. Techno-economic barriers of an industrial-scale methanol CCU-plant. J. CO2 Util. 2020, 39, 101166. [Google Scholar] [CrossRef]
  34. Hoppe, W.; Thonemann, N.; Bringezu, S. Life cycle assessment of carbon dioxide–based production of methane and methanol and derived polymers. J. Ind. Ecol. 2018, 22, 327–340. [Google Scholar] [CrossRef]
  35. Kauw, M. Recycling of CO2, the Perfect Biofuel; University of Groningen: Groningen, The Netherlands, 2012. [Google Scholar]
  36. Chen, W.; Hu, Z.H. Analysis of multi-stakeholders’ behavioral strategies considering public participation under carbon taxes and subsidies: An evolutionary game approach. Sustainability 2020, 12, 1023. [Google Scholar] [CrossRef] [Green Version]
  37. Council, H. Path to Hydrogen Competitiveness: A Cost Perspective; Institution of Gas Engineers & Managers: Kegworth, UK, 2020. [Google Scholar]
  38. Fan, J.L.; Yu, P.; Li, K.; Xu, M.; Zhang, X. A levelized cost of hydrogen (LCOH) comparison of coal-to-hydrogen with CCS and water electrolysis powered by renewable energy in China. Energy 2022, 242, 123003. [Google Scholar] [CrossRef]
  39. Yu, M.; Wang, K.; Vredenburg, H. Insights into low-carbon hydrogen production methods: Green, blue and aqua hydrogen. Int. J. Hydrog. Energy 2021, 46, 21261–21273. [Google Scholar] [CrossRef]
  40. Hank, C.; Gelpke, S.; Schnabl, A.; White, R.J.; Full, J.; Wiebe, N.; Smolinka, T.; Schaadt, A.; Henning, H.M.; Hebling, C. Economics & carbon dioxide avoidance cost of methanol production based on renewable hydrogen and recycled carbon dioxide–power-to-methanol. Sustain. Energy Fuels 2018, 2, 1244–1261. [Google Scholar]
  41. Gao, L.; Zhao, Z.Y. The evolutionary game of stakeholders’ coordination mechanism of new energy power construction PPP project: A China case. Sustainability 2020, 12, 1045. [Google Scholar] [CrossRef] [Green Version]
Figure 1. Behavioral strategy framework considering local governments and power plants.
Sustainability 14 04768 g001
Figure 2. The evolutionary game structure tree of strategies.
Sustainability 14 04768 g002
Figure 3. Dynamic evolutionary paths for local government’s strategies (ac) represent the dynamic evolutionary paths of local governments in Case a, Case b and Case c, respectively).
Sustainability 14 04768 g003
Figure 4. Dynamic evolutionary path for coal-fired power plant’s strategies (ac) represent the dynamic evolutionary paths of coal-fired power plant’s in Case d, Case e and Case f, respectively).
Sustainability 14 04768 g004
Figure 5. Dynamic evolutionary path of the replicator dynamic system.
Sustainability 14 04768 g005
Figure 6. System evolutionary path with different initial probabilities.
Sustainability 14 04768 g006
Figure 7. Effect of unit price of hydrogen (j).
Sustainability 14 04768 g007
Figure 8. Effects of unit price of carbon dioxide-derived chemicals (k).
Sustainability 14 04768 g008
Figure 9. Effects of regulatory cost ( G 1 ).
Sustainability 14 04768 g009
Figure 10. Effects of punishments on power plants (P).
Sustainability 14 04768 g010
Figure 11. Effects of subsidies on power plants (W).
Sustainability 14 04768 g011
Table 1. Payoff matrix.
Coal-Fired Power Plants
Adopt (y)Not Adopt ( 1 y )
Local governmentsRegulate (x)( R + R 1 G 1 W , W α + S )( R G 1 G 2 + P , S P )
Not regulate ( 1 x )(R, S α )( R G 2 , S)
Table 2. The results of detJ and trJ at the equilibrium points.
PointsdetJtrJ
( 0 , 0 ) ( P G 1 ) ( α ) P G 1 α
( 0 , 1 ) ( R 1 W G 1 ) ( α ) R 1 W G 1 + α
( 1 , 0 ) ( G 1 P ) ( W + P α ) G 1 + W α
( 1 , 1 ) ( R 1 W G 1 ) ( W + P α ) G 1 + α P R 1
( x 1 , y 1 ) α ( W + P α ) ( G 1 P ) ( R 1 W G 1 ) / [ ( W + P ) ( R 1 W P ) ] 0
Table 3. State of the equilibrium points under various cases.
PointsdetJtrJStatedetJtrJStatedetJtrJState
Case 1Case 2Case 3
( 0 , 0 ) ++UnstableNSaddle pointNSaddle point
( 0 , 1 ) ++Unstable++Unstable++Unstable
( 1 , 0 ) +Saddle pointNSaddle point+ESS
( 1 , 1 ) +ESS+ESSNSaddle point
( x 1 , y 1 ) +0Central point+0Central point0Saddle point
Case 4Case 5Case 6
( 0 , 0 ) NSaddle point+ESS+ESS
( 0 , 1 ) NSaddle point++Unstable++Unstable
( 1 , 0 ) ++Unstable++UnstableNSaddle point
( 1 , 1 ) +ESS+ESSNSaddle point
( x 1 , y 1 ) +0Central point0Saddle point+0Central point
Case 7Case 8Case 9
( 0 , 0 ) NSaddle point+ESS+ESS
( 0 , 1 ) +ESSNSaddle pointNSaddle point
( 1 , 0 ) +Saddle point++UnstableNSaddle point
( 1 , 1 ) NSaddle pointNSaddle point++Unstable
( x 1 , y 1 ) +0Central point0Saddle point+0Central point
+ means greater than zero; − means less than zero; and N denotes uncertainty.
Table 4. Key parameter values for baseline scenario.
ParametersValuesData ReferenceParametersValuesData Reference
R 1 102.6[29]D791.28[35]
G 1 15[30]L21.8-
W29.2[29]P32.85[36]
C 1 18.03[32] C 3 898.77[35]
C 2 48.54[34] C 4 5-
Publisher’s Note: MDPI stays neutral with regard to jurisdictional claims in published maps and institutional affiliations.

