Abstract
Undernutrition is a considerable challenge in sub-Saharan Africa, especially in countries affected by a protracted crisis, but the literature lacks information on the underlying mechanisms influencing micro- and macronutrients, and appropriate analytical tools are needed to assist policymakers and implementers. The paper contributes to filling this gap, focusing on the Western Bahr el Ghazal state in South Sudan and using primary data collected in May–June 2019 for a statistically representative sample of households. The literature typically uses one micro- or macronutrient as a proxy of nutritional status. On the contrary, the study applied a MANCOVA with an artificial dependent variable, including protein, vitamin A, and heme iron, in a single experiment to discover the variables that better explain household nutritional status. Dietary diversity explains the largest proportion of variance in household nutritional status. The importance of the variables in explaining the variance in the specific micro- and macronutrients depends on the explanatory variable. Therefore, the results suggest the possible misinterpretation of undernutrition using one nutrient. Moreover, they highlight the importance of a multisectoral approach to the problem with a central role played by agriculture and the urgency of the reinforcement of the humanitarian–development–peace nexus to improve household nutrition security in South Sudan.
1. Introduction
Achieving the Sustainable Development Goal (SDG) number 2 on ending hunger requires a broader definition of the concept of hunger, including calorie deficiencies and health problems and nutrient deficiencies. Recently, the need to focus on nutrient deficiency is even more urgent considering the effect of the COVID-19 pandemic on nutrition security. The FAO [1] has estimated that, due to this pandemic, a growing number of people were forced to limit the quantity and quality of the food they consume. Two billion people worldwide suffered from hunger or did not have regular access to nutritious and sufficient food in 2019. Moreover, in sub-Saharan Africa, reducing undernutrition has been too slow [2]. In this situation, the global nutrition targets decided by the World Health Assembly in 2012 are a long way from being accomplished by 2030 [3]. Even the achievement of Goal 3, described in the first aspiration of the African Agenda 2063, aiming at healthy and well-nourished citizens [4], might be compromised, as well as the target agreed by the African Union to eliminate hunger and food insecurity by 2025 [5].
According to the WFP [6], undernutrition hampers the physical function of an individual up to the point that this person cannot maintain adequate bodily performance. It is one of the most critical factors responsible for child mortality and reduced productivity and quality of life [7]. It results from the inadequacy of both micro- and macronutrients relative to the need. A lack of macronutrients compromises growth and causes wasting and stunting among children under five years of age, while micronutrients deficiency leads to chronic undernutrition [8].
Undernutrition is a considerable challenge in sub-Saharan Africa, where nutrient inadequacy is a severe development threat and public health problem. For example, more than nine out of ten stunted children live in Africa. Their number increased from 51.2 million in 2012 to 52.4 million in 2019. In 2019, more than 30 per cent of children under five were identified as stunted [1].
The situation is more difficult in countries facing a protracted crisis, such as South Sudan, one of the most food insecure countries globally and where acute malnutrition is a significant problem [9]. The civil war and violence that started in 2013 have caused widespread destruction, death, and displacement in the country. They have led to the country’s economic collapse, eroding households’ capacity to secure sufficient nutritious food [10]. Climate change and, more recently, locust invasion have exacerbated this situation with the consequence that, according to the most recent data, nearly 54 per cent of the population is acutely food insecure [11], and almost 1.5 million children under five are estimated to be undernourished [12]. Health, education, water, and sanitation conditions are poor in the country, and agriculture and rural development are limited due to the inadequate government capacity and the restricted human resource base. Consequently, poverty is extremely high, with more than 80 per cent of the population falling in this category.
The literature on nutrition security is scarce, especially in countries in protracted crises, mainly due to limited access to information. However, understanding the underlying mechanisms influencing micro- and macronutrients is imperative to assist policymakers and programme implementers in monitoring and evaluating existing food and nutrition security programmes and designing effective policies and strategies in this field. This information and appropriate analytical tools are urgently needed considering that the SDGs’ international commitment has brought back nutrition among the most critical elements of development policies and economic growth [13].
The present study contributes to covering this gap. Referring to a statistically representative sample of 1381 randomly selected households, it investigates determinant factors of household micro- and macronutrition security using the primary data collected in the counties of Wau, Baggari, Bazia, and Bessellia in Western Bahr el Ghazal, a state in South Sudan, from 6 May to 6 June 2019. More precisely, this paper uses protein, vitamin A, and heme iron to represent the household micro and macro nutritional status and identifies which independent variable is important for their explanation.
Very poor socioeconomic conditions characterise Wau, Baggari, Bazia, and Bessellia. A dramatic political crisis in 2014, a severe conflict situation from 2016 to 2019, and the continuous, intermittent intercommunal violence episodes are recent events that have led to constant destruction and looting of properties and infrastructures. This situation has compromised access to essential services, especially food, to most households in the investigated area [14]. More than 30% of them are severely food insecure, and almost 49% are moderately food insecure. Moreover, nearly the totality of the households in the study area is highly vulnerable to food insecurity, and their diet is far from being nutritious for most of them. The largest food source for households is self-production, which constitutes the primary livelihood. The agricultural sector largely remains at the subsistence level, focused on low-input/low-output agriculture. The crop yields are low, primarily due to a lack of knowledge, agricultural inputs such as seeds and fertilisers, storage facilities, and irrigation development. The job opportunities for the working-age population are compromised by a fragile and unstable economy and a widespread situation of insecurity that limits the availability of jobs in the formal and informal market. Illiteracy is widespread, with more than half of the population unable to read and write. Moreover, the educational level is very low; primary schooling is the dominant formal education in the investigated area. The basic water supply coverage is minimal, and health infrastructures are rudimental.
Sassi [15] indicated that, recently, security and freedom of movement have improved, particularly in Baggari, Bazia, and Besselia. This situation raises the need to establish the key elements of programming in the region. Therefore, the present paper contributes to the scarce literature on nutrition security in countries affected by protracted crises and provides robust essential features for designing nutritional programmes in the investigated area. In fact, this study is based on data collected during the first initiatives of systematic quantitative survey data collection on food security and livelihoods in Western Bahr el Ghazal. In conflict situations, much of the research is qualitative and based on a non-representative sample with several limitations in its value [16].
The approach I adopted in the present study is another new element introduced in the literature. The literature on the topic traditionally considers stunting, wasting, or consuming micronutrients, mainly vitamin A, as indicators to measure nutritional status [17,18,19].
The published papers typically focus on one of these elements independently of the other dimensions of nutrition security. Therefore, they address only one aspect of the overall problem. On the contrary, the present analysis used, in a single experiment, multiple dependent variables represented by linear combinations of the frequency of consumption of protein, vitamin A, and heme iron. This approach offers a better possibility of discovering which independent variable is truly important for explaining the household micro and macro nutritional status. With this approach, this paper has also reduced the likelihood of type I errors that might occur when conducting independent estimates. More precisely, the study used a multivariate analysis of covariance (MANCOVA) to detect statistical differences in my multiple continuous dependent variables of micro- and macronutrients by a set of grouping variables, controlling for covariates.It estimated the parameters of the proposed model independently by a multivariate regression to detect how groups differ for each of my measured dependent variables. To this purpose, the present paper also tested for pairwise comparisons using the F-test. It selected factors and covariates based on theory, the specific context, and statistical tests.
2. Materials and Methods
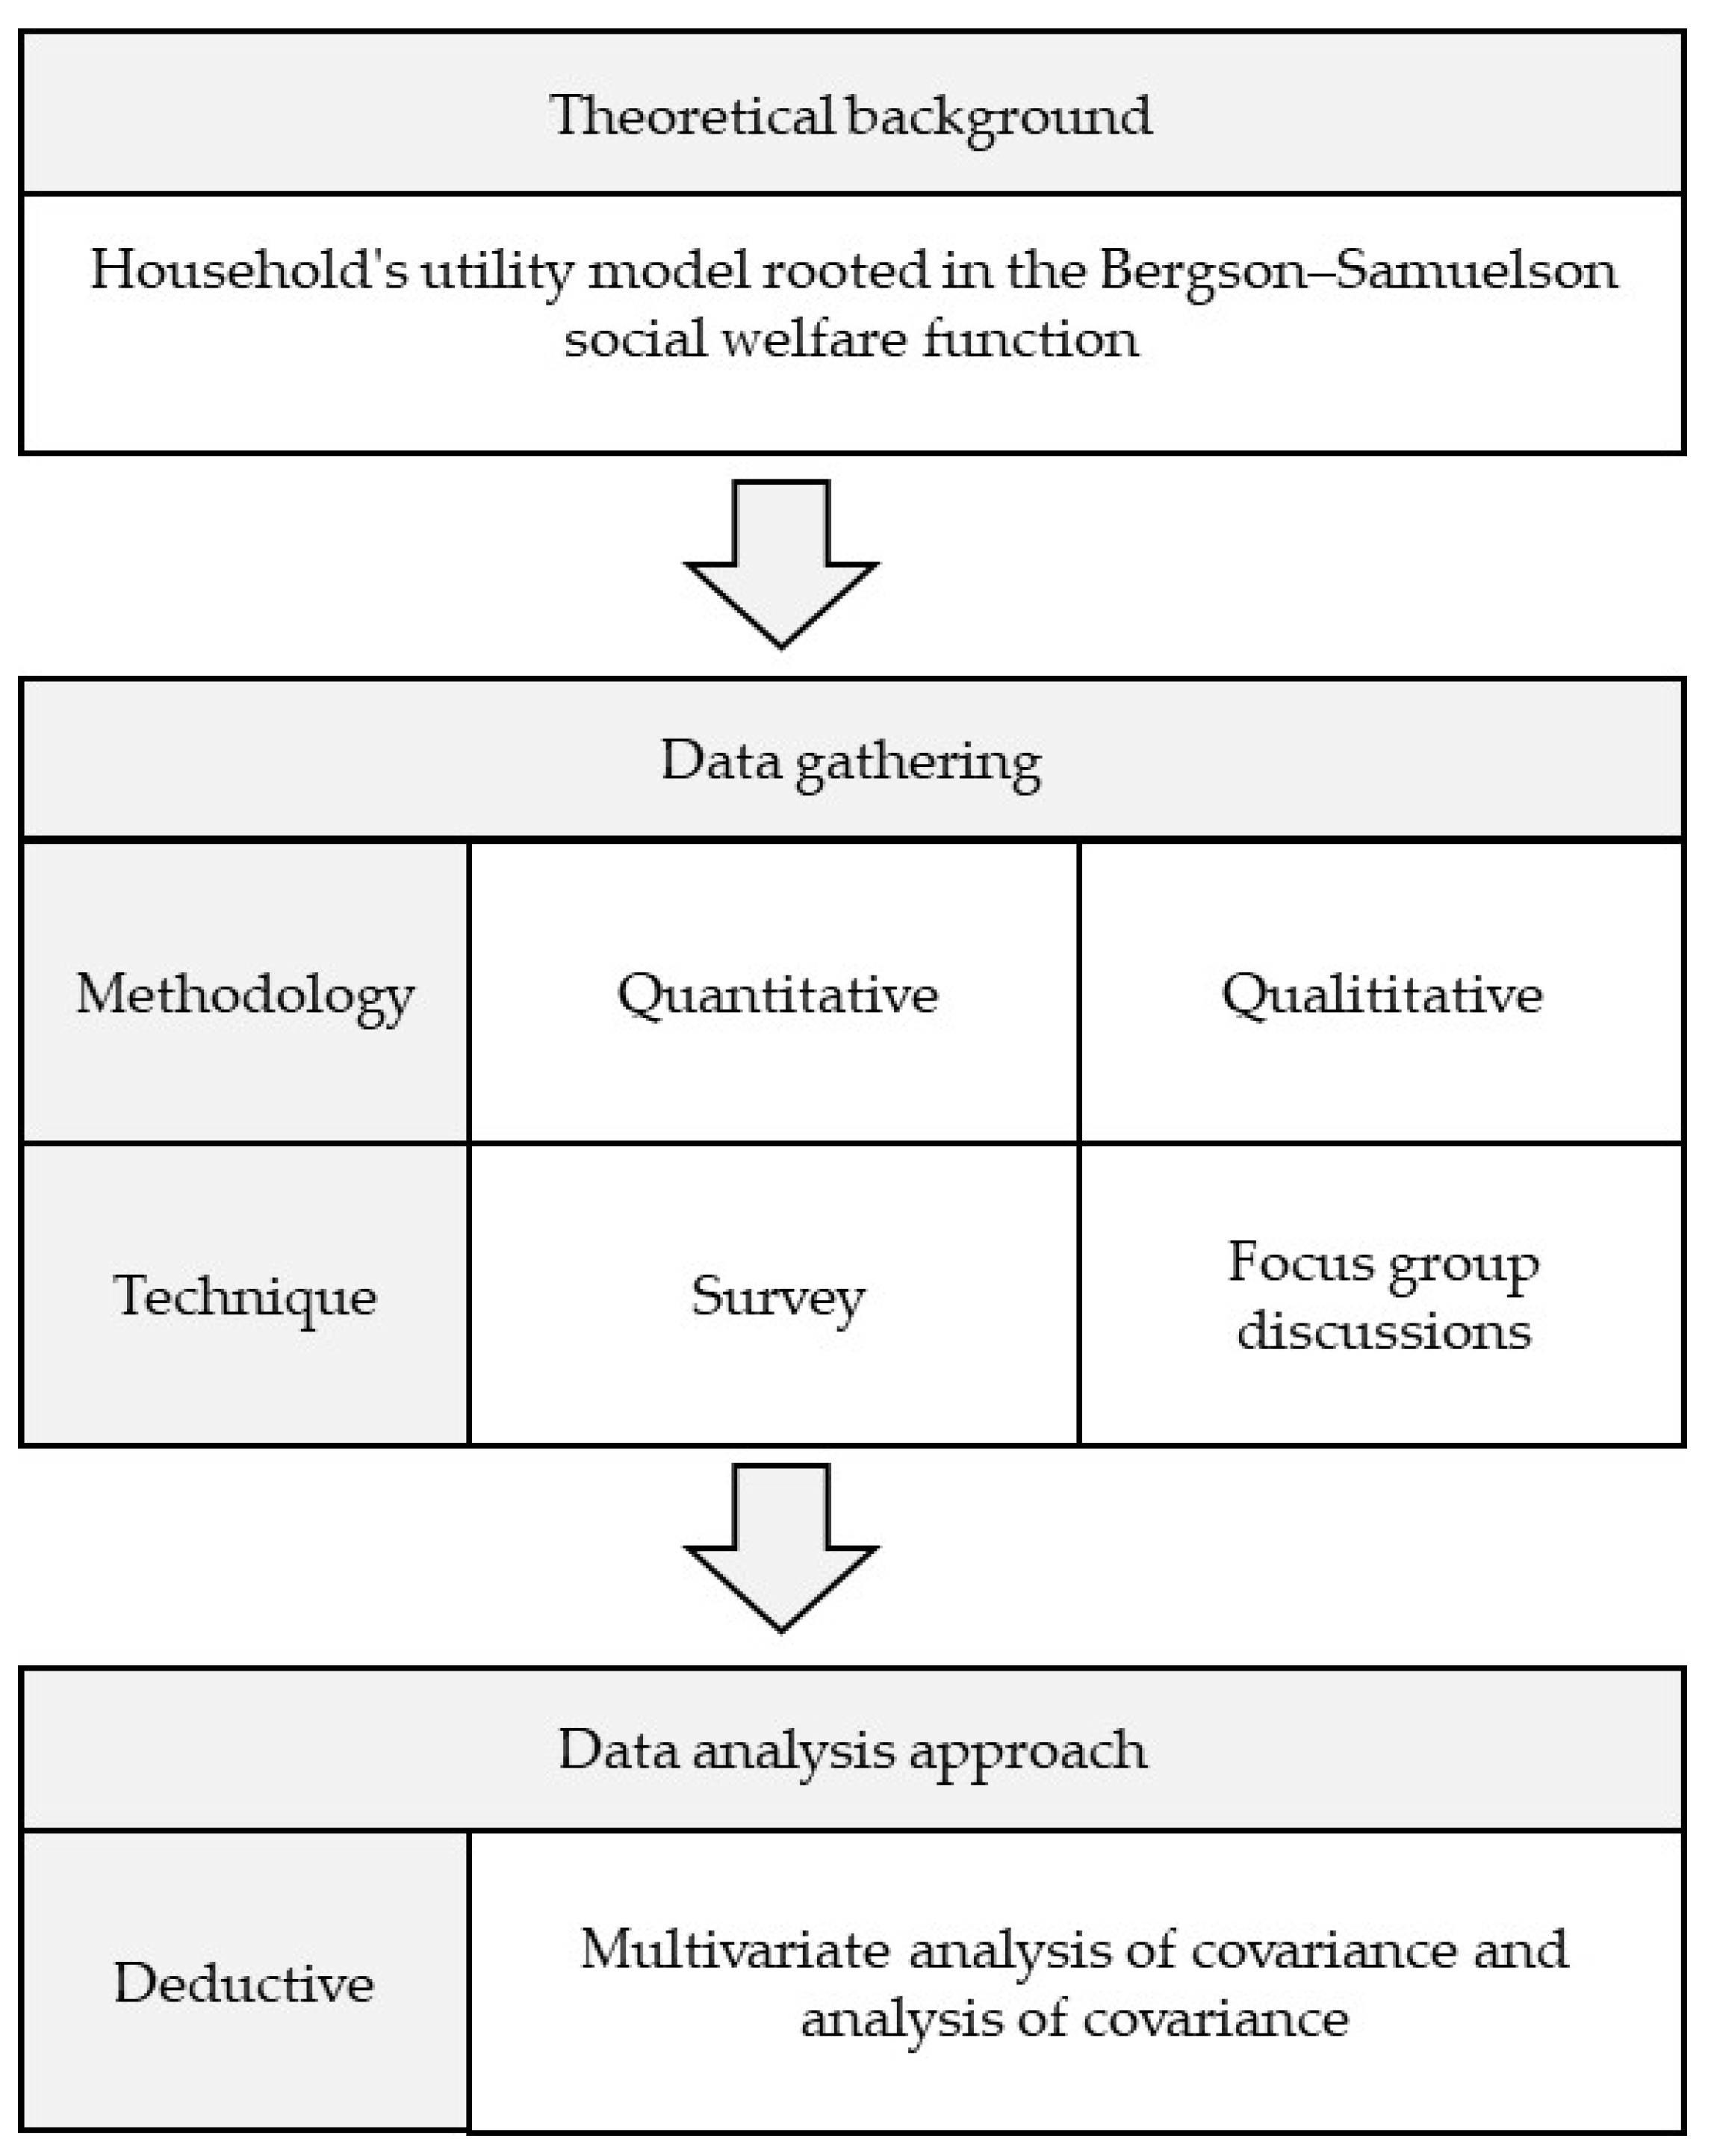
The present paper follows the research procedure illustrated in Figure 1. A specific sub-paragraph is dedicated to the presentation of each of its building blocks. More precisely, the following provides the description of the theoretical framework and the related model designed for the empirical analysis, the econometric strategy adopted, the steps followed for collecting data, and the details on variable construction.
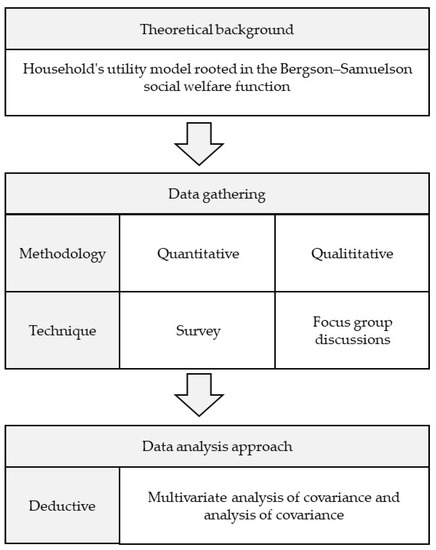
Figure 1.
Research procedure framework.
2.1. Theoretical Framework
This study adopts the household’s utility model, rooted in the Bergson–Samuelson social welfare function, to investigate the determinant factors of household nutrition security in the Western Bahr el Ghazal region in South Sudan [20,21]. The literature applies this theoretical framework typically on the analysis of food insecurity at the household level, and I extended its use to the specific field of investigation.
I assume that the utility function of a representative household has the following form:
where N is the nutrition provision function of each i-th member of the household (i = 1, ..., I), F is their consumption of k (k = 1, …, K) food items, Z is the consumption bundle of non-food items, and T is leisure time.
The utility function, which satisfies some conditions (U’ > 0 and U” < 0), is maximised by the household following a bargaining process under a budget constraint and different technology constraints, including the nutrition production technology.
The budget constraint is as follows:
where pk is the per-unit price of k food items home produced and purchased from the market and Y is the income. The price of non-food items is typically normalised to one.
I specified the nutrition provision function in the following form:
where NFC is the consumption frequency of nutrient-rich foods. Following the WFP [8] (p. 8), the number of times nutrient-rich food groups are consumed in a recall period of 7 days is positively associated with how adequate the nutrient intake is for the household. XI is a vector of non-food inputs used to produce consumers’ nutritional status, and T is leisure time. The literature suggests that some household characteristics (H) affect the nutrition provision function, such as educational level, age, gender, religion, health conditions, employment status, and household size and composition [22,23]. Moreover, the household environment (E) is also relevant in the nutrition production function, including the health environment, consisting of access to water and health and sanitation services [24], and the security environment for the effect of conflicts on the nutritional outcome [25,26].
In the nutrition provision function described by Equation (3), the input NFC is constrained by the following production function:
Based on the evidence provided by the literature, one can assume that production technology is non-linear. This assumption implies that an increase in any food items consumed does not result in a proportional improvement in the nutritional status. As explained by the literature, it also depends on dietary diversity (DD) [27].
Solving the utility maximisation problem and following Ogundari [28], Sing et al. [29], and Smith [30], a generic reduced form equation for the nutrients demand at the household level can be written as follows:
where w is the wage rate and Y* is the optimal or full income.
I specified the empirical model I adopted referring to Equation (5). Following Amjad and Akbar [31], I excluded the price vector because I used cross-sectional data.
2.2. Model and Econometric Strategy
The present study estimated model 5 using a MANCOVA approach and considering three categories of variables: the original dependent continuous variables, the factors or grouping variables, and the continuous covariates. This approach creates a new dependent variable (Ynew) as a weighted linear combination of the original measured dependent variables and investigates mean differences among groups of each factor after adjusting the newly created dependent variable for differences in the covariates [32]. MANCOVA removes the effects of the covariates from the model. It first conducts a regression of the covariates on the new dependent variable to eliminate their influence from the analysis. Afterwards, the unexplained variance in the regression model is subject to a multivariate analysis of variance (MANOVA) to test whether the newly created variable differs from the different groups of the factors. In other words, this technique reduces the determinant of the error covariance matrix, improving the precision of the design.
I specified the MANCOVA model as follows:
The new dependent variable, for each factor, combines the original dependent variables to maximise the group differences in the factors as follows:
with j denoting the independent variables and α the weights.
As original dependent variables, I used the consumption frequency of three nutrient-rich food groups, protein (Protein), heme iron (Heme_iron), and vitamin A (Vitamin), to represent both micro- and macronutrients in the estimated model.
There are six factors included in the model. First, the dietary diversity score organised in three categories (DDS) to detect the role of poor dietary diversity as a common source of malnutrition and especially of hidden hunger [33]. Moreover, dietary diversity is a measure of household food insecurity which is one of the most important contributing factors to malnutrition in South Sudan [34].
Access to land for cultivation (land_access) was included as a grouping variable in my model because it is one of the most important sources of income and food security in the investigated area [35], where the population mainly relies on farming for their livelihoods. Moreover, access to land is linked to the general security situation and the still ongoing resource-based conflict on which the opportunity to cultivate crops depends.
I also included the literacy status of the household head (literacy) among the grouping variables. A large body of literature identifies it as a crucial factor influencing the household’s nutritional and food security status. Literacy provides more and better employment opportunities and a better income that is expected to be associated with an improved diet. Moreover, it increases household information on nutritional and safe food elements, which is crucial for enhancing diet quality [36]. Illiteracy is one of the reasons for low human development among the population in the study area. Moreover, it is strongly related to the conflict that limits the accessibility to and availability of social services [34].
I adopted two factors for representing household diseases: the presence of sick children (children_sick) and chronically ill people (chronic_problem) in the household. I included them in my analysis because, according to the literature, nutrient deficiencies are associated with diseases [37].
The last grouping variable considered is the resident and displaced status of households (resident). I introduced this distinction to capture the household security environment. Displacement is one of the most critical conflict and intercommunal violence outcomes that is still widespread in the four counties considered, particularly in Baggari, Bazia, and Besselia [14].
Three covariates statistically significantly correlated with the dependent variables completed my model. They include a household labour force participation rate (labour_part_rate) to adjust the model for the household labour capacity, the household size in adult equivalent (hh_size) to control for the household size and composition, and a household Water, Sanitation, and Hygiene (WASH) index (hhenvironment_index) to adjust for the household health environment. This latter variable is of critical importance in the investigated area. Conflict, violence, and insecurity have severely limited access to safe water and basic sanitation facilities. The consequent spread of diseases impedes people from absorbing nutrients from food [38] and fuels household food insecurity [15].
I selected the variables mentioned above to represent the theoretical model specified by Equation (5), the situation in the investigated area, and to respect the assumptions of the MANCOVA analysis. I also used the statistical significance of the terms for model reduction and to increase its precision of prediction. I used MANCOVA to test the statistical significance of the effect of the independent variables on the selected set of dependent variables after controlling for covariates.
Afterwards, I estimated the parameters of the model conducting a covariance analysis (ANCOVA). Therefore, I verified the degree to which groups differ for each original dependent variable. ANCOVA evaluates whether the means of an original dependent variable are equal across levels of a grouping of independent variables while statistically controlling for the effects of covariates. Finally, I applied an F-test for pairwise comparisons to test the null hypothesis that the difference in the coefficients of an independent variable in two equations is equal to 0. I implemented the MANCOVA and ANCOVA using STATA 17.0.
2.3. Data Collection and Variables Construction
As previously highlighted, I based my empirical analysis on primary data collected in the counties of Wau, Baggari, Bazia, and Bessellia in the Western Bahr el Ghazal state of South Sudan from 6 May to 6 June 2019 (Figure 2).

Figure 2.
Western Bahr el Ghazal state and the study location.
The seasonal intercommunal conflicts in Baggari, Bazia, and Bessellia and the consequent security prevented access to information on population and their needs. This situation affected the sample selection process. Due to the absence of official information on the number of people and households living in these counties, I consulted the chiefs and paramount chiefs during several field visits. With their support, I determined the number of people living in each county, and based on the declared average household size, I estimated the total number of households. For Wau, I determined the number of households living in the city by referring to the population census from official sources.
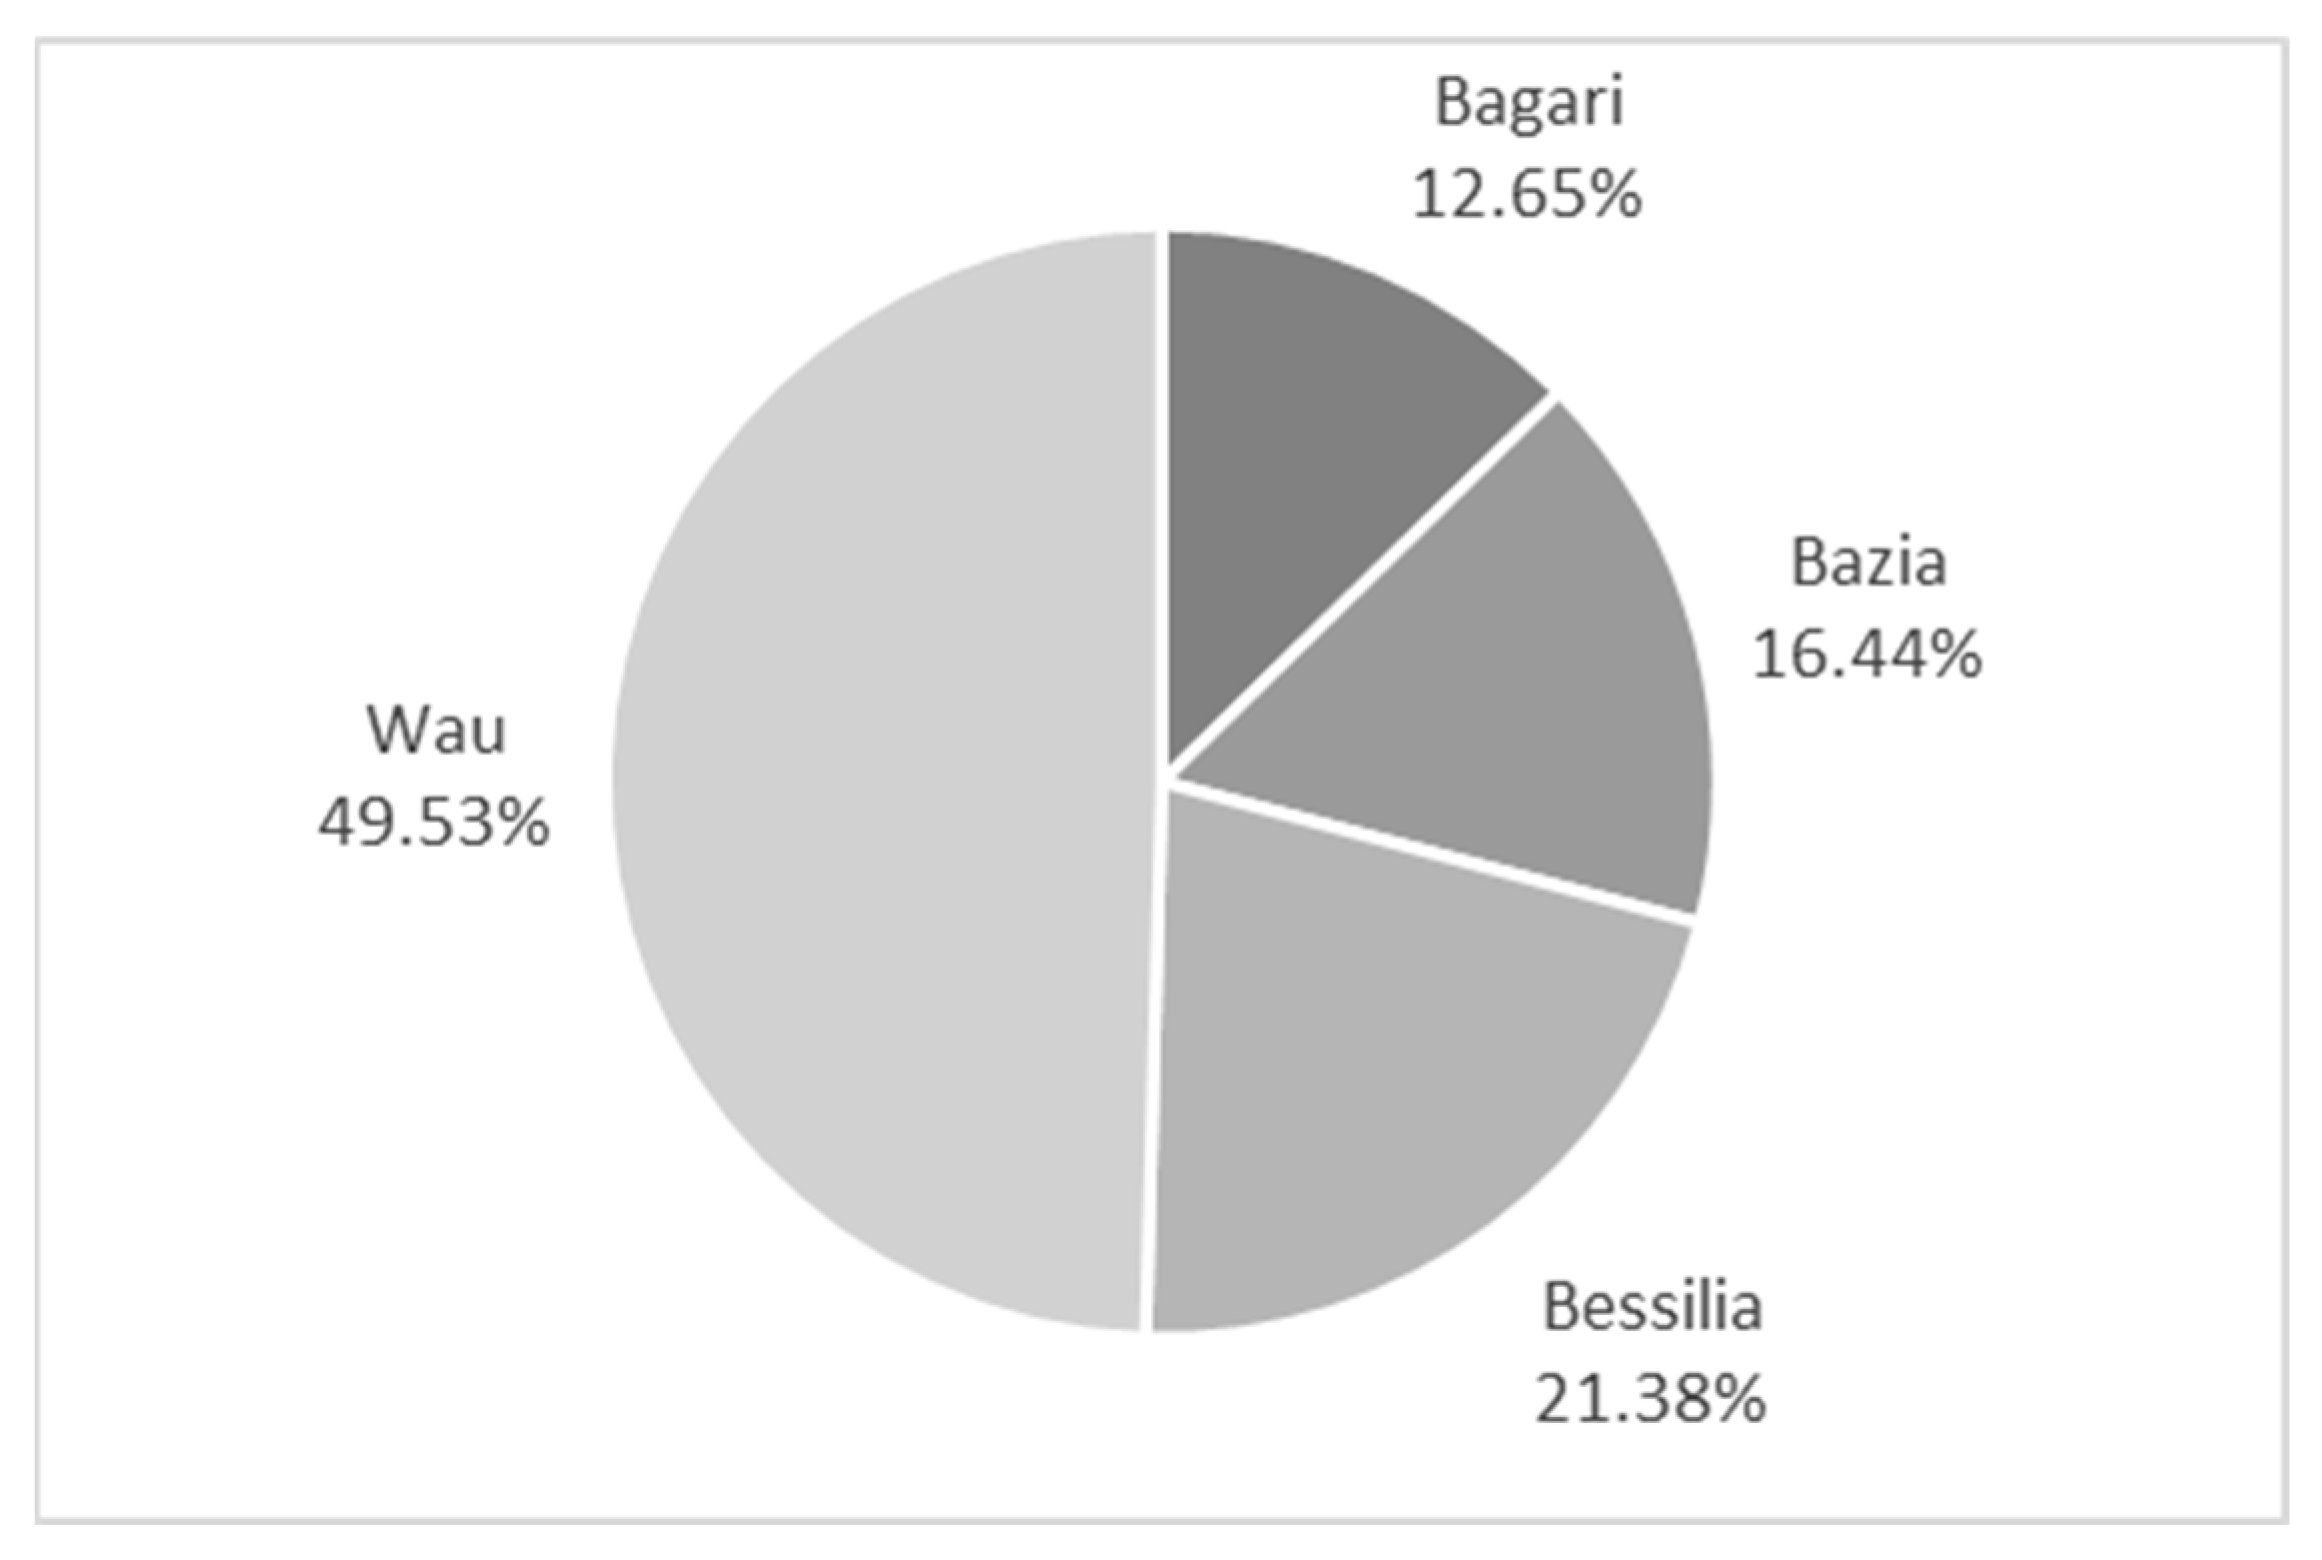
Based on this information, I constructed a statistically representative sample of 1381 randomly selected households applying Cochran’s [39] formula and adopting a confidence level of 95% and the desired margin of error of 4%. Due to a lack of data, I could not stratify my sample. I also included further correction for the statistical representation of the sample of the finite population at the county level. Figure 3 presents the selected household distribution by county.
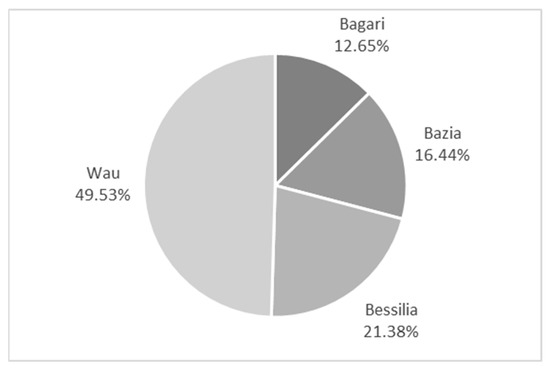
Figure 3.
Percentage distribution of the sampled households by county. Source: own elaboration on primary data.
For data collection, I designed a questionnaire organised in specific sections to capture the different aspects of household food security and livelihood system. I followed the procedure suggested by Cochran [39] to implement data gathering, and I employed 30 enumerators selected on-field and adequately trained in this activity.
I triangulated the quantitative data with qualitative information from focus group discussions to better identify and understand relevant aspects of the investigated phenomena. I organised four focus group discussions, one for each county included in the studied geographic area. Each group of at least eight members comprised a balanced number of elderly and adult men and women. I also interviewed the chiefs and paramount chiefs separately.
To quantify the frequency of consumption for each nutrient-rich food group considered, I applied the three-step approach suggested by the WFP [40] for the FCS nutrition quality analysis to the data collected with the Food Consumption Score (FCS) section of my questionnaire. In other words, I first organised the food subgroup used to compute the FCS by nutrient-rich food category (Table 1). Then, I summed up the consumption frequency of the food subgroups by each nutrient-rich food category to determine the variables of interest.

Table 1.
Nutrient-rich food categories and associated food subgroups.
The section of my questionnaire used to collect data for the FCS computation allowed me to calculate a household dietary diversity score. I computed this score as the number of food groups consumed over the recall period of 7 days, applying the FAO procedure [41]. The literature does not provide specific cut-off points to classify the household dietary diversity score according to different adequacy levels. However, the literature recommends using the mean score or ranking it into thirds or quantiles [42]. Therefore, I used the three-quantiles as a cut-off point for this score, with the lowest quantile having a less diversified diet, and I categorised the households accordingly.
The questionnaire section on household food production collected data on access to land for cultivation. I used this information to compute the factor representing land access. I constructed a dummy variable equal to 1 when the household declared to access land for food production and 0 otherwise.
The dataset collected through the questionnaire section on household characteristics allowed me to compute an indicator of the household head’s literacy, the household size in adult equivalent, and the dependency ratio.
As far as literacy is concerned, I constructed a variable of bivariate type (yes/no) to capture the household head’s capacity to read and write even only the local language, denoting literacy with 1 and otherwise with zero.
In the analysis, I included the household size expressed in the adult equivalent scale to account for the different nutritional requirements of each household member. Following Sassi [15], I adopted the OECD-modified scale suggested by Hagenaars et al. [43], assigning a value of 1 to the household head, 0.5 to each additional adult member, and 0.3 to each child, that is, a household member with age equal or less than 14 years old.
The literature on nutrition and food security typically includes the dependency ratio among the independent variables computed as the number of children (0–14 years old) and older persons (65 years or over) over the working-age population (15–64 years old). In the present analysis, I preferred using the household labour force participation rate computed as a share of workers on total household members because I found it a more accurate indicator. I noted a large discrepancy between the dependency ratio and the household labour force participation rate due to the high unemployment rate in the investigated counties. Moreover, from the focus group discussions, it emerged that most of the working-age women are not employed because, for cultural reasons, they oversee carrying out household duties.
I used the module of our questionnaire on the health status of the household members to construct the two dichotomous variables concerning the presence of children sick in the two weeks before the survey and members with chronic disease or health problems. People with chronic health problems include disabled, chronically ill (for more than 3 months), and injured during a recent conflict. Therefore, I indicated with 1 the presence of these members and 0 otherwise.
To understand the role of conflict on nutrition, I introduced as a proxy a dichotomous variable on the resident status of the household collected in a specific section of our questionnaire. Displacement, orphans, and migration are the consequences of conflict and insecurity, combined with severe food insecurity and poverty. Therefore, I distinguished between the resident (66% of our sample) and non-resident households. Almost the totality of the households in this latter category includes the internally displaced persons (31% of the households in our sample) and the remaining comprising returnees and refugees (2%). I denoted with 1 the resident households and with 0 the non-resident.
I characterised the household health environment index using four dichotomous variables based on the data collected with the section WASH of our questionnaire. They are the availability of soap at home, the access to improved water, i.e., from borehole and tap stand, the access to family or communal latrine, and the use of mosquito nets by all household members in the two weeks before the interview. These variables were selected to represent the different facets of the household water, sanitation, and hygiene situation. I denoted with 1 the access to the above items and 0 the lack of access. Following the literature, I used a tetrachoric principal component analysis to reduce our dichotomous variables explaining the household health environment to a smaller set of underlying factors. I retained only the first factor to compute our index [44]. The first principal component was the only one with an eigenvalue above 1. I used its associated loadings to compute the index, summing up all input variables weighted by the specific tetrachoric principal component loading.
The dataset generated had no missing values.
3. Results
Table 2 shows the descriptive statistics of the variables adopted in this paper.
Table 2.
Descriptive statistics.
As suggested by Rencher and Christensen [45], I tested my overall model using the Wilks’ lambda, Pillai’s trace, Lawley–Hotelling trace, and Roy’s largest root tests. According to the p-value, I found the equations regarding protein, vitamin A, and heme iron, taken together, statistically significant regardless of the test performed (Table 3). The p-value (Prob > F) of all four tests were less than 0.01. Using the most commonly recommended multivariate statistic, the Wilks’ lambda test, my model shows a multivariate R-squared of 0.4520, obtained subtracting 0.5480 from 1.
Table 3.
Test results for the overall model (Equation (6)).
The Breusch–Pagan test of 957.602 with a p-value of 0.000 indicates that the residuals of the dependent variables are not independent of each other, confirming the appropriateness of the multivariate analysis I adopted.
Table 4 shows the multivariate tests for each of the adopted grouping variables and covariates. Each of these predictors is statistically significant, with a p-value (Prob > F) less than 0.05 for each test statistic. Therefore, I reject the null hypothesis that a given predictor does not affect either of the outcomes, i.e., protein, vitamin A, and heme iron. This means that levels of each of our grouping variables lead to statistically significant differences in the linear combination of protein, vitamin A, and heme iron, adjusted for the covariates.
Table 4.
Tests of equality for the factors and covariates and partial eta-squared *.
The partial eta-squared indicates that the dietary diversity score explains the largest proportion of variance in the new dependent variable, 16.38%, followed by chronic problems and literate household head with a partial eta-squared above 2%. Among the covariates, the health environment index explains the largest proportion of variance in the artificial dependent variable with a partial eta-squared equal to 5.17%.
Moreover, Table 5 presents the results of testing the null hypothesis that the coefficients of our three covariates are jointly equal to zero. The p-value (Prob > F) equal to 0.0000, independently of the test, allows me to reject this hypothesis.
Table 5.
Test of equality for the covariates.
Table 6 shows that each of the three univariate models is statistically significant as the p-value (Prob) of the F-ratio is less than 0.01. The standard R-squared indicates that our predictor variables explain 36.34%, 16.08%, and 23.63% of the variance of protein, vitamin A, and heme iron, respectively. According to the root-mean-square error (RMSE) value, the heme iron model shows a better fit.
Table 6.
Models fit.
Table 7 presents the estimated coefficients in my models, their statistical significance, and standard error. As expected from the statistically significant effect suggested by the MANCOVA for all the factors and covariates, at least one of the ANCOVA tests indicates that the effect of each independent variable is notable on a single original dependent variable.
Table 7.
Multi-regression analysis.
Table 8 presents the F-test and its p-value used to test the equality of the coefficient of a predictor in two different equations. Coefficients are equal when the p-value is above 0.05.
Table 8.
Test of equality.
In Table 8, the test of equality shows mixed results. However, in general terms, apart from access to land and the working members in the total household members, the large majority of the independent variables have a specific effect on the outcome variables, as indicated by their p-value.
In Table 9, the partial eta-squared confirms that, among the adopted variables, the dietary diversity is the most important factor associated with an improvement not only in the overall household nutritional status, as measured by the artificial variable generated by the MANCOVA approach, but also in all three nutrients.
Table 9.
Partial eta-squared * of the factors and covariates.
In the ANCOVA models, the level of importance of the independent variables in explaining the proportion of variance, as measured by the partial eta-squared, depends on the specific dependent variable.
4. Discussion
Starting from the Bergson–Samuelson social welfare function, I developed a model to estimate the determinant factors of household nutrition security in the Western Bahr el Gazar region in South Sudan. The MANCOVA technique used in the study allowed me to construct an artificial dependent variable comprising protein, vitamin A, and heme iron, overcoming the current approach to the issue that usually considers one of the micro- or macronutrients as representative of the overall household nutritional status. Comparing the results of my MANCOVA estimates with those of the ANCOVA technique, I noted that, apart from dietary diversity, the importance of the variables in explaining the variance in the outcome variables depends on the specific dependent variable. Therefore, considering only one nutrient can lead to a misinterpretation of the investigated phenomenon with the possibility of reducing the policy prescriptions’ effectiveness. Apart from some cases, the majority of my independent variables have a specific effect on the individual micro- or macronutrient analysed.
4.1. Dietary Diversity and Access to Land
Diet diversification is very limited in Wau, Baggari, Bazia, and Bessellia. In my sample, almost 35% of the households show a dietary diversity score between 0 and 4, 37% between 5 and 6, and 28% between 7 and 12. According to my results, a slight increase in the number of food groups consumed may significantly improve household nutritional status and the frequency in consumption of micro- and macronutrients. This evidence confirms the literature on the importance of dietary diversity as a factor significantly affecting food security, and especially of children, and adds to this literature its association with the household nutritional status [46,47].
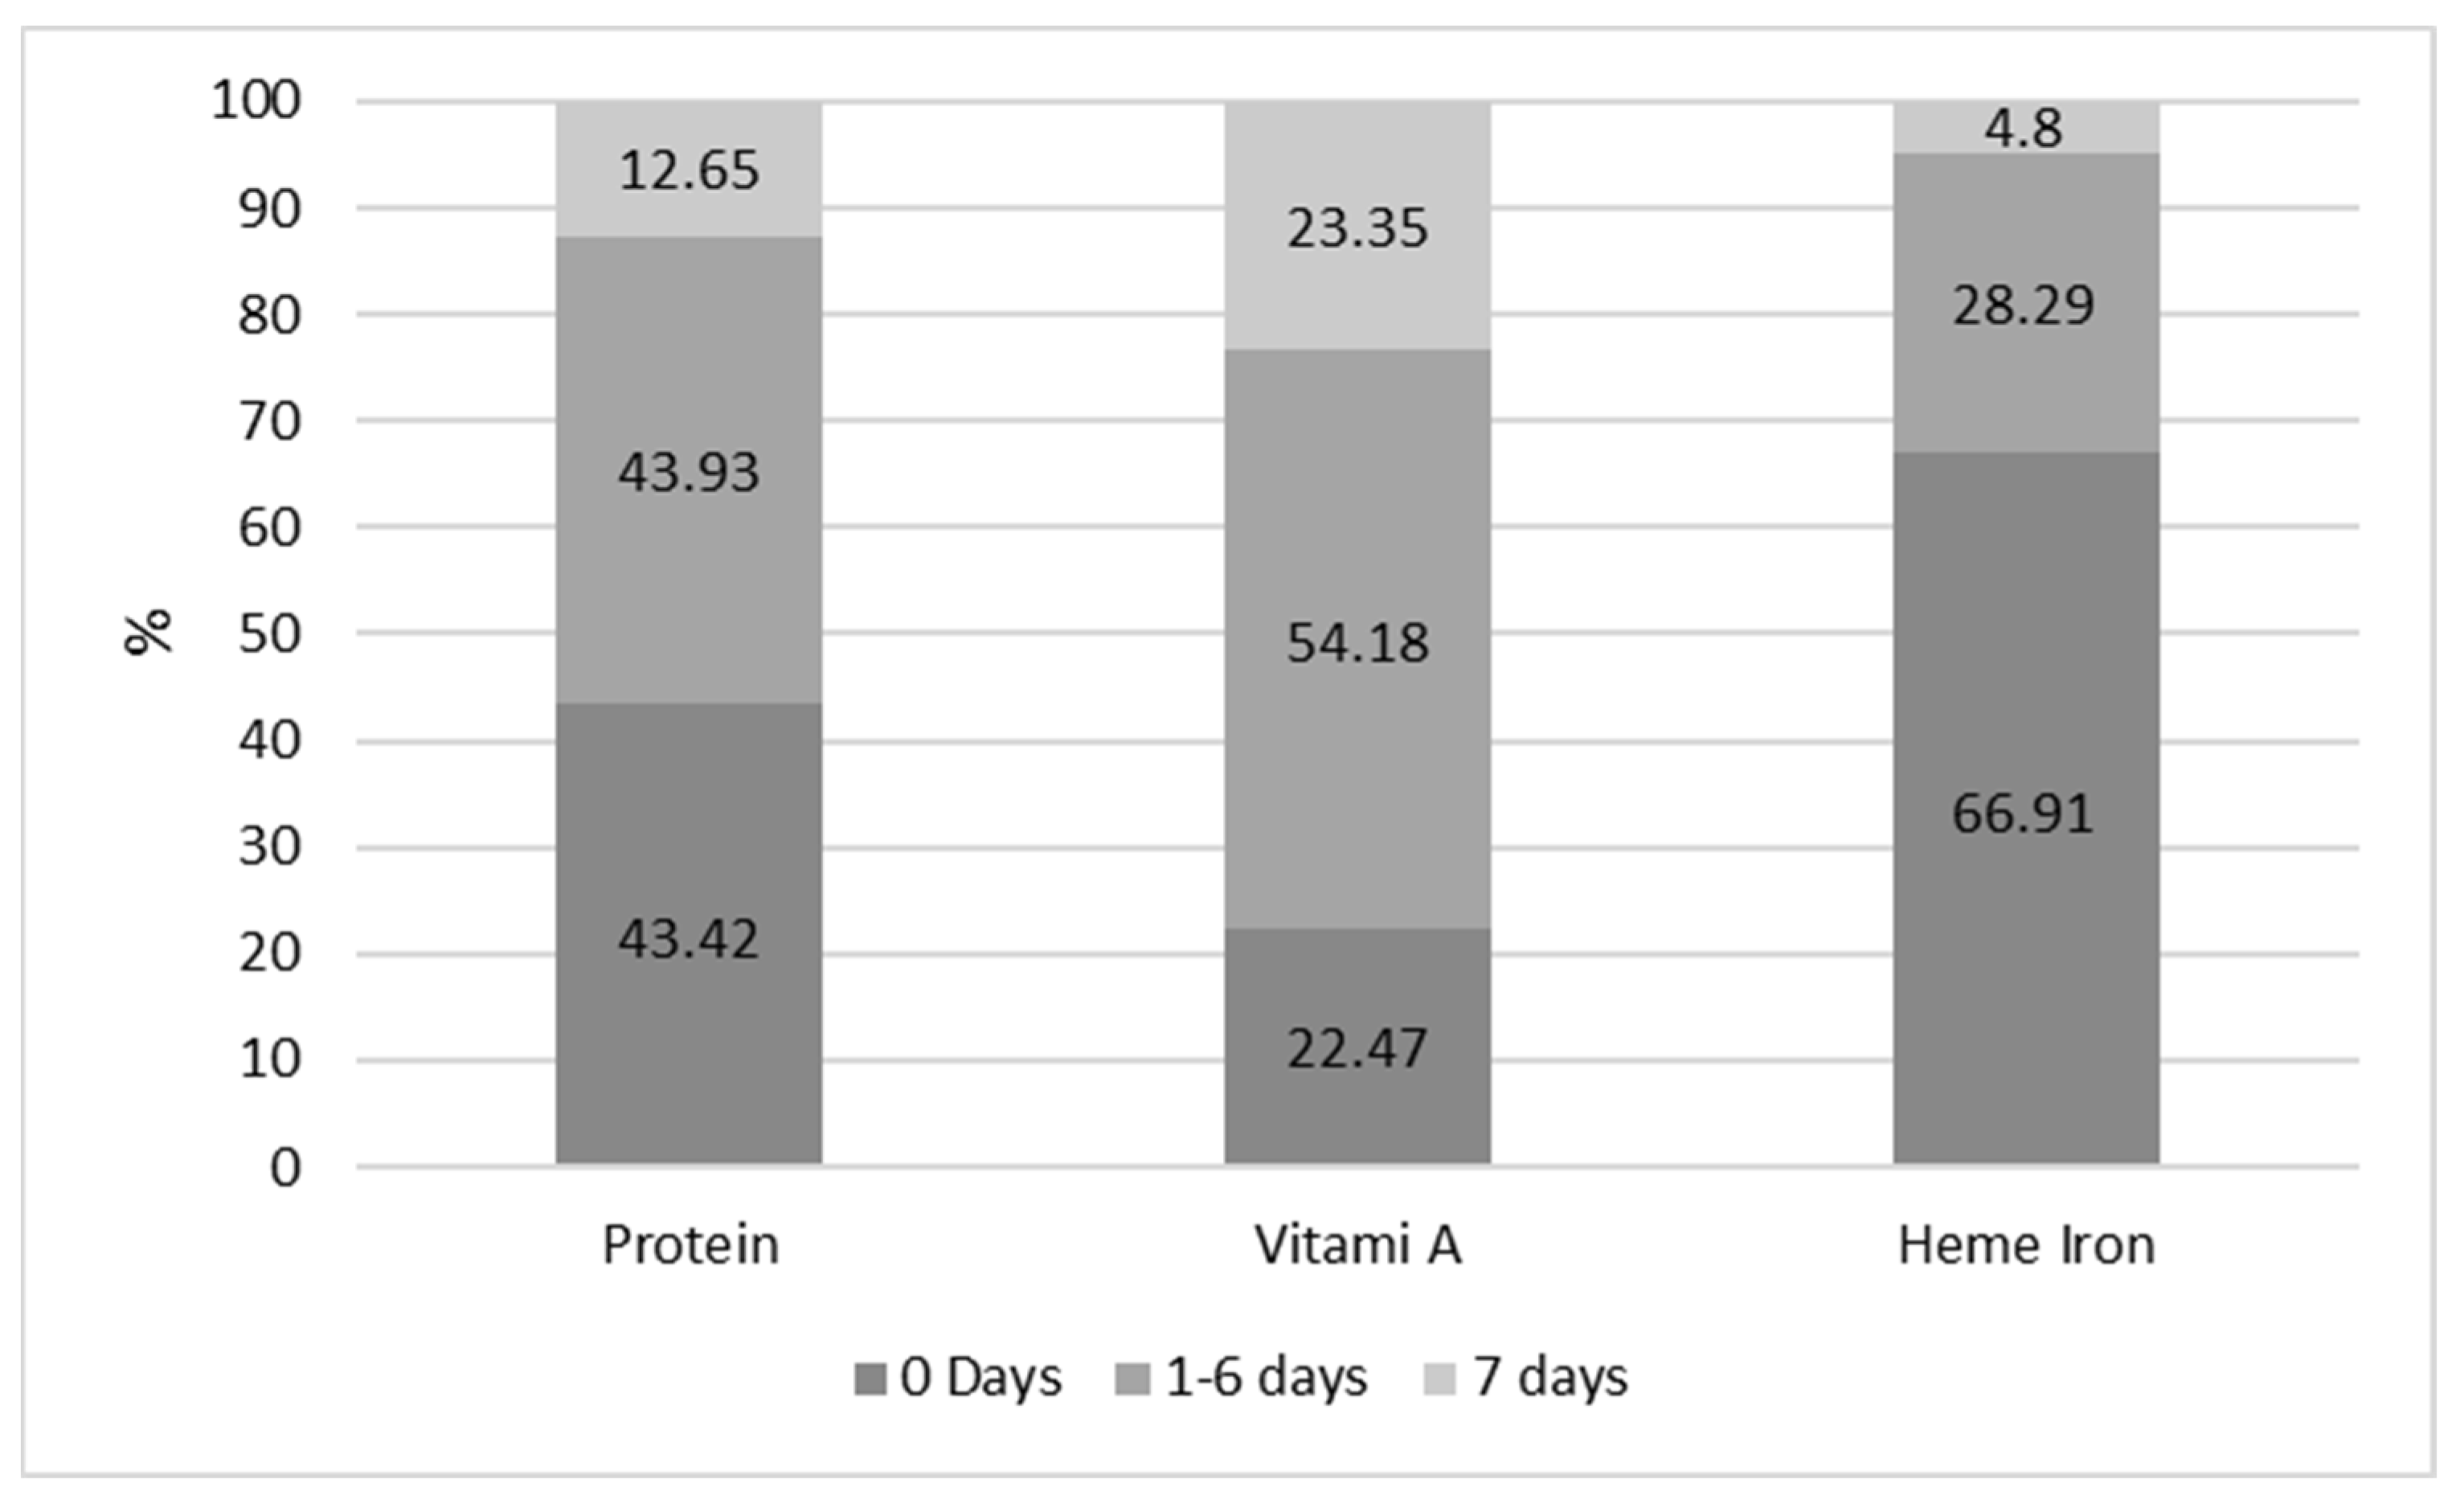
The most important categories of food items consumed on average by the households of my sample are cereals and grains, green leafy vegetables, sugar and sweets, and condiments and spices. This situation makes diet far from being nutritious for most of them, as illustrated by Figure 4. The relatively larger share of households consuming vitamin A is due to the importance of green leafy vegetables in the household diet, especially in the rural areas where meals mostly include green leafy vegetables combined with a small quantity of cereals.
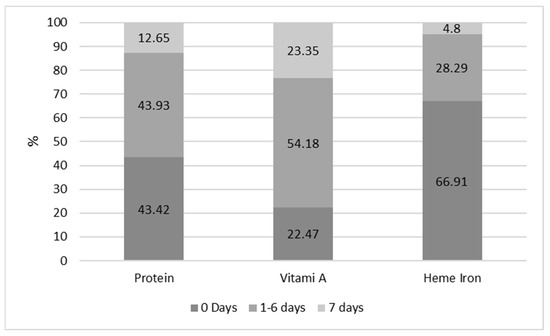
Figure 4.
Share of households by frequency of consumption of micro– and macronutrients. Source: own elaboration on primary data.
During the focus group discussions, the respondents informed that green leafy vegetables are the dominant food consumed by poor and vulnerable households. They are cultivated using small areas around their home or collected in open fields as a wild crop. Wild plants are an integral component of the everyday local diet. The literature shows that wild green leafy vegetables could benefit household food security, especially in rural areas characterised by poor resources [48,49].
It integrates a diet that is predominantly based on cereals and is poor in nutrients. However, in the area investigated, this food source is often the only one available during the hunger season for the poor and most vulnerable people; the consumption of wild green leafy vegetables is a way of filling their stomachs and reducing the sense of hunger and does not provide adequate calories and nutrients. Furthermore, the consumption of green leafy vegetables is the primary coping mechanism for destitute households, especially when negatively affected by conflict. In the investigated area, a household that does not harvest or own livestock is at risk of famine, and the diet of its members only consists of wild green leafy vegetables.
The situation described above is mainly explained by the fact that food security and nutritional status are constrained by a lack of food availability and economic and physical access to an adequate quantity and quality of food in the study area because of the protracted conflict and insecurity situation.
The largest source of food for households is self-production. Moreover, agriculture, forestry, and fisheries are the essential livelihoods for the majority of them. In this sense, access to land is a very relevant resource for household food security and wealth. My estimates suggest its positive and statistically significant relationship with the three nutrients analysed and the overall household nutritional status. However, although the investigated area is naturally endowed with agricultural potential, secure access to land is still problematic. This natural resource continues to be the primary cause of conflict, civil wars, and underdevelopment [50]. In addition, agricultural production is still highly insufficient for almost the totality of farmers with land access. Therefore, food imports and especially aid are essential sources to fulfil the food demand. In South Sudan in general and in the analysed area, the agricultural sector is at a subsistence level with a large share of farmers using a land size that, according to my evidence, is lower than one feddan, which is less than 0.42 hectares. In addition, data from my questionnaire suggests that improved agricultural inputs such as seeds and fertilisers, storage facilities, and irrigation development are lacking and the provision of extension services to support farmers is weak. Consequently, many rural households’ self-production is not enough to satisfy food consumption needs and, therefore, they depend on markets for accessing food, a market where factors such as high transportation costs, due to poor roads and conflict, and inflation make prices high and inaccessible for the poorest and vulnerable households.
The limited consumption of protein and heme iron highlighted in Figure 1 is mostly related to the low consumption of meat and fish. As was reported during the focus group discussions, households depend on the market for meat and fish consumption that, with legumes, are food items towards which they diversify their diet when their income increases. Livestock farming is dominated by culture and tradition, and as a result, livestock ownership is limited in the investigated area. According to the evidence of this study, on average, only 9% of the sample households’ own livestock, and most of them raise poultry. According to the collected data, these animals stay in the same house where people live for more than 85% of the cases. This cohabitation exposes households to pathogens from poorly managed animal faeces, occurring through inhalation, contact, or via vectors such as insects, further compromising food and nutrition security. The situation confirms the important animal disease management issues highlighted by the literature for SSA also in the investigated area [51].
4.2. Household Characteristics and Household Environment
The importance of green leafy vegetables in the diet of poor and vulnerable households also explains the opposite sign of some estimated coefficients in the equation with vitamin A as an outcome variable compared to those with protein and heme iron as dependent variables. More precisely, Table 7 shows that the frequency in consumption of vitamin A is negatively associated with the literacy of the household head (−0.335) and a healthy environment (−0.7874) and positively with chronic problems (0.7203). In contrast, I found an opposite sign of the coefficient of the same variables in the other two tested equations, those for protein and heme iron.
In the case of vitamin A, the sign of the coefficient of the variables mentioned above is justified by a proportionally larger average frequency of days that households with an illiterate head, members with chronic problems, and a deteriorated environment consume vitamin A-rich food items. More precisely, I noted a relatively proportional, more frequent consumption of green leafy vegetables by these households. The ANCOVA model for vitamin A, excluding the green leafy vegetables from the food category, confirms this result. In the last column of Table 7, the coefficient of the variables mentioned above changes its sign. The estimated coefficient becomes 0.3061 for the variable literate household head, 0.2163 for health environment, and −0.2608 for chronic problem.
The focus group discussions highlighted that this situation is mainly related to the fact that the illiteracy of the household head, the presence of chronically ill members, and a deteriorated health environment expose families to poverty and food insecurity. This situation forces them to adopt the diet of the poor; in other words, they increase the use of green leafy vegetables at the expense of protein- and iron-rich food item consumption. The literature confirms these observations. In South Sudan, households with chronically ill members show a more severe food insecurity status than the other households, and chronic diseases are among the most critical factors that drive households from poverty into deprivation [52].
On the other hand, the evidence of this paper confirms the finding of the majority of studies on the influence of education on food security in SSA: higher education is a decisive factor in food security [53]. Moreover, evidence from South Sudan shows that education can provide access to better income opportunities with a possible positive effect on health status, hygiene practices, and knowledge of feeding practices [7]. Greater availability of these factors contributes to a better nutritional status compared to households with an illiterate head.
As previously highlighted, a better livelihood implies an increase in the consumption of legumes, fish and meat, protein- and heme iron-rich food items. This consideration explains the positive association of protein and heme iron with literacy and the health environment and the negative association of chronic problems in the ANCOVA models. This tendency in consumption is also confirmed by the sign of the coefficients estimated for the index of participation to the labour market and resident status, remembering, in this latter case, that displaced households are the most destitute and the population hardest affected by conflicts. The last column of Table 7 shows the positive relationship of the variables mentioned above with the frequency of the consumption of vitamin A-rich food items that are different from green leafy vegetables. This situation implies that a better livelihood produces a substitution effect in this category, favouring the consumption of vitamin A-rich food items other than green leafy vegetables.
In Table 7, the estimated positive coefficient of children sick is statistically significant only in the equation with vitamin A as the dependent variable. This situation can be partly explained by the fact that children are more exposed to sickness in a poor household with limited access to health services and a deteriorated health environment. Moreover, during the focus group discussions, it was confirmed that poverty, hunger, and children’s sickness are strongly interrelated. For this reason, the households with sick children present a proportional, more frequent consumption of green leafy vegetables in the sample used by this study. However, health projects in South Sudan include strong efforts to improve vitamin A consumption, especially among children, through the provision of vitamin A supplements. In 2018, 76% of 6- to 59-month-olds received two high-dose vitamin A supplements in a calendar year [54]. During the focus group discussions, the participants noted that these programmes taught the population that vitamin A consumption is the proper treatment for sickness. Concerning the households with no sick children, our evidence shows that in the households with sick children, there is a proportional, more frequent use of orange fruits, perceived by households as rich in vitamin A, in addition to green leafy vegetables. These two categories of food make the frequency of vitamin A consumption higher in households with sick children than in the remaining group of households.
The literature indicates household size as a significant determinant of household food and nutrition security. It suggests that a large family size is likely to suffer food insecurity more than a small household due to the extra burden on consumption, especially of food items [54]. The results presented by this paper add to this literature, showing that the increase in the size of a household is associated with more frequent use of protein and heme iron-rich food items and a reduction in the frequency of consumption of vitamin A. This effect depends, at least in part, on the household wealth and consumption behaviour. Regarding my sample, I noted that with the increase in the household size in adult equivalent, the perception of insecurity and poverty and the introduction of livelihood coping strategies reduces. This result suggests that the increase in household size in adult equivalent may be associated with a better livelihood and, therefore, the possibility of a household to differentiate its diet towards protein and heme iron, reducing the consumption of green leafy vegetables and the assumption of vitamin A. However, excluding this food item from my estimate, the diversification process towards consuming other vitamin A-rich food items also finds confirmation in this case (Table 7, last column).
5. Conclusions
The empirical analysis developed in the present paper highlights some limitations in the study of the determinant factors of nutrition security at the household level and indicates several policy implications.
Considering the results of this paper and the centrality of nutrition for development and economic growth in the international and African agenda, appropriate data for the design of effective evidence-based policy interventions to improve household nutrition outcomes become a priority, starting from a clear understanding of the nutritional status. The use of the frequency of consumption of micro- and macronutrients provided by the FCS data can assist in conflict-affected settings similar to the study area of this paper, where difficulties in access constrain data collection due to conflict and insecurity. However, the household level data might mask even significant differences at the individual level with the consequence that policy interventions might leave behind the most vulnerable and in need people.
The results provided by this study showed that dietary diversity and the other variables I used in my model as representative of the income, household characteristics, and household environment are associated with nutritional status. I also noted a shift from the diet of the poor and vulnerable households, mainly based on green leafy vegetables, towards a more diversified and nutritious diet at the improvement of our explanatory variables. These results suggest that micro- and macronutrients deficiency in South Sudan would not be achieved only through emergency intervention providing food aid, medical treatment, and health support. Other relevant intervention areas are food availability, economic and physical access to food, employment, poverty, and income distribution. Therefore, finding solutions to the household’s poor nutritional status requires a multisectoral approach as recommended by the literature [55].
In this context, the agricultural sector plays an important role to strengthen household livelihood and resilience and, therefore, nutritional status. The policy challenge is to promote a well-integrated and balanced framework of emergency assistance, a social safety net, and agricultural development interventions to enhance food production, consumption, and markets. The experience developed in the investigated area confirms that inclusion, sustainability, and resilience of the food system are three important pillars of this agricultural strategy.
However, my model describes only the tip of the problem. All my independent variables are conflict-sensitive, a situation that implies considering, in planning, the additional complexity of conflict and weak institutions commonly shared by countries affected by a protracted crisis. Therefore, further efforts should be dedicated to accomplishing the SDGs, starting from Goal number 16 on peace, justice, and strong institutions. Conflict resolution and prevention and the enhancement of institutions are preconditions to promote an adequate household nutritional status in countries facing a protracted crisis. Therefore, the present paper suggests reinforcing the triple-nexus approach, the humanitarian–development–peace nexus, to nutrition security in South Sudan.
Funding
This study was co-funded by the Italian Agency of Development Cooperation, project “Food Security Support and Healthy Nutrition Promotion in Western Bahr el Ghazal” SASN—AID 011423.
Institutional Review Board Statement
Not applicable.
Informed Consent Statement
Not applicable.
Data Availability Statement
The data are not publicly available as consent was not requested for this purpose.
Acknowledgments
We thank the Italian NGO VIDES for the logistic support in South Sudan and comments on the study.
Conflicts of Interest
The author declares no conflict of interest. The funders had no role in the design of the study; in the collection, analyses, or interpretation of data; in the writing of the manuscript; or in the decision to publish the results.
References
- FAO. The State of Food Insecurity in the World 2020. Transforming Food Systems for Affordable Healthy Diets; FAO: Rome, Italy, 2020. [Google Scholar]
- Lim, S.S.; Vos, T.; Flaxman, A.D.; Danaei, G.; Shibuya, K.; Adair-Rohani, H.; AlMazroa, M.A.; Amann, A.; Anderson, H.S.; Andrews, K.G.; et al. A comparative risk assessment of burden of disease and injury attributable to 67 risk factors and risk factor clusters in 21 regions, 1990–2010: A systematic analysis for the Global Burden of Disease Study 2010. Lancet 2012, 380, 2224–2260. [Google Scholar] [CrossRef] [Green Version]
- World Health Organization. Global Targets 2025. To Improve Maternal, Infant and Young Child Nutrition. Available online: www.who.int/nutrition/topics/nutrition_globaltargets2025/en/ (accessed on 6 October 2014).
- African Union. Available online: https://au.int/agenda2063/goals (accessed on 26 February 2022).
- Hedden, S.; Barry, B.H.; Dale, S.R.; Alanna, J.M.; Joel, M.; Ibrahim, A.M. Ending Hunger in Africa: The Elimination of Hunger and Food Insecurity on the African Continent by 2025: Conditions for Success; Invited Research Paper for the New Partnership for African Development Planning and Coordinating Agency; University of Denver; Pardee Center for International Futures: Denver, CO, USA, 2016. [Google Scholar]
- WFP. Food and Nutrition Handbook; WFP: Rome, Italy, 2000. [Google Scholar]
- WFP. Nutrition at the World Food Programme, Programming for Nutrition-Specific Interventions; WFP: Rome, Italy, 2012. [Google Scholar]
- WFP. Consolidated Approach to Reporting Indicators of Food Security (CARI) Guidelines; WFP: Rome, Italy, 2015. [Google Scholar]
- USADI. Food Assistance Fact Sheet South Sudan. Updated 30 March. 2020. Available online: https://reliefweb.int/report/south-sudan/south-sudan-food-assistance-fact-sheet-updated-march-30-2020 (accessed on 19 April 2021).
- WFP. Available online: https://www.wfp.org/countries/south-sudan (accessed on 26 February 2022).
- OCHA. Humanitarian Needs Overview South Sudan. Humanitarian Programme Cycle. November 2020. Available online: https://reliefweb.int/sites/reliefweb.int/files/resources/South%20Sudan%20-%20Humanitarian%20needs%20overview%202020.pdf (accessed on 19 April 2021).
- World Bank. Available online: https://www.worldbank.org/en/country/southsudan/overview#1 (accessed on 25 March 2022).
- Hendriks, S.L. Food policy and nutrition economics in the SDG era. Agrekon 2018, 57, 167–180. [Google Scholar] [CrossRef] [Green Version]
- USAID. Situation Overview: Greater Bahr el Ghazal Region, South Sudan. January–March. 2020. Available online: https://reliefweb.int/report/south-sudan/situation-overview-greater-bahr-el-ghazal-region-south-sudan-january-march-2020 (accessed on 19 April 2021).
- Sassi, M. A SEM Approach to the Direct and Indirect Links between WaSH Services and Access to Food in Countries in Protracted Crises: The Case of Western Bahr-el-Ghazal State, South Sudan. Sustainability 2020, 12, 9631. [Google Scholar] [CrossRef]
- Axinn, W.G.; Ghimire, D.; Williams, N.E. Collecting Survey Data during Armed Conflict. J. Off. Stat. 2012, 28, 153–171. [Google Scholar] [PubMed]
- Frison, S.; Kerac, M.; Checchi, F.; Prudhon, C. Anthropometric indices and measures to assess change in the nutritional status of a population: A systematic literature review. BMC Nutr. 2016, 2, 76. [Google Scholar] [CrossRef] [Green Version]
- Sassi, M.; Thakare, H. Conflict and Child Malnutrition: A Systematic Review of the Emerging Quantitative Literature. Curr. Nutr. Rep. 2022, 11, 1–8. [Google Scholar] [CrossRef] [PubMed]
- Gassara, G.; Chen, J. Household Food Insecurity, Dietary Diversity, and Stunting in Sub-Saharan Africa: A Systematic Review. Nutrients 2021, 13, 4401. [Google Scholar] [CrossRef]
- Bergson, A. A reformulation of certain aspects of welfare economics. Q. J. Econ. 1938, 52, 310–334. [Google Scholar] [CrossRef]
- Samuelson, P.A. Foundations of Economic Analysis; Enlarged Edition; Harvard University Press: Cambridge, MA, USA, 1983; p. 1947. [Google Scholar]
- Ecker, O.; Weinberger, K.; Qaim, M. Patterns and determinants of dietary micronutrient deficiencies in rural areas of East Africa. Afr. J. Agric. Resour. Econ. 2010, 4, 175–194. [Google Scholar]
- Ekholuenetale, M.; Tudeme, G.; Onikan, A.; Ekholuenetale, C.E. Socioeconomic inequalities in hidden hunger, undernutrition, and overweight among under-five children in 35 sub-Saharan Africa countries. J. Egypt. Public Health Assoc. 2020, 95, 1–15. [Google Scholar] [CrossRef] [Green Version]
- Ijarotimi, O.S. Determinants of Childhood Malnutrition and Consequences in Developing Countries. Curr. Nutr. Rep. 2013, 2, 129–133. [Google Scholar] [CrossRef] [Green Version]
- FAO. Study on the Impact of Armed Conflicts on the Nutritional Situation of Children; FAO: Rome, Italy, 1996. [Google Scholar]
- Guerrero-Serdán, G. The Effects of the War in Iraq on Nutrition and Health: An Analysis Using Anthropometric Outcomes of Children; HiCN Working Paper 55; The Institute of Development Studies, University of Sussex: Brighton, UK, 2009. [Google Scholar]
- Hatloy, A.; Halland, J.; Diarra, M.; Oshaug, A. Food variety, socioeconomic status and nutritional status in urban and rural areas in Koutiala (Mali). Public Health Nutr. 2000, 3, 57–65. [Google Scholar] [CrossRef] [PubMed] [Green Version]
- Ogundari, K. Categorizing households into different food security states in Nigeria: The socioeconomic and demographic determinants. Agric. Food Econ. 2017, 5, 8. [Google Scholar] [CrossRef]
- Sing, I.; Squire, L.; Strauss, J. A survey of agricultural household models: Recent findings and policy implications. World Bank Econ. Rev. 1986, 1, 149–179. [Google Scholar] [CrossRef]
- Smith, L.C. Understanding the Causes of Food Insecurity in Sub-Saharan Africa: Do the Determinants of Diet Quantity and Quality Differ? International Food Policy Research Institute: Washington, DC, USA, 2004. [Google Scholar]
- Amjad, M.; Akbar, M. Role of Socioeconomic Factors to overcome Micronutrient Malnutrition in Pakistan: Application of Partial Proportional Odds Model. Prog. Nutr. 2020, 22, 1–16. [Google Scholar] [CrossRef]
- Mertler, V. Advanced and Multivariate Statistical Methods: Practical Application and Interpretation, 3rd ed.; Taylor & Francis: New York, NY, USA, 2005. [Google Scholar]
- von Grebmer, K.; Saltzman, A.; Birol, E.; Wiesman, D.; Prasai, N.; Yin, S.; Yohannes, Y.; Menon, P.; Thompson, J.; Sonntag, A. 2014 Global Hunger Index: The Challenge of Hidden Hunger; Welthungerhilfe, International Food Policy Research Institute, and Concern Worldwide: Washington, DC, USA, 2014. [Google Scholar]
- UNICEF. UNICEF South Sudan Humanitarian Situation Report–31 October 2017. UNICEF South Sudan SITREP #111. 2017. Available online: https://reliefweb.int/sites/reliefweb.int/files/resources/UNICEF%20South%20Sudan%20Humanitarian%20SitRep%20%23114%20-%2031%20October%202017%20.pdf (accessed on 19 April 2021).
- LANDac. Food Security and Land Governance Factsheet-South Sudan. 2019. Available online: https://www.landgovernance.org/wp-content/uploads/2019/09/20160627-Factsheet-SouthSudan.pdf (accessed on 19 April 2021).
- Anderson, K. How can Trade Improve Food Security in Sub-Saharan Africa? In Frontiers in Food Policy: Perspectives on Sub-Saharan Africa; Falcon, W.P., Naylor, R.L., Eds.; Center on Food Security and Environment, Stanford University: Stanford, CA, USA, 2014; pp. 377–406. [Google Scholar]
- Gödecke, T.; Stein, A.J.; Qaim, M. The global burden of chronic and hidden hunger: Trends and determinants. Glob. Food Secur. 2018, 17, 21–29. [Google Scholar] [CrossRef]
- O’Driscoll, D. Drivers of Malnutrition in South Sudan. K4D Helpdesk Report; Institute of Development Studies: Brighton, UK, 2018. [Google Scholar]
- Cochran, W.G. Sampling Techniques, 3rd ed.; Wiley: New York, NY, USA, 1997. [Google Scholar]
- WFP. Food Consumption Score Nutrition Quality Analysis; WFP: Rome, Italy, 2015. [Google Scholar]
- Kennedy, G.; Ballard, T.; Dop, M.C. Guidelines for Measuring Household and Individual Dietary Diversity; FAO: Rome, Italy, 2013. [Google Scholar]
- Sassi, M. Understanding Food Insecurity-Key Features, Indicators, and Response Design; Springer International Publishing AG: Cham, Switzerland, 2018. [Google Scholar]
- Hagenaars, A.; de Vos, K.; Zaidi, M.A. Poverty Statistics in the Late 1980s: Research Based on Micro-Data; Office for Official Publications of the European Communities: Luxembourg, 1994. [Google Scholar]
- Kolenikov, S.; Angeles, G. The Use of Discrete Data in PCA: Theory, Simulations, and Applications to Socioeconomic Indices; CPC/MEASURE Working Paper WP-04-85; Carolina Population Center: Chapel Hill, NC, USA, 2004. [Google Scholar]
- Rencher, A.C.; Christensen, W.F. Methods of Multivariate Analysis, 3rd ed.; Wiley: Hoboken, NY, USA, 2012. [Google Scholar]
- Ekesa, B.N.; Blomme, G.; Garming, H. Dietary Diversity and Nutritional Status of Pre-School Children from Musa-Dependent Households in Gitega (Burundi) and Butembo (DR Congo). Afr. J. Food Agric. Nutr. Dev. 2011, 11, 4896–4911. [Google Scholar] [CrossRef] [Green Version]
- Belayneh, M.; Loha, E.; Lindtjørn, B. Seasonal Variation of Household Food Insecurity and Household Dietary Diversity on Wasting and Stunting among Young Children in A Drought Prone Area in South Ethiopia: A Cohort Study. Ecol. Food Nutr. 2021, 60, 44–69. [Google Scholar] [CrossRef]
- Flyman, M.V.; Afolayan, A.J. The suitability of wild vegetables for alleviating human dietary deficiencies. S. Afr. J. Bot. 2006, 72, 492–497. [Google Scholar] [CrossRef] [Green Version]
- Odhav, B.; Beekrum, S.; Akula, U.; Baijnath, H. Preliminary assessment of the nutritional value of traditional leafy vegetables in KwaZulu-Natal, South Africa. J. Food Comp. Anal. 2007, 20, 430–435. [Google Scholar] [CrossRef]
- Thomson, G.R. Currently important animal disease management issues in sub-Saharan Africa. Onderstepoort J. Vet. Res. 2009, 76, 129–134. [Google Scholar] [CrossRef] [PubMed] [Green Version]
- WFP. South Sudan Food Security Monitoring (FSMS) Report. March 2014. Available online: https://documents.wfp.org/stellent/groups/public/documents/ena/wfp275224.pdf?iframe= (accessed on 19 April 2021).
- Mutisya, M.; Ngware, M.W.; Kabiru, C.W.; Kandala, N. The effect of education on household food security in two informal urban settlements in Kenya: A longitudinal analysis. Food Secur. 2016, 8, 743–756. [Google Scholar] [CrossRef] [Green Version]
- UNICEF. Available online: https://data.unicef.org/topic/nutrition/vitamin-a-deficiency/ (accessed on 26 February 2022).
- Drammeh, W.; Hamid, N.A.; Rohana, A.J. Determinants of Household Food Insecurity and Its Association with Child Malnutrition in Sub-Saharan Africa: A Review of the Literature. Curr. Res. Nutr. Food Sci. 2019, 7, 610–623. [Google Scholar] [CrossRef] [Green Version]
- World Bank. Improving Nutrition through Multi-Secotral Approaches; World Bank: Washington, DC, USA, 2013; Available online: https://openknowledge.worldbank.org/bitstream/handle/10986/16450/75102revd.pdf?sequence=5&isAllowed=y (accessed on 19 April 2021).

Publisher’s Note: MDPI stays neutral with regard to jurisdictional claims in published maps and institutional affiliations. |
© 2022 by the author. Licensee MDPI, Basel, Switzerland. This article is an open access article distributed under the terms and conditions of the Creative Commons Attribution (CC BY) license (https://creativecommons.org/licenses/by/4.0/).