Abstract
Across the European Union, small and medium enterprises (SMEs) are major contributors to the increase of the regional gross domestic product. The present study investigates the relationship between economic growth, imports and exports regarding the activity of small and medium enterprises within the European Union (EU-28). A panel generalized method of moments (GMM) analysis and a panel two-stage least squares (2SLS) analysis were carried out for the period 2005–2020. Empirical results indicated that online imports and exports together with extra-EU imports and exports had a significant impact on economic growth, proxied by value added, venture capital investments and turnover from e-commerce. In the light of these results, regional and national authorities are called to support business endeavors of small and medium enterprises due to their relevance on the market and contribution to the financing of national budgets.
1. Introduction
Within nowadays global market, the level of economic growth has constantly been an important matter on the agenda of national authorities, regional unions and international bodies [1,2,3,4]. A sensible reason for this fact is that studies show a strong bidirectional relationship between economic growth and human development [5,6,7]. On the one hand, economic growth enhances human development levels because it offers citizens more resources to support their needs, improve living conditions and overall wellbeing. At the same time, government authorities can amass more financial resources through taxation in order to improve the quality of public goods and services. On the other hand, societies that increase their level of human development (e.g., life expectancy and health status, access to education, living standards) equip citizens with a wide range of capabilities that can thrive via economic activities. In addition, the question of economic growth is intensively discussed within the context of sustainable development and the need for a judicious use of global resources of future generations [8,9,10].
The former US governor for the state of Tennessee, Phil Bredesen, used to state the following about economic growth: “Continuing economic growth requires both recruitment of new companies and expansion of existing businesses”. Indeed, national and regional economies around the world thrive based on the creation and development of various types of businesses that interact with one another, among which small and medium enterprises (SMEs) play a significant role [11,12,13,14,15].
The World Bank provides relevant insights on the importance of SMEs for the world economy. Hence, SMEs are credited for representing around 90% of global businesses and for employing around 50% of the global workforce. In emerging countries, these businesses generate 40% of the gross domestic product (GDP) [16].
Across the European Union, small and medium-sized enterprises (SMEs) account for 99% of all business activities, they are considered “the backbone” of the regional economy since they generate 58% of the GDP and employ 67% of the workforce in the private sector [17]. Among the most notable characteristics of the European SMEs are the following: focus on innovation; quick adaptability to market demands; strong impact in all economic sectors; young and qualified employees. In terms of financial upper hands, European SMEs benefit from “above-average equity capital and a wide spread of investment risks” [17].
With respect to business initiative, drive and innovation, member states in the European Union host eight of the first 30 start-up ecosystems worldwide. For that matter, countries such as Cyprus, Estonia, Lithuania, Latvia and Malta have registered the highest start-up intensity levels across all EU members.
Table 1 [18] (p. 11) offers details on the criteria that are used by the European Commission to categorize small and medium enterprises: (a) headcount annual work unit (i.e., number of employees); (b) annual turnover or annual balance sheet total (i.e., overall value of the items listed in this financial statement). These criteria were enacted via the EU recommendation 2003/361 and they are applied in the case of individual firms.

Table 1.
Criteria for categorizing SMEs across the European Union.
According to the European Commission, the abovementioned criteria are fundamental because companies labeled as small and medium enterprises often enjoy various benefits, among which: financial support from the EU budget via multiple programs targeting only SMEs (i.e., competitiveness, innovation, research); less red tape or lower administrative compliance fees [18]. At the same time, besides the aforementioned benefits, the development of SMEs in general and European SMEs in particular may be hindered by various constraints regarding resources or information available. Nevertheless, such constraints can be overcome by fostering trade relationships (including exports) and “inter-firm collaborations” [19]. For that matter, due to extensive internet facilities, businesses such as SMEs have increased their presence on international markets via exporting activities [20].
In this context of the SMEs’ substantial impact on the economy of the European Union, the present study investigates the relationship between economic growth (proxied by value added rate, venture capital investments rate, turnover from e-commerce rate) and various indicators related to import and export activities of SMEs across the 28 member states of the European Union during almost two decades (i.e., 2005–2020). The focus on import and export activities stems from the fact that, as constantly reported in the mainstream literature even from early on until nowadays, rising exports stimulate aggregate economic growth [21,22,23,24,25].
The set of independent variables included the following: intra-EU exports and imports of goods; intra-EU online importers; extra-EU online exporters; extra-EU exports and imports of goods. Variables were retrieved from Comext, Eurostat, Structural Business Statistics and World Bank databases.
The remainder of the paper is the following. Section 2 gives a brief account on the determinants of economic growth, exports and imports. Section 3 presents the sample and period of analysis, variables of interest, general format of the econometric model, methodology and research hypotheses. Section 4 delves into all types of analyses, from descriptive statistics and correlations to panel data modelling. The last section summarizes and discusses the main results, emphasizes policy implications of research outcomes and sketches future research directions.
2. Literature Review
An increasing body of literature focuses on the role of small and medium enterprises in the process of economic growth [26,27,28,29,30]. In this sense, Wozniak et al. [31] assess the connection between the GDP structure and the development level of Polish small and medium enterprises in the period 1996–2016. Focused on the same national economy dominated by the economic activities of SMEs, Czarniewski [32] stresses the fact that these economic entities play a fundamental role in the advancement of innovation and entrepreneurship within a country.
By means of a survey study conducted on observations from 54 French SMEs and 30 British SMEs, Ben Abdelaziz, Alaya and Dey [33] target the matter of sustainability regarding their economic activities. The authors advance insights on how operations run by SMEs can become more sustainable via the implementation of sustainable inputs and outputs.
Kazmi and Naaranoja [34] investigate the impact of an educational program designed for new entrepreneurs in Finland, which aimed to ease business transfer process, to fuel business growth and to ensure business survival on the market. Survey data confirmed the effectiveness of such training programs, especially in the case of SMEs dealing with scarce resources.
Vishnupriya and Abirami [35] focus on SMEs since these types of businesses represent the backbone of the Indian economy and mainly generate increases in the national GDP. More specifically, authors scrutinize the factors that hinder SMEs growth in India and propose sensible solutions to overcome such challenges.
In the same line of thought, Gao [36] studies SMEs within the context of the Chinese market because SMEs represent about 99% of the total number of businesses operating in China. The author notes that, besides their fundamental contribution to the country GDP, SMEs stand out as the most innovative business endeavors on the national market. The research study provides insights on efficient ways of dealing with financial difficulties that SMEs encounter.
Nizaeva and Coskun [37] examine the factors that influence the access to financing of SMEs across emerging economies in the Western Balkan region. Namely, authors take into account the following independent variables: concentration of banking sector; credit information; firm size; firm age; GDP per capita; ownership type; property registration costs; transparency of accounting data. According to empirical results, firm size, firm age and the concentration of the banking sector register significant influences on SMEs capacity of obtaining financial resources.
By means of a panel data analysis, Jenkins and Hossein [38] investigate the impact of macroeconomic variables such as GDP growth rate, competition, inflation rate and government domestic borrowing on SMEs access to commercial bank lending. The sample included data from emerging economies such as Argentina, Brazil, Chile, Mexico, Poland and Turkey. Empirical results show that high levels of GDP grow rate, intense competition, lower levels of inflation rate and less public borrowings can stimulate credit institutions to grant financial resources to SMEs.
The present study fills the literature gap concerning the contribution of SMEs activities across EU member states to the level of economic growth proxied by variables such as value added rate, venture capital investments rate, turnover from e-commerce rate.
3. Materials and Method
The following paragraphs will detail on the sample, variables of interest, methodology, general form of the econometric model and research hypotheses used in the present study.
The chosen period of analysis spanned 16 years, namely from 2005–2020. The sample included small and medium enterprises (SMEs)-related data from the 28 countries that belonged to the European Union (EU-28) during this period: Austria, Belgium, Bulgaria, Croatia, Cyprus, Czech Republic, Denmark, Finland, France, Germany, Greece, Estonia, Hungary, Ireland, Italy, Latvia, Lithuania, Luxembourg, Malta, Netherlands, Poland, Portugal, Romania, Slovakia, Slovenia, Spain, Sweden, United Kingdom.
From a methodological standpoint, the study favored multiple methods of analysis, starting from the standard descriptive statistics and correlation analysis up to an econometric approach via panel data modelling (i.e., generalized methods of moments; two-stage least squares with cross-section weights). The EViews statistical software version 10.0 was the workhorse during the analysis process.
Analyses were conducted with the variables of interest below:
- Value added rate (VAD_RATE) measures the variation of the value added of goods and services produced in a national economy. This variable was used as a proxy for the level of economic growth, it is measured in percentage points and it was retrieved from the World Bank database.
- Venture capital investments rate (VENTURE) as a percentage of GDP represents a part of private equity that needs to be invested in companies not publicly listed, which develop new products and technologies. This type of investment is used to support early-stage business endeavors (i.e., seed, start-up) or expansions (i.e., “later stage venture”). The variable was retrieved from the Eurostat database and it was used as a proxy for the level of economic growth.
- Turnover from e-commerce rate (TURNOVER) includes the overall turnover from all manufacturing and service sectors, excluding the financial sector. The variable was retrieved from the Eurostat database, namely the Community survey on ICT usage and eCommerce in enterprises. It was used as a proxy for the level of economic growth.
- Intra-EU exports of goods by SMEs in industry (EUEXP) measures the percentage of SMEs that exported goods within the EU member states. The variable was retrieved from the Eurostat database.
- Intra-EU imports of goods by SMEs in industry (EUIMP) measures the percentage of SMEs that imported goods from the EU member states. The variable was retrieved from the Eurostat database.
- Intra-EU online importers (EUIMPOL) measures the percentage of SMEs that imported goods online from the EU member states. This variable took into consideration only SMEs with 10 or more employees, which made online acquisitions from suppliers operating in other EU countries. Micro-companies were not considered. The variable was retrieved from the Eurostat database.
- Extra-EU online exporters (EUEXTRAOL) measures the percentage of SMEs that exported goods online in other EU member states. This variable took into consideration only SMEs with 10 or more employees, which made online acquisitions from suppliers operating in other EU countries. Micro-companies were not considered. The variable was retrieved from the Eurostat database.
- Extra-EU exports of goods by SMEs in industry (EXTRAEXP) indicates the percentage of SMEs that exported goods outside the European Union. This time, micro-companies were included. In order to compute the variable, the number of exporting SMEs (in the nominator) was retrieved from the Comext database, while the total number of SMEs (in the denominator) was retrieved from the Structural Business Statistics database.
- Extra-EU imports of goods by SMEs in industry (EXTRAIMP) measures the percentage of SMEs that imported goods from countries outside the European Union. As before, micro-companies were included. In order to compute the variable, the number of exporting SMEs (in the nominator) was retrieved from the Comext database, while the total number of SMEs (in the denominator) was retrieved from the Structural Business Statistics database.
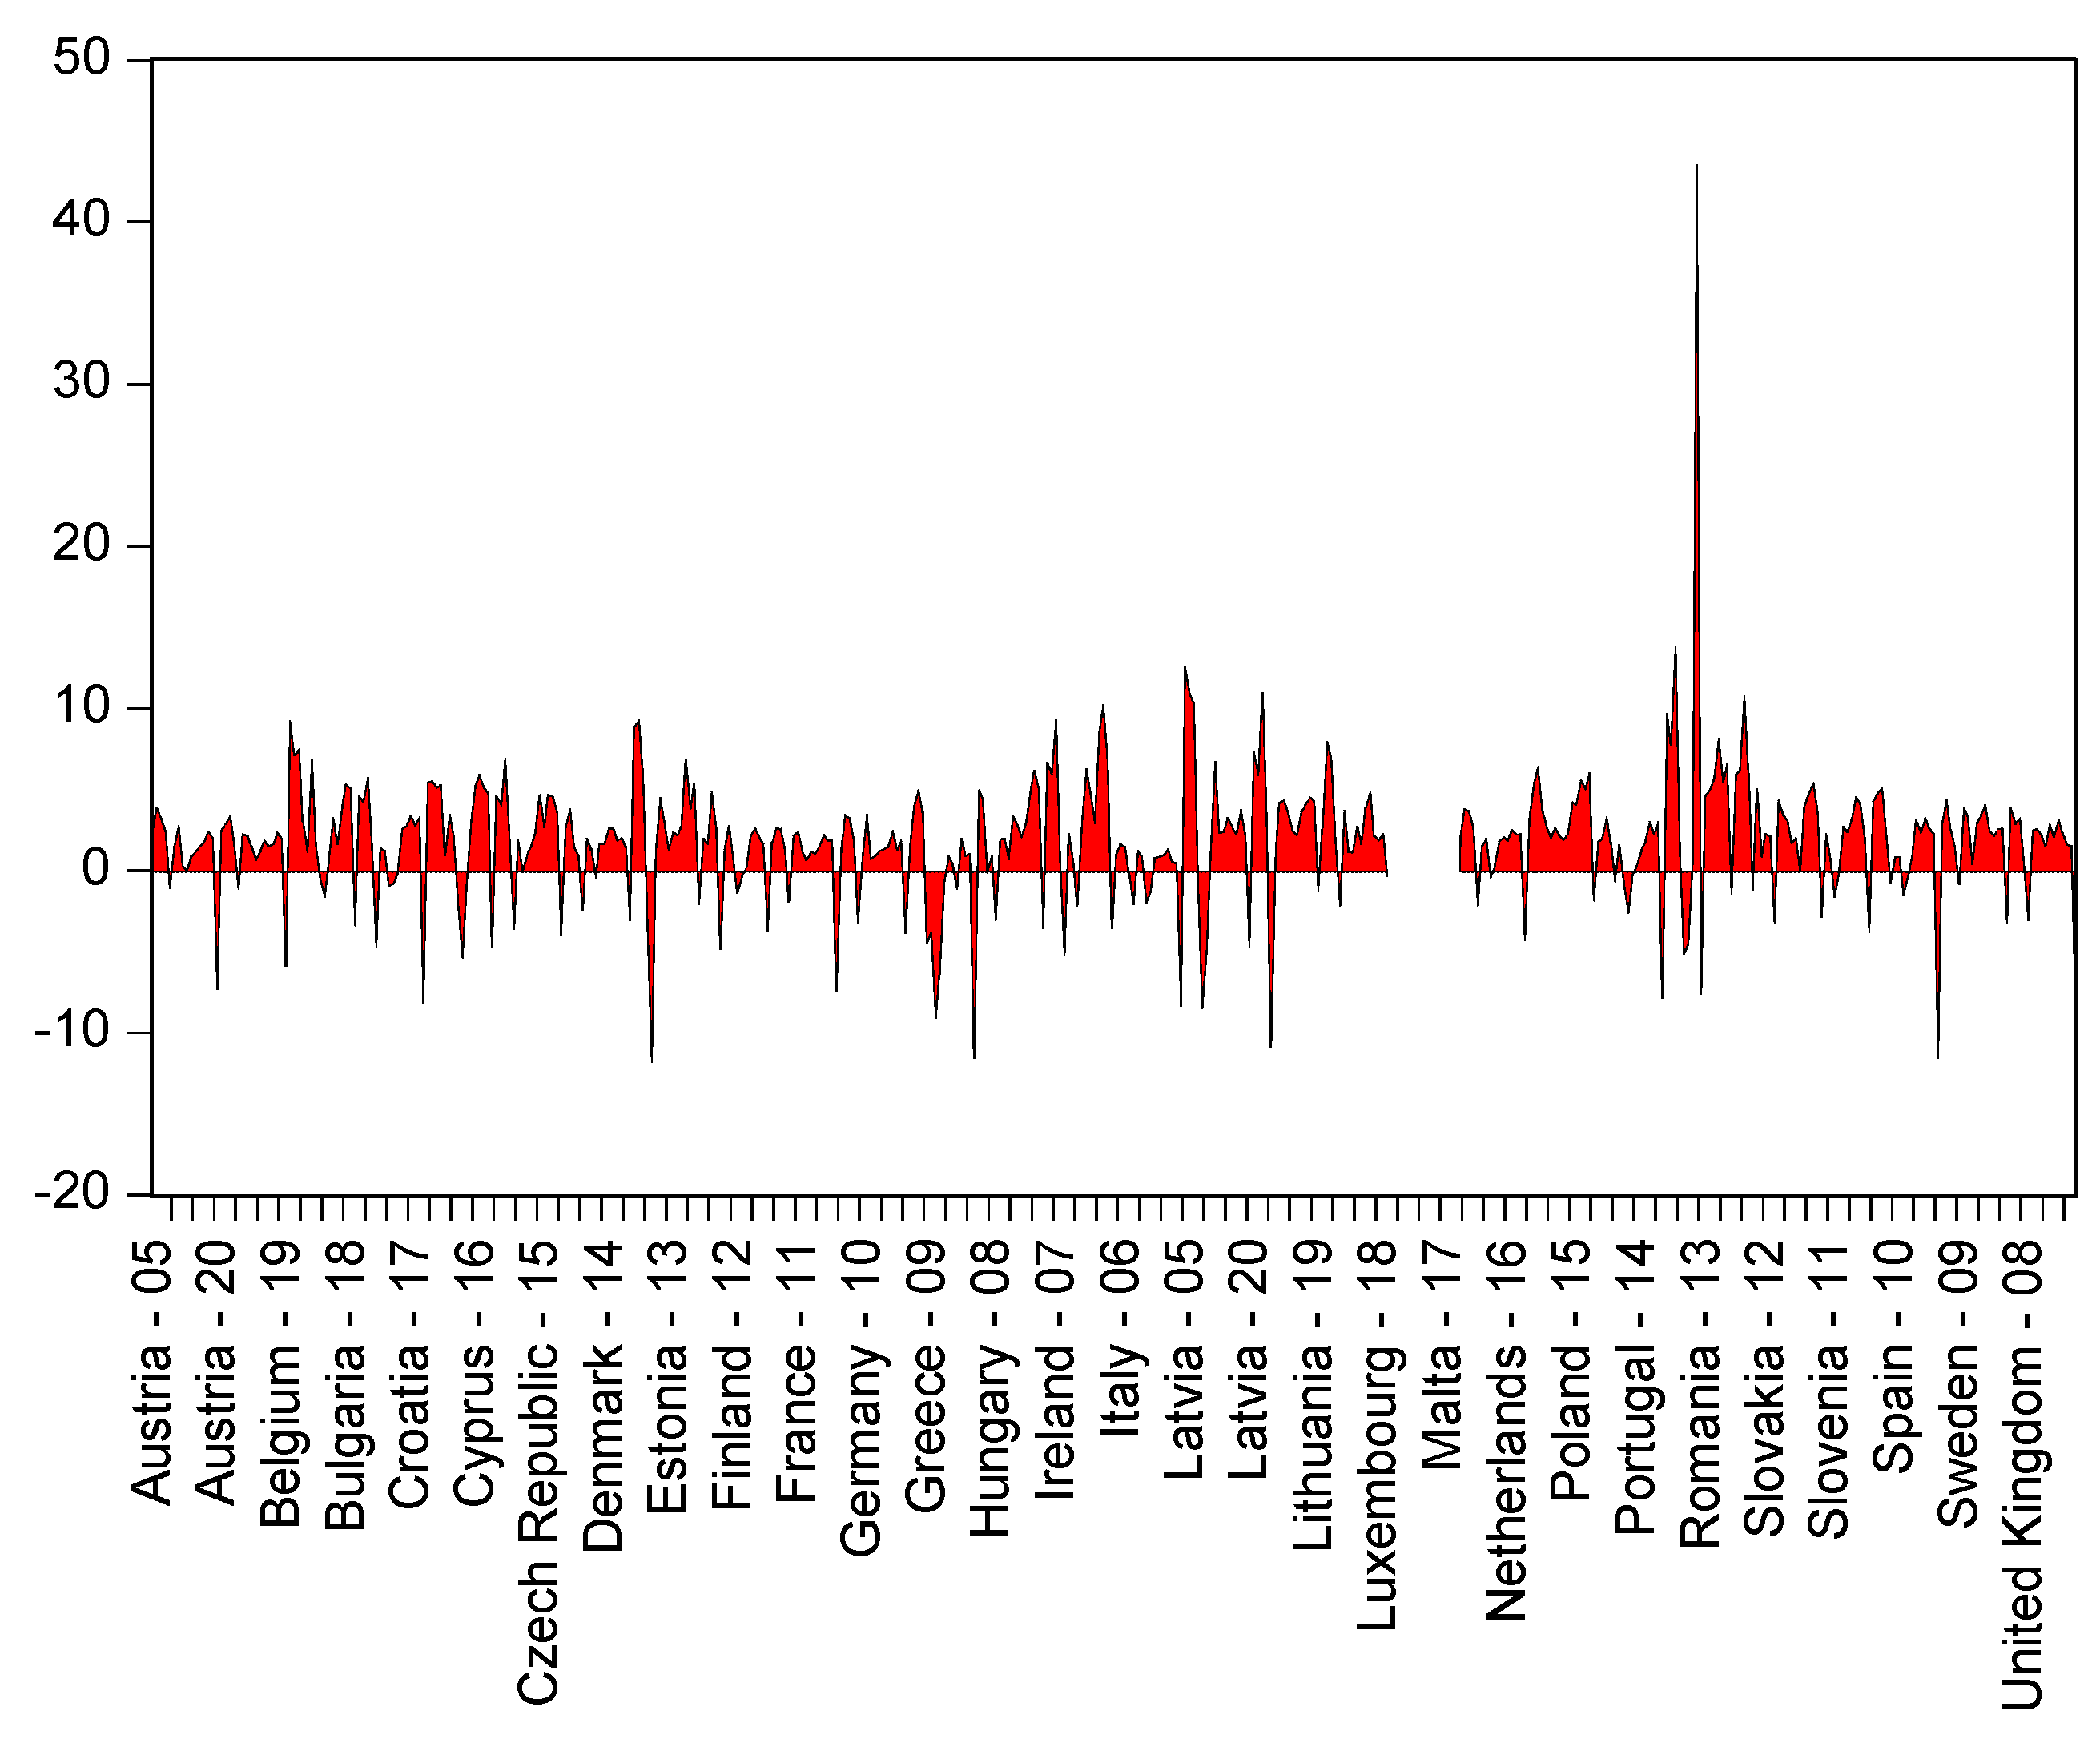
Figure 1 shows considerable decreases in the value added rate variable for Austria (2020), Belgium (2019), Bulgaria (2018), Cyprus (2016), Denmark (2015), Greece (2009), Hungary (2008), Ireland (2017), Latvia (2008, 2020), Portugal (2014) and Romania (2013), after the 2008 global financial crisis and the European sovereign debt crisis. During the first year of the pandemic crisis, all EU member states have registered mitigations in this indicator, except for Slovakia, which reported a VAD_RATE of 9.53%.

Figure 1.
The evolution of VAD_RATE across EU-28 in the period 2005–2020.
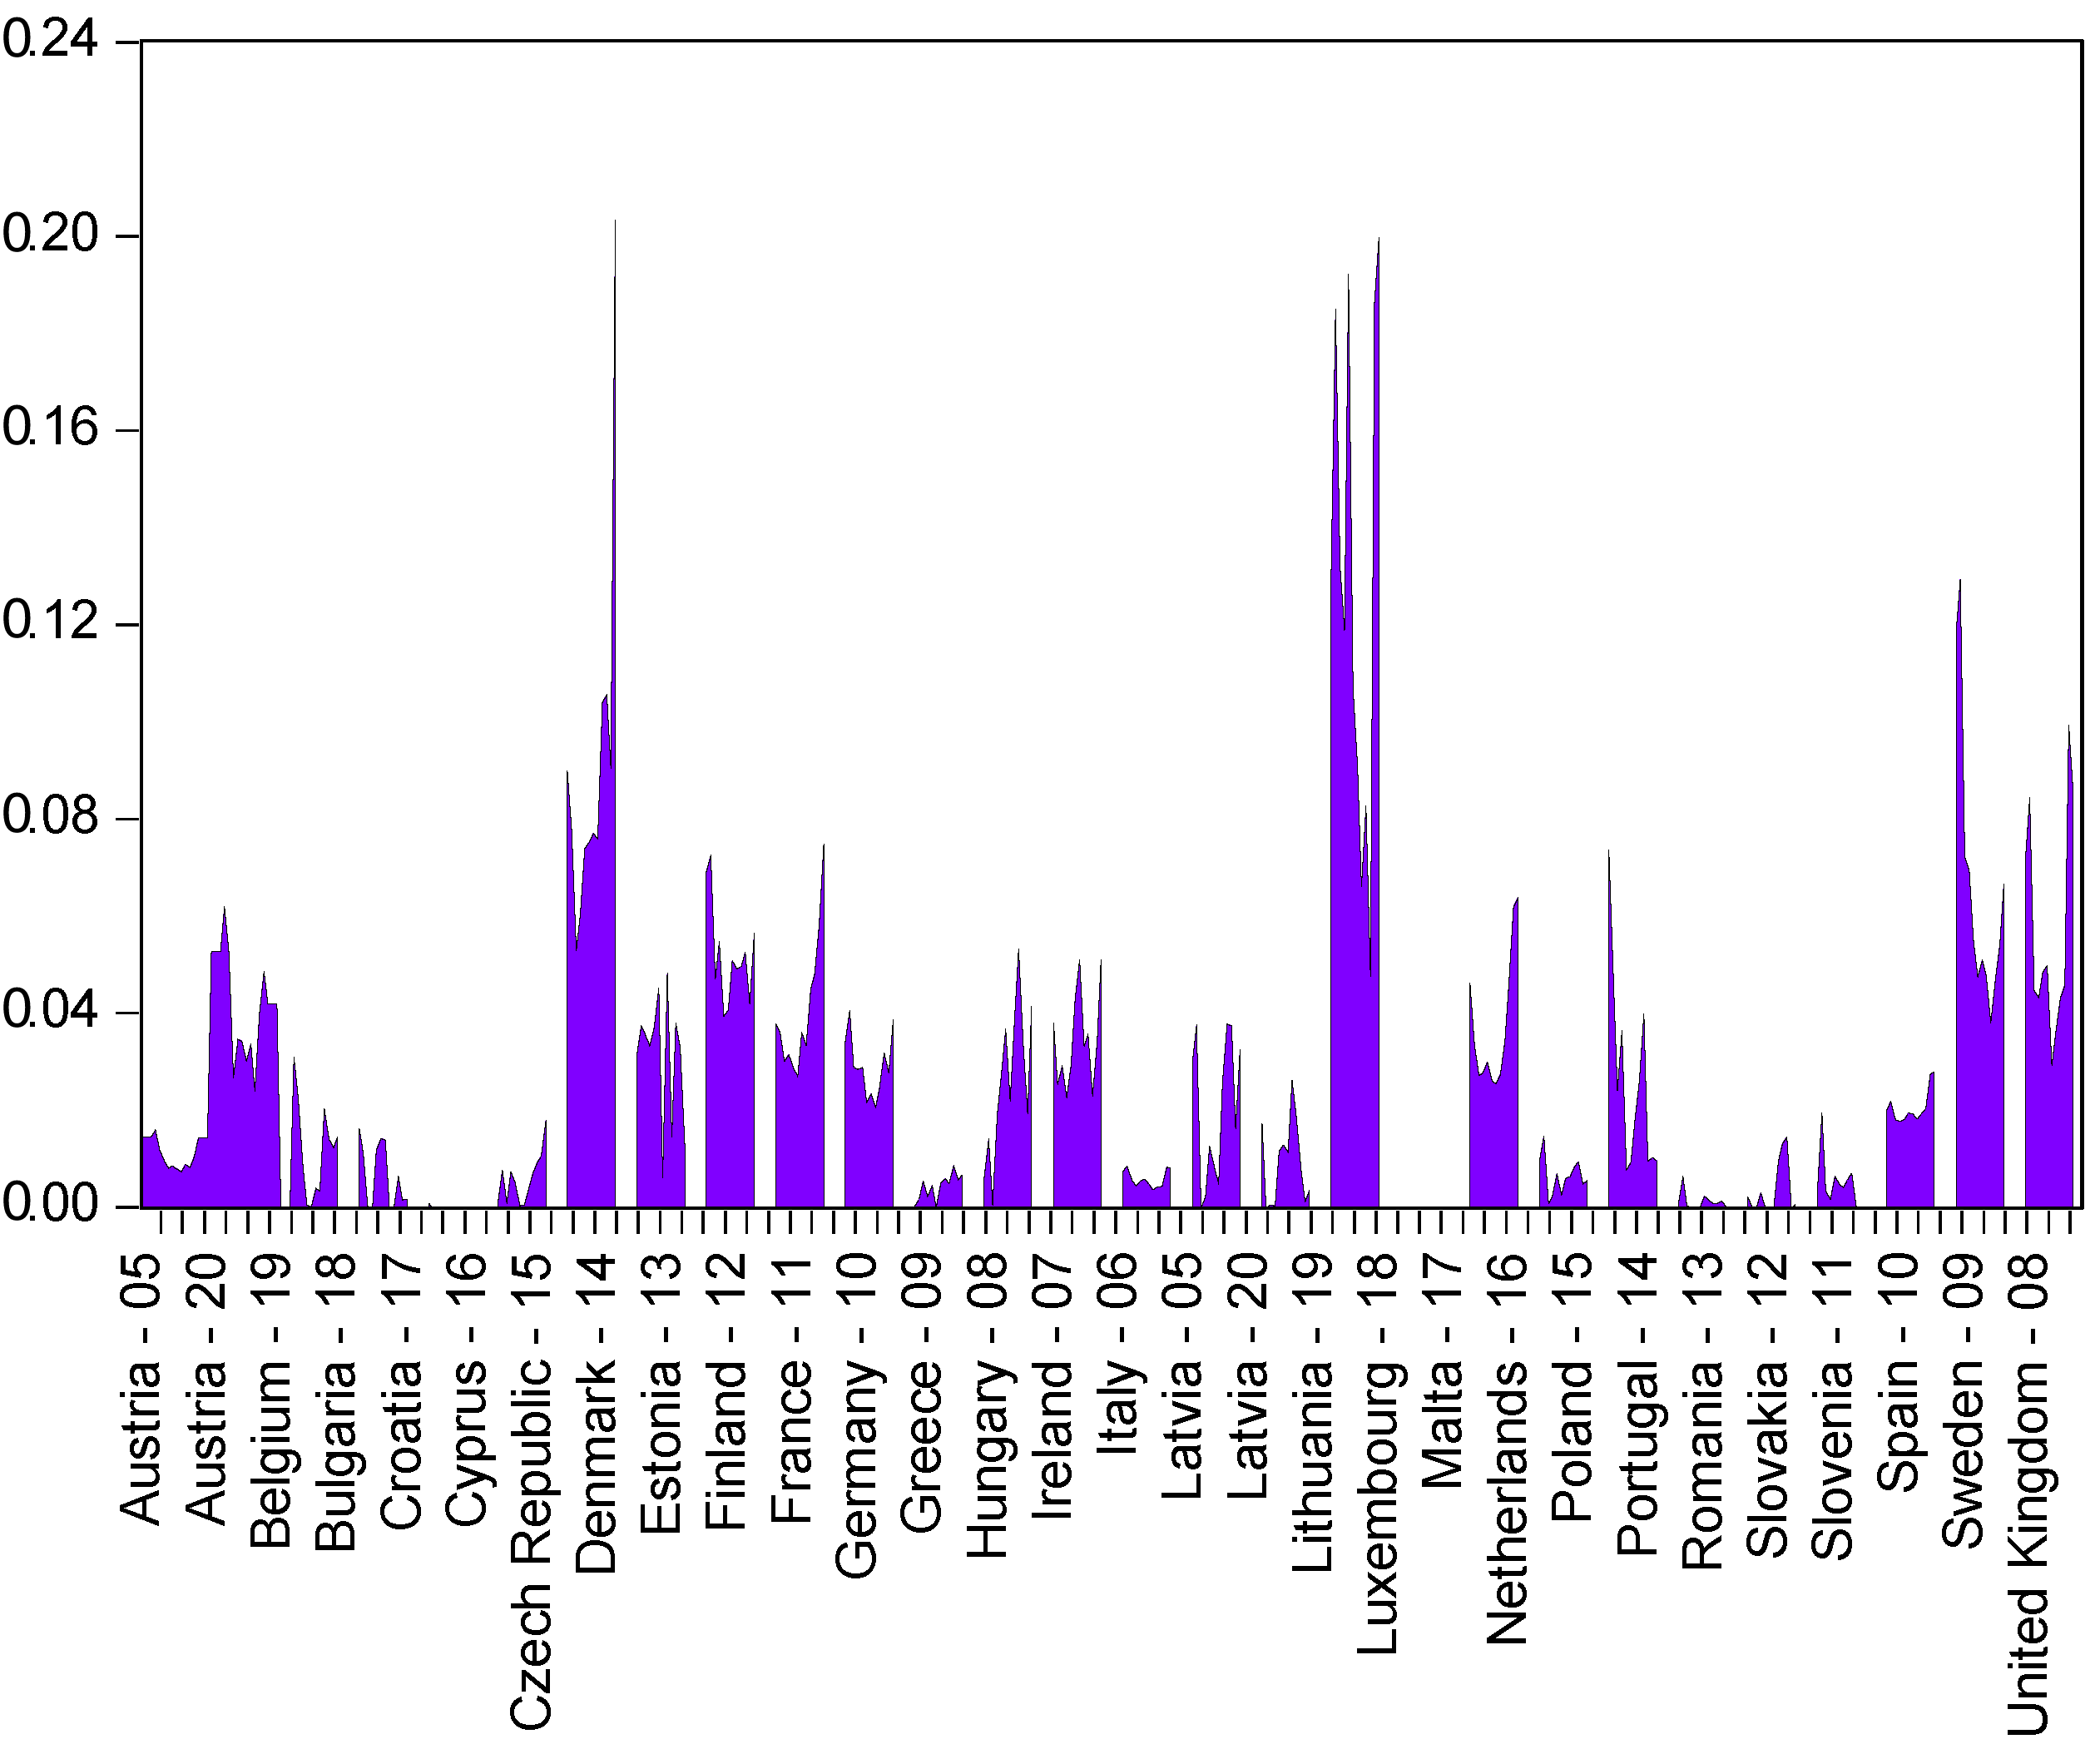
Figure 2 displays substantial increases of the VENTURE variable for Denmark (2015), Luxembourg (2018), Netherlands (2018), Sweden (2009) and the United Kingdom (2010), following the 2008 global financial crisis and the European sovereign debt crisis. During the first year of the current pandemic crisis, only Austria (1.43%) and Belgium (4.25%) have reported increases with respect to this variable.

Figure 2.
The evolution of VENTURE across EU-28 in the period 2005–2020.
Figure 3 shows the ascending trend of the TURNOVER variable for Belgium (2019), Cyprus (2015), Czech Republic (2015), Denmark (2014), Finland (2012), Hungary (2007), Portugal (2014) and Sweden (2009) after the 2008 global financial crisis and the European sovereign debt crisis. In terms of the current pandemic crisis, all EU member states have registered lower values: Austria (9.31%), Belgium (14.09%), Bulgaria (2.20%), Croatia (9.02%), Cyprus (7.80%), Denmark (17.55%), to name but a few.
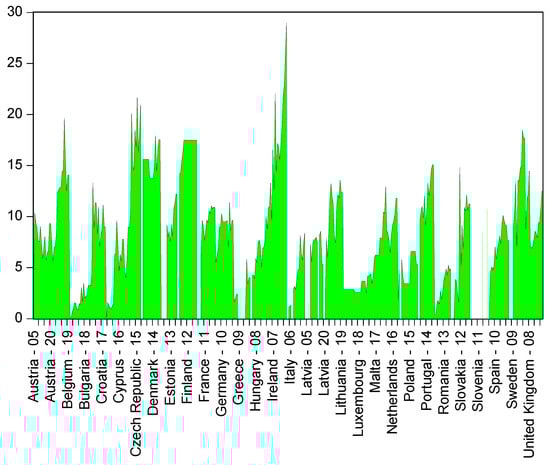
Figure 3.
The evolution of TURNOVER across EU-28 in the period 2005–2020.
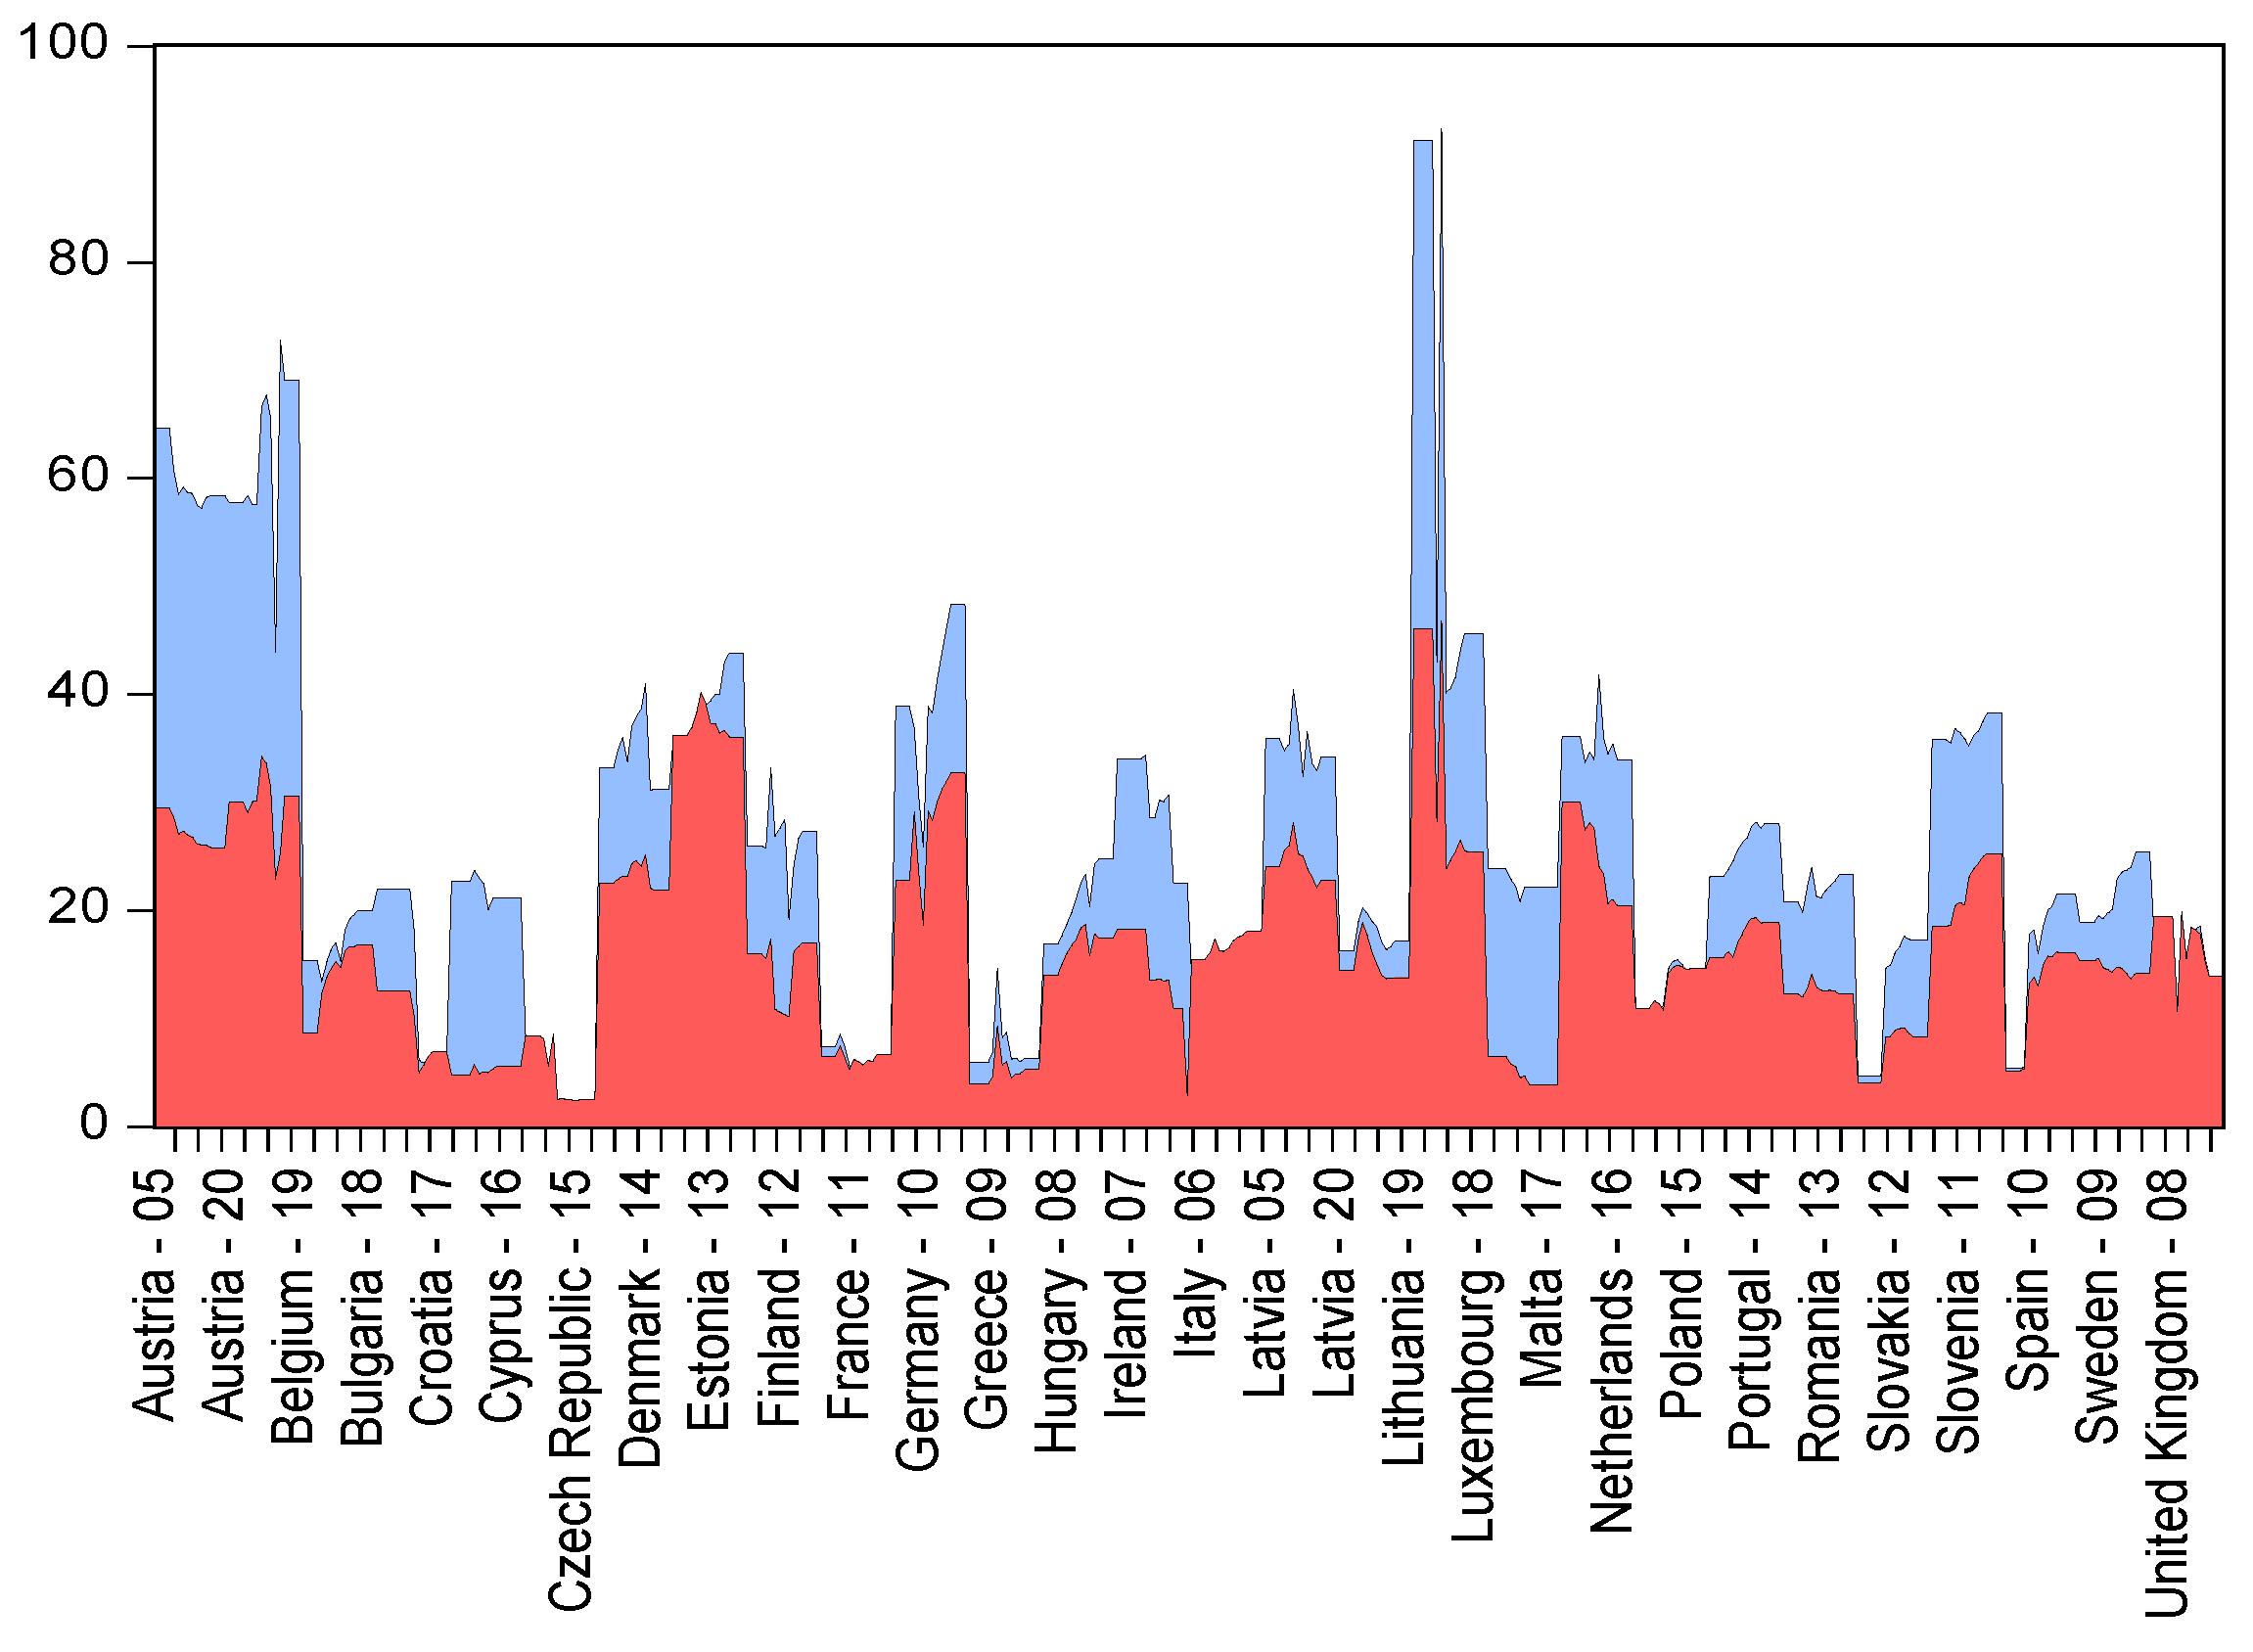
Figure 4 shows the evolution of intra-EU exports and imports. According to the analysis, the intra-EU imports have exceeded by far the intra-EU exports across the entire period. Nevertheless, intra-EU exports of SMEs from Cyprus, Sweden and the United Kingdom have exceeded the intra-EU imports.
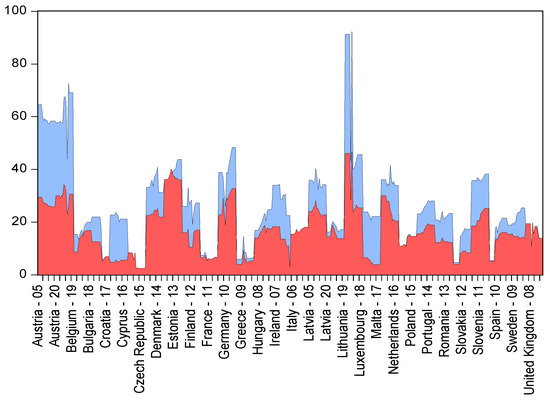
Figure 4.
The evolution of intra-EU exports (in red) and intra-EU imports (in blue) across EU-28 in the period 2005–2020.
Figure 5 displays that extra-EU exports have registered higher levels than extra-EU imports in countries such as Croatia, France, Germany, Latvia, Poland, Portugal, Romania, Spain and the United Kingdom.
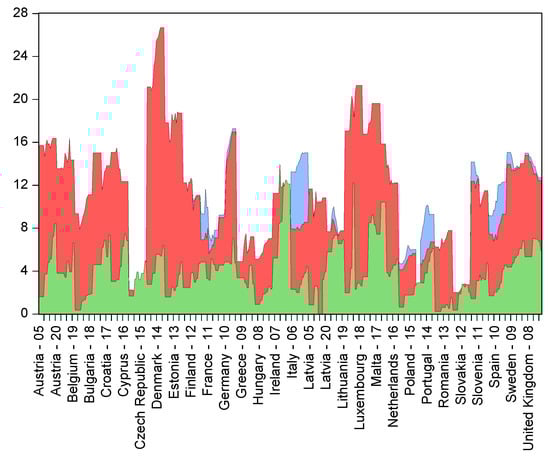
Figure 5.
The evolution of extra-EU exports (in red), extra-EU imports (in blue) and extra-EU online exports (in green) across EU-28 in the period 2005–2020.
Overall, when SMEs reported more exports than imports, they generated an additional value within the EU, which triggered an increase in VAD_RATE. At the same time, more exports generated an increase in VENTURE and TURNOVER, which triggered positive consequences for the life standards of EU citizens. In this sense, SMEs could be regarded as a driving force of EU development level.
The general form of the econometric model was the following:
where,
- represents the intercept;
- represents the coefficient of the predictors;
- represents the predictors;
- m represents the activity of the SMEs from the EU-28 country sample;
- t represents the years included in the analysis, spanning from 2005 to 2020;
- represents the time-invariant country specific fixed effects;
- represents the fixed effects controlling for financial crises;
- represents the error term.
In order to run panel data modelling via panel generalized method of moments (GMM) and two-stage least squares (2SLS) panel, one had to opt between fixed and random effects. In this sense, the Hqausman test was used because it disentangles between the two types of effects. According to its null hypothesis, there are no differences between fixed and random effects, therefore random effects should be included in the econometric models. According to the alternative hypothesis, fixed effects should be incorporated into the models.
The choice of estimating results using both GMM and 2SLS is grounded on numerous studies reported in the literature [39,40,41,42,43,44,45,46], which recommend these methods for ruling out endogeneity concerns. Hence, by means of approaches such as GMM and 2SLS, one gains confidence in the strength and accuracy of the estimated results.
The empirical study investigated the following research hypotheses:
Hypothesis 1 (H1).
There is a significant relationship between VAD_RATE and intra-EU imports, intra-EU online imports, extra-EU online exports, extra-EU imports, extra-EU exports.
Hypothesis 2 (H2).
There is a significant relationship between VAD_RATE and intra-EU exports, intra-EU online imports, extra-EU imports, extra-EU exports.
Hypothesis 3 (H3).
There is a significant relationship between VENTURE and intra-EU imports, intra-EU online imports, extra-EU online exports, extra-EU imports, extra-EU exports.
Hypothesis 4 (H4).
There is a significant relationship between VENTURE and intra-EU exports, intra-EU online imports, extra-EU online exports, extra-EU imports, extra-EU exports.
Hypothesis 5 (H5).
There is a significant relationship between TURNOVER and intra-EU imports, intra-EU online imports, extra-EU online exports, extra-EU imports, extra-EU exports.
Hypothesis 6 (H6).
There is a significant relationship between TURNOVER and intra-EU exports, intra-EU online imports, extra-EU online exports, extra-EU imports, extra-EU exports.
The research hypotheses will be tested via panel data modelling in the subsequent section.
4. Results
4.1. Descriptive Statistics
As a first step of the analysis approach, measures of central tendency and variation (i.e., mean, median, standard deviation, minimum and maximum values) were computed together with the metrics that are generally used to characterize distributions (i.e., skewness, kurtosis). Namely, descriptive statistics for all variables of interest were determined: value added rate; venture capital investments rate; turnover from e-commerce rate; intra-EU exports of goods by SMEs in industry; intra-EU imports of goods by SMEs in industry; intra-EU online importers; extra-EU online exporters; extra-EU exports of goods by SMEs in industry; extra-EU imports of goods by SMEs in industry.
Table 2 displays the measures of central tendency, variation and distribution characteristics for the EU-28 sample.
Table 2.
Descriptive statistics of the variables of interest for the EU-28 countries.
As ca be noticed starting from the standard deviation values, the variables EUIMP and EUEXP registered the largest volatility, while VENTURE registered the smallest volatility. According to the skewness values, all variables were skewed to the right. Since the kurtosis values for the variables VAD_RATE, VENTURE, TURNOVER, EUIMP, EUEXP, EUIMPOL and EUEXTRAOL were above the threshold of 3, it means that their distributions were leptokurtic. At the same time, EXTRAEXP and EXTRAIMP had platykurtic distributions because the kurtosis values corresponding to them were below 3.
For the purpose of investigating the normal distribution of empirical data, the standard Jarque-Bera test was used. Under the null hypothesis of this test, data are normally distributed when the corresponding probability exceeds the chosen significance level. If the null hypothesis is rejected, it indicates that data are non-normally distributed. In the case of this study, the Jarque-Bera test showed that all variables of interest were non-normally distributed at the 1% level.
4.2. Correlation Analysis
As a second step of the analysis approach, correlations were determined. When modelling panel data, correlation analysis serves to spot potential multicollinearity problems that could bias estimated results. Such multicollinearity issues become problematic when correlation coefficients exceed the 0.9 threshold.
Table 3 illustrates the correlation coefficients for the variables of interest.
Table 3.
Correlation matrix of the variables of interest for the EU-28 countries.
Correlation analyses presented in Table 3 indicated that all significant associations between independent variables were positive. In this context, the highest correlation was established between the intra-EU exports of goods (EUEXP) and intra-EU imports of goods (EUIMP) (). The lowest correlation was established between extra-EU online exports (EUEXTRAOL) and extra-EU exports (EXTRAEXP) ().
Because none of the correlation coefficients exceeded the threshold of 0.9, it could be concluded that the risk of multicollinearity was low and it would not bias the estimated results. Multicollinearity will also be checked with the variance inflation factor (VIF).
4.3. Panel Data Modelling
Table 4 displays the estimated coefficients of the independent variables for all econometric models. The outcome variables were VAD_RATE, VENTURE and TURNOVER.
Table 4.
Econometric models regarding the activity of SMEs across the EU-28 countries with respect to value added rate.
With respect to Model 1, when examining the evolution of the value added rate via panel generalized method of moments (GMM) at first-difference estimation, results showed that the majority of independent variables had significant influence on VAD_RATE. Namely, should EUIMP and EXTRAEXP increase by one percent, VAD_RATE would rise by 0.03 percentage points and by 1.96 percentage points, respectively. At the same time, when EUEXTRAOL and EXTRAIMP augmented by one percent, VAD_RATE would decrease considerably by 0.15 percentage points and 3.68 percentage points, respectively. Overall, the probabilities corresponding to the J-statistic test ( and the Arellano-Bond test for AR(2) ( indicated that the combined effect of the independent variables was statistically significant.
When the model estimated VAD_RATE via 2SLS panel (with cross-section random effects), the impact of the EXTRAIMP and EXTRAEXP was not significant (F = 1.84, p = 0.104).
Hence, the first research hypothesis was confirmed by the econometric modelling focused on value added rate.
Model 2 investigated the evolution of value added rate under the influence of EUEXP, EUIMPOL, EUEXTRAOL, EXTRAIMP and EXTRAEXP with panel GMM. That is, the variable EUEXP and EXTRAEXP had a positive impact, while EXTRAIMP had a negative impact. If EUEXP and EXTRAEXP rose by one percent, VAD_RATE would follow a similar trend with 0.13 percentage points and 2.09 percentage points, respectively. At the same time, should EXTRAIMP improve by one percent, VAD_RATE would decrease by 3.85 percentage points. The probabilities corresponding to the J-statistic test ( and the Arellano-Bond test for AR(2) () indicated that the combined effect of independent variables on value added rate was statistically significant.
When it estimated results via 2SLS panel (with cross-section random effects), the predictors explained 1.71% of the variance in the outcome (F = 1.96, p < 0.10). That is, the impact of two predictors remained relevant. Namely, if EXTRAIMP improved by one percentage point, VAD_RATE would decrease by 0.25 percentage points. At the same time, should EXTRAEXP improve by one percent, VAD_RATE would increase by 0.15 percentage points.
Hence, the second research hypothesis was confirmed via the econometric models estimating the VAD_RATE outcome.
In terms of Model 3 that used panel GMM to investigate venture capital investments rate (Table 5), results showed that almost all independent variables played an important part. Namely, should EUIMP, EUIMPOL and EXTRAEXP increase by one percent, the VENTURE variable would slightly rise by 0.0008 percent, 0.0007 and 0.005 percentage points, respectively. At the same time, when EUEXTRAOL augmented by one percent, VENTURE would decrease by 0.003 percentage points. Overall, the probabilities corresponding to the J-statistic test ( and the Arellano-Bond test for AR(2) ( indicated that the combined effect of the independent variables was statistically significant.
Table 5.
Econometric regarding the activity of SMEs across the EU-28 countries with respect to venture capital investments rate.
In the model that estimated VENTURE via 2SLS panel (with cross-section random effects), the impact of the EUEXTRAOL and EXTRAEXP variables remained significant (F = 3.92, p < 0.05). The model explained 4.32% of the variance in the outcome. Namely, if EUEXTRAOL and EXTRAEXP improved by one percentage point, VENTURE would decrease by 0.002 percentage points and, at the same time, it would rise by 0.002 percentage points.
Hence, the third research hypothesis was confirmed via the econometric models estimating venture capital investments rate.
According to Model 4 estimated via panel GMM, the variance in VENTURE was explained by the majority of independent variables. That is, the variables EUEXP, EUIMPOL and EXTRAEXP had a positive impact on the outcome evolution, while EUEXTRAOL had a negative impact. If EUEXP, EUIMPOL and EXTRAEXP rose by one percent, the outcome would follow a similar trend with 0.001 percentage points, 0.0007 percentage points and 0.006 percentage points, respectively. At the same time, should EUEXTRAOL improve by one percent, VENTURE would decrease by 0.003 percentage points. The probabilities corresponding to the J-statistic test ( and the Arellano-Bond test for AR(2) () indicated that the combined effect of the independent variables was statistically significant.
Once applying the 2SLS panel approach with random effects, the predictors explained 2.67% of the variance in the outcome (F = 3.95, p < 0.05). That is, the impact of two predictors remained relevant. Namely, if EUEXTRAOL improved by one percentage point, VENTURE would decrease by 0.002 percentage points. At the same time, should EXTRAEXP improve by one percent, VENTURE would increase by 0.002 percentage points.
Hence, the fourth research hypothesis was confirmed via the econometric models estimating venture capital investments rate.
According to Model 5 estimated via panel GMM (Table 6), the variance in TURNOVER was due to the majority of independent variables. Namely, should EUIMPOL, EUEXTRAOL and EXTRAEXP increase by one percent, TURNOVER would rise by 0.14 percentage points, 0.46 percentage points and 1.18 percentage points, respectively. At the same time, when EXTRAIMP augmented by one percent, TURNOVER would decrease by 1.44 percentage points. Overall, the probabilities corresponding to the J-statistic test ( and the Arellano-Bond test for AR(2) ( indicated that the combined effect of the independent variables on TURNOVER was statistically significant.
Table 6.
Econometric models regarding the activity of SMEs across the EU-28 countries with respect to turnover from e-commerce rate.
When using the 2SLS panel approach and cross-section random effects, only the impact of EUEXTRAOL remained significant (F = 14.23, p < 0.001). The model explained 12.41% of the variance in the outcome. Namely, if EUEXTRAOL improved by one percentage point, TURNOVER would rise by 0.84 percentage points.
Hence, the fifth research hypothesis was confirmed via the econometric models estimating turnover from e-commerce rate.
Model 6 investigated the evolution of TURNOVER depending on EUEXP, EUIMPOL, EUEXTRAOL, EXTRAIMP and EXTRAEXP. In the case of the GMM approach, the variance in TURNOVER was explained by all independent variables. That is, the variables EUIMPOL, EUEXTRAOL and EXTRAEXP had a positive impact, while EXTRAIMP had a negative impact. If EUIMPOL, EUEXTRAOL and EXTRAEXP rose by one percent, TURNOVER would register a similar trend with 0.14, 0.38 and 1.17 percentage points, respectively. At the same time, should EXTRAIMP improve by one percent, TURNOVER would decrease by 1.39%. The probabilities corresponding to the J-statistic test ( and the Arellano-Bond test for AR(2) () indicated that the combined effect of the independent variables was statistically significant.
After running the 2SLS panel approach with random effects, the model explained 11.17% of the variance in the outcome (F = 13.03, p < 0.001). That is, the impact of only one predictor remained relevant. Namely, if EUEXTRAOL improved by one percentage point, TURNOVER would decrease by 0.79 percentage points.
Hence, the sixth research hypothesis was confirmed via the econometric models estimating turnover rate.
5. Discussion and Conclusions
The present research study investigated the relationship between economic growth proxied by value added rate, venture capital investments rate and turnover from e-commerce rate and different variables concerning import and export business activities of small and medium enterprises (SMEs) in the EU-28 member states. The variables related to import and export were the following: intra-EU exports of goods; intra-EU imports of goods; intra-EU online importers; extra-EU online exporters; extra-EU exports of goods; extra-EU imports of goods. Variables of interest were retrieved from the Comext, Eurostat, Structural Business Statistics and World Bank databases. The period of analysis was 2005–2020.
Multiple methods were used in order to test six research hypotheses: descriptive statistics; correlation analysis; panel data modelling (panel generalized method of moments; two-stage least squares panel with cross-section weights) without time fixed effects. Econometric models supported all research hypotheses.
According to estimations, economic growth proxied by value added rate was mainly influenced by variables such as: intra-EU imports of goods, intra-EU exports of goods, extra-EU online exporters, extra-EU exports of goods and extra-EU imports of goods. Interestingly enough, online business activities of SMEs across the European Union represented an important engine that drove economic development. At the same time, economic relations developed between EU member states and countries outside the union proved to play an important part in driving economic growth.
With respect to venture capital investments rate, the highest impact was triggered by the variables extra-EU online exporters and extra-EU exports. From an economic standpoint, the rate of venture capital investments has increased mainly due to the intense trading activities of SMEs in the European Union. A second reason would be the increasing exports outside the EU that have generated additional financial resources. At the same time, extra-EU online exports have increased during the entire period of analysis and have positively influenced the countries’ economic growth levels.
In terms of turnover from e-commerce rate, results have shown that the strongest impact was yielded by the variables extra-EU imports and exports. As expected, the former had a negative effect, while the latter had a positive effect on economic growth.
As any other study, this research endeavor has certain limitations. First, the study considered export and import-related variables in order to examine economic growth. Upcoming research might take into account other macroeconomic variables that also influence economic growth. Second, the relationships were tested using data from SMEs operating across the European Union. Nevertheless, future studies could consider expanding the country sample beyond the borders of the union in order to test the research hypotheses.
All in all, the study emphasizes the importance of overall import and export activities of small and medium enterprises for the level of economic growth across EU member states. Starting from the fact that especially online activities have generated considerable increases for the EU-28 economies, the European Commission in general and national authorities in particular are called to support business endeavors that favor online trading and finance state budgets through their activities. At the end of the day, a substantial economic growth has a positive impact on the amount of tax money collected by public authorities [47], which can be efficiently used to provide high quality public goods. Hence, business endeavors of small and medium enterprises engender benefits not only for the economic market but also for the overall society.
Funding
This research was funded by the 2021 Development Fund of the Babeş-Bolyai University, Cluj-Napoca, Romania.
Institutional Review Board Statement
Not applicable.
Informed Consent Statement
Not applicable.
Data Availability Statement
Not applicable.
Acknowledgments
The author would like to thank the reviewers for their helpful comments and suggestions.
Conflicts of Interest
The author declares no conflict of interest.
Abbreviations
| EUEXP | Intra-EU exports of goods by SMEs in industry |
| EUIMP | Intra-EU imports of goods by SMEs in industry |
| EUIMPOL | Intra-EU online importers |
| EUEXTRAOL | Extra-EU online exporters |
| EXTRAEXP | Extra-EU exports of goods by SMEs in industry |
| EXTRAIMP | Extra-EU imports of goods by SMEs in industry |
| TURNOVER | Turnover from e-commerce rate |
| VAD_RATE | Value added rate |
| VENTURE | Venture capital investments rate |
| VIF | Variance inflation factor |
References
- OECD. OECD SME and Entrepreneurship Outlook 2019; OECD: Paris, France, 2019. [Google Scholar]
- OECD. Entrepreneurship at a Glance 2018; OECD: Paris, France, 2018. [Google Scholar]
- EIM Business & Policy Research. European SMEs under Pressure: Annual Report on EU Small and Medium-Sized Enterprises 2009; EIM Business & Policy Research: Brussels, Belgium, 2009. [Google Scholar]
- Batrancea, L.; Rathnaswamy, M.M.; Batrancea, I.; Nichita, A.; Rus, M.-I.; Tulai, H.; Fatacean, G.; Masca, E.S.; Morar, I.D. Adjusted net savings of CEE and Baltic nations in the context of sustainable economic growth: A panel data analysis. J. Risk Financ. Manag. 2020, 13, 234. [Google Scholar] [CrossRef]
- Chiappero-Martinelli, E.; von Jacobi, N.; Signorelli, M. Human development and economic growth. In Palgrave Dictionary of Emerging Markets and Transition Economics; Hölscher, J., Thomann, H., Eds.; Palgrave Macmillan: London, UK, 2016; pp. 223–244. [Google Scholar]
- Gopalakrishna, B.V.; Jayaprakash, R. Economic growth & human development: The experience of Indian states. Indian J. Ind. Relat. 2012, 47, 634–644. [Google Scholar]
- Ranis, G.; Stewart, F.; Ramirez, A. Economic growth and human development. World Dev. 2000, 28, 197–219. [Google Scholar] [CrossRef] [Green Version]
- Alarcón, F.; Cortés-Pellicer, P.; Pérez-Perales, D.; Sanchis, R. Sustainability vs. circular economy from a disposition decision perspective: A proposal of a methodology and an applied example in SMEs. Sustainability 2020, 12, 10109. [Google Scholar] [CrossRef]
- Kim, S.-S. Sustainable growth variables by industry sectors and their influence on changes in business models of SMEs in the era of digital transformation. Sustainability 2021, 13, 7114. [Google Scholar] [CrossRef]
- Tsvetkova, D.; Bengtsson, E.; Durst, S. Maintaining sustainable practices in SMEs: Insights from Sweden. Sustainability 2020, 12, 10242. [Google Scholar] [CrossRef]
- Stepniak-Kucharska, A. The impact of the global downturn on the economic situation of the SME sector in Poland. Ekonomia I Prawo-Econ. Law 2016, 15, 235–248. [Google Scholar] [CrossRef] [Green Version]
- Auzzir, Z.; Haigh, R.; Amaratunga, D. Impacts of disaster to SMEs in Malaysia. Procedia Eng. 2018, 212, 1131–1138. [Google Scholar] [CrossRef]
- Jia, C.Y.; Tang, X.Y.; Kan, Z.H. Does the nation innovation system in China support the sustainability of small and medium enterprises (SMEs) innovation? Sustainability 2020, 12, 2562. [Google Scholar] [CrossRef] [Green Version]
- Golikova, V.; Kuznetsov, B. Suboptimal size: Factors preventing the growth of Russian small and medium-sized enterprises. Foresight STI Gov. 2017, 11, 83–93. [Google Scholar] [CrossRef]
- Pacheco, L. Capital structure and internationalization: The case of Portugal industrial SMEs. Res. Int. Bus. Financ. 2016, 38, 531–545. [Google Scholar] [CrossRef]
- Small and Medium Enterprises (SMEs) Finance. Available online: https://www.worldbank.org/en/topic/smefinance (accessed on 12 October 2021).
- Helping Small Business to Thrive. Available online: https://www.eppgroup.eu/what-we-stand-for/our-priorities/helping-small-business-to-thrive (accessed on 12 October 2021).
- European Commission. User Guide to the SME Definition; European Commission: Brussels, Belgium, 2019. [Google Scholar]
- Hessels, J.; Parker, S.C. Constraints, internationalization and growth: A cross-country analysis of European SMEs. J. World Bus. 2013, 48, 137–148. [Google Scholar] [CrossRef]
- Sun, M. The internet and SME participation in exports. Inf. Econ. Policy 2021, 57, 100940. [Google Scholar] [CrossRef]
- Emery, R.F. The relation of exports and economic growth. Kyklos 1967, 20, 470–486. [Google Scholar] [CrossRef]
- Hultman, C.W. Exports and economic growth: A survey. Land Econ. 1967, 43, 148–157. [Google Scholar] [CrossRef]
- Kavoussi, R.M. Export expansion and economic growth: Further empirical evidence. J. Dev. Econ. 1984, 14, 241–250. [Google Scholar] [CrossRef]
- Vohra, R. Export and economic growth: Further time series evidence from less-developed countries. Int. Adv. Econ. Res. 2001, 7, 345–350. [Google Scholar] [CrossRef]
- Subhan, M.; Alharthi, M.; Alam, M.S.; Thoudam, P.; Khan, K. Relationship between exports, economic growth and other economic activities in India: Evidence from VAR model. J. Asian Financ. Econ. Bus. 2021, 8, 271–282. [Google Scholar]
- Malesios, C.; Dey, P.K.; Ben Abdelaziz, F. Supply chain sustainability performance measurement of small and medium sized enterprises using structural equation modeling. Ann. Oper. Res. 2020, 24, 623–653. [Google Scholar] [CrossRef] [Green Version]
- Bongini, P.; Ferrando, A.; Rossi, E.; Rossolini, M. SME access to market-based finance across Eurozone countries. Small Bus. Econ. 2019, 56, 1667–1697. [Google Scholar] [CrossRef]
- Holguin, D.M.; Mejia, A.C. Comparison of methodologies for risk management in small and medium-sized business projects. Rev. Cienc. Estrateg. 2017, 25, 319–338. [Google Scholar] [CrossRef]
- Zemtsov, S.P. Institutions, entrepreneurship, and regional development in Russia. Zhurnal Novaya Ekon. Assotsiatsiya-J. New Econ. Assoc. 2020, 2, 168–180. [Google Scholar] [CrossRef]
- Boadi, I.; Dana, L.P.; Mertens, G.; Mensah, L. SMEs’ financing and banks’ profitability: A “good date” for banks in Ghana? J. Afr. Bus. 2017, 18, 257–277. [Google Scholar] [CrossRef]
- Wozniak, M.; Duda, J.; Gasior, A.; Bernat, T. Relations of GDP growth and development of SMEs in Poland. Procedia Comput. Sci. 2019, 159, 2470–2480. [Google Scholar] [CrossRef]
- Czarniewski, S. Small and medium-sized enterprises in the context of innovation and entrepreneurship in the economy. Pol. J. Manag. Stud. 2016, 13, 30–39. [Google Scholar] [CrossRef]
- Ben Abdelaziz, F.; Alaya, H.; Dey, P.K. A multi-objective particle swarm optimization algorithm for business sustainability analysis of small and medium sized enterprises. Ann. Oper. Res. 2020, 293, 557–586. [Google Scholar] [CrossRef] [Green Version]
- Kazmi, S.A.Z.; Naaranoja, M. Inspiring European small and medium enterprise (SME) sector by inserting effective business transfer process. In Advances in Human Factors, Business Management and Society. AHFE 2018; Kantola, J.I., Nazir, S., Barath, T., Eds.; Springer: Cham, Switzerland, 2019; pp. 547–557. [Google Scholar] [CrossRef]
- Vishnupriya, B.; Abirami, A.B. Navigating the waters of “the engine of development”—Small medium enterprises (SME’s) in India. Eur. J. Sustain. Dev. 2019, 8, 234. [Google Scholar] [CrossRef]
- Gao, G.Z. Research on the impact of financial ecological environment on SME financing. Ekoloji 2019, 28, 1633–1640. [Google Scholar]
- Nizaeva, M.; Coskun, A. Determinants of the financing obstacles faced by SMEs. An empirical study of emerging economies. J. Econ. Soc. Stud. 2018, 7, 81–99. [Google Scholar] [CrossRef]
- Jenkins, H.; Hossein, M. An analysis of the macroeconomic conditions required for SME lending: Evidence from Turkey and other emerging market countries. Panoeconomicus 2017, 64, 77–92. [Google Scholar] [CrossRef]
- Roodman, D. How to do xtabond2: An introduction to difference and system GMM in Stata. Stata J. 2009, 9, 86–136. [Google Scholar] [CrossRef] [Green Version]
- Ullah, S.; Akhtar, P.; Zaefarian, G. Dealing with endogeneity bias: The generalized method of moments (GMM) for panel data. Ind. Mark. Manag. 2018, 71, 69–78. [Google Scholar] [CrossRef]
- Konstantakopoulou, I. Does health quality affect tourism? Evidence from system GMM estimates. Econ. Anal. Policy 2022, 73, 425–440. [Google Scholar] [CrossRef]
- Zhang, H.-F. Iterative GMM for partially linear single-index models with partly endogenous regressors. Comput. Stat. Data Anal. 2021, 156, 107145. [Google Scholar] [CrossRef]
- Shabani, Z.D.; Shahnazi, R. Energy consumption, carbon dioxide emissions, information and communications technology, and gross domestic product in Iranian economic sectors: A panel causality analysis. Energy 2019, 169, 1064–1078. [Google Scholar] [CrossRef]
- Eslamloueyan, K.; Jafari, M. Do high human capital and strong institutions make oil-rich developing countries immune to the oil curse? Energy Policy 2021, 158, 112563. [Google Scholar] [CrossRef]
- Bascle, G. Controlling for endogeneity with instrumental variables in strategic management research. Strateg. Organ. 2008, 6, 285–327. [Google Scholar] [CrossRef] [Green Version]
- Ma, Y.; Yao, C. Openness, financial structure, and bank risk: International evidence. Int. Rev. Financ. Anal. 2022, 81, 102065. [Google Scholar] [CrossRef]
- Batrancea, L. An econometric approach regarding the impact of fiscal pressure on equilibrium: Evidence from electricity, gas and oil companies listed on the New York Stock Exchange. Mathematics 2021, 9, 630. [Google Scholar] [CrossRef]


Publisher’s Note: MDPI stays neutral with regard to jurisdictional claims in published maps and institutional affiliations. |
© 2022 by the author. Licensee MDPI, Basel, Switzerland. This article is an open access article distributed under the terms and conditions of the Creative Commons Attribution (CC BY) license (https://creativecommons.org/licenses/by/4.0/).