Article

Spatial Matching Analysis and Development Strategies of County Night-Time Economy: A Case of Anning County, Yunnan Province

Institute of Urban and Rural Planning Theories & Technologies, Zhejiang University, Hangzhou 310058, China
*
Author to whom correspondence should be addressed.
Sustainability 2022, 14(9), 4891; https://doi.org/10.3390/su14094891
Submission received: 6 March 2022 / Revised: 31 March 2022 / Accepted: 12 April 2022 / Published: 19 April 2022
(This article belongs to the Section Sustainable Urban and Rural Development)

Abstract

:
The Chinese government regards the night-time economy as one of the essential means to expand domestic demand and enhance sustainable economic development. Scientifically choosing the night-time economic development path of the suburban counties of the Chinese metropolis (SCCM) and proposing a reasonable spatial matching planning strategy is an urgent problem for Chinese local governments. This study takes Anning county, a suburban Kunming metropolitan area, as the research area. Using Python to capture multi-spatial data, such as POI and Baidu heatmap, we use ArcGIS spatial analysis and statistical tools to show the spatial distribution characteristics of the night-time economic formats in Anning County. At the same time, the spatial coupling coordination model is used to calculate the coupling coordination degree of the night-time economic formats distribution and comprehensive traffic distribution (D1), night-time economic formats distribution and night-crowd vitality (D2), and the spatial coupling coordination of the three (D3). It is divided into five spatial matching levels and analyzes the shortage of night-time economic development in each subdistrict. The research results show that the spatial development of the night-time economy in Anning county is unbalanced at the current stage. The northern part of the county has a good development trend, and the Lianran subdistrict has the highest coupling coordination degree (0.995). In contrast, the southern part of the county has the lowest coupling coordination degree due to a lack of economic formats and traffic restrictions (0.115). According to the subdistricts’ differences, the sustainable development strategy of the county’s night-time economy should be formulated from the perspective of the long-term development of metropolitan areas. We hope that this research can provide valuable inspiration and a development reference for relevant countries and regions to stimulate the sustainable power of the night-time economy.

1. Introduction

In contemporary society, the high-intensity work pressure and the shackles of daily trivial matters have made the night the best time for urban residents to have entertainment. People’s demand for nightlife is increasing [1]. Diversified entertainment activities have contributed significantly to the increase in urban night-time consumption. The concept of the night-time economy came into being, which concerns the economic activity in the city between the hours of 18:00 to 06:00 the next day, and spans multiple sectors, including transport, criminal justice, and the service sector [2], and is a further extension of conventional urban economy in form and time. Regional and national governments have also given increasing attention to the night-time economy, especially in the context of COVID-19. In the short run, as an essential source of employment and additional revenue for local governments, the night-time economy can relieve the pressure of unemployment, boost consumption, and hedge against the economic losses caused by the pandemic. In the long run, the night-time economy can keep cities vibrant at night by creating a sense of belonging for residents and tourists, raising investors’ and consumers’ confidence, and ultimately accelerating economic recovery [3].
The night-time economy can be traced back to the “Estate Romana” summer night cultural activities program organized by Renato Nicolini from 1977 to 1985 [4]. In the 1980s, Italy, France, Sweden, and the Netherlands successively loosened the controls on night-time activities and introduced relevant policies to encourage the development of urban night-time activities. By 1990, the night-time economy was formally proposed in British urban planning [5]. London introduced the “24 h city” policy to maintain the population balance between day and night in the city center through the development of night-time cultural and entertainment activities to solve the problem of the decline of the inner-city [4]. After years of development, London is one of the regions with the most developed night-time economies [6]. In the early 2000s, some scholars held a negative attitude. Bromley [7] and Hobbs et al. [8] believed alcohol to be the core of the violence and chaos caused by the night-time economic expansion threatening social security—it poses challenges to urban security management [9]. Scholars have more diverse attitudes towards the night-time economy with urban renewal and health concepts. Some studies have explored the role of the night-time economy from the perspectives of residents’ social needs [10] and community livability [11]. In addition, others have scientifically analyzed public safety issues in the night-time economy from a social perspective [12,13] and the environmental protection brought about by the light-pollution question [14]. It can be seen that the current research on the night-time economy in Western countries mainly focuses on hidden economic factors, such as night city safety [15] and urban crime [16]. There are few research perspectives, which mainly use qualitative research methods, and a lack of quantitative research on the spatial and temporal distribution of urban night-time economy. Nevertheless, there are still many factors that affect night-time economic development. For example, ongoing enhancements to lighting facilities are fundamental to a vibrant night-time economy. Several empirical studies have shown that the intensity of night-time light partially reflects a country’s/region’s economic development [17,18]. Commercial and public facilities, the policy environment, and economic performance all affect the development of the night-time economy [2].
In the 7th century, China was in the Tang Dynasty. With the development of the city and the prosperity of the commercial economy, the time of the commodity trading market was gradually delayed, so it was called the night market. The night market refers to commodity trading activities from dusk to dawn. It is a particular economic form based on time division, breaking through the original market normality that only allows daytime trading. Later, during the Song Dynasty in China in the 10th century, the scale of the night market continued to expand, and the types of entertainment venues became diverse. However, related scientific research is lacking [19]. After the founding of the People’s Republic of China, China established a “State-Run Night Market” to meet people’s growing and diversified consumption needs [20]. With the continuous development of the Chinese economy and society, the night-time economy has changed from the early state-run night market to a night-time market with multi-subject participation and the coexistence of multiple activities. The economic development model for cities has gradually changed from being traditionally production-oriented to consumption-oriented [21]. Management policies related to the night-time economy have been gradually introduced in China. In August 2019, the Chinese government issued the “Opinions on Further Stimulating the Potential of Cultural and Tourism Consumption” and “Opinions on Accelerating the Development of Circulation and Promoting Commercial Consumption”, proposing to “activate night-time commerce and markets” [22,23]. China sent some positive signals in 2019 about rebuilding the consumer market. The pandemic in China is waning under the effective control of COVID-19 by the Chinese government. Cities such as Beijing, Shanghai, and Guangzhou are introducing policies to develop the night-time economy. The development situation gradually radiates from first- and second-tier cities to third- and fourth-tier cities and counties [24]. According to “2019–2022: The Development Trend and Consumption Behavior of The Night Economy Industry Report”, night-time consumption accounted for about 60% of China’s total retail consumption in 2019. It is expected that night-time consumption will continue to grow at a scale of about 17% in 2021 [25].
The research on the night-time economy in China mainly focuses on three aspects: (1) The first focus is the single-format or facility of the night-time economy. Li et al. [26] evaluated the development effect of China’s night sports consumption through economic data, summed up the reasons, and put forward development countermeasures. Xia et al. [27] explored consumers’ preferences for night travel in Suzhou City through web-text analysis and questionnaire surveys. Chen [28] combined the policy background and practice of the night-time economy to study the development path of Chinese food in the era of COVID-19. However, scholars evaluate China’s night-time economy development from a macro perspective or use market research and questionnaires to study cities, and they cannot analyze the spatial agglomeration characteristics of the urban night-time economy. The POI data used in this study can be accurate to the location of each night-time economic format, which overcomes the limitation that the previous data cannot show the actual night-time economic spatial characteristics. (2) The second focus is the policy evolution of the night economy, sorting out theories from the multi-disciplinary perspective of progress [29] and detailed policy research [30]. Scholars have classified and summarized China’s night-time economic development policies, which is significant for this study to formulate sustainable development strategies that meet actual needs. (3) The effect of the night-time economy is also analyzed, focusing on residents, ecology, and other aspects. The resident level is generally analyzed from the perspective of consumer behavior [31] and consumption tendency [32]; the ecological level includes light pollution caused by night activities [33], garbage pollution [34], and other forms of damage to human settlements. However, related studies have ignored the interaction between the night-time economy and urban space and paid more attention to the relationship between urban space and the ecological environment [35,36]. The urban economic industry provides a good foundation for the city’s sustainable development and can influence the choice of future land use in cities. Moreover, good spatial planning will make the urban space more suitable for economic development and promote regional coordination [37]. There are still many problems in the coordinated development of China’s regions, which should be further explored from the aspects of the connection of urban internal space systems and the allocation of public resources and services [38]. Therefore, this study systematically considers the matching degrees of the night-time economy and urban space.
In recent years, big data to analyze the spatial structure of cities have provided a new research paradigm for urban planning, mainly by including Baidu Huiyan data [39], mobile phone signaling data [40], and night light data [41]. However, these data can only be obtained through the business cooperation model of the official platform. The open-source POI (Point of Interest) data provide an accurate and effective alternative method. At present, some scholars have identified urban fringe areas [42], enterprise community distribution [43], and shared transportation modes [44], and use POI to identify urban development elements to explore future development directions [45]. However, most related studies use POI data to analyze the single-economic format and function of the metropolis, and the research on the distribution of county space is on a blank slate. It is impossible to understand the development status of county space deeply. However, county-level economic statistics are often derived from government statistics, which lack the spatial positioning accuracy and timeliness required for quantitative research and analysis, and are limited in revealing the inner relationship between urban spatial structures and the night-time economy.
Therefore, this study selects Anning county as the research object and uses the POI and Baidu heatmap data with actual availability and high precision to analyze the spatial distribution characteristics of the night-time economy. There are the following two reasons: (1) The county is the basic local administrative unit in China, which originated in the 7th century BC. The full development of the county’s economy can promote the revitalization of the rural economy, improve China’s modernization, and lay a solid foundation for China’s regions’ coordinated and sustainable development [46]. Moreover, studying the distribution characteristics of county night-time economic space can make up for the deficiencies of existing research directions. (2) Python software capturing POI and Baidu heatmap data is a new method of obtaining spatial data, significantly improving spatial distribution research integrity, timeliness, and accuracy. In addition, the study also uses the spatial analysis tool of ArcGIS to calculate the distribution density of streets as a unit. For the first time, the spatial coupling coordination model is used to calculate the degree of coupling coordination between the night-time economic format distribution, comprehensive traffic distribution, and night-crowd vitality, and divide the spatial matching level. This study provides a scientific basis for exploring the sustainable development of the night-time economy in the suburban counties of the Chinese metropolis (SCCM) and puts forward relevant strategy suggestions. It will provide a valuable reference for developing the night-time economy in relevant countries and regions and provide an international perspective on China’s economic transformation and growth.

2. China’s Night-Time Economic Policy and Development Background

Economic globalization promotes the formation and development of the world urban system and makes the relationship between cities and regions of countries show unprecedented close ties. In the integration of suburban counties and metropolises, the traditional planning system centered on a single town has been unable to meet the requirements of the new era, and the value of county planning is becoming more and more critical. In order to realize the integrated development of urban and rural economy, the primary task of the SCCM is to improve the quality of economic development of county-level cities, change the existing economic growth mode, and optimize the tertiary industrial structures and the allocation of economic factors between urban and rural industries.
In October 2017, the Chinese government proposed a “Rural Revitalization Strategy”. It represents a significant conceptual change that rebalances and reshapes the urban–rural relationship, makes farming an attractive profession, and renders the countryside a beautiful place to live and work [47]. The primary issue for realizing rural revitalization is rural industrial revitalization [48]. In September 2018, the Chinese government released the “Rural Revitalization Strategic Plan (2018–2022)”, indicating that rural revitalization has entered a stage of concrete implementation, and that the rural industry has been booming and promoting the prosperity of the rural economy [49]. In August 2019, the Chinese government issued “Opinions on Further Stimulating the Potential of Cultural and Tourism Consumption” and “Opinions on Accelerating the Development of Circulation and Promoting Commercial Consumption”. With the intensive introduction of government policies, ongoing improvements in infrastructure, and shifts in urban residents’ consumption habits, China’s night-time economy continues to develop rapidly despite the pandemic. By 1 October 2020, China had issued 197 policies related to the night-time economy throughout the year—four times greater than the number of policies published in 2019 [50]. However, the development level of the central urban area and surrounding counties and villages is constantly expanding. The county and village levels have not issued relevant policies to guide, promote, and regulate the development of the night economy. In order to narrow the gap between urban and rural economic development, in particular, the limitation of administrative boundaries makes it more challenging to coordinate regional development and policy implementation [51]. Therefore, it is necessary to explore the strategies of night-time economic development in the SCCM under the background of China’s rural revitalization and urban–rural integration. This study takes the night-time economy as an emerging model in urban and rural industries, which can enhance the service capabilities of urban and rural industrial services, improve the living environment of rural residents, and promote the sustainable development of urban and rural space. In addition, China’s five thousand years of traditional culture is an essential support for developing a characteristic night-time economy. The development of the night-time economy should combine each city’s culture to show the city’s charm. For example, Shanghai proposes an international and fashionable nightlife standard. Beijing uses the light show of the Forbidden City to create the theme of the “Night Capital”. This study can formulate more practical development strategies based on existing deficiencies and local culture through the overall spatial characteristics and matching degrees of the current night-time economy.

3. Research Areas and Methods
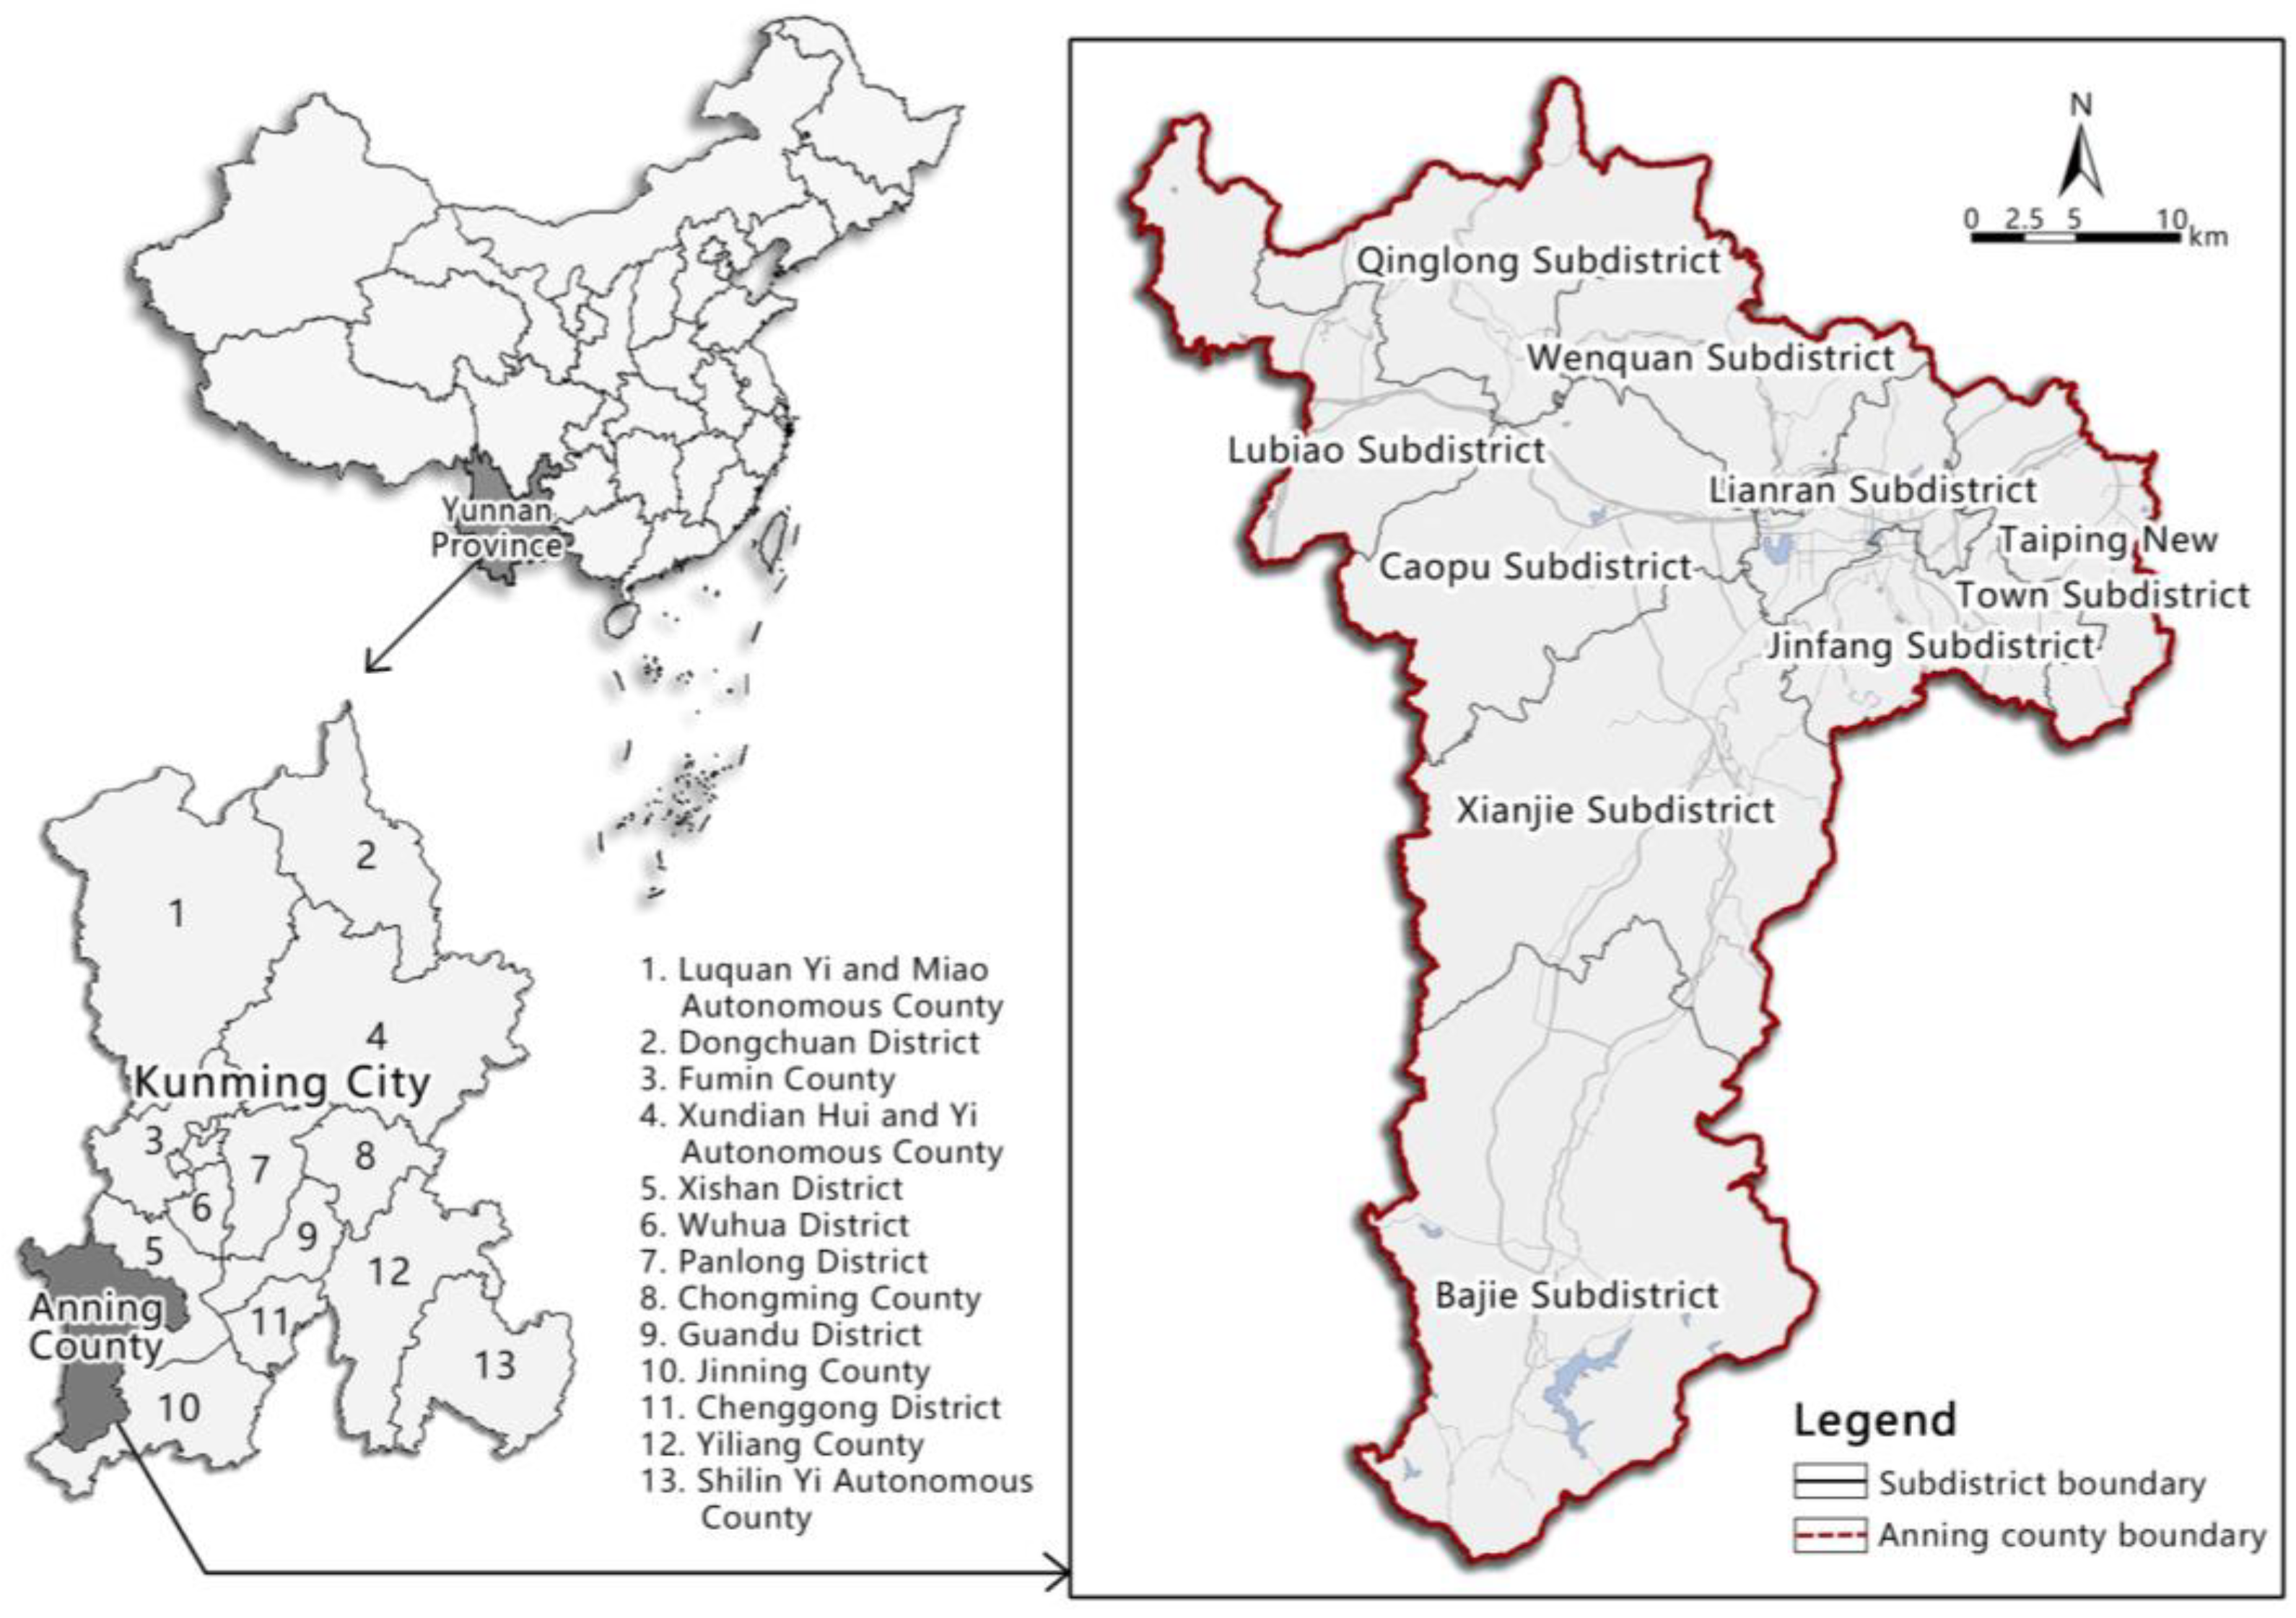
3.1. Research Area

Anning county was chosen as a case study due to its economic standing as the most dynamic and developing area in Southwest China. Anning county, located in the central part of Yunnan province, is an essential county in the southwest of Kunming metropolitan area, 28 km away from the center of Kunming. The research area covers nine subdistricts of Anning county, including the Lianran subdistrict, Jinfang subdistrict, Bajie subdistrict, Xianjie subdistrict, Wenquan subdistrict, Taiping New Town subdistrict, Qinglong subdistrict, Caopu subdistrict, and Lubiao subdistrict (Figure 1). Because of its unique geographical location, Yunnan Province is China’s opening channel to South Asia, Southeast Asia, and the Indian Ocean Rim. It is one of the more developed provinces on the southwestern border of China. With the deepening of China’s “One Belt, One Road” development strategy, the status and role of Yunnan Province in the overall national development have been continuously improved. In 2020, to stimulate consumption potential and meet the needs of the people during COVID-19, Yunnan Province issued the “Guiding Opinions of the General Office of the People’s Government of Yunnan Province on Promoting Economic Development at Night” [52]. In 2021, the province’s retail sales of consumer goods will increase by 9.6% over the previous year, and its consumption structure will continue to improve [53]. Anning is the core county of priority development in the central Yunnan New Area and Kunming metropolitan area. It is also the only county in Yunan Province in the top 100 counties in China. In 2020, the Kunming municipal government issued “Implementation Opinions on Promoting the Development of Night-time Economy in Kunming” [54], providing policy support for the development of the night-time economy in Anning county. Therefore, as a typical county in western China, Anning has high research value and can provide a reference for some other counties.

3.2. Data Acquisition and Processing

It mainly includes three types of data:
(1) POI data. POI is a kind of point data representing urban entities in geographic space, including latitude, longitude, address, name, and category information. Based on relevant research and reports [26], this research summarizes the business types into six categories: catering services, accommodation services, shopping services, sports and leisure services, tourist resorts and scientific, and educational and cultural services, including Anning’s all-night-time-economy industries as much as possible. Using Python software to capture POI data from the Amap Open Platform (https://lbs.amap.com, accessed on 17 December 2021) since December 2021, we then supplement and verify the data according to each subdistrict. The POI data obtained from the Amap belongs to the geographic coordinates of WGS_1984, which is offset from the actual point in Anning county. Therefore, we use the original WGS_1984_UTM_Zone_48N coordinates through “Projection and Transformation” in the data management tool of ArcGIS software. Finally, a total of 3466 POI data that can be processed were obtained (Table 1);
(2) Base map data. The base map of Anning county comes from the Guihuayun website (http://www.guihuayun.com/, accessed on 20 December 2021). The road vector data is downloaded from the OSM (Open Street Map, https://wiki.openstreetmap.org/, accessed on 22 March 2021) platform, and then compared with the actual map to delete abnormal data and obtain the final vector road network data;
(3) Baidu heatmap data. Baidu heatmap has initially been a visualization software for tourists to intuitively provide tourists with the degree of crowding in holiday scenic spots. It provides a new perspective for the macroscopic observation of the population’s spatial and temporal distribution [55], showing the relative situation of the population agglomeration and the distribution of different subdistricts in the county space in real-time. We consider that in urban life, population activity is influenced by daily work, with different night-time leisure hours and activities on weekdays and rest days [56]. The research selected the flow of people from 6:00 p.m. to 6:00 a.m. the next day on weekdays (29 December 2021) and rest days (1 January 2022) under the same climate conditions by Python, updated in real-time every 2 h. The obtained data can be compared to see the flow of crowds at different night-time and calculate the average flow of crowds for the day.

3.3. Research Methods

3.3.1. Data Analysis

In order to analyze the dominant direction and spatial distribution characteristics of night-time economic development in Anning county from the macro level, ArcGIS standard deviation ellipse is used to reveal the distribution characteristics of POI data accurately. The center of the standard deviation ellipse represents the central location of the night-time economy in Anning county. The azimuth angle reflects the distribution direction of the night-time economy in Anning county. The larger the difference between the long and short semi-axes, the more obvious the directionality of the data. Different levels of standard deviation ellipse will produce different display ranges. ArcGIS provides three levels of standard deviation ellipse, the first-level standard deviation ellipse contains about 68% of the data, the second-level standard deviation ellipse contains about 95% of the data, and the third-level standard deviation ellipse contains about 99% of the data. In this study, the distribution of POI data in Anning county reflects the dominant direction of its night-time economy. The amount of data needs to be comprehensive, so we chose the third-level standard deviation ellipse, meaning the research results were reliable.
Kernel density analysis can calculate the distribution density of spatial points and lines to realize the continuous simulation in geographical space. In this paper, each subdistrict is taken as a unit to calculate the kernel density of the point data to represent the subdistrict’s spatial distribution characteristics. So, it can obtain the night-time economic format distribution, comprehensive traffic distribution, and crowd vitality degree in Anning county, providing data support for the space coupling coordination model.

3.3.2. Spatial Coupling Coordination Model

The coupling coordination model is significant for cities in their future development plans [57]. In physics, coupling refers to the phenomenon in which two or more systems or movement forms influence one another through various interactions [34]. At present, the model is mostly used to judge the coupling coordination characteristics between urbanization and the ecological environment [36]. Since the selected indicators are all positive, data should be standardized by the maximum-difference normalization method first [58]. The formula is as follows:
U = X X m i n X m a x X m i n
In the formula, U is the data obtained after normalization. X is the original data. Xmax and Xmin represent the maximum and minimum values corresponding to specific data. The data after normalized are all between 0 and 1, and then the study of spatial coupling and coordination can be carried out. The formula of coupling degree is:
C = [ U 1 × U 2 ( U 1 + U 2 ) 2 ] 1 2
In the formula, U1 and U2 are the two indicators selected for the study, C is the coupling degree, and the value ranges from 0 to 1. C describes the degree of which systems or system elements interact with each other [59]. The coupling coordination degree D measures the coordinated development level between different things, which can avoid errors caused by simply relying on the coupling degree. For example, low night-time economic format distribution and low crowd vitality have a high coupling degree, but it does not mean that they have a good level of coordinated development. The value ranges from 0 to 1. The larger the value, the higher the coordination between the two systems. The formula is as follows:
T = α U 1 + β U 2
D = C × T
In the formula, T is the comprehensive coordination index of the research objects. α and β represent the contribution shares of the two subsystems. According to relevant research, the values of α and β represent the relative importance of the subsystems. Their relative values do not affect the overall trend of the coupling coordination degree in the model [58]. Therefore, this study considers the distribution of night-time economic formats, comprehensive traffic, and night-crowd vitality as subsystems of the county night-time economic system. When the two match, α = β = 0.5, and 1/3 when the three subsystems match [59]. Combined with the actual situation of Anning county, the coupling coordination degree is divided into 5 matching levels by the equal spacing method: (0, 0.20) severe disorder; (0.20, 0.40) mild disorder; (0.40, 0.60) primary coordination; (0.60, 0.80) well coordination; (0.80, 1) quality coordination. Based on the results of spatial matching, the research will propose development strategy suggestions. The technical route is shown in Figure 2.

4. Results and Analysis

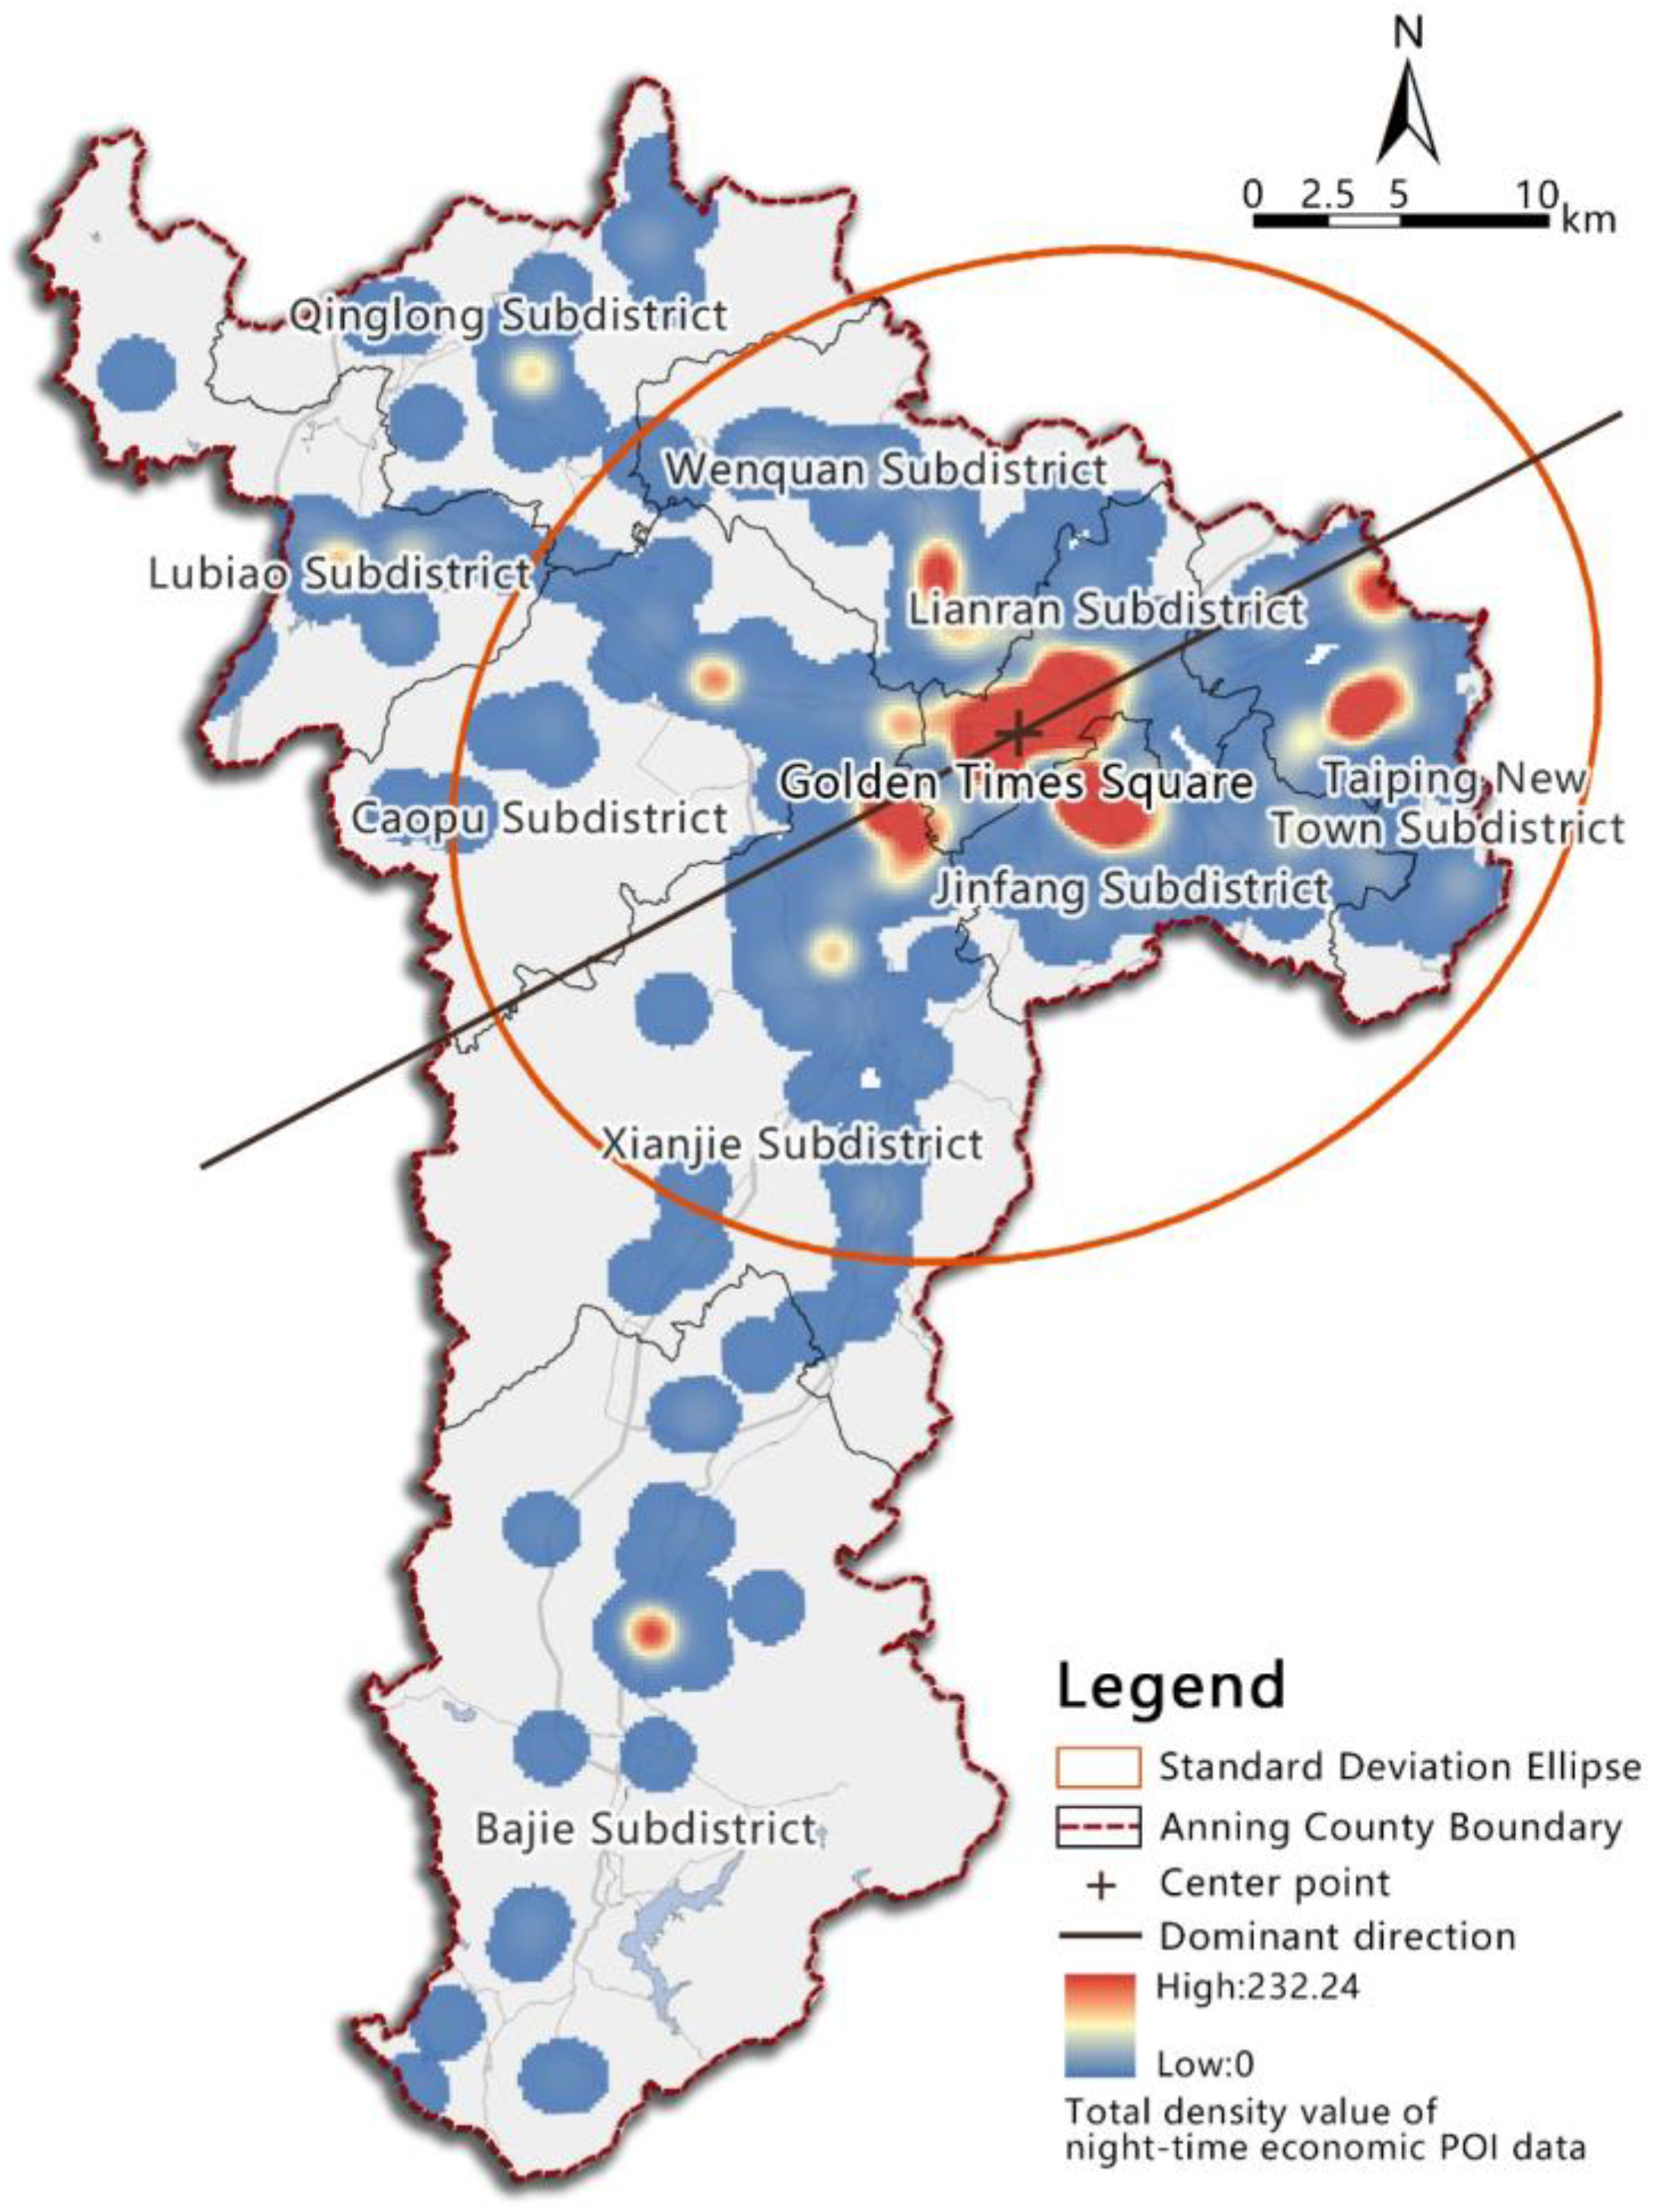
4.1. Spatial Distribution Characteristics of Night-Time Economy in Anning County

As shown in Figure 3, the Golden Times Square is the distribution center of the night-time economy in Anning county (102°28′25″ E, 24°54′49″ N). The standard deviation of the ellipse’s long axis is 18.42 km, and the standard deviation of the short axis is 15.27 km. The distribution direction of the data is obvious. The night-time economy in the northern part of the county develops nicely, and the overall economic formats is in the direction of “northeast to the southwest” in space. However, the centripetal force of the data distribution is insufficient, and the development of the central area of Anning’s night-time economy is relatively scattered.
From the subdistrict level, the night-time economic center of gravity regarding the concentration development in Anning county is Lianran subdistrict. Jinfang and Taiping New Town subdistricts also have a high degree of POI agglomeration, which can connect with the night-time economic development of the main urban area. Wenquan and Xianjie subdistricts are at a more active level of economic development. The analysis results show a trend of integration towards the central area but it is a little disjointed with the development of other areas within the subdistrict scope. Qinglong, Caopu, and Bajie subdistricts are relatively isolated in developing night-time economy spatial patterns in the county due to their locations and distances. They are not strongly associated with the county as a whole. Therefore, it is necessary to tap the potential of Anning county’s night-time economy.

4.2. Temporal and Spatial Distribution of Night-Time Economic Formats in Anning County

As shown in Figure 4, the overall night-time economic pattern of Anning county presents a spatial distribution pattern of “one center, multiple groups”. There are numerous diverse leisure and entertainment places in the main urban area. The night-time economic-service supply level is high, which can better meet the diverse needs of urban residents’ night-time demands. Golden Times Square, Yihuang Shopping Center, and Vocational Education Park are the hotspot areas of night-time economic development in the county. High-density areas gradually decrease and are dispersed from the main urban area to the outskirts of the urban area. Except for Jinfang and Taiping New Town subdistricts, the numbers of night-time economic hotspot areas in other subdistricts are small and concentrated in the center of the subdistricts. The result shows that the development of Anning’s night-time economy has reached a certain level, but the development gap between the subdistricts is large and highly uneven.
From the perspective of business distribution characteristics, the number of catering and shopping services is comparable. The high concentration areas are formed mainly in the Golden Times Square and Yihuang Shopping Center of Lianran subdistrict and the Kungang area of Jinfang subdistrict. Sand Ship Outlets in Taiping New Town subdistrict also have a good development trend. However, the business hours of the commercial complex are between 10:00 and 22:00. Only barbecue shops and convenience stores can cover all the time of the night-time economy. In other subdistricts with a relatively backward development, the night service hours usually end 1–2 h earlier than in the central area. Night tourism activities in Anning county focus on tourist resorts such as Yaocen Tower, Vocational Education Park, cliff carvings, and the Qinglongxia scenic area, mainly involving the Lianran, Wenquan, Qinglong, Jinfang, and Bajie subdistricts, which are relatively scattered. All other attractions except open parks are closed at night. Accommodation services are closely related to commercial complexes and scenic spots, and their spatial distribution characteristics are similar. Sports and leisure services are divided significantly into types of business. Lianran and Jinfang subdistricts are dominated by gyms, cafes, bars, KTVs, and other entertainment places, which are open until the early morning of the next day. Caopu, Lubiao, Qinglong, Bajie, and other subdistricts have an intense atmosphere of rural life, including agritainment, resorts, and fishing grounds. Their location layout is scattered, and business hours do not exceed 22:00. Scientific, educational, and cultural services set up museums, art galleries, exhibition centers, and other large-scale places in the main urban area. The rest of the subdistricts are mainly arranged with community cultural centers and stations.
The above shows that the development of catering and shopping services in Anning county is relatively good. Activities in tourist resorts and supporting facilities such as accommodation services need to be expanded and improved. Sports and leisure services, scientific, educational, and cultural services are uneven between urban and rural areas.

4.3. Temporal and Spatial Distribution of Comprehensive Traffic in Anning County

According to the distribution density of the traffic facilities and the road-network density, we use the kernel density estimation to show the comprehensive traffic distribution in Anning county. Overall, the county presents the spatial distribution characteristics of significant gaps and is unbalanced in the region (Figure 5). In the overall road network layout of the Lianran subdistrict, the road facilities near Golden Times Square are the most perfect, and they meet the development needs of the open blocks. Although the industrial plant in the Kungang area of Jinfang subdistrict has been stopped, the original traffic facilities are sound and have a high road-network density. The core area of road-network density is Sand Ship Outlets in the Taiping New Town subdistrict. The development of the Xianjie subdistrict differs significantly from the north to the south. The Vocational Education Park in the north is connected with the other subdistricts by multiple road networks, which can better integrate into the development of the main urban area of Anning county. In contrast, the south is connected with other subdistricts only by county roads. Affected by the industrial development goals and the natural environments of each subdistrict, Bajie, Wenquan, Qinglong, Caopu, and Lubiao subdistricts are poorly connected and hierarchical, and the spatial distribution marginalizes obviously.
In addition, the residents of Anning county mainly rely on private cars and public transportation to travel at night. The coverage of shared transportation in Anning is low. According to the latest data published by Anning’s bus line website (https://anning.8684.cn/, accessed on 10 January 2022), there are 92 bus lines in four categories: county bus, Taiping bus, Anning–Kunming intercity bus, and rural bus. Sixty-nine bus lines have precise operating hours, as shown in Table 2. Among them, the bus outage time was focused on 20:00; the latest bus in the county is 22:40. The intercity and rural bus lines are few, and the bus outage time is earlier. Anning county does not set a special night-time bus, and night-bus services are seriously lacking.

4.4. Temporal and Spatial Distribution of Night-Crowd Vitality in Anning County

As can be seen from the human traffic data obtained by the Baidu heatmap (Figure 6), the crowd becomes more active, energetic, and concentrated on weekdays from the end of working hours at 18:00. The crowd vitality continues to reach 22:00 at the peak, and the flow of people drops significantly after 22:00, which is in line with the closing time of most night-time economic activity places. The crowd vitality is mainly concentrated during the rest days in the daytime and has more free time. The peak of crowd vitality at night is at 18:00. After 20:00, the crowd vitality drops sharply, and it is the same as the number on the weekdays at 24:00. The results indicated that Anning has a certain degree of vitality and nightlife features, but the economic vitality is challenging to continue after 24:00.
From the perspective of the crowd vitality distribution in each subdistrict (Figure 7), there is a noticeable gap in the crowd vitality in different subdistricts. People in Lianran subdistrict are highly concentrated. They concentrate more on shopping malls and large residential areas during working days. On rest days, the vitality of the crowd in urban parks and scenic spots increases, and the scope of activities is broader. Jinfang and Taiping New Town subdistricts are second, mainly concentrated in the Kungang area and Sand Ship Outlets. Vocational Education Parks and industries mainly drive the crowd vitality of Xianjie, Caopu, and Lubiao subdistricts, and there are high crowd-gathering areas around transportation hubs and schools. In the Bajie, Wenquan, and Qinglong subdistricts, only the scenic spots and farms have more vitality during the rest days, which are greatly affected by holiday time.

4.5. Analysis of Night-Time Economic Space Matching in Anning County

The spatial coupling coordination model was used to explore the deep connection between the night-time economic formats distribution, comprehensive traffic distribution, and night-crowd vitality in Anning county. We calculate different subdistricts’ spatial coupling coordination degrees and divide five spatial matching levels (Table 3).
Figure 8a shows the spatial coupling coordination degree of the night-time economic formats and the comprehensive traffic distribution in Anning county (D1). The spatial coupling coordination degree of the Lianran subdistrict is the best, up to 0.995. Jinfang subdistrict is well-coordinated in spatial matching levels. There is still a gap between the comprehensive transportation system of the Taiping New Town subdistrict and the coupling coordination degree is 0.564. The service of comprehensive traffic constitutes an obstacle to the future development of diversified business formats and the increase in passenger and cargo flow. Caopu and Lubiao subdistricts are affected by the transportation of goods in the industrial park, and the transportation facilities are relatively well-equipped. However, the night-time economic format cannot meet the development needs of the two subdistricts, and they do not have enough features and attractiveness to attract tourists. Although the Wenquan and Xianjie subdistricts have relatively developed night-time economic formats, the road-network density is low, and the traffic accessibility is insufficient. The four subdistricts are in a state of mild disorder. The comprehensive transportation and night-time economic formats of Qinglong and Bajie subdistricts are far less than the development goals of the night-time economy in Anning county, and relevant measures should be taken to advance them.
Figure 8b shows the spatial coupling coordination degree of the night-time economic formats distribution and night-crowd vitality in Anning county (D2). The Lianran subdistrict in the central urban area of Anning county is reaching a high-quality coordination level. The night-crowd vitality of the Jinfang subdistrict is more coordinated with the economic format’s distribution of the night-time economy, and the coupling coordination degree increased to 0.711 because the Kungang factory around the concentration in large residential areas, brings a large flow of people, better promoting economic development. The crowds in the Taiping New Town subdistrict have a high degree of vitality. Large shopping malls in the subdistrict can attract a particular flow of people and have a well-coordinated level. Compared with the comprehensive traffic, the Xianjie subdistrict’s matching level significantly improves, reaching the primary coordination level. The crowd vitality of the Caopu and Wenquan subdistricts is below 0.4, and the night-time industry is not attractive. Lubiao, Qinglong, and Bajie subdistricts are greatly affected by economic level, traffic location, and other factors. Their spatial coupling coordination with the night-time economy is severely disorderly.
Figure 8c shows the degree of interaction and coordinated development among night-time economic format distribution, comprehensive traffic distribution, and night-crowd vitality (D3). The Lianran subdistrict has the highest matching level of the night-time economy, with a coupling coordination degree of 0.995. The matching level of the Jinfang subdistrict is well-coordinated, and the coupling coordination degree is 0.695, which is far from the central urban area. It is necessary to improve the night-time economic format and the comprehensive traffic capacity. Taiping New Town subdistrict is mainly affected by comprehensive traffic, which reduces the spatial coupling coordination degree with the county’s night-time economic format. Its degree is 0.593, which is at the primary coordination level. In the case of the existing crowd vitality at night, the Xianjie subdistrict should focus on improving its comprehensive traffic level, effectively improving the degree of spatial coupling and coordination, and reducing the gap with the Lianran subdistrict. Wenquan, Caopu, and Lubiao subdistricts are in a state of mild disorder. The three subdistricts can take advantage of the county’s industrial characteristics, idyllic scenery, and tourism resources to increase crowd vitality. The comprehensive coupling coordination degree of Qinglong and Bajie subdistricts is less than 0.2, which is a level of severe disorder.

5. The Sustainable Development Strategy of the Night-Time Economy in Anning County

The above analysis indicates that Anning, as a typical suburban county of a metropolis in China, has a low spatial matching degree of the night-time economy as a whole. It is necessary to formulate a sustainable development strategy of the night-time economy in Anning county from the aspects of the national policy background, an integration with the metropolitan area, and improvements to the subdistrict’s matching degree.

5.1. Determining the Night-Time Economic Development Orientation of Anning County from the Perspective of Rural Revitalization and Urban–Rural Integration

The night-time economy of Anning county should meet the development needs of rural revitalization and urban–rural integration to determine the night-time economic development goals of Anning county. Taking culture, health, and tourism as the mainline of the development proposed by the Kunming metropolitan area, we should develop the night-time economy industry with characteristic vitality, integration, convenience, and balance. At the same time, Anning county can establish its cultural brand to attract tourists.
Furthermore, based on the Internet’s innovative office system, we can build a night-time economic management platform and mechanism.With the background of COVID-19, it can improve the county’s public life quality, enhance night-time management and control capabilities, and track the epidemic in real-time. An orderly county night-time economic development environment requires government supervision and management functions. Relevant departments and governments can build a good platform for cooperation between the tourism and product industries [60]. The government, the company, and the villagers have their unique positioning and functions in rural tourism development and can establish a multi-party operation mode of “government + villager collective + company”. The PPP (Public–Private Partnership) model can build a county-level rural night-time economy cooperation platform to promote large- and medium-sized enterprises to invest in the countryside. The government can establish a risk prediction level and an emergency response mechanism in advance to achieve an environmentally friendly, safe, and secure urban night-time management service. In the end, a win–win situation for the county government, the public, and the society will be realized.

5.2. Activating Anning Night-Time Economy Vitality from the Perspective of Metropolitan Integration

Anning county should establish a multi-dimensional and intelligent night-traffic system. Urban development is positively correlated with traffic accessibility and is also affected by the traffic accessibility of adjacent or distant grid cells [61]. At present, Anning county can make full use of the existing traffic location advantage to speed up the development of metropolitan and suburban county traffic. Anning county can focus on improving the traffic connection between each subdistrict and the central county, connecting scenic roads with pedestrian paths and motor vehicle paths to improve road facilities and improve road-network density. Under the night-time economic space pattern, it can improve the transportation function of the county. We also believe that Anning county can set up night-bus lines. The static transportation facilities within the county should also be adjusted appropriately according to the population density and vitality of Anning county. Moreover, we can formulate a more inclusive transportation planning strategy to meet the travel needs of night consumers [62].
In the 5G era, Anning County can establish a unified intelligent transportation management platform to grasp the changes in night-traffic operation, and integrate urban buses, passenger transport systems, taxis, private cars, and shared transportation into the platform for unified management by analyzing APP clicks and social network data, whereby the micro and refined collection of real-time night-time travel data of Anning can control the operation of urban–rural night-time traffic comprehensively. Road lighting and greening systems play a crucial role in ensuring road safety, improving the quality of urban night scenery, and improving the living environment [63]. In addition, residents can put forward suggestions for the night-transportation system of Anning county through intelligent transportation services to realize the sustainable development of the Anning economy [64].

5.3. Promote the Connotation of Anning Night-Time Economy from the Subdistrict Regional Characteristics

With the continuous improvement of the quality of metropolis urbanization in China, the prosperity and development of the night-time economy in the SCCM requires the upgrading of the facilities and services of cultural and entertainment places. First of all, based on fully excavating the county’s cultural characteristics, we can enrich each subdistrict’s business forms and improve the spatial matching degree as much as possible. For example, several subdistricts with a high spatial matching degree are listed as demonstration areas to drive the subdistricts with low spatial matching degrees effectively. We can actively build the core economic gathering area of the Lianran subdistrict at night and promote the night-time-themed business circle of Jinfang and Taiping New Town subdistricts. The south of Anning improves the differentiated competitiveness with agricultural, cultural, and tourism characteristics. It timely organizes cultural tourism festivals and night performances to make up for the county’s shortcomings in night-time economic development. The government can also stimulate the development of the local service industry through measures such as economic subsidies and the issuance of coupons to alleviate the reduced passenger flow due to COVID-19 [65]. Secondly, we propose introducing and cultivating various events to create a night-consumption atmosphere and gradually form a county development pattern of a night-time economy with a reasonable layout, perfect functions, diversified business forms, and standardized management, guiding people of different ages to carry out healthy consumption. Finally, regional development needs to break the limitations of administrative divisions at all levels and promote the free flow of economic factors in Anning county. The government should formulate policies related to the night-time economy and gradually realize the equalization of the night-time economy services in all subdistricts, based on full coverage and sustainability, to effectively form the spatial patterns of coordinated development in counties.

6. Conclusions and Discussion

With the outbreak of COVID-19 in 2020, the growth index of shopping, entertainment, and fitness decreased significantly compared with the previous year, and the catering industry was the most affected by the epidemic [3]. COVID-19 has inspired temporary or permanent behavioral shifts in people’s work, health, travel, shopping, and social interactions, and consumer behavior is also strongly dependent on time and place [66]. The night-time economy expands the time and space of urban residents and consumption. It is becoming a powerful driving force for accelerating consumption and urban economic recovery, making it crucial to restoring economic vitality while the epidemic persists [67].
The night-time economy is an essential part of the modern urban and rural economy. In order to formulate the policies and planning strategies of Anning county scientifically, it is necessary to reveal the basis of night-time economy development and the different characteristics of the spatial matching of all elements first. Taking Anning county of China as an example, this paper quantifies the inter-relationship between economic format distribution, comprehensive traffic distribution, and night-crowd vitality through the spatial matching model of the night-time economy at the county level for the first time. It reveals the development characteristics of the night-time economy in typical counties in China. The main conclusions of the study are as follows:
(1) The night-time economic development of Anning county presents a distribution trend of “northeast to the southwest”, and the direction of data distribution is evident. However, the centripetal force of data distribution is insufficient, and the development of the night-time economic main areas in Anning is relatively scattered. The overall distribution pattern of the night-time economy is “one center, multiple groups”. The Lianran subdistrict is the hotspot area of night-time economic development. High-density areas gradually decrease and are dispersed from the main urban area to the outskirts of the urban area. Among them, catering and shopping services are developing well, sports and leisure services, scientific, educational, and cultural services are uneven between urban and rural areas, and tourist resorts, accommodation services, and the other related night-time-economy-supported services need to be improved;
(2) Anning county has nightlife characteristics. The operation time of night-time public transportation and leisure and entertainment places cannot cover the primary night-time consumption time, which limits the vitality of the crowd to a certain extent, thus affecting the development of the economic spatial patterns of Anning county;
(3) County night-time economic format distribution, comprehensive traffic distribution, and night-crowd vitality have an apparent spatial relationship. The three driving factors have different effects on the night-time economy of the county. The development of the northern part of Anning county is relatively good, while the southern part of the county is lagging. It is necessary to propose a sustainable development strategy according to the spatial characteristics of the county.
This study is based on the broad context of the epidemic, combined with China’s national policies, to formulate sustainable strategies for the night economy from the county level. This research expands the direction and perspective of the county’s night-time economy and provides more systematic analysis methods and strategies for future planning work and government departments. However, future research can also consider the role and impact of the night-time economy from a broader and deeper perspective. As expected by scholars [65], post-pandemic tourism should be more sustainable, and the night-time economy should be based on the SDGs, but is it serving residents or foreign tourists? How do we balance the relationship between residents and tourists? The strategic advancement of the night economy is inseparable from the support of the government, enterprises, and multiple stakeholders. However, the cooperation between them and the effectiveness of their actions have yet to be worked out.
In addition, this study has certain limitations. Firstly, the research scope of this paper focuses on the mesoscale analysis of county subdistricts. However, due to the limitation of POI data, it is impossible to obtain microscopic data, such as the scale and passenger flows of the various formats. It is necessary to further analyze the spatial distribution of the microscopic scale in future research. Secondly, interdisciplinary research is bound to be the focus and hotspot of social and economic space research in China’s county areas. Future research can further use big data to integrate multi-disciplinary ideas to propose more reference research methods. Finally, there are differences in the nightlife experience between eastern and western cities. Affected by factors such as economic development level, region, and cultural background, the current situation and foundation of night-time economy development, as well as the difficulties faced in the future, are all particular. Future research will also focus on better scientifically identifying typical influencing factors or more comprehensively exploring the development characteristics of urban and rural economic spatial patterns.

Author Contributions

Conceptualization, W.W. and L.L.; methodology, W.W.; data collection, Y.Y. and L.L.; data analysis, L.L.; validation, W.W., L.L. and Y.Y.; model, W.W. and L.L.; writing—original draft preparation, W.W., L.L. and Y.Y. All authors have read and agreed to the published version of the manuscript. W.W. is responsible for future questions from readers as the corresponding author.

Funding

This research was funded by The National Natural Science Foundation of China, grant number 51578482.

Institutional Review Board Statement

Not applicable.

Informed Consent Statement

Not applicable.

Data Availability Statement

The data are not publicly available due to privacy. The data presented in this paper are available on request from the corresponding author.

Conflicts of Interest

The authors declare no conflict of interest.

References

  1. Shaw, R. Beyond Night-Time Economy: Affective Atmospheres of the Urban Night. Geoforum 2014, 51, 87–95. [Google Scholar] [CrossRef] [Green Version]
  2. Ashton, K.; Roderick, J.; Williams, L.P.; Green, L. Developing a Framework for Managing the Night-time Economy in Wales: A Health Impact Assessment Approach. Impact Assess. Proj. Apprais. 2018, 36, 81–89. [Google Scholar] [CrossRef] [Green Version]
  3. Lin, V.S.; Qin, Y.; Ying, T.Y.; Shen, S.J.; Lyu, G.M. Night-time Economy Vitality Index: Framework and Evidence. Tour. Econ. 2021, 1, 135481662110429. [Google Scholar] [CrossRef]
  4. Bianchini, F. Night Cultures, Night Economies. Plan. Pract. Res. 1995, 10, 121–126. [Google Scholar] [CrossRef]
  5. Montgomery, J. Cities and the Art of Cultural Planning. Plan. Pract. Res. 1990, 5, 17–24. [Google Scholar] [CrossRef]
  6. London at Night: An Evidence Base for a 24-Hour City. 2018. Available online: https://www.london.gov.uk/business-and-economy-publications/london-night-evidence-base-24-hour-city (accessed on 23 December 2021).
  7. Bromley, R.; Thomas, C.; Millie, A. Exploring Safety Concerns in the Night-Time City: Revitalising the Evening Economy. Town Plan. Rev. 2000, 71, 71–96. [Google Scholar] [CrossRef]
  8. Hobbs, D.; Winlow, S.; Hadfield, P.; Lister, S. Violent Hypocrisy: Governance and the Night-time Economy. Eur. J. Criminol. 2005, 2, 161–183. [Google Scholar] [CrossRef]
  9. Crawford, A.; Flint, J. Urban Safety, Anti-social Behavior and the Night-time Economy. Criminol. Crim. Justice 2009, 9, 403–413. [Google Scholar] [CrossRef] [Green Version]
  10. Su-Jan, Y.; Chye-Kiang, H. An (Extra) Ordinary Night out: Urban Informality, Social Sustainability and the Night-Time Economy. Urban Stud. 2013, 51, 712–726. [Google Scholar] [CrossRef]
  11. Jordi, N.; Emanuele, G.; Adam, E.; Martins, J.; Sequera, J. Tourism, Nightlife and Planning: Challenges and Opportunities for Community Liveability in La Barceloneta. Tour. Geogr. 2018, 20, 377–396. [Google Scholar] [CrossRef]
  12. Deeming, S.; Kypri, K. Costing Alcohol-Related Assault in the Night-time Economy from a Societal Perspective: The Case of Central Sydney. Drug Alcohol Rev. 2021, 40, 779–799. [Google Scholar] [CrossRef] [PubMed]
  13. Miller, P.G.; Coomber, K.; de Andrade, D.; Livingston, M.; Puljević, C.; Vakidis, T.; Carah, N.; Taylor, N.; Burn, M.; Curtis, A.; et al. Queensland Alcohol-Related Violence and Night-time Economy Monitoring (QUANTEM): Rationale and Overview. Drug Alcohol Rev. 2021, 40, 693–697. [Google Scholar] [CrossRef] [PubMed]
  14. Abraham, H.; Scantlebury, D.M.; Zubidat, A.E. The Loss of Ecosystem-Services Emerging from Artificial Light at Night. Chronobiol. Int. 2019, 36, 296–298. [Google Scholar] [CrossRef] [PubMed] [Green Version]
  15. Robert, G.; Nigel, W.; Philip, T. Alcohol and Personal Security in the Built Environment: Student Engagement in the Night-time Economy of Kingston upon Thames, London, UK. Lond. J. 2021, 46, 187–213. [Google Scholar] [CrossRef]
  16. Muhammad, S.H.; Won, D.L.; Mark, E.; Jon, B. The ‘exposed’ Population, Violent Crime in Public Space and the Night-Time Economy in Manchester, UK. Eur. J. Crim. Policy Res. 2021, 27, 335–352. [Google Scholar] [CrossRef]
  17. Chen, X.; Nordhaus, W.D. Using Luminosity Data as A Proxy for Economic Statistics. Proc. Natl. Acad. Sci. USA 2011, 108, 8589–8594. [Google Scholar] [CrossRef] [Green Version]
  18. Henderson, J.V.; Storeygard, A.; Weil, D.N. Measuring Economic Growth from Outer Space. Am. Econ. Rev. 2012, 102, 994–1028. [Google Scholar] [CrossRef] [Green Version]
  19. Zhang, J.; Wang, M.; Wang, H. On the Scale, Format and Consumers of the Night Fair during the Song Dynasty. J. Cap. Norm. Univ. (Soc. Sci. Ed.) 2021, 2, 17–26. [Google Scholar]
  20. Xu, N.; Tian, Q. Theoretical Research and Operation Promotion Path of Night-time Economy. Enterp. Econ. 2021, 40, 95–102. [Google Scholar] [CrossRef]
  21. Shu, T.H.; Ren, Y.T.; Shen, L.Y.; Qian, Y. Study on Spatial Heterogeneity of Consumption Vibrancy and Its Driving Factors in Large City: A Case of Chengdu City. Urban Dev. Stud. 2020, 27, 16–21. [Google Scholar]
  22. Opinions of The General Office of the State Council on Further Stimulating the Potential of Cultural and Tourism Consumption. General Office of the State Council: Beijing, China. Available online: http://www.gov.cn/zhengce/content/2019-08/23/content_5423809.htm (accessed on 23 August 2019).
  23. Opinions on Accelerating the Development of Circulation and Promoting Commercial Consumption. General Office of the State Council: Beijing, China. Available online: http://www.gov.cn/xinwen/2019-08/27/content_5425015.htm (accessed on 27 August 2019).
  24. Why does China Develop Night Economy? Available online: https://m.thepaper.cn/baijiahao_4782907 (accessed on 26 October 2019).
  25. 2019–2022 the Development Trend and Consumption Behavior of The Night Economy Industry Report. Available online: https://www.iimedia.cn/c400/65686.html (accessed on 12 August 2021).
  26. Li, Q.Y.; Chen, L.L. Thoughts on the Consumption of Night Sports Boosting the Development of Night Economy. J. Chengdu Sport Univ. 2021, 47, 103–107. [Google Scholar] [CrossRef]
  27. Xia, H.L.; Zhu, S.H.; Li, Y.X. A Research on the Path of Innovative Development of Night Tourism in Suzhou: Based on Network Text Analysis and Questionnaire Survey. J. Univ. Sci. Technol. Suzhou (Soc. Sci. Ed.) 2021, 38, 24–31, 107. [Google Scholar]
  28. Chen, X.M. Study on Consumption Characteristics and Upgrading Path of Urban Night-Time Food Economy in China. Consum. Econ. 2020, 36, 11–21. [Google Scholar]
  29. Chu, D.P.; Liao, J.W.; Xu, Y. Research on the Evolution Mechanism of Night-time Economic Policies in China. Consum. Econ. 2021, 37, 20–27. [Google Scholar]
  30. Yu, G.X. Research on Special Policies of Night-time Economy: Based on Content Analysis Method. Contemp. Econ. Manag. 2021, 43, 24–30. [Google Scholar] [CrossRef]
  31. Fu, C.W.; Wang, Y.F. Urban Night-time Tourism Consumption Space from the Perspective of Scene: A Study Based on the Cultural Scene of Super Wenheyou in Changsha. Wuhan Univ. J. (Philos. Soc. Sci.) 2021, 74, 58–70. [Google Scholar] [CrossRef]
  32. Wang, H.; Wang, J.L. The Empirical Study on Night Consumption Tendency of Beijing Residents: Based on Iv-logit Regression model. Urban Probl. 2021, 2, 75–83. [Google Scholar] [CrossRef]
  33. Huang, Z.P.; Qiu, Y.Q.; Xia, H.Y. Multi-level Thinking on Urban Night-time Economic Development: Taking Chengdu as An Example. Mod. Bus. 2021, 26, 17–20. [Google Scholar] [CrossRef]
  34. Sun, F.; Zhang, J.H. Matching Urban Leisure Service Level and Vitality in the Night-time: A Case Study of Nanjing. China Anc. City 2021, 35, 18–23. [Google Scholar] [CrossRef]
  35. Geng, N.N.; Shao, X.Y. Research on Coupling Coordination of Ecological Environment-Tourism Industry-Urbanization in the Yellow River Basin. Econ. Probl. 2022, 3, 13–19. [Google Scholar] [CrossRef]
  36. Guo, Y.K.; Bai, Y.S.; Hong, S.M. Spatiotemporal Differentiation Characteristics and Dynamic Factors of Coupled and Coordinated Development of Urbanization and Ecological Environment: A Case Study of Sichuan Province. Urban Probl. 2021, 12, 48–57. [Google Scholar] [CrossRef]
  37. Wang, L.; Zhou, Z.; Zhao, D. Optimizing Urban Spatial Layout and Promoting Night Economic Development—A Case Study of Zhenjiang City. Trade Fair Econ. 2021, 16, 20–22. [Google Scholar] [CrossRef]
  38. Huang, J.K.; Chen, B.; Deng, X.Z.; Fang, D.B.; Huang, H.J.; Li, H.Z.; Li, S.T.; Liu, S.Y.; Wei, H.K.; Zhang, X.B.; et al. Analysis of Research Hotspots in Management of Coordination Development of Economy and Society. J. Manag. Sci. China 2021, 24, 163–170. [Google Scholar] [CrossRef]
  39. Meng, X.F.; Ma, S.; Xiang, W.Y.; Kan, C.C.; Wu, K.; Long, Y. Classification of Shrinking Cities in China Using Baidu Big Data. Acta Geogr. Sin. 2021, 76, 2477–2488. [Google Scholar] [CrossRef]
  40. Xie, Z.M.; Zhen, F.; Zhang, S.Q. Research on Spatial Characteristics and Influencing Factors of Urban Employment Based on Big data. Urban Dev. Stud. 2021, 28, 2, 48–57, 181. [Google Scholar]
  41. Zhang, J.W.; Liang, Y.Q.; Cui, L.Y. Analysis of Economic Agglomeration Characteristics of Beijing-Tianjin-Hebei Urban Cluster Based on NPP-VIIRS Night Light Data. J. Southwest Univ. (Nat. Sci. Ed.) 2021, 43, 95–104. [Google Scholar] [CrossRef]
  42. Liu, H.M. Apply Fringe Identification to Understand Urban Economic Development in China: In Case of Wuhan. Arab. J. Geosci. 2021, 14, 1295. [Google Scholar] [CrossRef]
  43. Wu, W.H.; Ding, Z.H.; Huang, K.; Song, Y.; Dong, H.X. Spatial Distribution of Enterprise Communities and Its Implications Based on POI Data: A Case of Xi’an, China. J. Urban Plan. Dev. 2021, 147, 05021028. [Google Scholar] [CrossRef]
  44. Tong, D.; Zhou, X.C.; Gong, Y.X. Car-sharing Travel Patterns in Shanghai Based on Big Data. Prog. Geogr. 2021, 40, 2035–2047. [Google Scholar] [CrossRef]
  45. Heitor, W.; Nícollas, S.; Matheus, V.; Adriano, C.; Fernando, M.; Leonard, R. Points of Interest Recommendations: Methods, Evaluation and Future Directions. Inf. Syst. 2021, 101, 101789. [Google Scholar] [CrossRef]
  46. Wang, S. Review and Prospect of the Research on Qin County System in the Last 40 years. Trends Recent Res. Hist. China 2021, 5, 16–25. [Google Scholar]
  47. Liu, Y.S.; Zang, Y.Z.; Yang, Y.Y. China’s Rural Revitalization and Development: Theory, Technology and Management. J. Geogr. Sci. 2020, 30, 1923–1942. [Google Scholar] [CrossRef]
  48. Li, J.T.; Liu, Y.S.; Yang, Y.Y.; Jiang, N. County-rural Revitalization Spatial Differences and Model Optimization in Miyun Subdistrict of Beijing-Tianjin-Hebei Region. J. Rural Stud. 2021, 86, 724–734. [Google Scholar] [CrossRef]
  49. 2020 China Night Economic Development Report: Scene Innovation and Digital Reconstruction. Available online: https://mp.weixin.qq.com/s/fOsF4mnNyiHzVq8NcDKBTQ (accessed on 25 October 2020).
  50. Li, Z.L. Research on the Coupling Mechanism and Coordinated Development of Rural Revitalization—Rural Tourism System: A Case Study on Fenghuang County in Hunan. Geogr. Res. 2019, 38, 643–654. [Google Scholar] [CrossRef]
  51. Lu, L.; Ren, Y.S.; Zhu, D.C.; Cheng, J.M.; Yang, X.Z.; Yang, Z.; Yao, J.M. The Research Framework and Prospect of Rural Revitalization Led by Rural Tourism. Geogr. Res. 2019, 38, 102–118. [Google Scholar] [CrossRef]
  52. Guiding Opinions of the General Office of the People’s Government of Yunnan Province on Promoting the Development at Night. Yunnan Provincial People’s Government: Yunnan, China. Available online: http://yn.gov.cn/zwgk/zfgb/2020/2020d10q/szfbgtwj/202004/t20200423_202968.html (accessed on 23 April 2020).
  53. Yunnan’s Economic Operation in 2021. Yunnan Provincial Bureau of Statistics: Yunnan, China. Available online: http://stats.yn.gov.cn/xxgk/gkml/zmfd/zm1/202201/t20220127_1073051.html (accessed on 23 April 2020).
  54. Implementation Opinions on Promoting Night Economic Development in Kunming. Kunming Municipal Bureau of Commerce: Kunming, China. Available online: http://swj.km.gov.cn/c/2020-08-15/3631414.shtml (accessed on 15 August 2020).
  55. Wang, L.C. Spatial-temporal Characteristics of Urban Population Aggregation Based on Baidu Heat Map in Central Areas of Wuhan City. J. Hum. Settl. West China 2018, 33, 52–56. [Google Scholar] [CrossRef]
  56. Ding, L.; Zhao, W.; Huang, Y.; Cheng, S.; Liu, C. Research on the Coupling Coordination Relationship between Urbanization and the Air Environment: A Case Study of the Area of Wuhan. Atmosphere 2015, 6, 1539–1558. [Google Scholar] [CrossRef] [Green Version]
  57. Zhang, K.; Shen, J.; He, R.; Fan, B.H.; Han, H. Dynamic Analysis of the Coupling Coordination Relationship between Urbanization and Water Resource Security and Its Obstacle Factor. Int. J. Environ. Res. Public Health 2019, 16, 4765. [Google Scholar] [CrossRef] [Green Version]
  58. Liu, W.J.; Jiao, F.C.; Ren, L.J.; Xu, X.G.; Wang, J.C.; Wang, X. Coupling Coordination Relationship between Urbanization and Atmospheric Environment Security in Jinan City. J. Clean. Prod. 2018, 204, 1–11. [Google Scholar] [CrossRef]
  59. Wu, Z.Q.; Ye, Z.N. Research on Urban Spatial Structure Based on Baidu Heat Map: A Case Study on the Central City of Shanghai. City Plan. Rev. 2016, 40, 33–40. [Google Scholar] [CrossRef]
  60. Liu, P.L. The Theory and Practice Exploration of “Remembering Nostalgia” in the Construction of New Urbanization. Geogr. Res. 2015, 34, 1205–1212. [Google Scholar] [CrossRef]
  61. Ge, F.J.; Chen, W.X.; Zeng, Y.Y.; Li, J.F. The Nexus between Urbanization and Traffic Accessibility in the Middle Reaches of the Yangtze River Urban Agglomerations, China. Int. J. Environ. Res. Public Health 2021, 18, 3828. [Google Scholar] [CrossRef] [PubMed]
  62. McArthur, J.; Robin, E.; Smeds, E. Socio-spatial and Temporal Dimensions of Transport Equity for London’s Night Time Economy. Transp. Res. Part A Policy Pract. 2019, 121, 433–443. [Google Scholar] [CrossRef] [Green Version]
  63. Wang, X.D.; Xu, J.; Xu, H.; Sha, L.; Wang, X.R. Discussion of the Interactive Influence between the Night Lighting and Road Trees on Urban Roads. Chin. Landsc. Archit. 2019, 35, 120–133. [Google Scholar] [CrossRef]
  64. Zhang, J.; Li, S.Y.; Wang, Y.C. Shaping a Smart Transportation System for Sustainable Value Co-Creation. Inf. Syst. Front. 2021, 1–16. [Google Scholar] [CrossRef]
  65. Kowalczyk-Anioł, J.; Grochowicz, M.; Pawlusiński, R. All Change: How a Tourism City Responds to COVID-19: A CEE Perspective (Kraków Case Study). Sustainability 2021, 13, 7914. [Google Scholar] [CrossRef]
  66. Puttaiah, M.H.; Raverkar, A.; Avramakis, E. All Change: How COVID-19 Is Transforming Consumer Behaviour. Swiss Re Institute. 2020. Chapter 2. Available online: https://www.swissre.com/institute/research/topics-and-risk-dialogues/health-and-longevity/covid-19-and-consumer-behaviour.html (accessed on 10 December 2020).
  67. Da Silva Lopes, H.; Remoaldo, P.C.; Ribeiro, V.; Martín-Vide, J. Effects of the COVID-19 Pandemic on Tourist Risk Perceptions—The Case Study of Porto. Sustainability 2021, 13, 6399. [Google Scholar] [CrossRef]
Figure 1. Research area.
Sustainability 14 04891 g001
Figure 2. Technical route.
Sustainability 14 04891 g002
Figure 3. Overall spatial pattern distribution characteristics of the night-time economy in Anning county.
Sustainability 14 04891 g003
Figure 4. Spatial distribution of different business types of night-time economy in Anning county. (a) Catering services, (b) Accommodation services, (c) Shopping services, (d) Sports, leisure services, (e) Tourist services, (f) Scientific, educational, cultural services.
Sustainability 14 04891 g004
Figure 5. Analysis of traffic facilities and road network density in Anning County. (a) Kernel density estimation of traffic facilities, (b) Kernel density estimation of road network.
Sustainability 14 04891 g005
Figure 6. Crowd vitality statistics of each subdistrict in Anning county on weekdays and rest days. (a) Weekdays, (b) Rest days.
Sustainability 14 04891 g006
Figure 7. The distribution map of the average crowd vitality on weekdays and rest days in Anning County. (a) Average heatmap for weekdays, (b) Average heatmap for rest days.
Sustainability 14 04891 g007
Figure 8. Spatial matching map of comprehensive traffic, crowd vitality, and night-time economic format distribution in Anning county. (a) Night-time economic format distribution matches comprehensive traffic distribution, (b) Night-time economic format distribution matches night-crowd vitality, (c) Spatial coupling coordination of the three.
Sustainability 14 04891 g008
Table 1. POI data types and their contents.
Type of DataData ContentAmount
Catering ServicesRestaurants, snack bars, agritainment, etc.887
Accommodation ServicesHotels, inns, homestays, etc.476
Shopping servicesCommercial complexes, supermarkets, convenience stores, agricultural markets, etc.877
Sports, leisure servicesStadium, entertainment venues, theaters, leisure resorts, etc.540
Tourist resortsAttractions, parks, etc.104
Scientific, educational, cultural servicesSchools, museums, exhibition halls, libraries, cultural centers, etc.582
Table 2. Statistical table of last departure time of main bus lines in Anning county.
Operating RangeBefore 18:0018:00–20:0020:00–22:00After 22:00
County bus1120114
Taiping bus153/
Anning to Kunming Intercity Bus271/
Rural bus31//
Proportion of total bus routes24.64%47.83%21.74%5.8%
Table 3. The spatial coupling coordination degree and matching level of different subdistricts.
Name of SubdistrictD1D2D3Comprehensive Matching LevelCoupling Coordination Degree
Bajie Subdistrict0.1240.1240.1151Severely disorder
Caopu Subdistrict0.2420.3160.3262Mild disorder
Jinfang Subdistrict0.6640.7110.6954Well coordination
Lianran Subdistrict0.9950.9950.9955Quality coordination
Lubiao Subdistrict0.2090.1820.2272Mild disorder
Qinglong Subdistrict0.1260.1010.1181Severely disorder
Taiping New Town Subdistrict0.5640.6090.5933Primary coordination
Wenquan Subdistrict0.3470.2810.3082Mild disorder
Xianjie Subdistrict0.3110.5630.4013Mild disorder
Publisher’s Note: MDPI stays neutral with regard to jurisdictional claims in published maps and institutional affiliations.

