Abstract
China’s logging ban policy has profoundly transformed the forestry industry, creating substantial impacts for forestry-worker households. Empirical evidence is needed to examine whether and how severe the transition policy produces vulnerability and relative poverty for the affected households. This paper samples forestry-worker households from the Greater Khingan Mountains state-owned forest region as the study subjects to evaluate their household vulnerabilities with the LVI approach proposed by IPCC. This study computes the relative poverty scores of the families and further identifies the relationships between the selected household’s socio-economic factors and the estimated vulnerability and poverty scores with OLS regression. This study derives a sleuth of valuable points. (1) The majority of the forestry-worker households have had to suffer downsized, vulnerable livelihoods with escalated relative poverty due to the policy’s impact. (2) Poverty closely connects with vulnerability, where the more impoverished the household, the more vulnerable it is. Poverty is, however, not the only factor affecting household vulnerability. Other factors, particularly of public and social-financial factors, are interconnected with poverty and, thus, compound the vulnerability issue. (3) Factors, e.g., family size, age and gender of household head, bank deposits, and life and job satisfaction, which are typically very beneficial for improving family vulnerability and poverty. (4) Regular financial assistance programs, particularly the commonly-trusted one-off household compensation program, might not provide solid support for addressing long-term household vulnerability and poverty. This study contributes to a broader understanding of household vulnerability and relative poverty for improved policy and program development addressing forestry workers and household vulnerabilities.
1. Introduction
The Greater Khingan Mountains state-owned region is located in the far northeastern area of China, sharing a 786 km border with Russia along the Heilongjiang River. It spans an area of 83,000 square kilometers, nourishing 7,033,900 hectares of forests, endowed with a total 585 million cubic meters of trees, 1.53 million hectares of wetlands, and eight national nature reserves. The region serves as critical ecological reserves and carbon sinks for the country, affording a total ecosystem-service value of CNY 449.8 billion every year [1,2]. In previous decades, the region, as an essential resource base, contributed substantially to the country’s economic development. However, as the quantity and quality of the forest’s resources in the region continue to decline due to non-stop exploitation, its forest resources have moved near to a critical verge of exhaustion [3,4], which inevitably hampers the economic development of the forest regions and the livelihoods of forestry households [5,6]. Starting from the 1990s, China has increasingly paid more attention to ecological protection and the development of forestry socio-economics and management, initiating a series of forestry reforms through pilot policy-making [7,8,9]. Starting from 2014, the pilot policy has switched to completely ban natural forest logging in the Heilongjiang state-owned forest region and the Greater Khingan Mountains state-owned forest region [10,11,12]. In particular, the ‘Guidance Principles for Reforming the State-owned Forest Regions’ advocated by the State Council in 2015 pushed out a new round of reforms, with a noticeable concern for forestry-worker families’ livelihoods [13,14,15,16]. These forestry-reforming policies and ecological engineering programs arguably compound the vulnerability and poverty of forestry-worker families [17,18].
Current studies on the employment-related issues of forestry workers have evolved with the progress of the forestry reforms and forestry economic transformation, stressing the investigation of the income of forestry workers and forest social welfare [19,20]. However, few are concerned with the vulnerability and poverty of forestry-worker households. This paper applies the vulnerability concept and relative poverty to quantitatively evaluate the impact on forestry-worker households caused by forestry reform [21,22,23,24]. The vulnerability of forestry-worker households closely pertains to the ability of the workers and families to deal with immediate and/or long-term external pressures, shocks, and risks. It delineates the degree to which the household is inadequate, insecure, and vulnerable when adapting to the impacts superimposed by the external social-economic and environmental changes in the transition. Poverty mirrors economic hardship and/or spiritual embarrassment, a phenomenon involving social, material, and spiritual poverty [25,26,27,28]. For the measurability purpose, most studies on the poverty of forestry households mainly concentrate on the material/economic dimension.
Many paradigms are available for measuring household vulnerability, with different methodologies to investigate the interactions between humans and their environments from coupled biophysical and social aspects [29]. These approaches are typical of historical narrative, comparative analysis, statistical analysis, indicator-based assessment, and agent-based modeling [30,31]. Regarding relative poverty measurement [32,33,34,35], two leading indicators predicate the measurement of relative poverty. One is the proportion of social wealth owned by the lowest income 20% (or 10%) and the highest income 20% (or 10%); the second is the Gini coefficient, which reflects the income gap status and class disparity among distinct social groups [25,26,27,28]. This paper adopts the sustainable livelihood vulnerability assessment designated by the IPCC to estimate household vulnerability and draws on the concept of relative poverty to measure the poverty of forestry-worker families. This paper works to answer: (1) What is the status quo of the vulnerability and relative poverty of the forestry-worker families in the study area? In addition to how are the two measurements associated with one another, with any meaningful variation? (2) What are underlying factors related to households and forestry workers that influence the degrees of household vulnerability and relative poverty? (3) Are the current governmental, social, and financial assistance programs working well to reduce the vulnerability and relative poverty of the forestry-worker families in transition? (4) What additional services and supports are required to reduce the households’ vulnerability and relative poverty?
Traditionally, most existing studies on vulnerability in China mainly focus on agriculture and urban areas, and few on forest areas, especially the key state-owned forest areas. Therefore, this study brings in new perspectives to supplement the existing literature. Methodologically, this study incorporates an exposure–sensitivity–adaptability framework and applies it in the household economic analysis to assess the overall household vulnerability. Also, this study integrates the effects of the individual’s psychological and emotional perceptions, such as life and job satisfaction, in the factor-influencing mechanism analysis, helping deliver a finer image with multiple dimensions for vulnerability features.
Albeit technically framed within the context of current Chinese forestry policies, this study aims to deliver a broader understanding and implication of household vulnerability and relative poverty for improved policy and program development. The experience and lesson uncovered by this study can potentially benefit the global perception of household vulnerability and poverty linked with the ecological transition. This may be particularly beneficial for developing countries, e.g., in Africa and South America, endowed with abundant forest resources, but suffering disruptive forest losses, to reinforce resource protection action. Furthermore, this study wishes to advocate for a more evident awareness of the benefit and costs pertaining to forestry policy transition.
2. Literature Review
2.1. Vulnerability
The academic world has conducted studies on vulnerability for quite a long time. In the early 1970s, White, G. F. introduced the concept of vulnerability in his book Natural Hazards [36]. His pioneering work stirred up the enthusiasm of other scholars to apply the notion of vulnerability to various disciplines, enlisting “the vulnerability or resilience of natural-social systems in special regions” as one of the seven core nuclear-science sustainability issues [37,38]. Later research expanded to integrate natural and socio-economic systems [39]. Nevertheless, alongside the broadened research on vulnerability, precisely defining and reconciling the concept of vulnerability has become a salient problem [40]. Consequently, most scholars chose to define vulnerability from their domain’s perspective [41,42,43]. For instance, climate change scientists articulate the vulnerability of climate change, defining it as the degree to which geographic, biological, and socio-economic systems respond to climate change [44]. Eco-environmental vulnerability was otherwise treated as a comprehensive indicator to measure the stability of the eco-environmental system with or without external interference [45]. Besides, the notion of vulnerability also changes with the analysis unit. When taking the household as the analysis entity, vulnerability starts to concern itself with the degree to which the household may have to suffer unexpected, uncertain impacts at present and/or in the future due to its very exposure to external environmental risks [46,47]. On the other hand, coping ability can broadly impact the vulnerabilities of households and regions. It largely determines the ability of a region or household to cope with the risks through the assistance of social systems. Furthermore, one can use the vulnerability–resilience evaluation index framework to evaluate national and regional vulnerabilities at varying scales [48,49,50].
2.2. Poverty
Poverty is a single-dimensional measurement, typically pointing to the subject being economically impoverished. Poverty is also commonly believed to be a critical factor affecting the degree of vulnerability. Whether or not an individual or household sits in poverty is generally determined by the minimum income or consumption level of the individual or household demanding basic survival [51,52]. Early studies can be dated to Booth’s investigations (1896) on poverty perception. Many scholars and institutions, later on, deepened the understanding of poverty from different perspectives, leading to variable definitions with regards to poverty [53]. In 1990, the World Bank (2015; 2018) defined poverty as a “lack of ability to meet the minimum standard of living” in its development reports [30,31,54,55]. As a result, poverty causes the lack of life-sustaining necessities and services due to insufficient financial resources and developmental opportunities [56]. Also, many studies distinguish the poor populations in terms of such factors like people’s natural living environment, economic status, physical health, and social culture in bondage. The evolving nuances of the definitions transpire the nature of poverty not only as simply a purely economic problem regarding essential living necessities, but as a consequence of a multidimensional socio-economic problem deeply associated with economic, social, and cultural factors [57], thus, thereby a determinant of the household-vulnerability problem.
2.3. Life and Job Satisfaction
Life satisfaction is a cognitive judgment process of human beings [57]. It is considered an overall assessment of the quality of life perceived by the individual based on his choice criteria [58]. Assessment of life satisfaction can mainly be divided into two scenarios: the first is related to life satisfaction perception in a specific field, and the second is the overall life-satisfaction assessment. The former typically takes place in scenes that can at large influence individuals, such as specific judgments on the individuals from families, schools, companies, etc. [59,60]. The overall evaluation of life satisfaction is an accumulative effect upon the perceptions of the first category of scene-specific judgments [61,62]. Both evaluations are subjective, which, through interplay with the individual’s emotional experience, shall impact his life pursuit and behavioral motivation. Existing studies accredit the role of family-life satisfaction in improving the individual’s life experience and physical and mental health. The studies also discern the factors that act upon life satisfaction, including individual life and work environment, family income, marital status [63], and other demographic variables [64]; and individual values, achievement motivation, cognitive orientation, personality traits, and so on [61,62].
Job satisfaction has long been an essential theme of non-stop research in the field of organizational behavior. It is a critical component for overall life satisfaction and particularly a core concern for commercial enterprises [65]. Generally speaking, job satisfaction relates to a subjective experience and adjudgment that the job environment can superimpose onto the individual hired. Job satisfaction reflects the degree to which employees are physically and psychologically satisfied with their work experience [66]. Many factors, such as work environment, salary, working hours, nature of work, relationships between colleagues, superiors, and subordinates, in effect determine job satisfaction [67]. Besides, job satisfaction can predict positive behaviors in the workplace [68]. For instance, it can promote the employee’s voice [69] and his self-reinforced organizational behavior [70]. Higher job satisfaction can encourage employees to dedicate themselves, with proactive work [71], be more actively involved in work time, and achieve higher creativity [72]. On the contrary, when employees have low job satisfaction, they may lack enthusiasm for work and even treat work negatively, e.g., committing absenteeism, avoidance of work, and reluctance to engage in creative activities [73,74,75].
3. Data and Methods
3.1. Data Source and Description
The data were gleaned from a summer survey project by the Northeast Forestry University conducted in 2018. The project adopted random sampling for questionnaire dispatch to assure unbiased estimation on the current employment situation of forestry workers. The indicators devised in the questionnaire were decomposed into two parts. The first part summarized the basic characteristics of forestry-worker families. This part of the measurements came from the survey of forestry-worker families by the State Forestry Administration. The other part measured the forestry workers’ life satisfaction and job satisfaction, which stemmed from the adopted Minnesota Satisfaction Questionnaire (MSQ). The MSQ is again dichotomous in a long-form scale (containing 21 subscales) and a short-form scale (containing 3 subscales). The three subscales in the short form were internal satisfaction, external satisfaction, and general satisfaction. The long-form scale otherwise consisted in total of 120 items that measured staff satisfaction and general satisfaction with 20 job-related dimensions. We determined two life satisfaction indictors and 18 job satisfaction indicators in the end through the approach. Besides, to improve the questionnaire’s validity, we gleaned extra useful information, combined with the variables featuring forestry workers, such as age groupings and education levels. Considering all merits, we selected the Minnesota Short Scale as the questionnaire design template and one-to-one interviews for filling out the questionnaire.
The survey pool consisted of 14 forestry bureaus. We selected 30 workers from each forestry bureau, 20 of which were selected on-site from forest farms. A total of 400 questionnaires were handed out, with 100% collected back. After the quality check, 359 questionnaires were validated, accounting for 89.75% of the answers. The questionnaire recorded essential information for household-related demographic and financial features. We also superimposed indicators gauging the overall life and work satisfaction of forestry workers. Life and work satisfaction was decomposed into four sub-measurements: life satisfaction; work condition and comfortability; work reward and self-accomplishment; enterprise culture and working atmosphere.
The basic data of family characteristics in China’s Greater Khingan Mountains State-owned Forest Region are shown in Table 1.

Table 1.
Explanatory variables of forestry-worker families’ characteristics.
The statistics given in Table 1 unveil that the majority of households held three family members, accounting for 67.41% of the sample; 315 household heads were male, accounting for 87.74%; the age of household head mainly ranged from 41 to 50 years of age, accounting for 56.27%. The educational levels of household heads cluster in the category higher than 13 academic years, accounting for 42.90% of the sample, followed by 10 to 12 years with 32.31%. The households maintaining fair health status were 161, with a proportion of merely 44.85% in the sample, followed by good health status, accounting for 32.59%. The proportion with a marital status was 88.30% and above. The majority of household heads were on the register and with the duty of the work status, accounting for 82.45%. Of all household heads, 343 were not in the one-off resettlement program, accounting for over 95.54%. The number of insurance funds for the household head mainly clustered around six, which exceeded more than half of the sample, accounting for 66.30%. The bank deposit among forestry households was mainly less than or equal to CNY 10,000, accounting for 66.29%. The majority of households either have no loan or have loans less than CNY 10,000, accounting for 89.69% of the sample. The majority of households either have no debts or have debts less than or equal to CNY 10,000, accounting for 91.09% of the sample. The life attitude scores of household heads mainly centered between five and ten, accounting for 85.24%. The worker households’ work condition and comfortability scores sat chiefly in the range of 21 to 30, accounting for 77.16% with 277 households; The scores for the work reward and self-accomplishment mainly ranged from 21 to 30, accounting for 83.57% with 300 households. The enterprise culture and working atmosphere scores were mainly between 21 and 30, accounting for 76.04%. The statistics show that the majority of the worker households resided in the forest area.
3.2. Identifying Household Vulnerability Indicators
The household vulnerability investigated in this study originated from the effects of the forestry policies implemented, especially the nationwide logging ban initiated in 2015. The policies have inevitably transformed the business of forest areas and produced vulnerability for the forestry workers in the Greater Khingan Mountains state-owned forest region for their daily livelihoods. This article introduces the vulnerability concept in assessing the affected livelihoods of the forestry-worker households in the studied forest region. Existing literature on household vulnerability assessment uses household assets and incomes as indicators to measure adaptive ability [38,39,40,60] and takes on food, water, and livelihood strategies as indicators to gauge exposure and sensitivity [41,42,43,44,46]. This study adopted an exposure–sensitivity–adaptability conceptual framework to assess household vulnerability, with a dedicated indicator system for the forestry-worker households. The conceptual framework designated adaptability as the household’s ability to withstand and survive through shocks, in which the forestry household income plays a critical role in shock adaptation. Exposure and sensitivity are distinguishable via identifying the nature of the types of consumed goods and services. Sensitivity indicators manifested mainly in expenditures with large demand elasticity. As exogenous shocks impacted households, the corresponding adjustment of consumer expenditures mirrored the insecurity and sensitivity of the household to the shocks. The exposure index was measurable upon the less-elastic, essential expenditures for household livelihoods. When the external shocks advent, the essential living expenditure was the least likely impacted in the shares of consumptive expenditures. That is, subjects had to spend to meet the essential living needs of the household. This approach conceptually validated the exposure–sensitivity–adaptability diagram for vulnerability assessment, and constructed a convenient assessment framework using cross-sectional household economic data. Nevertheless, for identifying vulnerability change in the long run, it needs to incorporate real consumption elasticity measurements in the indicator system to more precisely represent the variation of household vulnerability. Variable classification and description for household vulnerability indicators are shown in Table 2.
Table 2.
Descriptive statistics of household vulnerability indicators.
In Table 2, the indicators’ maximum values differ, with their minimum values staying mostly at zero. The indicators’ median values detail the distributions of the measurements, and the zeroed median values indicate that at least half of the indicator readings were zero, inferring that the distributions of these indicators were skewed away from the normal distribution.
3.3. Determining Household Vulnerability Indicator Weights
The study used the entropy weighting method to evaluate the indexes according to the volumes of information in their transmission. Specifically, the entropy approach weighted the composite index of characteristic incomes and expenditures to reflect the degree of adaptability. The adjusted expenditure indicators became more robust, which can reflect long-term, post-impact changes. In order to eliminate the influence of different units between each index in the process of using the entropy weight method thereafter, the min–max normalization method was used to process the data. Suppose k indicators of X1, X2,…, Xk are given, where Xi = {x1, x2,…, xk}. It is assumed that the normalized value of each index is Y1, Y2,…, Yk. Then Yli is the standardized score of the i-th indicator in the l-th year [76,77], and the formula is shown in Formula (1):
The entropy weight method determined the objective weight according to the variability of the index. If the information entropy Ej of an index was smaller, the index value had a greater degree of variation; the more information it provided, the greater its role in the comprehensive evaluation, and the greater its weight [78,79]. The entropy weight method was used to calculate the weight of each evaluation index. In the model, the entropy of the j-th indicator was set as Ej, and the Ej calculation formula was as follows:
In the formula, , if , then define . According to the calculation formula of information entropy, the information entropy of each indicator was calculated as E1, E2, …, Ek, which determined the weights of the indicators in terms of the weighting formula as follows:
We then fed the normalized household vulnerability indicator readings as shown in Table 2 into Formulas (2) and (3); the calculated household vulnerability indicator weights are shown in Table 3.
Table 3.
Estimated household-vulnerability indicator weights.
3.4. Method for Evaluating Household Vulnerability
In terms of the characteristics of the survey data, this paper chose the approach of the sustainable livelihood vulnerability assessment defined by the IPCC to measure the household vulnerability of forestry workers in state-owned forest regions [51,52,53,54,55,56]. The specific formula is as follows:
In which, LVI evaluates the vulnerability of a forestry-worker household in the Greater Khingan Mountains state-owned forest region. EI represents the livelihood exposure of the forestry-worker household; SI represents the livelihood sensitivity of the household; AI represents the livelihood adaptability of the household; Wej, Wsj, and Waj act as exposure, sensitivity, and adaptability index weights; Yej, Ysj, and Yaj are standardized exposure, sensitivity, and adaptability indicators. The greater exposure and sensitivity index, the weaker the ability to adapt, and vice versa. The study normalizes the vulnerability score from −1 (least vulnerable) to 1 (most vulnerable).
3.5. Method for Estimating Relative Poverty
The criterion measuring absolute poverty is arguably relevant to the proportion of the resident’s median income [59]. However, different countries adopt somewhat variable thresholds. Some countries take 40% below the median as the poverty line, whereas others use 60% of the median. European countries mostly adopt a higher poverty-line standard (60%), below which individuals are considered poor [59]. This paper instead chooses relative poverty to measure the poverty level of families in the investigated forest region. For making the forestry household comparable to the average resident household across the nation, the study decided to take 60% of the median income of Chinese urban residents in 2018 as the poverty threshold to compute the household relative poverty score.
In Formula (6), the relative poverty RP is computed as a difference from the relative poverty line; represents the income of a forestry-worker household; MI represents the median income of Chinese urban residents in 2018. Then, we used Formula (1) to normalize RP. The relative poverty score was then normalized into the range of −1 (relatively most impoverished) to 1 (relatively least impoverished). The higher the normalized score, the lower relative poverty.
4. Results
4.1. Results of Measured Household Vulnerability and Relative Poverty
Table 4 summarizes the sub-regional distributions of the calculated household vulnerability and relative poverty scores in the study area. According to our measurement grouping, a higher vulnerability score towards the maximum value of one implies higher fragility of the household. The zeroed benchmark line delineates the households roughly into two groups. The subgroup with negative vulnerability scores was comparatively less vulnerable than its counterpart with positive scores. We used the zeroed relative poverty baseline to distinguish the distribution of relative poverty of forestry households. Unlike the vulnerability measurement, a higher value of relative poverty purposefully indicates the household to be comparatively wealthier, representing those less impoverished in an absolute sense. Upon the case statistics, the part of the forestry household vulnerability scores above zero accounted for 99.44%, with a pool of 356 households. Again, 357 households’ relative poverty scores were less than zero, accounting for 99.71% of the total sample. Such a cross-verified coincidence implied that a predominant majority of the forestry households have invariably suffered from a remarkably vulnerable and poverty-stricken situation. The relationship between the vulnerability and relative poverty levels of forest-worker households using the benchmark data of the year 2018 was plotted in Figure 1. It demonstrated that the measured vulnerability and relative poverty scores for the studied households were numerically reversely correlated. It, by turn, underpinned that the degrees of household vulnerability and relative poverty were positively closely associated with each other in general, but variations remained for the individual households with varying demographic and financial features.
Table 4.
Sub-regional distributions of household vulnerability and relative poverty (V = vulnerability; p = poverty).
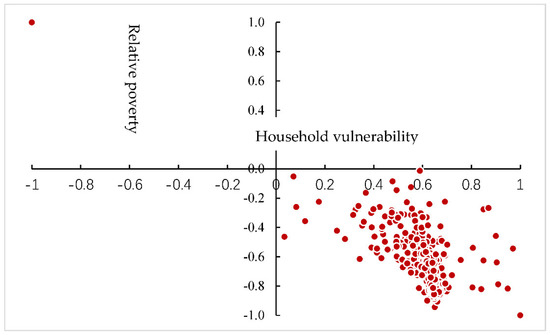
Figure 1.
Relationship between household vulnerability and relative poverty.
Note: household vulnerability scores range from −1 (least vulnerable) to 1 (most vulnerable); relative poverty scores vary from −1 (relatively most impoverished) to 1 (relatively least impoverished).
Figure 1 manifests the pattern of where the forestry-worker households clustered in the vulnerability–poverty map, i.e., in the lower-right quadrant. It disclosed that almost the entire body of lay forestry-worker households had universally fallen to suffer vulnerable and impoverished livelihoods in the transition period. Actually, the policy-imposed forestry transition led to tremendous changes in forestry industries, including the tertiary forestry services. Impacted by the sudden job and enterprise changes, it was highly challenging for the forestry workers to timely adapt to the new transformation. As a result, almost every forestry household has had to suffer from a vulnerable livelihood with decreased family income. The household vulnerability hereby moves in concert with the increased relative poverty of the forestry-worker families. Such a classic representation of the relationship between vulnerability and poverty also implicitly demonstrates the plausibility of the vulnerability assessment framework constituted previously.
4.2. Diagnosing the Influential Factors of Household Vulnerability and Relative Poverty
The study again examines carefully the factors affecting the household vulnerability and relative poverty by using the OLS regression method. The diagnostic results of the relationship are shown in Table 5.
Table 5.
Relationships of household vulnerability and relative poverty with household features.
The regression results disclose the following possible influential mechanisms: (1) The large-sized household, by providing a higher proportion of labor forces, helps reduce household vulnerability and poverty. Both relationships are statistically significant. (2) Women household heads tend to be more conservative and cautious, beneficial for dealing with vulnerability with stabilized decisions. (3) Bank deposits can act as an effective way to reduce the vulnerability of forestry workers in forest regions. Bank deposits reflect the risk-resistant capital owned by forestry households and provide a favorable guarantee for households to smooth consumption when facing consumption shocks. (4) Although the debt amount significantly increases the vulnerability of forestry households, it places no significant effect affecting poverty. (5) Life satisfaction significantly and positively helps reduce household vulnerability and poverty, whereas the work reward and self-accomplishment factor acts to reduce vulnerability, but casts little effect on poverty change. (6) The overly comfortable work condition and workload tend to post a negative effect by softening work desire and ability, potentially increasing the vulnerability and poverty of forestry households.
The rest of the factors generally exhibit very weak or insignificant relationships with household vulnerability and relative poverty. (1) The one-off household-head compensation program begets no significant effect on the change of household vulnerability and poverty. (2) The age of the household head seems valuable for reducing vulnerability, but with no significant effect on poverty change. (3) The household head’s positive working and health states are beneficial for poverty reduction, but they have no significant effect on affecting vulnerability. (4) The other factors, such as the education years of the household head, marital status, number of insurances, and loan amount, transpire few effects on household vulnerability and poverty.
5. Discussion
5.1. Interpretation of the Vulnerability–Poverty Relationship
Not surprisingly, our study again discloses the commonly recognized and strong relationship between a household’s vulnerability and relative poverty. That is, they move in reconciled paces. The poorer the household is, the more vulnerable it is. Such a relationship, in turn, demonstrates the plausibility of the approach adopted in the study to derive the vulnerability measurement based on the exposure–sensitivity–adaptability framework. Eventually, impacted by the forestry transition policy, almost all the forestry-work families in the studied transition area have had to suffer the immediate consequence imposed by the policy change, making the families step into hardships with plummeting household income due to unemployment or insufficient hiring. Poverty is not the only factor affecting household vulnerability. Other factors, such as insufficient financial aid, lack of adequate public policy, and ineffective social assistance programs, all contribute to the worsening of household vulnerability. These factors, however, are interconnected with poverty to compound the vulnerability problem. Actually, a more impoverished family may further be deprived of effective resources and means to step out of the dilemma. It may well step into a vicious circle that increased poverty could worsen family vulnerability, and the raised vulnerability would further aggravate household poverty. To break the vicious circle, the livelihoods of the affected forestry households through social and economic assistance programs for providing new job training and opportunities need to be greatly improved. A promising sign is that as the transition deepens, the productivity and profit of the transformed forestry enterprises tend to be better off. The statistics show that the annual per-capita disposable income of the forestry household in the studied region increased to CNY 17,732 (equivalently CNY 1477 per month), matching 78% of the disposable income of urban residents in Heilongjiang and the whole country [6]. Despite the improvement, it must be stressed that the forestry households affected by the transition policy still suffer relative poverty and vulnerable livelihoods as they are still marginalized populations below the average resident household income level.
5.2. Effects of the Potential Factors on Household Vulnerability and Relative Poverty
This study detects the effects of the set of household-related factors on household vulnerability and relative poverty using factor regression analysis. The examination discerns variation in the factor effects.
The study examines the effects of demographic features, such as the size of household; the gender, age, and education years of household head; and marital status. The results show that a larger-sized household would be beneficial for reducing household vulnerability and poverty. This is because the larger household could provide more labor forces and win a higher chance of hiring to increase the family income. The study distinguishes the role of gender affecting household vulnerability and poverty. Male household heads were more likely to be employed as forestry workers engaged in heavy and laborious work for wood processing and manufacturing. They were more likely to lose jobs and incomes due to the logging ban. Comparatively, female household heads were less likely to be hired as forestry workers or, if previously hired, more likely to conduct light-weight, stable administrative work in the forestry enterprise. As a result, they were less likely to be laid off. This may explain why male household heads tended to be more substantially affected by the logging ban than female household heads, entailing different effects on dealing with family vulnerability and economic poverty.
The study also finds that the household head’s age plays a comparatively significant role in reducing household vulnerability, but not in mitigating poverty. Older household heads were more likely to be kept by the forestry enterprise to conduct post-transition forest cultivation and management due to their trusted professional experience and skills. Younger people, who otherwise were more likely to be employed as casual workers for wood manufacturing and services, were hence more negatively affected by the logging ban. The factors regarding the health status and working status of the household head exhibit a reversed effect, in which they cast more effective impact on poverty than vulnerability. This may be because they are more physiological factors: more robust body health elevates job productivity, potentially bringing back more earnings for the family. The working status of the household head reflects whether he is active in the system of forestry production. If the household head is in staffing, he shall have little risk of losing the job, and the wage would be secured at a stable level to counteract the family’s poverty. Additionally, the education years of the household head and the martial status played little effect. This indirectly supports the notion that the impact of the transition policy pervades indifferently across all the families, and in particular that a higher education level of a household head does not mean them being endowed with a better capability to adapt to the new change.
Life satisfaction, work reward, and self-accomplishment are akin to psychological satisfaction and life pursuit. These factors might well assist the forestry worker to maintain an optimistic attitude towards life and work, which increases his confidence and adaptive capability to cope with vulnerability and challenges. However, on the other hand, the factor of work conditions and comfort seems to convey an adverse effect on reducing vulnerability. This might be because the previous experience of the forestry worker being in over-comfortable work conditions and environment may probably soften the worker’s motivation and ability to deal with difficult situations.
This study lends support to the point that the more deposits households have in the bank, the stronger their ability to resist risks and vulnerability and help reduce family poverty. This result discloses that family debts in the forestry-worker households play a relatively limited effect on influencing household vulnerability and poverty, although it is generally believed that greater debts shall weaken the purchasing power of the household and downsize the ability to resist financial hardships and reduce poverty. The insignificant relationship may be associated with the conservative habit that many forestry households would be unwilling to rely on debts to maintain their livelihoods. The same finding applies to family loans, in which case the household would usually be reluctant to borrow loans for livelihoods. Also, the number of insurances on hold places no significant effects on helping reduce household vulnerability and poverty. This implies that all these regular financial measures aid little in dealing with the vulnerability and poverty of the forestry-worker households because they only work to relieve short-term financial hardships temporarily and may even produce long-term burdens for the families.
More importantly, the study sends an alarming message to the public and the government. The one-off household compensation program has long been believed to be an effective governmental measure to counteract the impact of the forestry transition policy upon the forestry-worker families. However, our study instead uncovers that the one-off governmental compensation program is far from being capable of resolving the household vulnerability and poverty problem. The one-off compensation problem could help relieve short-term financial hardships, given its size for a one-off monetary compensation for job layoff of household members. However, the households are deeply prone to vulnerability and poverty in the long run. The laid-off forestry workers desperately demand new employment opportunities to secure family incomes in the future. Short-term compensation programs are questionable in assisting the forestry-worker families to tackle more fundamental issues of vulnerability and poverty. This calls for an integrated package of institutional policy arrangements, such as professional reemployment training, special public aid policies and social assistance programs, discounted commercial loans and insurances, etc., in order to truly effectively cope with the vulnerability and poverty of the forestry-worker households who contribute to the overall well-being of society at the cost of sacrificing their own welfare and interests.
6. Conclusions and Policy Implications
China’s forestry transition policy, especially the cross-nation logging ban starting from 2015, substantially impacts the livelihoods of the forestry-worker families. This paper investigates the issues pf vulnerability and relative poverty of the affected forestry-worker households in the Greater Khingan Mountains state-owned forest region. The study adopts the conceptual assessment framework of sustainable livelihood vulnerability specified by the IPCC to evaluate the vulnerability of forestry-worker families in the studied area. The approach conceptually screens the household vulnerability indicators into exposure, sensitivity, and adaptability components, and with the entropy weighting method, calculates the overall vulnerability scores for the households.
Also, the study computes the relative poverty scores for the households and compares the scores with the estimates for household vulnerability. The study unsurprisingly verifies the commonly acknowledged relation between vulnerability and poverty. That is, the poorer the household is, the more vulnerable it is. We argue that poverty is not the only factor affecting vulnerability, even though a more impoverished household would find it more challenging to rid itself of vulnerable livelihoods and threats. In fact, other factors involving public policy enforcement, social assistance, and some micro-level household characters may all be interconnected with poverty, thus compounding household vulnerability.
Therefore, there is a need to investigate other possible factors that potentially affect household vulnerability and relative poverty in order to propose feasible solutions for the problem. The study hereby examines the factors’ effects on household vulnerability and relative poverty through the OLS factor regression method. The analysis identifies a set of factors contributing significantly to altering household vulnerability and relative poverty. They include the number of household members, which helps reduce household vulnerability and relative poverty by increasing the chance to earn more money with the larger provision of labor forces; the gender of household head, which prefers female household heads largely because they were professionally less affected by the forestry policy; the age of household head, which favors elder household heads in the transition, which is probably attributable to their mature psychological controls and professional skills for post-transition forest management. In addition, the study recognizes the contributions of the various life and job-satisfaction-related factors to coping with household vulnerability and poverty. Higher life satisfaction and higher recognized work reward and self-accomplishment are significantly helpful for reducing the suffering of household vulnerability and poverty due to psychological and mental satiation. The factor of work conditions and comfort works to instead most likely raise vulnerability and poverty levels because a comfortable and easy work environment may downplay the employee’s desire for greater challenges and progress.
Household financial factors exert generally insignificant effects on vulnerability and poverty alterations, except for bank deposits, which cast an intense effect on reducing household vulnerability and poverty. The insignificant effects identified for the financial factors, e.g., household loans, the number of insurances, and household debts, imply that only relying on regular financial options is unlikely to improve household vulnerability and poverty. Other dedicated financial options must be implemented for the desired improvement.
Most importantly, this study exposes the limitation of the current one-off household compensation program, which is publicly voiced as a core settlement for mitigating the suffering of the affected forestry households. Because the one-off compensation program can merely offer temporary financial assistance, the affected households have to suffer long-term livelihood hardships due to job losses and insufficient rehiring. This evidences that the present governmental support policy and social assistance programs still have much room to improve. This study calls for an integrated, more effective pack of institutional arrangements for truly bettering off the livelihoods of these vulnerable, socio-economically marginalized populations. To effectively reduce the vulnerability and poverty level of the forestry-worker families, the study advocates the (1) needs to develop the forest areas with a new service economy to significantly increase the per-capita income level, consumption level, and social warfare of the forestry communities; (2) inflating reemployment options through new services and reinforcing professional training programs, enabling flexible employment, and actively carry out various operations such as fruit and under-forest cereal plantings and forest-landscape tourism, diversifying the income sources of forestry workers; (3) more importantly, it shall establish long-term, specific governmental, social, and financial assistance programs, elevating community governance efficiency, relying on innovative skill training and service infrastructure promotion to effectively improve the social and economic welfare of forestry workers and families. Despite focusing on the situation of the in-transition Chinese forestry workers and families, this study contributes to a broader understanding of the derived vulnerability and poverty of households affected by the grand ecological protection plans globally, to help aid improved policy and program development addressing individual and household vulnerabilities.
Author Contributions
Conceptualization, H.C., J.C., H.Z., and Y.W.; Formal analysis, H.C., J.C., H.Z., and Y.W.; Methodology, H.C., J.C., and H.Z.; Original manuscript draft, H.C. and J.C.; Writing—review and editing, H.C. All authors have read and agreed to the published version of the manuscript.
Funding
This research was primarily funded by the China Social Science Foundation, grant number 21JBY013. The research was also co-funded by a grant from the Beijing Key Lab of Study on Sci-Tech Strategy for Urban Green Development (Award ID BNU 310432101) and a grant from the Fundamental Research Funds for the Central Universities, “Study on worker household welfare changes and livelihood modes in the key national forest areas in economic transformation process” (2572015EC04).
Institutional Review Board Statement
Not applicable.
Informed Consent Statement
Informed consent was obtained from all subjects involved in the study.
Data Availability Statement
Data available on request due to restrictions.
Acknowledgments
The authors appreciate the anonymous reviewers for helping improve the quality of this article.
Conflicts of Interest
The authors declare no conflict of interest.
Appendix A
Table A1.
Data-descriptive statistics of life satisfaction and job satisfaction indicators.
Table A1.
Data-descriptive statistics of life satisfaction and job satisfaction indicators.
| Variables | Max | Min | Median | Average | ||
|---|---|---|---|---|---|---|
| Life satisfaction | Current life attitude | 5.00 | 0.00 | 3.00 | 3.11 | |
| Current life confidence | 5.00 | 0.00 | 4.00 | 3.66 | ||
| Job satisfaction | Working conditions and content | Working facility equipment | 5.00 | 1.00 | 4.00 | 3.52 |
| Working environment | 5.00 | 1.00 | 4.00 | 3.80 | ||
| Degree of work engagement | 5.00 | 1.00 | 4.00 | 3.60 | ||
| Calculation and payment system of overtime wages | 5.00 | 1.00 | 2.00 | 2.52 | ||
| Working stability | 5.00 | 1.00 | 4.00 | 4.04 | ||
| Match status of income and workload | 5.00 | 1.00 | 3.00 | 2.89 | ||
| Working rewards and self-actualization | Rewards for outstanding work | 5.00 | 1.00 | 4.00 | 3.41 | |
| Sense of achievement | 5.00 | 1.00 | 4.00 | 3.80 | ||
| Opportunity to be an important role in the group | 5.00 | 1.00 | 4.00 | 3.41 | ||
| Opportunities to give full play to their abilities | 5.00 | 1.00 | 4.00 | 3.65 | ||
| Opportunity to independently decide how to complete the work | 5.00 | 1.00 | 4.00 | 3.67 | ||
| Promotion opportunities | 5.00 | 1.00 | 3.00 | 3.02 | ||
| Enterprise culture and working atmosphere | The actual situation of the unit | 5.00 | 1.00 | 4.00 | 3.95 | |
| Corresponding status of unit authority | 5.00 | 1.00 | 4.00 | 3.54 | ||
| The way unit leaders treat | 5.00 | 1.00 | 4.00 | 4.06 | ||
| Ability to lead emergency decisions | 5.00 | 1.00 | 4.00 | 4.16 | ||
| Unit policy implementation | 5.00 | 1.00 | 4.00 | 4.02 | ||
| The way colleagues get along with each other | 5.00 | 2.00 | 4.00 | 4.15 | ||
References
- Li, C.H.; Sun, D.; Wang, Z.W. Driving and Obstacle Factors for Industrial Transition Performance of State-owned Forest Regions in Daxing’an and Xiaoxing’an Mountains. J. Northeast For. Univ. 2020, 48, 133–138. (In Chinese) [Google Scholar]
- Zhu, H.G.; Hu, S.L.; Ren, X.M.; Cao, Y.K. Determinants of engagement in non–timber forest products (NTFPs) business activities: A study on worker households in the forest areas of Daxinganling and Xiaoxinganling Mountains, northeastern China. For. Policy Econ. 2017, 80, 125–132. [Google Scholar] [CrossRef]
- Wang, Y.; Wen, H.; Wang, K.; Sun, J.X.; Yu, J.H.; Wang, Q.G.; Wang, W.J. Forest plant and macrofungal differences in the Greater and Lesser Khingan Mountains in Northeast China: A regional–historical comparison and its implications. J. For. Res. 2021, 33, 623–641. [Google Scholar] [CrossRef]
- Liu, Y.; Yue, C.; Wei, X.; Blanco, J.A.; Trancoso, R. Tree profile equations are significantly improved when adding tree age and stocking degree: An example for Larix gmelinii in the Greater Khingan Mountains of Inner Mongolia, northeast China. Eur. J. For. Res. 2020, 139, 443–458. [Google Scholar] [CrossRef]
- Cao, J.J.; Wang, Y.F.; Chen, H. Evaluation and Difference Analysis of Transformation Ability of Forest Industry Groups in the Key State-owned Forest Regions. J. Agro-For. Econ. Manag. 2020, 19, 77–86. (In Chinese) [Google Scholar]
- Geng, Y.D.; Wan, Z.F.; Li, W.; Liu, M. Study on Process and Policies of the Reform of Stated–owned Forest Regions—Based on the Investigations on Forestry Industrial Group of Longjiang and Forestry Group of Daxing’anling Region. For. Econ. 2017, 2, 3–11. (In Chinese) [Google Scholar]
- Lv, J.H.; Liu, Y.D.; Zhang, B. Analysis on Forestry Industry Integration Degree and Its Influencing Factors—A Case Study of State-owned Forest Regions in Heilongjiang Province. For. Econ. 2018, 5, 60–64, 90. (In Chinese) [Google Scholar]
- Ke, S.F.; Qiao, D.; Zhang, X.X.; Feng, Q.Y. Corrigendum to “Changes of China’s forestry and forest products industry over the past 40 years and challenges lying ahead”. For. Policy Econ. 2020, 123, 102351. [Google Scholar] [CrossRef]
- Chen, F.; Zhao, Y. Determinants and Differences of Grain Production Efficiency Between Main and Non–Main Producing Area in China. Sustainability 2019, 11, 5225. [Google Scholar] [CrossRef]
- Chen, J.; Wu, Y.; Song, M.; Zhu, Z. Stochastic frontier analysis of productive efficiency in China’s Forestry Industry. J. For. Econ. 2017, 28, 87–95. [Google Scholar] [CrossRef]
- Dai, L.; Wang, Y.; Su, D.; Zhou, L.; Yu, D.; Lewis, B.J.; Qi, L. Major Forest Types and the Evolution of Sustainable Forestry in China. Environ. Manag. 2011, 48, 1066–1078. [Google Scholar] [CrossRef]
- Xu, M.; Qi, Y.; Gong, P. China’s new forest policy. Science 2000, 289, 2049–2050. [Google Scholar] [CrossRef]
- Liu, J. Forestry development and forest policy in China. J. For. Econ. 2005, 10, 159–160. [Google Scholar] [CrossRef]
- Liu, S.L.; Xu, J.T. Livelihood mushroomed: Examining household level impacts of non-timber forest products under new management regime in China’s state forests. For. Policy Econ. 2019, 98, 44–53. [Google Scholar] [CrossRef]
- Lo, K. Authoritarian environmentalism, just transition, and the tension between environmental protection and social justice in China’s forestry reform. For. Policy Econ. 2021, 131, 102574. [Google Scholar] [CrossRef]
- Zhang, Y.; Chen, S. Wood trade responses to ecological rehabilitation program: Evidence from China’s new logging ban in natural forests. For. Policy Econ. 2021, 122, 102339. [Google Scholar] [CrossRef]
- Su, H.; Hou, F.; Yang, Y.; Han, Z.; Liu, C. An assessment of the international competitiveness of China’s forest products industry. For. Policy Econ. 2020, 119, 102256. [Google Scholar] [CrossRef]
- Zhang, Y.; Zhang, T.; Zeng, Y.X.; Cheng, B.D.; Li, H.X. Designating National Forest Cities in China: Does the policy improve the urban living environment? For. Policy Econ. 2021, 125, 102400. [Google Scholar] [CrossRef]
- Aguilar, F.X.; Wen, Y. Socio–economic and ecological impacts of China’s forest sector policies. For. Policy Econ. 2021, 217, 1024. [Google Scholar] [CrossRef]
- Zhu, Z.F.; Cao, Y.K. Loss of Social Welfare in Forest Resource–based Economic Transformation, Characteristics, Contents, and Outlets. World For. Res. 2017, 2, 67–72. (In Chinese) [Google Scholar]
- Gautam, Y.; Andersen, P. Rural livelihood diversification and household well–being: Insights from Humla, Nepal. J. Rural Stud. 2016, 44, 239–249. [Google Scholar] [CrossRef]
- Panthi, J.; Aryal, S.; Dahal, P.; Bhandari, P.; Krakauer, N.Y.; Pandey, V.P. Livelihood vulnerability approach to assessing climate change impacts on mixed agro–livestock smallholders around the Gandaki River Basin in Nepal. Reg. Environ. Chang. 2016, 16, 1121–1132. [Google Scholar] [CrossRef]
- Salik, K.M.; Jahangir, S.; ul Hasson, S. Climate change vulnerability and adaptation options for the coastal communities of Pakistan. Ocean. Coast. Manag. 2015, 112, 61–73. [Google Scholar] [CrossRef]
- Shah, K.U.; Dulal, H.B.; Johnson, C.; Baptiste, A. Understanding livelihood vulnerability to climate change: Applying the livelihood vulnerability index in Trinidad and Tobago. Geoforum 2013, 47, 125–137. [Google Scholar] [CrossRef]
- Wang, H.; Zhang, H.P.; Xu, J.T. Effects of Key State-owned Forestry Reforms on the Inequality of Household Incomes. World For. Res. 2016, 5, 48–53. (In Chinese) [Google Scholar]
- Rowntree, B.S. Poverty, a study of town life. Charity Organ. Rev. 1902, 11, 260–266. [Google Scholar]
- Townsend, P.; Phillimore, P.; Beattie, A. Health and deprivation. Inequality and the North. Rev. Cuba. Hig. Epidemiol. 2004, 35, 48–50. [Google Scholar]
- Van, O.V.; Wang, C. Social investment and poverty reduction, a comparative analysis across fifteen European countries. J. Soc. Policy 2015, 44, 611–638. [Google Scholar]
- Hahn, M.B.; Riederer, A.M.; Foster, S.O. The Livelihood Vulnerability Index: A pragmatic approach to assessing risks from climate variability and change—A case study in Mozambique. Glob. Environ. Chang. 2009, 19, 74–88. [Google Scholar] [CrossRef]
- Pandey, R.; Bardsley, D.K. Social-ecological vulnerability to climate change in the Nepali Himalaya. Appl. Geogr. 2015, 64, 74–86. [Google Scholar] [CrossRef]
- Azzam, A.M.; Rettab, B. A welfare measure of consumer vulnerability to rising prices of food imports in the UAE. Food Policy 2012, 5, 554–560. [Google Scholar] [CrossRef]
- Jiao, X.; Pouliot, M.; Walelign, S.Z. Livelihood strategies and dynamics in rural Cambodia. World Dev. 2017, 97, 266–278. [Google Scholar] [CrossRef]
- Foster, J.J.; Greer, E.; Thorbecke, E. A Class of Decomposable Poverty Measures. Econometrica 1984, 52, 761–766. [Google Scholar] [CrossRef]
- Suryahadi, A.; Sumarto, S. Poverty and vulnerability in Indonesia before and after the economic crisis. Asian Econ. J. 2003, 17, 45–64. [Google Scholar] [CrossRef]
- Chakravarty, S.R. A New Index of Poverty. In Poverty, Social Exclusion and Stochastic Dominance; Themes in Economics; Springer: Singapore, 2019; pp. 31–37. [Google Scholar]
- White, G.F. Natural Hazards, 1st ed.; Oxford University Press: London, UK, 1974. [Google Scholar]
- Mackay, A. Climate change 2007, impacts, adaptation and vulnerability. Contribution of working group ii to the fourth assessment report of the intergovernmental panel on climate change. J. Environ. Qual. 2007, 37, 2407. [Google Scholar] [CrossRef]
- Huang, J.Y.; Liu, Y.; Ma, L.; He, S.F. Review on the Theoretical Model and Assessment Framework of Foreign Vulnerability Research. Areal Res. Dev. 2012, 31, 1–5. [Google Scholar]
- Bhattacharjee, K.; Behera, B. Determinants of household vulnerability and adaptation to floods: Empirical evidence from the Indian State of West Bengal. Int. J. Disaster Risk Reduct. 2018, 31, 758–769. [Google Scholar] [CrossRef]
- Ghosh, M.; Ghosal, S. Determinants of household livelihood vulnerabilities to climate change in the Himalayan foothills of West Bengal, India. Int. J. Disaster Risk Reduct. 2020, 50, 2–11. [Google Scholar] [CrossRef]
- Ligon, E.; Schechter, L. Measuring vulnerability. Econ. J. 2003, 113, 95–102. [Google Scholar] [CrossRef]
- Asif, I.; Ronald, C.E.; Hallie, E.; Jagadish, P.; Yasin, W.R. IPCC’s current conceptualization of ‘vulnerability’ needs more clarification for climate change vulnerability assessments. J. Environ. Manag. 2022, 303, 114246. [Google Scholar]
- Baffoe, G.; Matsuda, H. An Empirical Assessment of Households’ Livelihood Vulnerability: The Case of Rural Ghana. Soc. Indic. Res. 2017, 140, 1225–1257. [Google Scholar] [CrossRef]
- Hoq, M.S.; Raha, S.K.; Hossain, M.I. Livelihood Vulnerability to Flood Hazard: Understanding from the Flood–prone Hoar Ecosystem of Bangladesh. Environ. Manag. 2021, 67, 532–552. [Google Scholar] [CrossRef] [PubMed]
- Oberlack, C.; Tejada, L.; Messerli, P.; Rist, S.; Giger, M. Sustainable livelihoods in the global land rush? Archetypes of livelihood vulnerability and sustainability potentials. Glob. Environ. Chang. 2016, 41, 153–171. [Google Scholar] [CrossRef]
- Huong, N.T.L.; Yao, S.; Fahad, S. Assessing household livelihood vulnerability to climate change: The case of Northwest Vietnam. Hum. Ecol. Risk Assess. 2019, 25, 1157–1175. [Google Scholar] [CrossRef]
- Eze, J.N.; Aliyu, U.; Alhaji–Baba, A.; Alfa, M. Analysis of farmers’ vulnerability to climate change in Niger state, Nigeria. Soc. Sci. Electron. Publ. 2018, 82, 1–9. [Google Scholar] [CrossRef]
- Brooks, N.; Adger, W.N.; Kelly, P.M. The determinants of vulnerability and adaptive capacity at the national level and the implications for adaptation. Glob. Environ. Chang. 2005, 15, 151–163. [Google Scholar] [CrossRef]
- Tran, V.T.; An-Vo, D.-A.; Cockfield, G.; Mushtaq, S. Assessing Livelihood Vulnerability of Minority Ethnic Groups to Climate Change: A Case Study from the Northwest Mountainous Regions of Vietnam. Sustainability 2021, 13, 7106. [Google Scholar] [CrossRef]
- Alkire, S.; Foster, J. Counting and multidimensional poverty measurement. J. Public Econ. 2007, 95, 476–487. [Google Scholar] [CrossRef]
- Ferreira, F.; Chen, S.; Dabalen, A.; Dikhano, Y.; Hamadeh, N.; Jolliffe, D.; Narayan, A.; Prydz, E.B.; Revenga, A.; Sangraula, P.; et al. A Global Count of the Extreme Poor in 2012: Data Issues, Methodology and Initial Results. Soc. Sci. Electron. Publ. 2016, 14, 141–172. [Google Scholar] [CrossRef]
- Booth, C. Life and Labor of the People in London; Macmillan: London, UK, 1892. [Google Scholar]
- Group, W.B. A Measured Approach to Ending Poverty and Boosting Shared Prosperity: Concepts, Data, and the Twin Goals; The World Bank: Washington, DC, USA, 2015. [Google Scholar]
- Group, W.B. Poverty and Shared Prosperity 2018: Piecing Together the Poverty Puzzle; World Bank: Washington, DC, USA, 2018. [Google Scholar]
- Commission European. Portfolio of Indicators for the Monitoring of the European Strategy for Social Protection and Social Inclusion; European Commission: Brussel, Belgium, 2015. [Google Scholar]
- Zheng, B. Statistical inference for poverty measures with relative poverty lines. J. Econ. 2004, 101, 337–356. [Google Scholar] [CrossRef]
- Decerf, B. Combining absolute and relative poverty: Income poverty measurement with two poverty lines. Soc. Choice Welf. 2020, 56, 325–362. [Google Scholar] [CrossRef]
- Diener, E.; Emmons, R.A.; Larsen, R.J.; Griffin, S. The Satisfaction with Life Scale. J. Personal. Assess. 1985, 49, 71–75. [Google Scholar] [CrossRef] [PubMed]
- Shin, D.C.; Johnson, D.M. Avowed happiness as an overall assessment of the quality of life. Soc. Indic. Res. 1978, 5, 475–492. [Google Scholar] [CrossRef]
- Li, B.; Wu, Y.; Jiang, S.; Zhai, H.Z. WeChat Addiction Suppresses the Impact of Stressful Life Events on Life Satisfaction. Cyberpsychol. Behav. Soc. Netw. 2018, 21, 194–198. [Google Scholar] [CrossRef] [PubMed]
- Blatný, M.; Květon, P.; Šolcová, I.; Zábrodská, K.; Mudrák, J.; Jelínek, M.; Machovcová, K. The Influence of Personality Traits on Life Satisfaction through Work Engagement and Job Satisfaction among Academic Faculty Members. Studia Psychol. 2018, 60, 274–286. [Google Scholar] [CrossRef]
- Cheung, C.K.; Leung, K. Ways that Social Change Predicts Personal Quality of Life. Soc. Indic. Res. 2010, 96, 459–477. [Google Scholar] [CrossRef]
- Grogan, R.H.; Aschebrook–Kilfoy, B.; Angelos, P. Interventions to improve thyroid cancer survivors’ quality of life. Future Oncol. 2016, 12, 1309–1311. [Google Scholar] [CrossRef]
- Stanley, S.M.; Ragan, E.P.; Rhoades, G.K.; Markman, J.H. Examining changes in relationship adjustment and life satisfaction in marriage. J. Fam. Psychol. 2012, 26, 165–170. [Google Scholar] [CrossRef]
- Audenaert, M.; George, B.; Bauwens, R.; Decuypere, A.; Descamps, A.; Muylaert, J.; Ma, R.; Decramer, A. Empowering leadership, social support, and job crafting in public organizations: A multilevel study. Public Pers. Manag. 2020, 49, 367–392. [Google Scholar] [CrossRef]
- Togia, A.; Koustelios, A.; Tsigilis, N. Job satisfaction among Greek academic librarians. Libr. Inf. Sci. Res. 2004, 26, 373–383. [Google Scholar] [CrossRef]
- Bakotic, D. Relationship between job satisfaction and organizational performance. Econ. Res. 2016, 29, 118–130. [Google Scholar]
- Kimura, T. Causal Relationship between Job Satisfaction and Organizational Performance. J. Sci. Labour 2011, 35, 1265–1276. [Google Scholar]
- Alegre, I.; Mas–Machuca, M.; Berbegal–Mirabent, J. Antecedents of employee job satisfaction: Do they matter? J. Bus. Res. 2016, 69, 1390–1395. [Google Scholar] [CrossRef]
- Ireri, K. High Job Satisfaction Despite Low Income: A National Study of Kenyan Journalists. J. Mass Commun. Q. 2016, 93, 164–186. [Google Scholar] [CrossRef]
- Schyns, B.; Croon, M.A. A model of task demands, social structure, and leader-member exchange and their relationship to job satisfaction. Int. J. Hum. Resour. Manag. 2006, 4, 602–615. [Google Scholar] [CrossRef][Green Version]
- Boswell, W.R.; Boudeau, J.W. Employee satisfaction with performance appraisals and appraisers: The role of perceived appraisal use. Hum. Resour. Dev. Q. 2000, 3, 283–299. [Google Scholar] [CrossRef]
- Zhang, X.; Hu, B.; Qiu, M. Job satisfaction as a mediator in the relationship between performance appraisal and voice behavior. Soc. Behav. Personal. Int. J. 2014, 8, 1315–1323. [Google Scholar] [CrossRef]
- Zhao, X.; Ghiselli, R.; Law, R.; Ma, J. Motivating frontline employees: Role of job characteristics in work and life satisfaction. J. Hosp. Tour. Manag. 2016, 27, 27–38. [Google Scholar] [CrossRef]
- Mabasa, F.D.; Ngirande, H. Perceived organizational support influences on job satisfaction and organizational commitment among junior academic staff members. J. Psychol. Afr. 2015, 25, 364–366. [Google Scholar] [CrossRef]
- Kumar, G.S.; Premalatha, K. Securing private information by data perturbation using statistical transformation with three–dimensional shearing. Appl. Soft Comput. 2021, 112, 107819. [Google Scholar] [CrossRef]
- Ufumaka, I. Comparative Analysis of Machine Learning Algorithms for Heart Disease Prediction. Int. J. Sci. Res. 2021, 11, 339–346. [Google Scholar]
- Delgado, A.; Romero, I. Environmental conflict analysis using an integrated grey clustering and entropy–weight method: A case study of a mining project in Peru. Environ. Model. Softw. 2016, 77, 108–121. [Google Scholar] [CrossRef]
- Wu, H.-W.; Li, E.-Q.; Sun, Y.-Y.; Dong, B.-T. Research on the operation safety evaluation of urban rail stations based on the improved TOPSIS method and entropy weight method. J. Rail Transp. Plan. Manag. 2021, 20, 100262. [Google Scholar] [CrossRef]

Publisher’s Note: MDPI stays neutral with regard to jurisdictional claims in published maps and institutional affiliations. |
© 2022 by the authors. Licensee MDPI, Basel, Switzerland. This article is an open access article distributed under the terms and conditions of the Creative Commons Attribution (CC BY) license (https://creativecommons.org/licenses/by/4.0/).