Article

Ultimate Limit State Reliability-Based Optimization of MSE Wall Considering External Stability

by
Zafar Mahmood
1,*,
Mohsin Usman Qureshi
2,
Zubair Ahmed Memon
3,* and
Qadir Bux alias Imran Latif
4
1
Department of Civil and Architectural Engineering, College of Engineering, University of Buraimi, P.O. Box 890, Al Buraimi 512, Oman
2
Faculty of Engineering, Sohar University, P.O. Box 44, Sohar 311, Oman
3
Department of Engineering Management, Prince Sultan University, Riyadh 11586, Saudi Arabia
4
Department of Civil and Environmental Engineering, College of Engineering, University of Nizwa, P.O. Box 33, Nizwa 616, Ad-Dakhliyah, Oman
*
Authors to whom correspondence should be addressed.
Sustainability 2022, 14(9), 4968; https://doi.org/10.3390/su14094968
Submission received: 13 March 2022 / Revised: 2 April 2022 / Accepted: 15 April 2022 / Published: 21 April 2022

Abstract

:
We present reliability-based optimization (RBO) of the Mechanically Stability Earth (MSE) walls, using constrained optimization, considering the external stability, under ultimate limit state conditions of sliding, eccentricity, and bearing capacity. The design is optimized for a target reliability index of 3 that corresponds to an approximate failure probability of 1 in 1000. Reliability index is calculated by the first-order reliability method (FORM). The MSE wall, founded on cohesionless soil, with horizontal backfill and uniform live traffic surcharge, is studied. The RBO results are reported for the height of MSE wall ranging from 1.5 m to 20 m. For target reliability index of 3, the optimized length to height ratio, L o p t / H , of the MSE wall is greater than 0.7 (the minimum length to height ratio requirement of AASHTO) for H 4.5 m, and then it decreases below the minimum required value of 0.7 for H > 4.5 m. The RBO approach presented in this study will help practitioners to achieve cost-effectiveness in design.

1. Introduction

The geotechnical engineering systems inherit risks and uncertainties and in order to apply sustainable design approach it is essential to quantify these uncertainties to rationalize the practice [1,2,3,4,5,6,7]. Traditional deterministic methods in geotechnical engineering are considered insufficient due to uncertainties inherently associated with geotechnical materials [8]. Empirical safety factors used in traditional deterministic design cannot incorporate effect of the uncertainties of design variables on the overall performance.
The uncertainties in the design of geotechnical systems come from applied loading, geotechnical properties of soil, and the models used in calculations [8,9]. Reliability-based design (RBD) of geotechnical systems is an alternative method to the practice of allowable stress design (ASD). Reliability-based optimization (RBO) is a great technique for optimizing geotechnical-related design problems satisfying to a predefined criteria (such as economy in construction) while explicitly satisfying the design requirements and accommodating the unavoidable uncertainties [10].
In recent past, several studies report the reliability-based design (RBD) as well as reliability-based optimization (RBO) of retaining structures. Sayed et al. [11] performed a parametric sensitivity analysis of reinforced soil wall to investigate the effect of material uncertainties under static and dynamic loading. Basha and Babu [12] used inverse FORM to study reliability-based design optimization of anchored sheet pile wall. Babu and Basha [13] used inverse reliability approach for design optimization of cantilever sheet pile wall. Basha and Babu [14] used reliability based approach for design optimization of geosynthetic reinforced soil walls considering external stability under seismic loading. Chalermyanont and Benson [15] used Monte Carlo simulation to develop a reliability-based design for external stability of MSE walls. Yang et al. [16] presented a reliability-based design procedure for external stability of narrow MSE walls. They calibrated reduction factors based on Bayesian analysis from results of centrifuge tests. Zhang et al. [17] used the Mean First-Order Reliability Method (MFORM) to optimize the reliability-based design of gravity retaining wall and spread footing. Zhao et al. [18] used Artificial Bee Colony (ABC) algorithm to optimize the reliability-based design of gravity retaining wall and spread footing. Santos et al. [19] reported reliability-based design optimization of geosynthetic-reinforced soil walls using Ant Colony Optimization (ACO) algorithm. Mahmood [20] proposed two-loop constrained optimization technique and demonstrated its application on a gravity retaining wall considering external stability. Wu et al. [21] presented a reliability-based analysis of MSE wall considering wall performance (maximum wall face deformation) by using Monte Carlo Simulations and finite difference based numerical simulations.
Mechanically stabilized earth (MSE) wall, also called reinforced earth wall, was proposed by Henry Vidal in the early 1960s [22]. In United Stated, more than fifty percent of the retaining structures used in transportation infrastructure consist of MSE walls [23]. The earthen materials are reinforced to support their weight and other loads. These walls consist of facing, reinforcement, reinforced soil and retained soil. Welded wire mats, metal bars, geosynthetics, or other anchorage systems are used as reinforcement to improve the mechanical properties of the soil mass. The MSE walls must satisfy both external and internal stability requirements. The external stability includes sliding, eccentricity, bearing capacity and overall stability checks. The internal stability includes pullout and structural failure of the reinforcement. Each stability criteria represents a separate limit state. The MSE walls used in transportation applications are designed according to the load and resistance factor (LRFD) design as per AASHTO specifications [24].
The aim of present study is to find an optimum design of the MSE wall using constrained optimization considering the external stability for a target reliability (or target failure probability). The failure of probability for earth retaining structures ranges from 0.1 to 0.0001. [25,26]. The target reliability of 3 corresponding to failure probability of 0.0013 (or an approximate probability of a failure of 1 in 1000) is used. The limit states of sliding, eccentricity, and bearing capacity failure are checked. LRFD design procedure of AASTHO [24] is used. The first-order reliability method (FORM) is used to determine reliability index. Constrained optimization with linear approximation (COBYLA) and reliability index calculation is implemented in Python language and Open TURNS [27,28], open-source software for probabilistic modeling and uncertainty management. RBO results of MSE wall for heights ranging from H = 1.5 to 20 m are presented.

2. Methodology

In this section, the reliability index, constrained optimization algorithm, the algorithm for constrained optimization, the uncertainty of variables, and limit state equations are discussed.

2.1. Reliability Index

Due to the inherent uncertainty of input variables related to material properties and loads, the stability of an engineering system can be expressed by the reliability index. According to Hasofer and Lind [29], “the reliability index β is the shortest distance from the mean value point of the random variables to the limit state surface” which can be expressed as follow:
β = min x F ( x μ ) T C 1 ( x μ )
where x = vector of random variables, μ = vector of mean values, F = failure domain, and C = covariance matrix.
In many engineering problems, random variables are not normally distributed, which makes reliability index calculations not so easy. Therefore, using different techniques [30,31,32,33,34], the non-normal random variables, in the physical space, can be transformed into normal independent variables, in the standard space.
To calculate β in the standard normal space U , a most probable design point u * should be found by minimizing ( u T u = i = 1 n u i 2 ) , under the constraint G ( u ) = 0 , where G ( u ) is the limit state function in standard normal space. Therefore, as shown in Figure 1 [35], β is the minimum distance from the origin of the standardized normal space of random variable to the limit state surface at the failure point u * , which can be expressed as follows:
β = min u T u = min i = 1 n u i 2 = min ( u * ) T u *
where u i = transformed random variable in the standard normal space U . According to Low & Tang [34], random variable x i can be obtained from transformed random variable u i by Equations (3) and (4) for normal and lognormal distribution respectively.
x i = μ i + u i σ i
x i = exp [ λ + ζ u i ] ,   ζ = log e [ 1 + ( σ i / μ i ) 2 ] ,   and   λ = log e μ i 0.5 ζ 2
where μ i = mean of random variable x i , σ i = standard deviation of random variable x i .

2.2. Constrained Optimization with Linear Approximation (COBYLA)

Powell [36,37] developed a gradient-free, constrained optimization algorithm, which is capable of handling inequality and equality constraints. Constrained optimization is method of finding a vector x that is local minimum to a scalar function f(x) subject to constraints on the allowable x:
min x f ( x )   such   that   { g ( x ) = 0 h ( x ) 0 l b x u b
where g ( x ) = equality constraint, h ( x ) = inequality constraint, l b = lower bound, u b = upper and lower bounds, and f ( x ) = objective function that returns a scalar. COBYLA algorithm in this study is implemented with Open TURNS [27,28], which is open-source software for probabilistic modeling and uncertainty management.

2.3. Process of Reliability-Based Optimization (RBO)

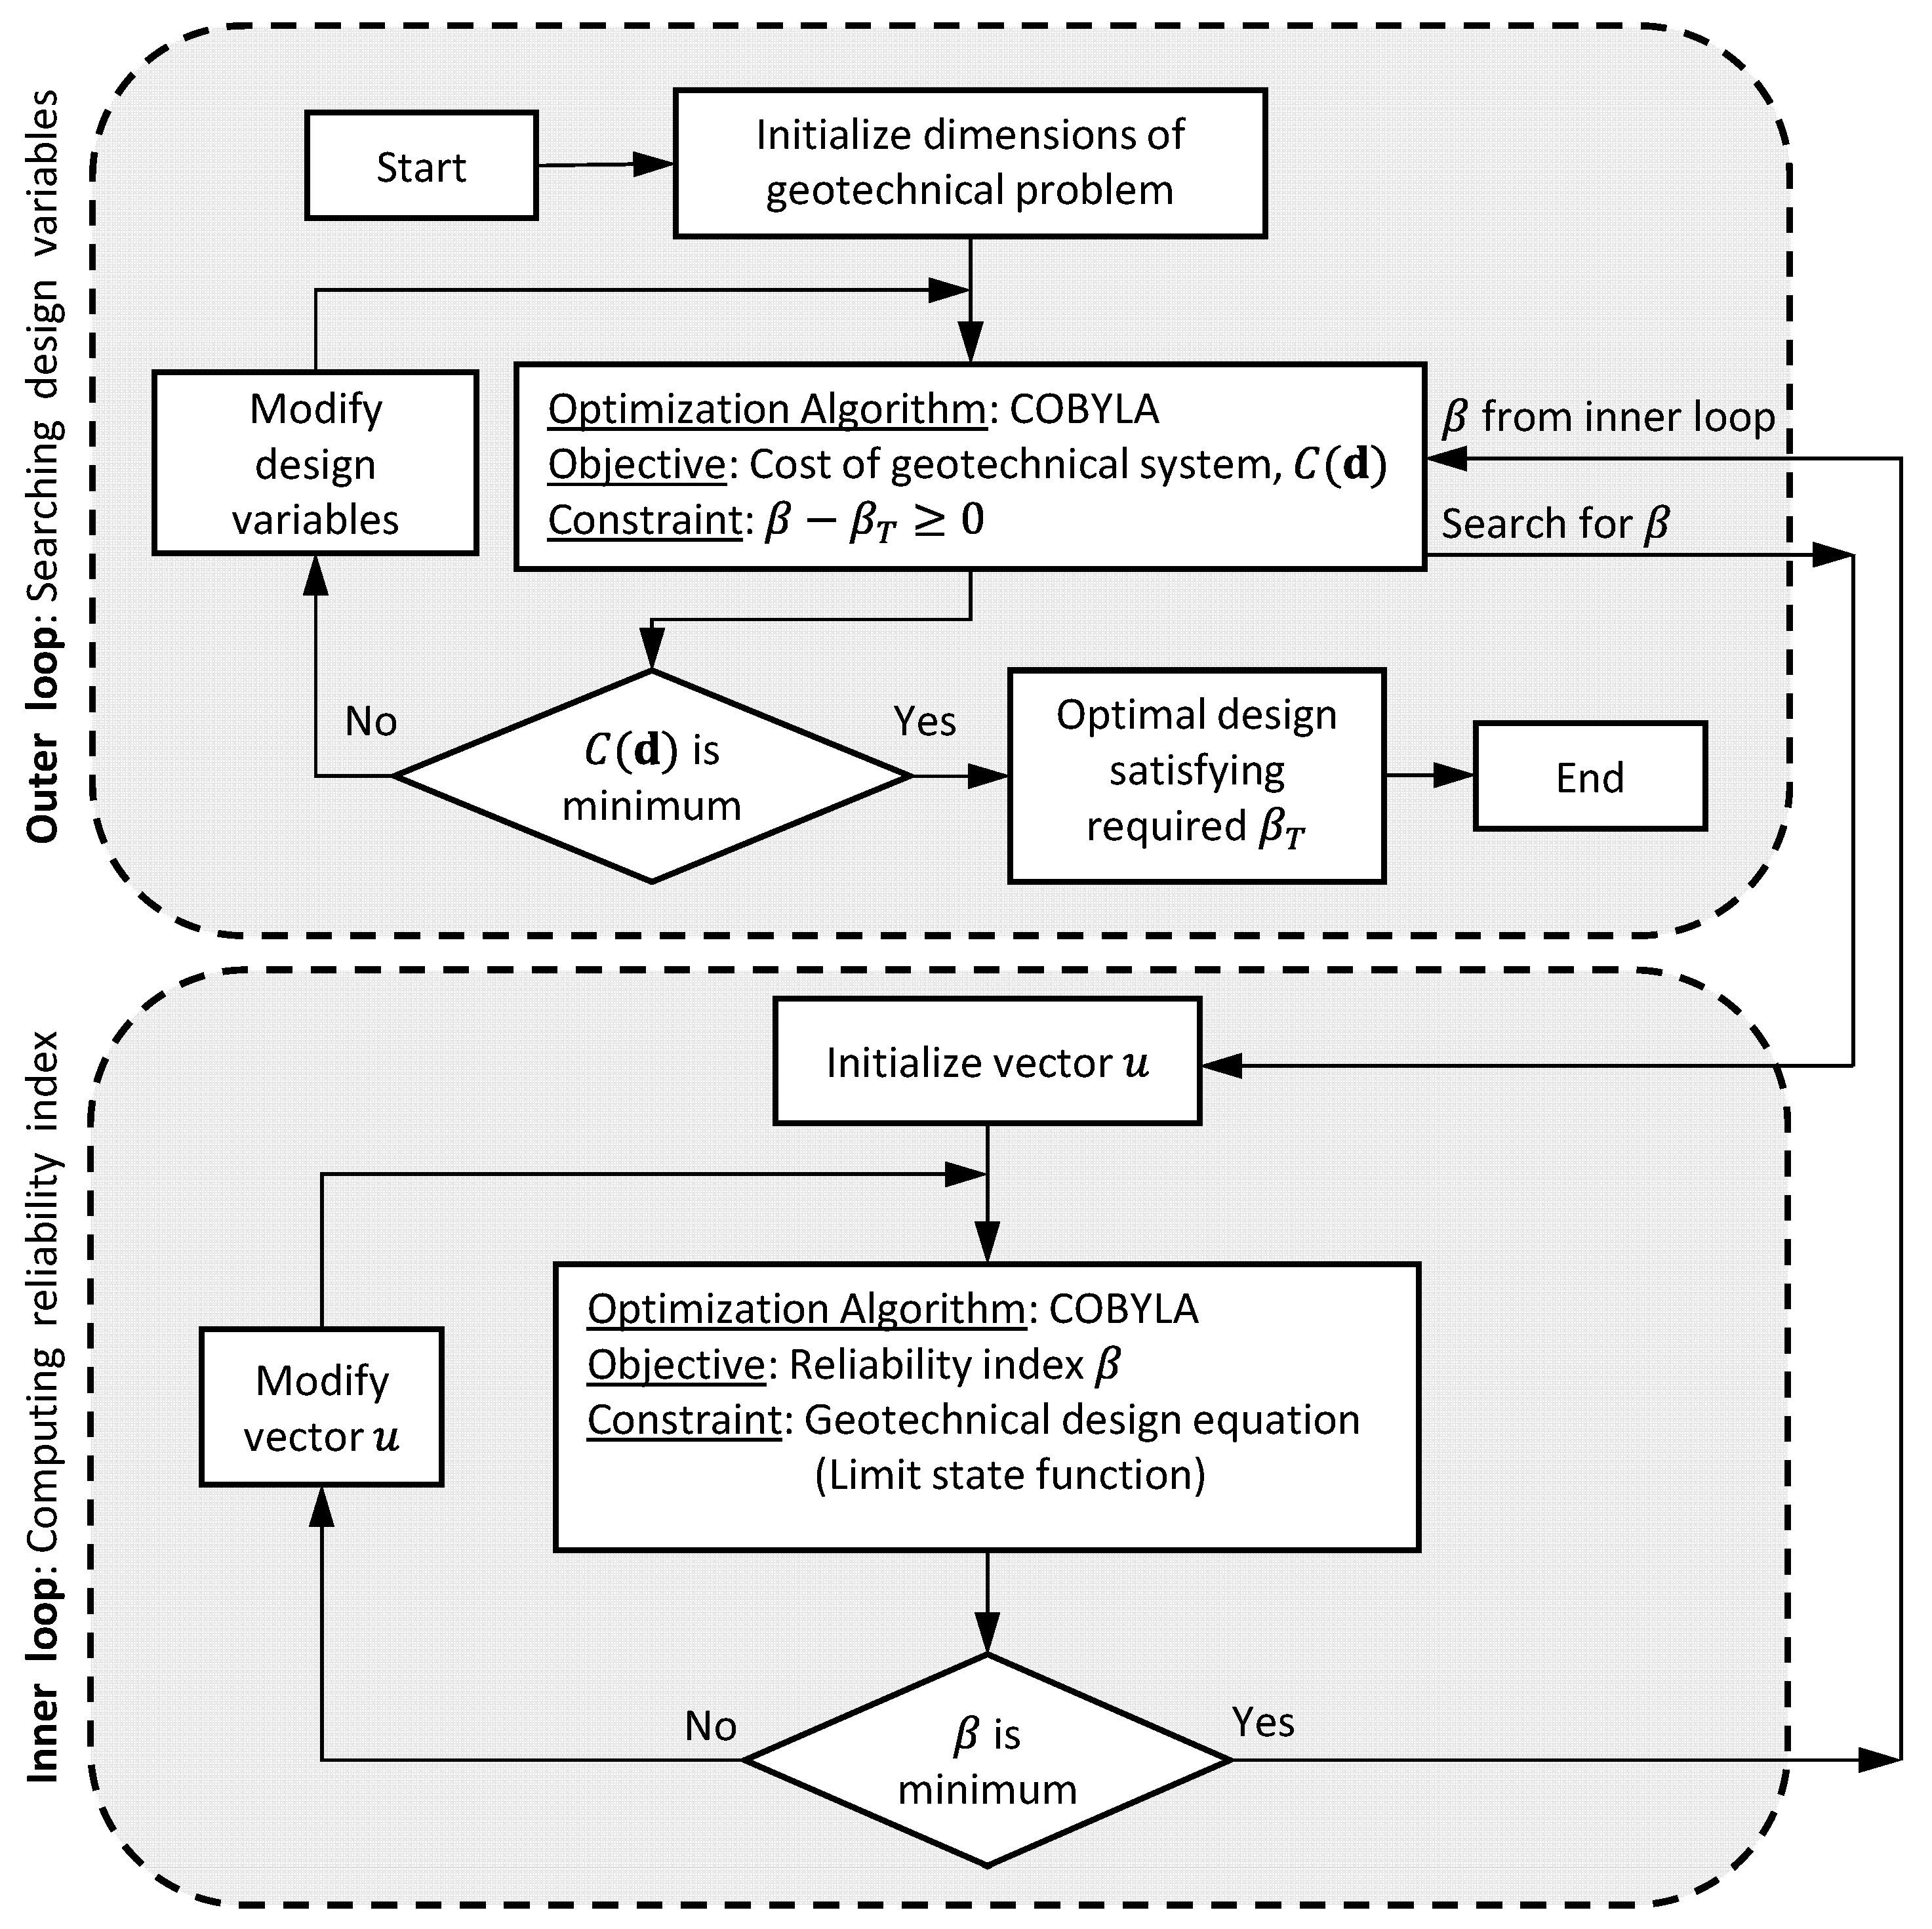
Minimizing the cost of a geotechnical structure, satisfying the requirements of the target reliability β T and design equations is essentially a constrained optimization problem. RBO becomes a multi-objective (double loop) optimization problem because the determination of reliability index is itself an optimization problem [20]. Constrained optimization is used in two loops: searching the design variables while minimizing the cost of the geotechnical problem with target reliability as a constraint in the outer loop, and computing β with design requirements as constraints in the inner loop (Figure 2).
The cost function of geotechnical problem is minimized in the outer loop. The calculation sequence is as follows:
Step 1: Initialize dimensions of the geotechnical problem (i.e., design variables).
Step 2: Run COBYLA to minimize the cost function (i.e., MSE wall area). Target reliability index β T is the constraint. β T should be less than or equal to calculated value of β (determined in the inner loop).
Step 3: If the cost function is minimum and β β T 0 , all requirements are satisfied, stop the execution. If cost function is not minimum, change design variables, and repeat calculations from Step 2.
Reliability index for a limit state is calculated in the inner loop by searching transformed random variable u i . The calculation sequence is as follows.
Step 1: Initialize vector u .
Step 2: Run COBYLA algorithm. The objective is minimization of reliability index. The constraint is geotechnical design equation (or limit state).
Step 3: Calculate β . If β is minimum and constraint is satisfied, stop execution, and pass control to the outer loop. If β is not minimum, change vector u , and repeat the process from step 2.

2.4. Reliability-Based Optimization of MSE Wall Considering External Stability

Limit state design (LSD) method deals with uncertainty of loads and material properties by incorporating load and resistance factors. The load and resistance factored design (LRFD) compares factored resistance to the sum of factored loads:
( RF ) R n ( LF i ) Q n , i
where RF = resistance factor ( 1 ) ; R n = nominal resistance; and LF i = load factors ( 1 ) for particular type of design loads Q n , i (e.g., dead load and live load). Table 1 and Table 2 show the load and resistance factors, respectively, for MSE walls as specified by AASHTO [24].
Reliability-based optimization (RBO) is implemented on the external stability of the MSE wall. Load and resistance factor design (LRFD) of MSE walls is adopted from AASHTO [24].
The reinforced soil mass of the MSE wall acts as a rigid block when checked for external stability [38]. The design constraints for external stability of MSE wall are sliding, eccentricity, and bearing capacity which are the limit states (or failure modes). The objective is to find a solution with minimum wall area while fulfilling the reliability and design requirements.
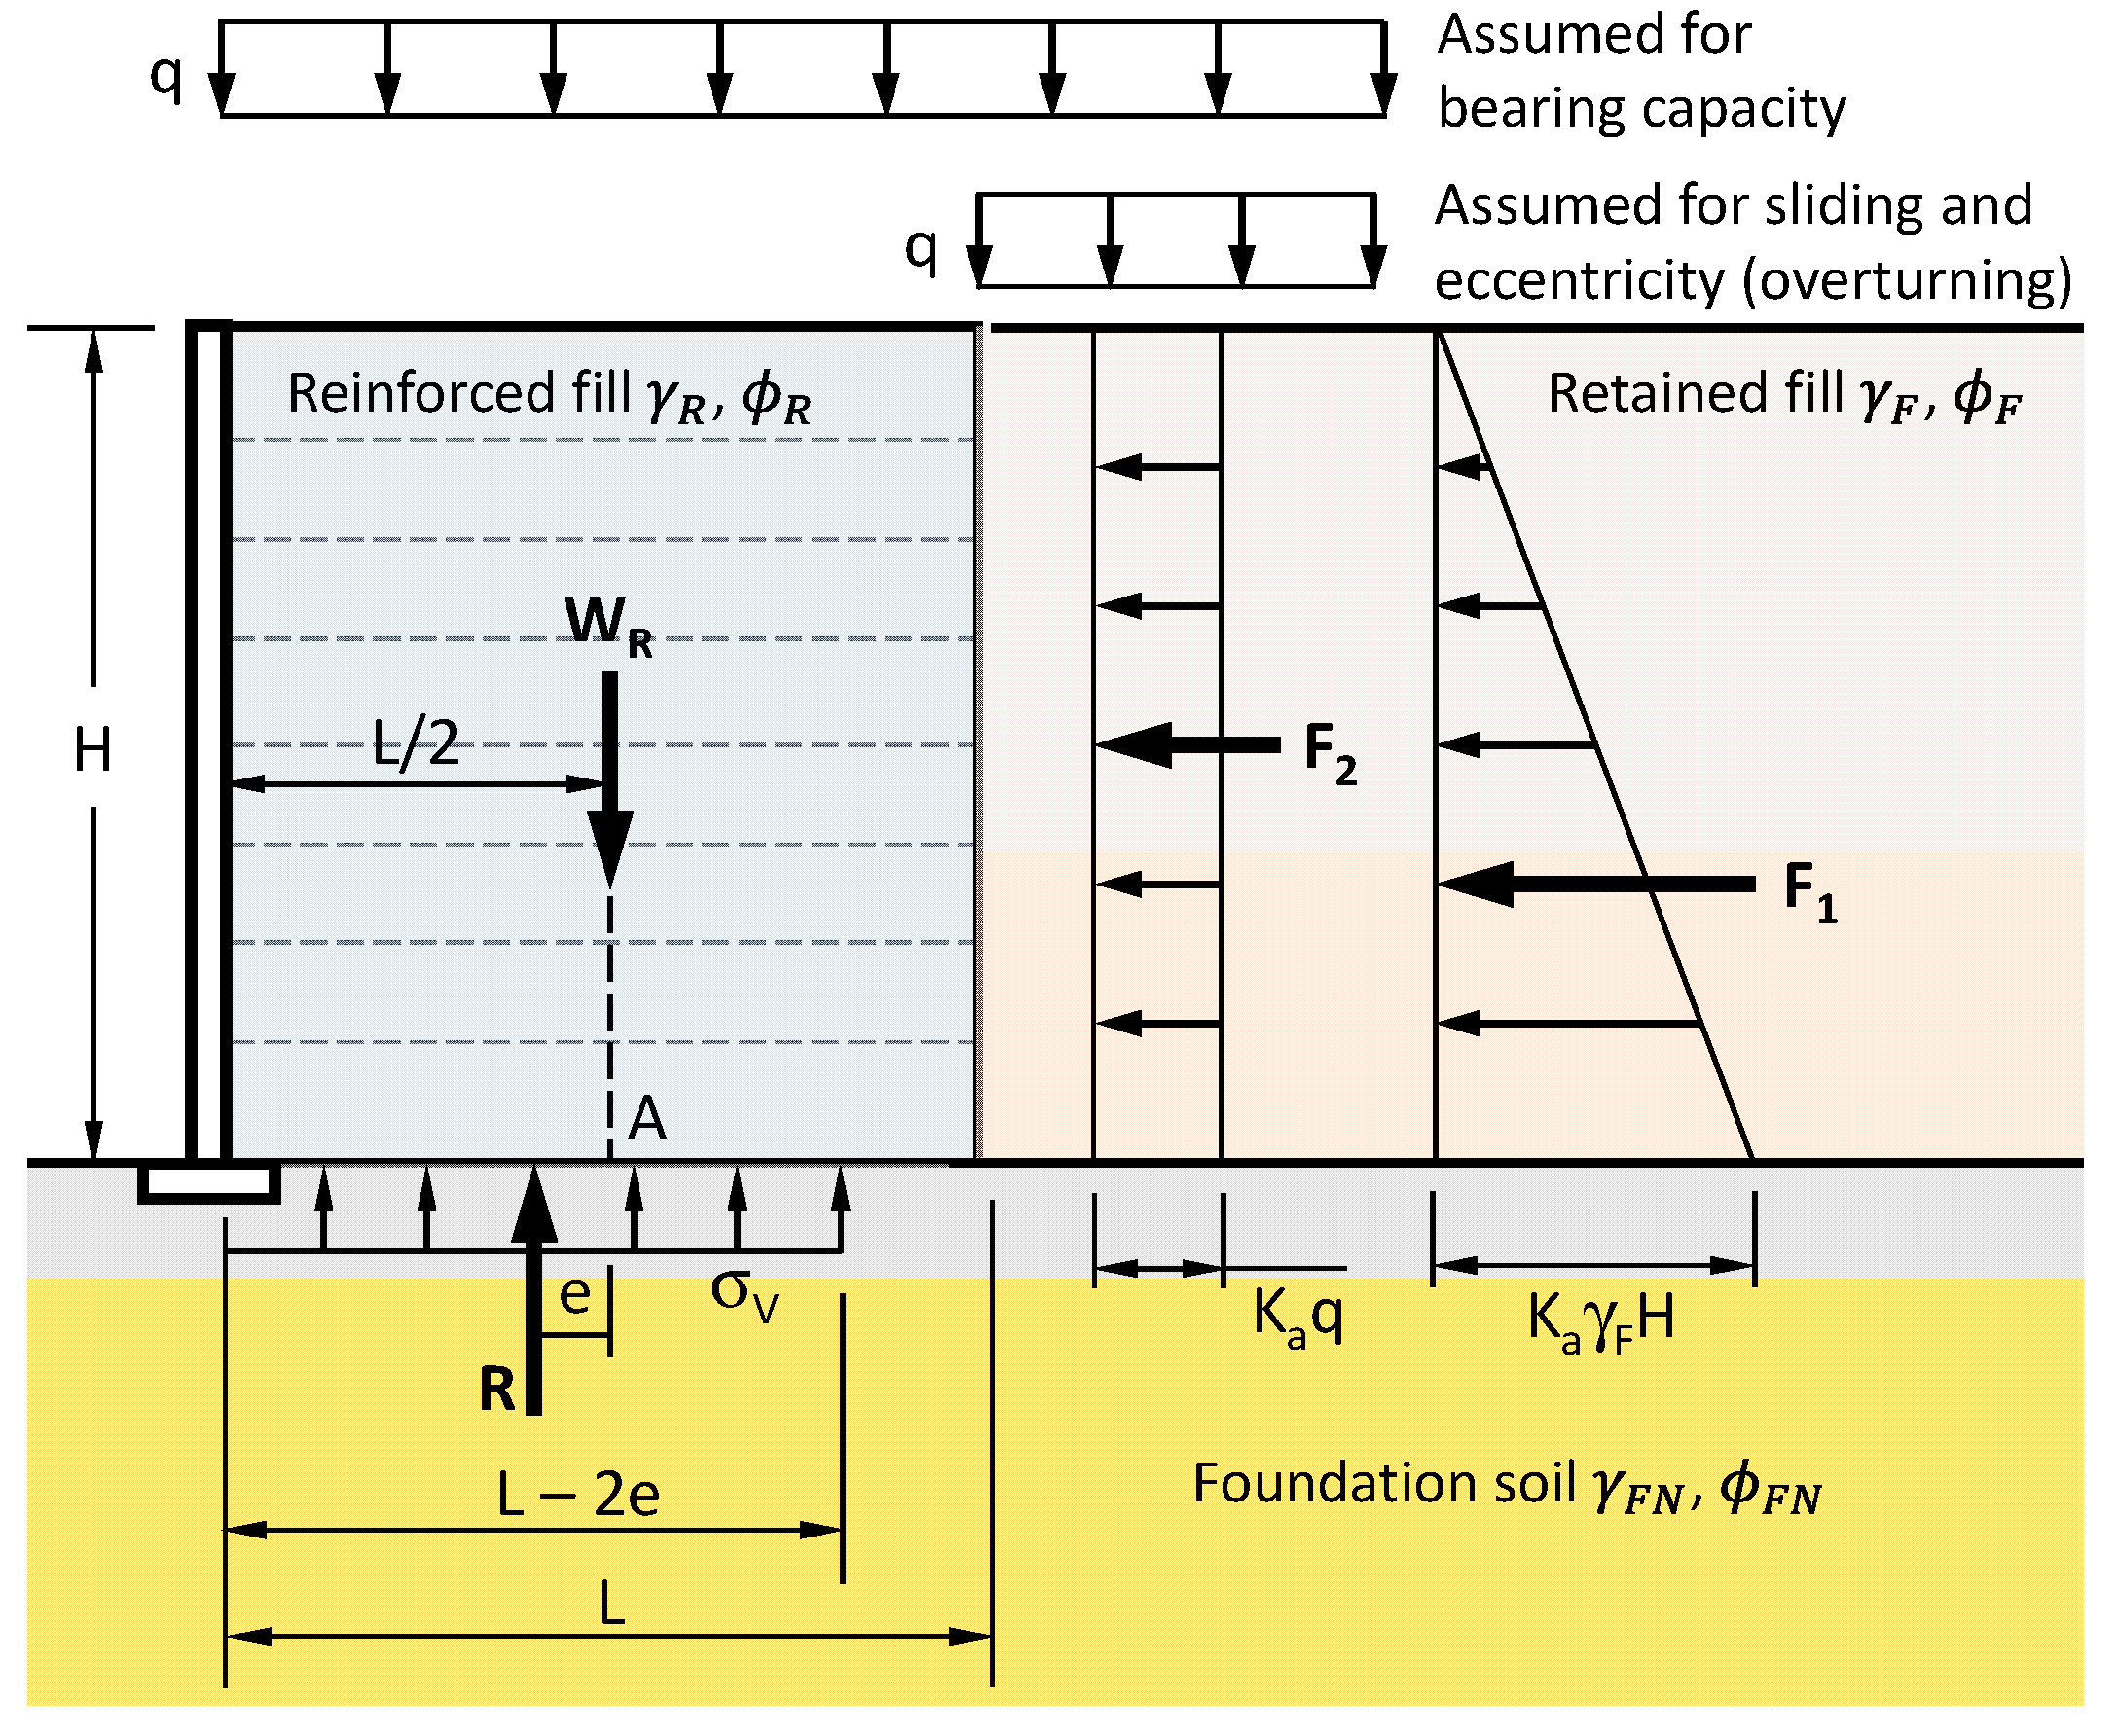
Figure 3 shows a schematic diagram of MSE wall with horizontal backfill and uniform live traffic surcharge. For sliding stability and eccentricity, continuous traffic surcharge loads are considered acting beyond the end of a reinforced zone. In contrast, the traffic surcharge loads are considered acting over reinforced and retained backfill zones for bearing capacity, as shown in Figure 3 [24].
Lateral forces acting on the MSE wall can be expressed as:
F 1 = 0.5 γ F H 2 K a
F 2 = q H K a
where F 1 = lateral force due to self-weight of the retained soil; F 2 = lateral force due to uniform live surcharge load, q , on the top of the retained soil; K a = tan 2 ( π 4 ϕ F 2 ) = active earth pressure coefficient; γ F = unit weight of retained fill; ϕ F = friction angle of retained fill; and H = MSE wall height.

2.4.1. Limit State Equation for Sliding Failure

Factored sliding force, R U , and factored resistance, R R , can be expressed as:
R U = 1.5 F 1 + 1.75 F 2
R R = 1.0 W R tan δ
where W R = γ R L H = self-weight of reinforced soil, δ = min ( ϕ R ,   ϕ F N ) = interface friction angle at the base of the MSE wall, ϕ R = reinforced soil friction angle, ϕ F N = foundation soil friction angle, and L = reinforcement length. Interface friction angle δ is taken as the minimum of reinforced soil friction angle ϕ R and foundation soil friction angle ϕ F N (Article 11.10.5.3 of AASHTO [24]). Load and resistance factors given in Table 1 and Table 2 are used in Equations (9) and (10).
The limit state equation for sliding failure is
G 1 ( x ) = R R R U = 1.0 W R tan δ ( 1.5 F 1 + 1.75 F 2 ) = γ R L H tan δ ( 0.75 γ F H 2 + 1.75 q H ) K a
The factor of safety at ultimate limit state, also termed as capacity/demand ratio ( C D R ), for sliding failure, is
C D R S L = R R R U = γ R L H tan δ ( 0.75 γ F H 2 + 1.75 q H ) K a

2.4.2. Limit State Equation for Eccentricity Failure

The location of the base reaction, R , is limited to the middle two-thirds of the base width for a soil foundation (Article 11.6.3.3 of AASHTO [24]). Therefore, the maximum eccentricity is
e m a x = L 3
Considering the moment equilibrium at point A (Figure 3), the base reaction eccentricity is given by
e = ( M O ) A ( M R ) A W R
where ( M O ) A and ( M R ) A are the summation of overturning and resisting moments, respectively, about point A ; W R = self-weight of reinforced soil. Factored overturning and resisting moments are given by
( M O ) A = 1.5 ( F 1 H / 3 ) + 1.75 ( F 2 H / 2 ) ,   ( M R ) A = 0
Substituting factored overturning and resisting moments in Equation (14) modifies to the following form
e = ( 0.25 γ F H 2 + 0.875 q H ) K a γ R L
The limit state equation for eccentricity is given by
G 2 ( x ) = e m a x e = L 3 ( 0.25 γ F H 2 + 0.875 q H ) K a γ R L
The capacity/demand ratio (CDR) for eccentricity failure is
C D R e = e m a x e = γ R ( 0.75 γ F H 2 + 2.625 q H ) K a

2.4.3. Limit State Equation for Bearing Capacity Failure

The traffic surcharge loads are considered acting over reinforced as well as retained backfill, therefore, the eccentricity, e B , of the base reaction is modified to following form.
e B = 1.5 ( F 1 H 3 ) + 1.75 ( F 2 H 2 ) 1.35 γ R L H + 1.75 q L = ( 0.25 γ F H 3 + 0.875 q H 2 ) K a 1.35 γ R L H + 1.75 q L
The factored ultimate bearing stress, σ V , at the base of the MSE wall is given by
σ V = 1.35 γ R L H + 1.75 q L L 2 e B
A uniform stress distribution can be assumed over a reduced area at the wall base instead of nonuniform distribution due to eccentric loading. According to Article 11.10.5.4 of AASHTO [24], this area is defined by a length equal to MSE wall length minus twice the eccentricity as shown in Figure 3.
The nominal bearing resistance for granular foundation soil with no cohesion is given by
q n = 0.5 ( L 2 e B ) γ F N N γ
where γ F N = unit weight of foundation soil, N γ = dimensionless bearing capacity factor. The dimensionless bearing capacity factors, based on Vesic [39], are given by
N γ = 2 [ e π tan ( ϕ F N ) tan ( π 4 + ϕ F N 2 ) + 1 ] tan ( ϕ F N )
The factored bearing resistance for granular foundation soil is expressed as
q R = 0.65 q n = 0.325 ( L 2 e B ) γ F N N γ
The limit state equation for bearing resistance is given by
G 3 ( x ) = q R σ V = 0.325 ( L 2 e B ) γ F N N γ 1.35 γ R L H + 1.75 q L L 2 e B
The capacity/demand ratio for bearing resistance is expressed as
C D R B C = q R σ V

2.5. Assessment of Uncertainties

Uncertain variables in sliding, overturning, and bearing capacity limit states are (1) unit weight, (2) friction angle, and (3) uniform live surcharge load.
Uncertainty of unit weight: Past studies [3,40,41,42,43,44] have reported the coefficient of variation (COV) of unit weight of soil, γ , in the range of 0.03 and 0.2. In this study, COV is taken as 0.05 for both compacted and uncompacted soils. A normal distribution of unit weight is assumed.
Uncertainty of friction angle: Active earth pressure coefficients and bearing capacity factors are calculated from critical-state friction angle, ϕ c . Previous studies [45,46,47] have reported the COV of friction angle of soil, ϕ c , in the range of 0.008 and 0.1. In this study, COV is taken as 0.025 following a lognormal distribution.
Uncertainty of uniform live surcharge q: To include vehicular load, an equivalent height of soil, h e q , is assumed on the top of MSE wall [24]., an equivalent height of soil, h e q , is considered on the top of the MSE wall to include vehicular load. Table 3 shows the equivalent soil height, h e q , for vehicular load on an abutment perpendicular to traffic, while Table 4 shows the same for vehicular load on MSE wall running parallel to traffic. Table 5 shows the live traffic surcharge values for different wall heights used in this study. In this study, COV is taken as 0.2 following a lognormal distribution.
Seven uncertain variables considered in the study are friction angle of reinforced fill, ϕ R ; friction angle of retained fill, ϕ F ; friction angle of the foundation soil, ϕ F N ; unit weight of reinforced fill, γ R ; unit weight of retained fill, γ F , unit weight of foundation soil, γ F N ; and uniform live surcharge load, q . Table 6 summarizes the distribution and statistics of these variables.

2.6. Process for Reliability-Based Optimization of MSE Wall

Considering a MSE wall of height, H , its length, L , is the design variable which needs to be optimized to obtain the minimum area. Past studies [25,26] suggest failure probability in the range of 0.1 to 0.0001 for retaining structures. The target reliability of 3, corresponding to failure probability of 0.0013 (or an approximate probability of a failure of 1 in 1000) is used in this study. The design space is considered as 0.4 H < L < 2 H . The problem can be expressed as
min C ( d ) = L H subject   to   β S L ,   β e , β B C 3
where C ( d ) = area of the MSE wall and β S L , β e , β B C are the reliability constraints for limit states of sliding, eccentricity, and bearing capacity, respectively. Constrained optimization by linear approximation (COBYLA) is used in multi-objective constrained optimization problem. The area of the MSE wall is minimized in the outer loop with the constraint as β i β T 0 . The reliability index β i is minimized in the inner loop with the constraint as limit state corresponding to the geotechnical design requirement.

3. Results and Discussion

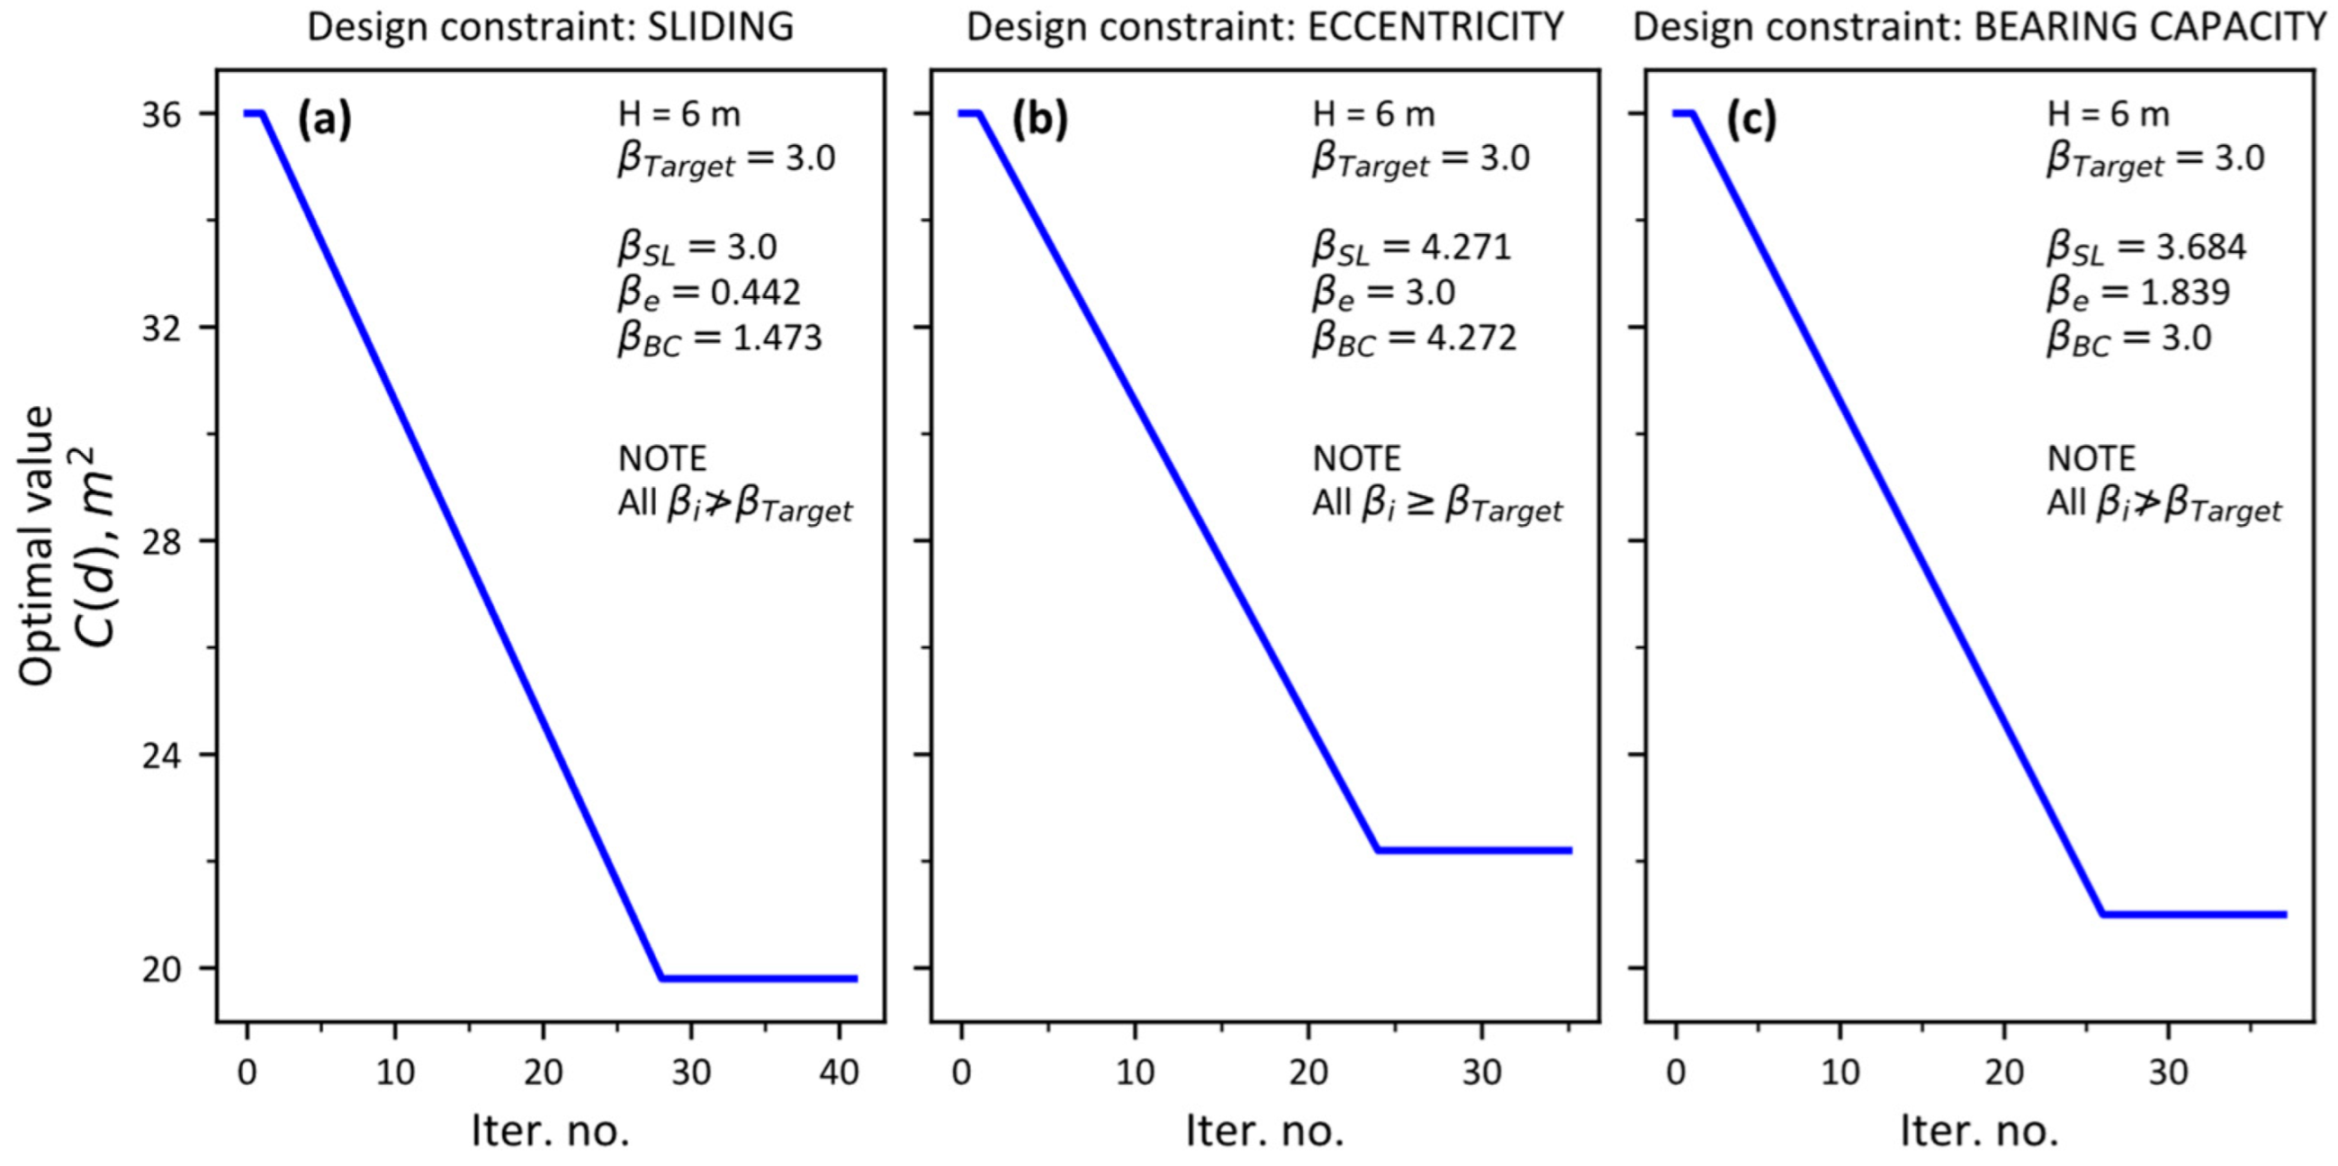
Reliability-based optimization (RBO) of the MSE wall for different heights ranging from H = 1.5 to 20 m is performed. The case 6-m high MSE wall is discussed to illustrate the process of RBO. The optimization process presented in Methodology section is implemented in Python 3.8 and open TURNS 1.16 [27,28]. The optimization results for the case of H = 6 m are shown in Table 7 and Figure 4, respectively. As seen in Table 7, three optimal scenarios are considered for limit states of sliding, eccentricity, and bearing capacity failures, respectively. These optimal scenarios are discussed as follows.
  • Optimal 1 is the optimized solution for limit state of sliding (i.e., β S L β T 0 ). Figure 4a shows the convergence of cost function. From the optimal 1 solution, reliability indices β e , β B C for other limit states (i.e., overturning and bearing capacity failures, respectively) are calculated. It is noted that both β e and β B C are less than β T , therefore, this scenario does not satisfy all reliability constraints (i.e., all β i β T ) and thus design requirements.
  • Optimal 2 is the optimized solution for limit state of eccentricity (i.e., β e β T 0 ). Figure 4b shows the convergence of cost function. From optimal 2 solution, reliability indices β S L , β B C for other limit states are calculated. In this case, all reliability constraints (i.e., all β i β T ) and design requirements are satisfied.
  • Optimal 3 is the optimized solution for limit state of bearing capacity (i.e., β B C β T 0 ). Figure 4c shows the convergence of the cost function. From this optimal solution, reliability indices β S L , β e for other limit states are calculated. It is noted that β e is less than β T , therefore, this solution also does not satisfy all reliability constraints (i.e., all β i β T ) and thus design requirements.
Table 7. Optimization results of MSE wall for H = 6 m height.
Optimal
Scenario
Design
Constraint
d L / H Reliability IndexRemarks
L (m)C(d) (m2) β S L 1 β e 2 β B C 3
Optimal 1Sliding3.41220.4700.5693.0000.4421.473All β i β T
Optimal 2Eccentricity3.84523.0690.6414.2713.0004.272All β i β T
Optimal 3Bearing Capacity3.63621.8160.6063.6841.8393.000All β i β T
1  β S L is reliability index for limit state of sliding. 2 β e is reliability index for limit state of overturning. 3 β B C is reliability index for limit state of bearing capacity.
Figure 4. Convergence of objective or cost (i.e., area) of the MSE wall of height H = 6 m for design constraints of (a) sliding, (b) overturning, and (c) bearing capacity failures, respectively.
Sustainability 14 04968 g004
Only optimal 2 is the solution where all reliability constraint requirements and thus geotechnical design requirements are satisfied. Thus, the optimized solution obtained with the design constraint of eccentricity failure satisfies all reliability constraints requirements. It can be concluded that design constraint of eccentricity is critical for MSE wall with the height of 6 m because β e = β T whereas other β values are greater than β T . Table 8 shows a comparison between the initial and optimized design for this case.
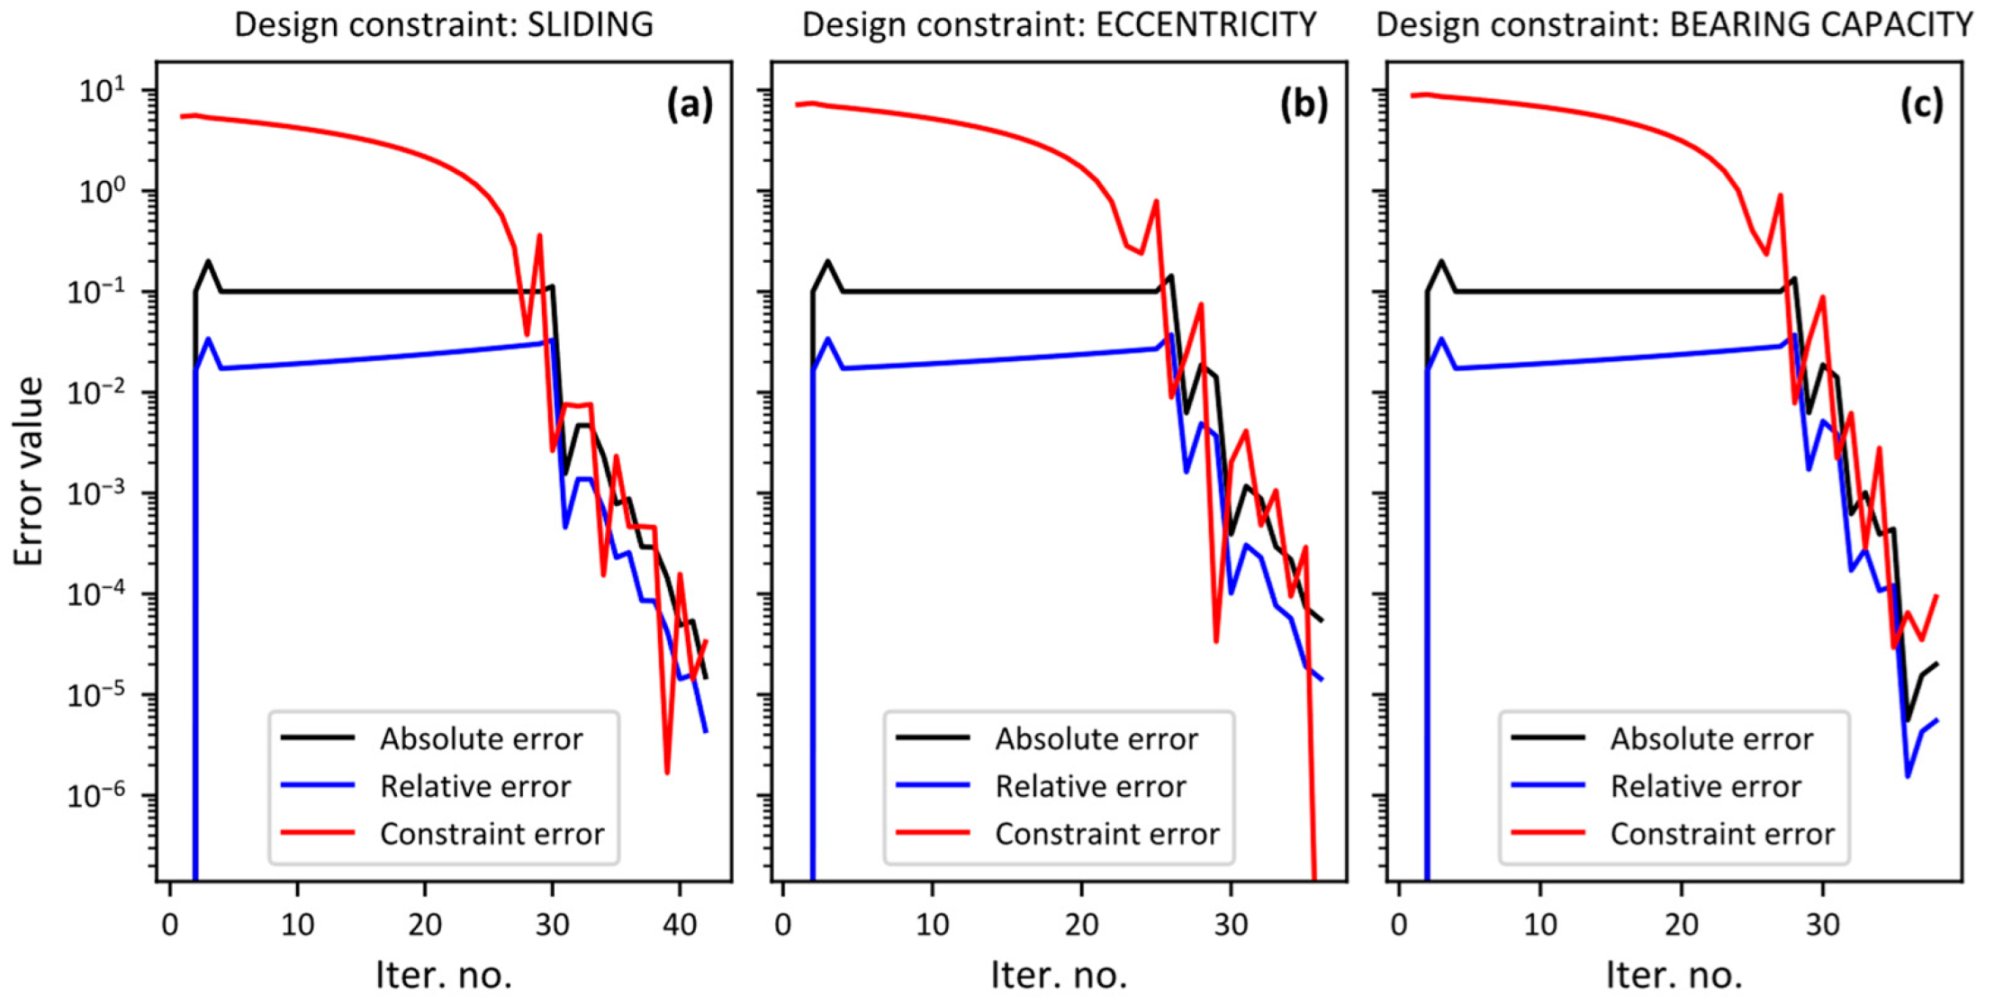
The evolution of absolute and relative error during the convergence of cost function as well as constraint error, ( β i β T ), during RBO of the MSE wall of height H = 6 m is shown in Figure 5. The absolute and relative error can be defined, respectively, as | X n + 1 X n | and | X n + 1 X n | /   | X n + 1 | where X n + 1 and X n are two consecutive approximations of the optimum.
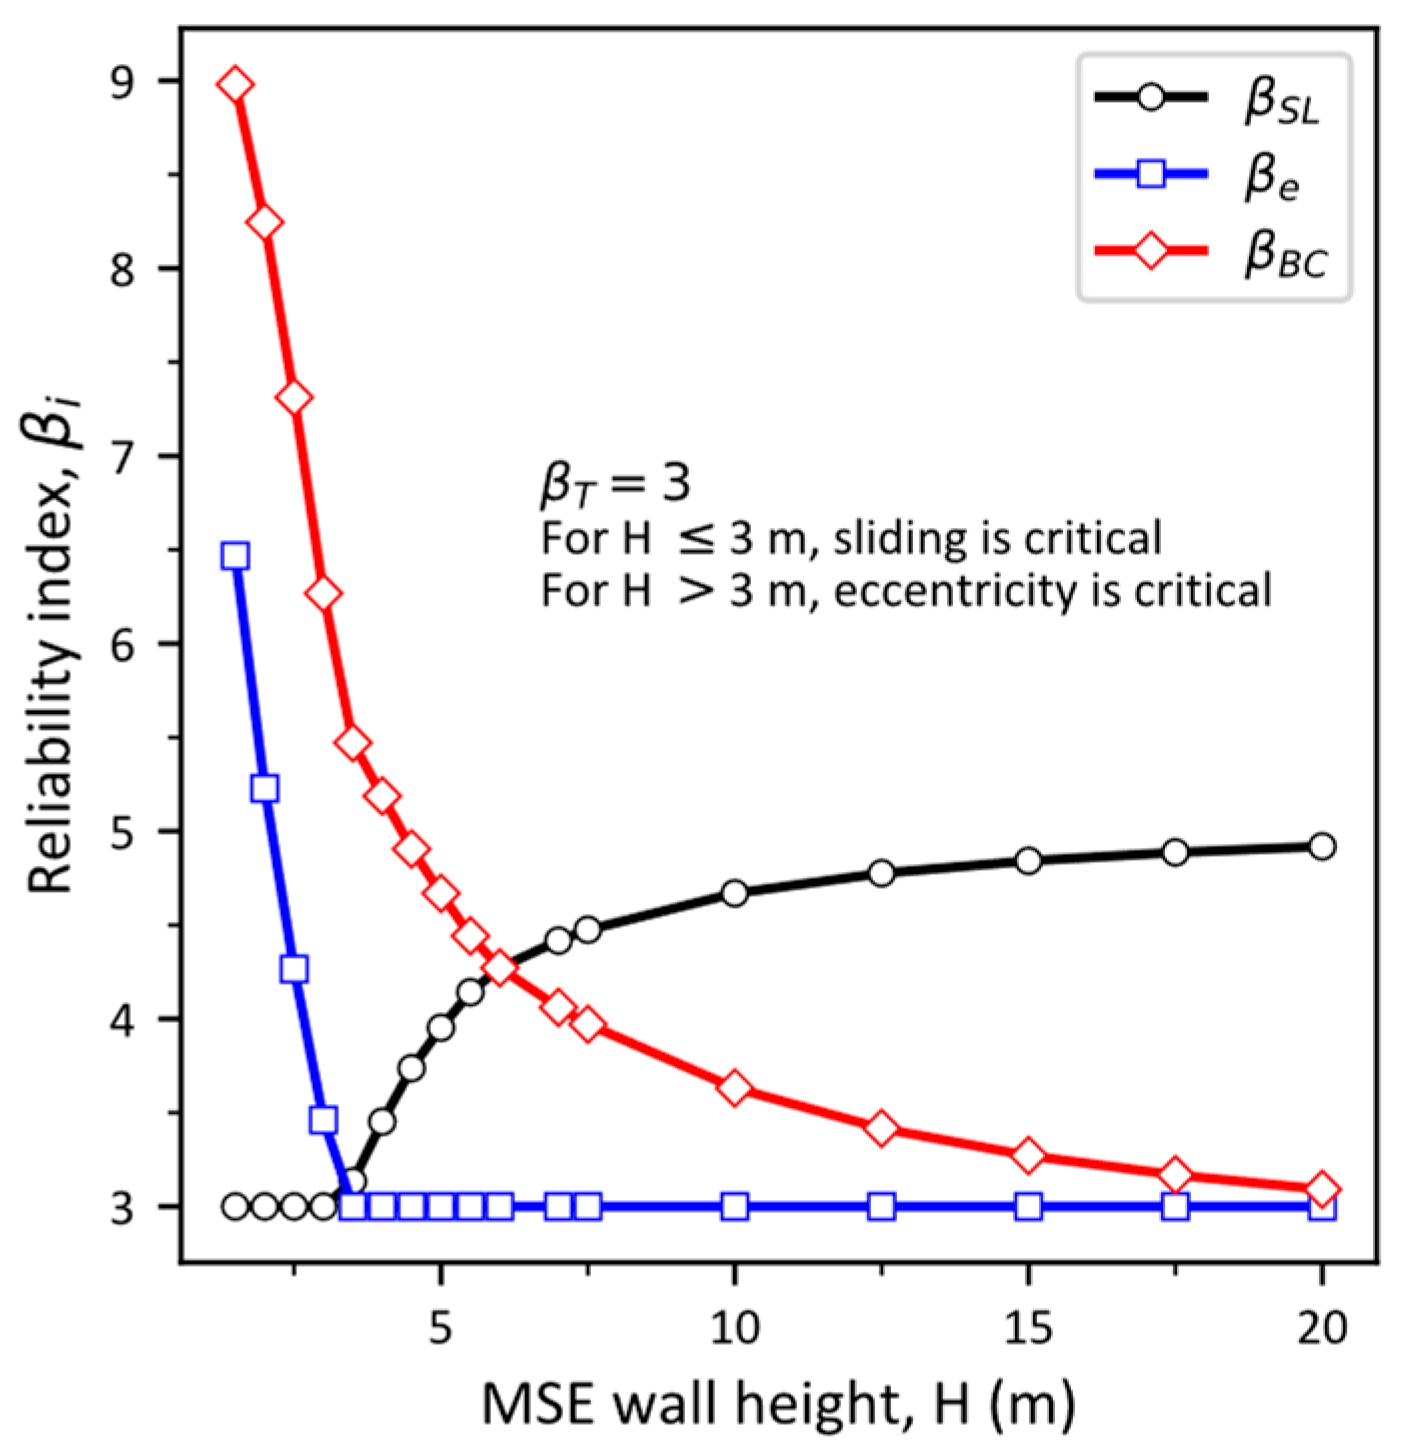
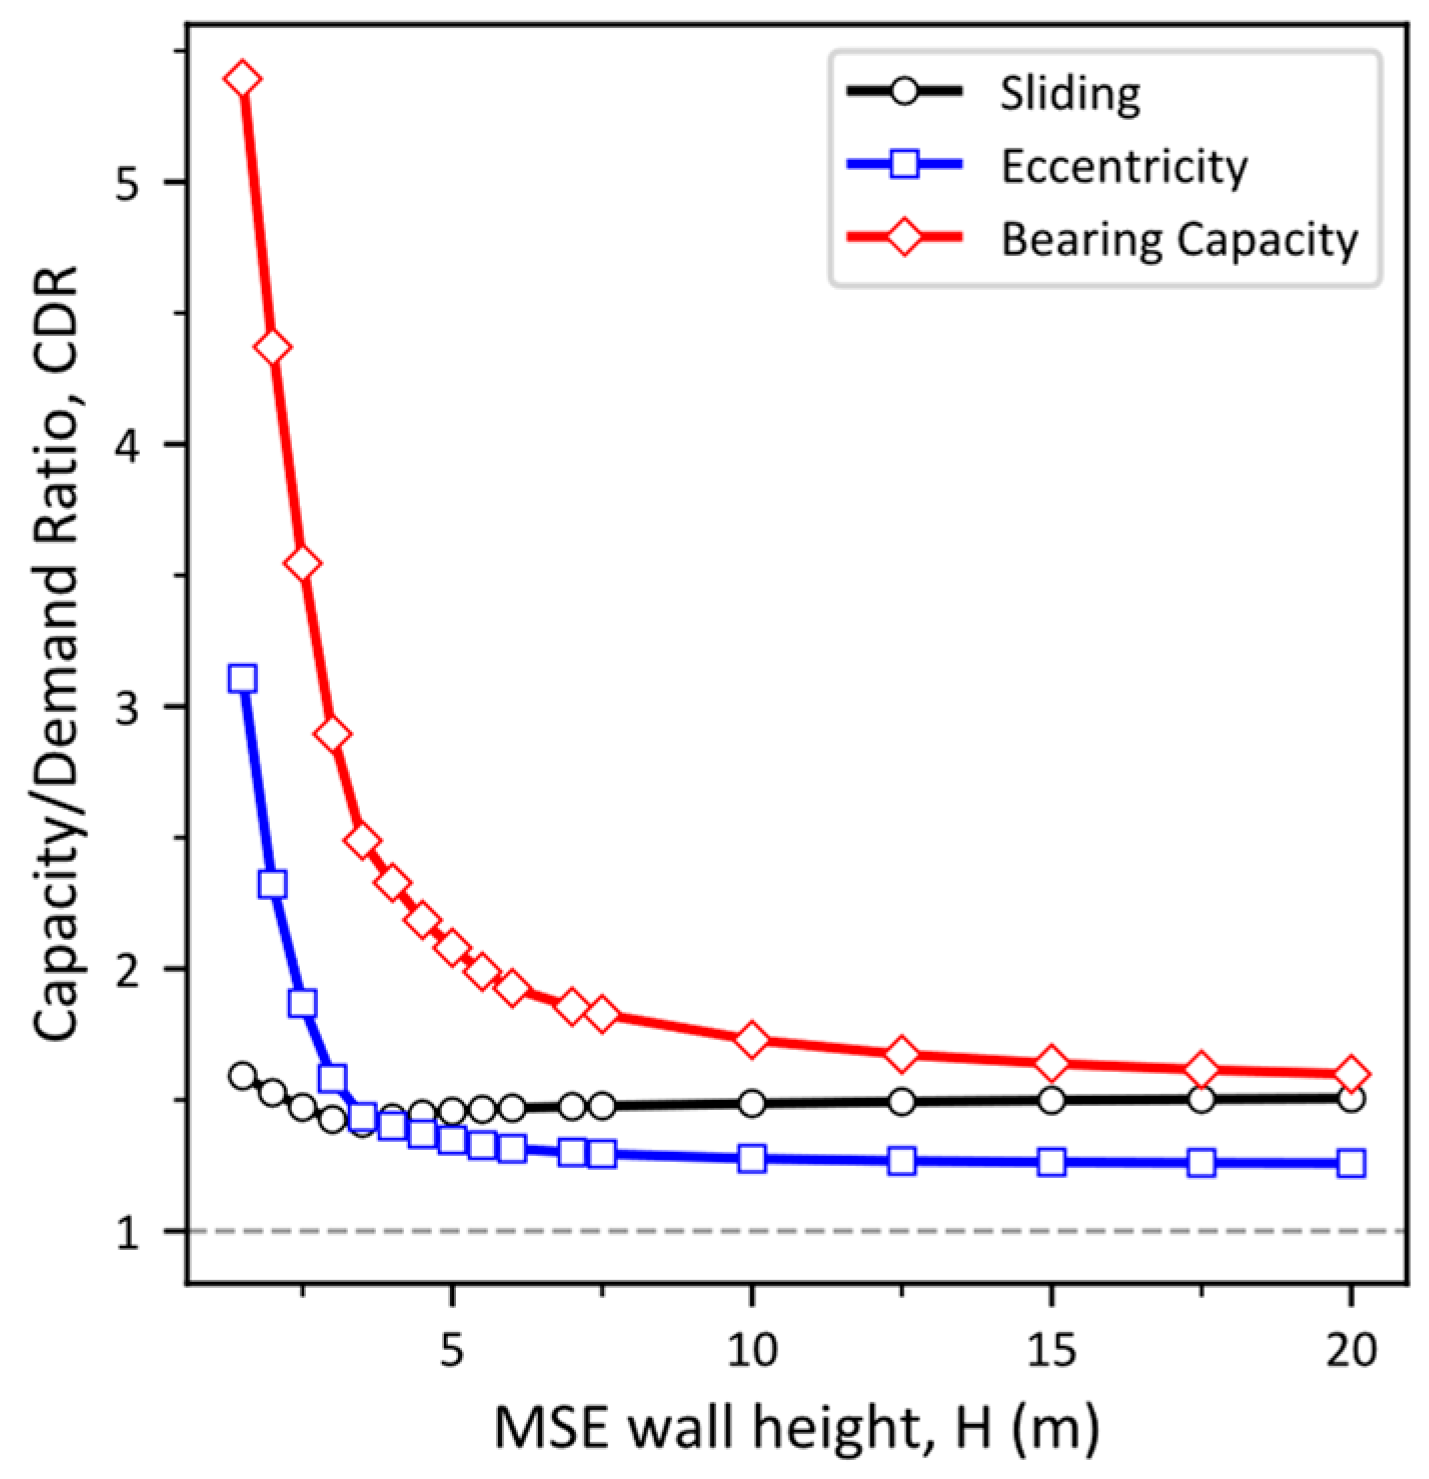
Results of reliability-based Optimization (RBO) of the MSE wall for different heights ranging from H = 1.5 to 20 m are shown in Figure 6 and Table 9, respectively. For the MSE wall of height H 3 m, sliding is governing limit state, whereas for H > 3 m, eccentricity is governing limit state (Figure 7). Since live traffic surcharge values (Table 5) are high for this height range (i.e., H 3 m) of the MSE wall, the sliding is governing limit state. Figure 8 shows that the capacity/demand ratio of the optimized design for each limit state is greater than the critical value of 1.
The importance factors (expressed as a percentage) of uncertain variables of the optimized design for different heights of the MSE wall are shown in Figure 9. The importance factors α i 2 of uncertain variables are defined as α i 2 = ( u i * ) 2 β 2 × 100 % [27] where u i * = design point in standard normal space and β = reliability index. It implies from the definition that α i 2 = 100 % . The conclusions drawn from this figure are: (a) at low heights of the MSE wall, the influence of live traffic surcharge, q , is dominant, which makes sliding as governing limit sate, (b) the influence of live traffic surcharge, q , decreases with the increase in the MSE wall height, (c) influence of reinforced-fill unit weight, γ R , increases with the increase in the MSE wall height and is prominent when design is based on limit state of eccentricity, (d) internal friction angle of reinforced-fill, ϕ R , does not influence external stability of the MSE wall at all, and (e) internal friction angle, ϕ F N , and unit weight, γ F N , of foundation soil has no influence as limit state of bearing capacity does not dictate design for any case of the MSE wall from H = 1.5 to 20 m.
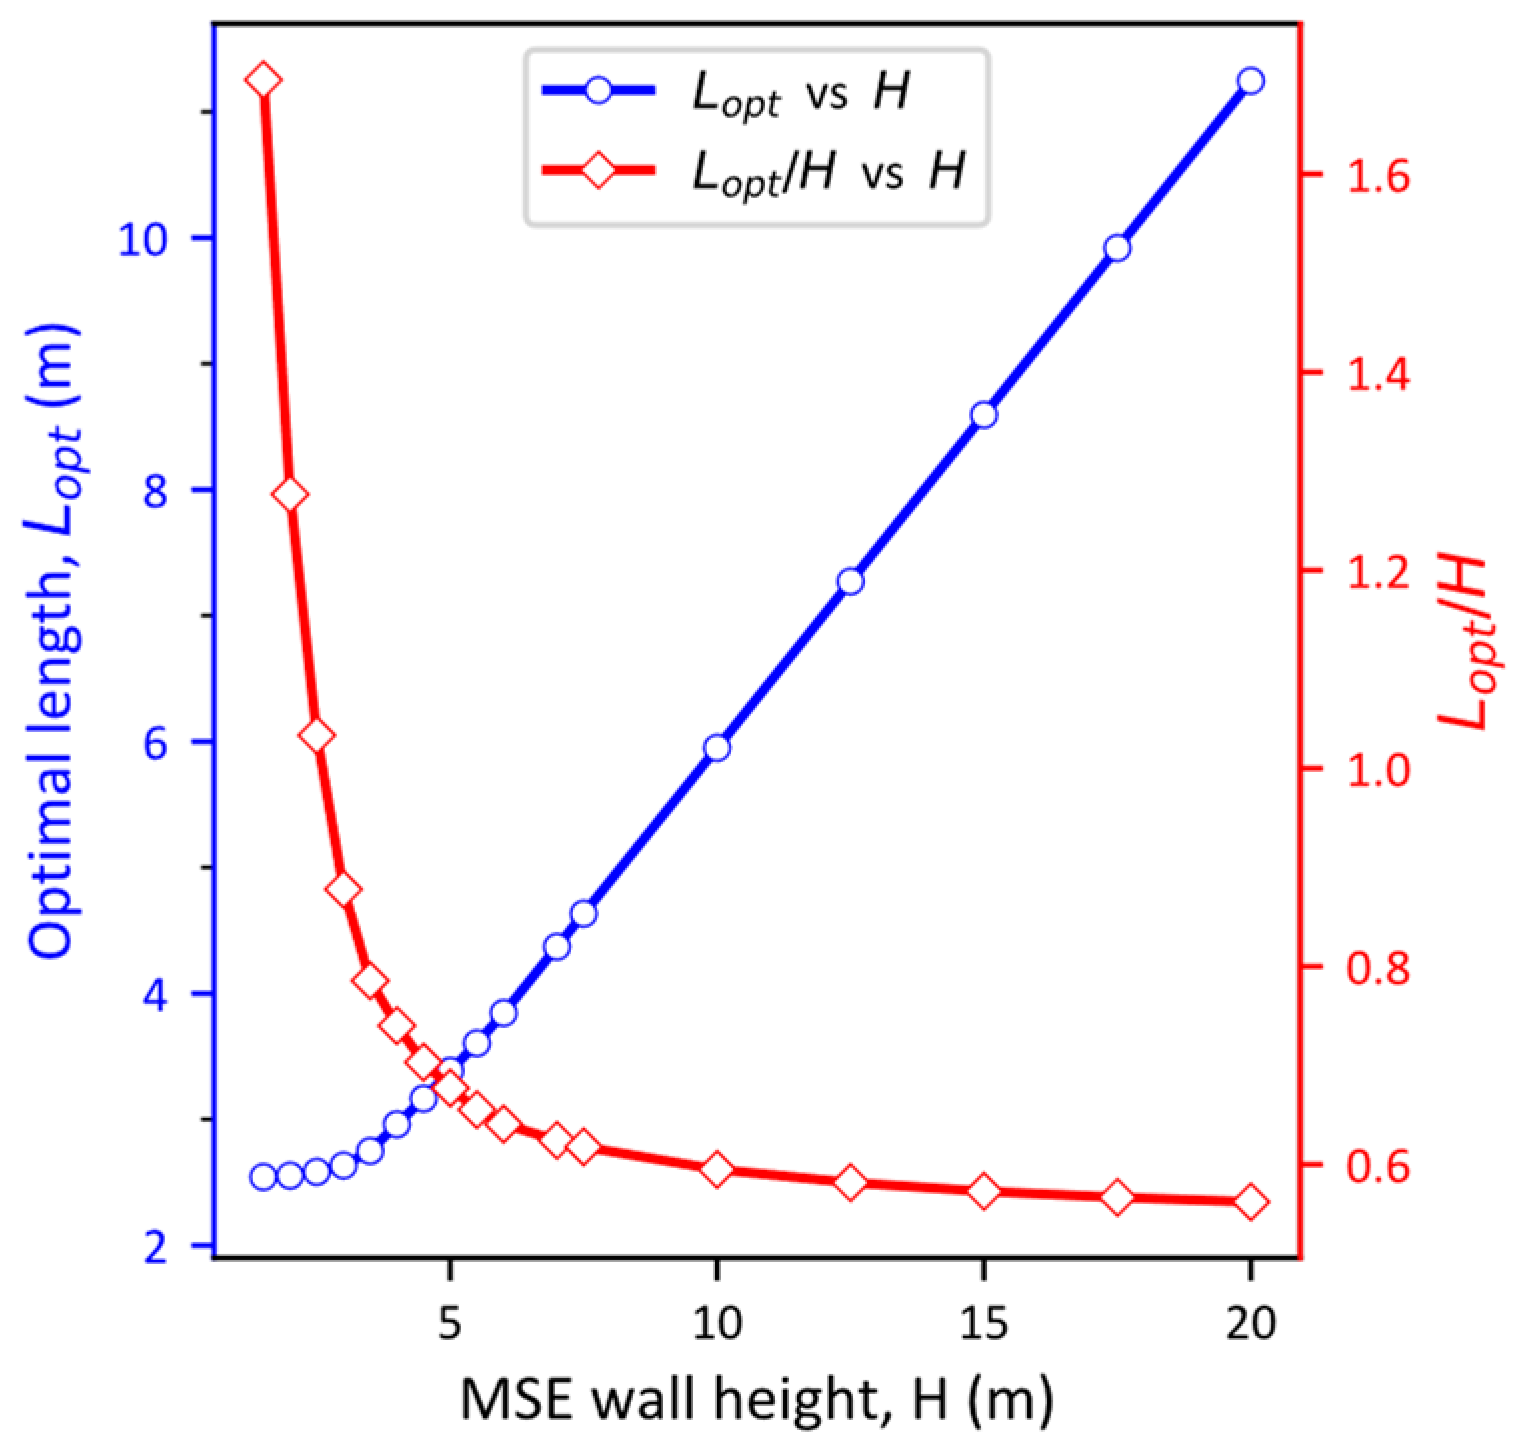
According to article 11.10.2 of AASHTO [24], the L / H ratio should not be less than 0.7. If the L / H ratio is set equal to 0.7 for H > 4.5 m, as per AASHTO [24] requirements, then actual reliability index of the design is well above the reliability index value of 3.0. Table 10 and Figure 10 show the optimized results modified for AASHTO’s minimum L / H ratio requirement. The relation between optimal length, L o p t and height, H of the MSE wall can be expressed by Equation (27) which is valid for external stability of MSE wall with horizontal backfill and live traffic surcharge founded on the cohesionless soils.
L o p t = 0.0954 H 2 0.369 H + 2.894   for H 4.5   m   ( β = 3 ) = 0.7 H   for H > 4.5   m   ( β > 3 )

4. Conclusions

Reliability-based optimization (RBO) of the MSE wall, for target reliability index of β T = 3, under ultimate limit state, considering external stability is presented. Constrained optimization with linear approximation (COBYLA) is used for minimization of the cost function (i.e., area) of the MSE wall. The limit states corresponding to external stability, i.e., sliding, eccentricity, and bearing capacity, respectively, are used. RBO is carried out as a two-loop constrained optimization problem with the outer loop to minimize area of MSE wall with constraint as target reliability index, and the inner loop to minimize the reliability index with constraints as geotechnical design requirements (i.e., limit states of sliding, eccentricity, and bearing capacity, respectively). RBO of the MSE wall, founded on cohesions soil, for different heights ranging from H = 1.5 to 20 m with horizontal back fill and live traffic surcharge are studied. The findings of this study summarized as follows:
1.
At the low height of the MSE wall (i.e., H 3 m), the influence of live traffic surcharge, q , is dominant (due to high q values recommended by AASHTO), making sliding as the governing limit state. The influence of traffic surcharge decreases with the increase in the MSE wall height. For H > 3 m, eccentricity is the governing limit state.
2.
The influence of reinforced-fill unit weight, γ R , increases with the increase in the MSE wall height and is prominent when the limit state of eccentricity governs the design.
3.
For H 4.5 m, length to height ratio of the optimized solution, L o p t / H , is greater than 0.7 (minimum requirement of AASHTO), and then it decreases below the minimum required value of 0.7 for H > 4.5 m.
4.
If L / H is kept as 0.7, as per AASHTO’s requirement, for H > 4.5 m, the actual reliability index of the design will be well above the target reliability index of 3.
Present study focuses on the external stability only. However, inclusion of limit states for internal stability (pullout and reinforcement failure) along with external stability is future interest of the authors.

Author Contributions

Conceptualization, Z.M.; methodology, Z.M. and M.U.Q.; software, Z.M.; validation, M.U.Q. and Z.A.M.; formal analysis, Z.M.; investigation, Z.M.; resources, Z.A.M.; data curation, M.U.Q. and Q.B.a.I.L.; writing—original draft preparation, Z.M.; writing—review and editing, M.U.Q. and Q.B.a.I.L.; visualization, Z.M.; supervision, Z.M.; project administration, M.U.Q.; funding acquisition, Z.A.M. All authors have read and agreed to the published version of the manuscript.

Funding

Prince Sultan University support paying the Article Processing Charges (APC) of this publication.

Institutional Review Board Statement

Not applicable.

Informed Consent Statement

Not applicable.

Data Availability Statement

Not applicable.

Acknowledgments

The authors would like to acknowledge the support of Prince Sultan University for paying the Article Processing Charges (APC) of this publication. The author would like to thank Prince Sultan University for their support.

Conflicts of Interest

The authors declare no conflict of interest.

References

  1. Casagrande, A. Role of the Calculated Risk in Earthwork and Foundation Engineering. J. Soil Mech. Found. Div. ASCE 1965, 91, 1–40. [Google Scholar] [CrossRef]
  2. Christian, J.T. Geotechnical Engineering Reliability: How Well Do We Know What We Are Doing? J. Geotech. Geoenviron. Eng. 2004, 130, 985–1003. [Google Scholar] [CrossRef]
  3. Phoon, K.K.; Kulhawy, F.H. Characterization of geotechnical variability. Can. Geotech. J. 1999, 36, 612–624. [Google Scholar] [CrossRef]
  4. Phoon, K.-K. Reliability-Based Design in Geotechnical Engineering: Computations and Applications; Taylor & Francis: London, UK; New York, NY, USA, 2008; ISBN 9780415396301 0415396301 9780203934241 (e-book) 0203934245 (e-book). [Google Scholar]
  5. Phoon, K.-K.; Ching, J. Risk and Reliability in Geotechnical Engineering; Phoon, K.-K., Ching, J., Eds.; CRC Press: Boca Raton, FL, USA, 2015; ISBN 9781482227215. [Google Scholar]
  6. Whitman, R. V Organizing and evaluating uncertainty in geotechnical engineering. J. Geotech. Geoenviron. Eng. ASCE 2000, 126, 583–593. [Google Scholar] [CrossRef]
  7. Phoon, K.-K.; Kulhawy, F.H. Evaluation of geotechnical property variability. Can. Geotech. J. 1999, 36, 625–639. [Google Scholar] [CrossRef]
  8. Baecher, G.B.; Christian, J.T. Reliability and Statistics in Geotechnical Engineering; John Wiley and Sons: Hoboken, NJ, USA, 2003; ISBN 9780471498339. [Google Scholar]
  9. Ang, A.H.-S.; Tang, W.H. Probability Concepts in Engineering: Emphasis on Applications in Civil Environmental Engineering, 2nd ed.; John Wiley and Sons: New York, NY, USA, 2007; ISBN 9780471720645. [Google Scholar]
  10. Valdebenito, M.A.; Schuëller, G.I. A survey on approaches for reliability-based optimization. Struct. Multidiscip. Optim. 2010, 42, 645–663. [Google Scholar] [CrossRef]
  11. Sayed, S.; Dodagoudar, G.R.; Rajagopal, K. Reliability analysis of reinforced soil walls under static and seismic forces. Geosynth. Int. 2008, 15, 246–257. [Google Scholar] [CrossRef]
  12. Basha, B.M.; Babu, G.L.S. Target reliability based design optimization of anchored cantilever sheet pile walls. Can. Geotech. J. 2008, 45, 535–548. [Google Scholar] [CrossRef]
  13. Babu, G.L.S.; Basha, B.M. Optimum design of cantilever sheet pile walls in sandy soils using inverse reliability approach. Comput. Geotech. 2008, 35, 134–143. [Google Scholar] [CrossRef]
  14. Basha, B.M.; Babu, G.L.S. Optimum Design for External Seismic Stability of Geosynthetic Reinforced Soil Walls: Reliability Based Approach. J. Geotech. Geoenviron. Eng. 2010, 136, 797–812. [Google Scholar] [CrossRef]
  15. Chalermyanont, T.; Benson, C.H. Reliability-Based Design for External Stability of Mechanically Stabilized Earth Walls. Int. J. Geomech. 2005, 5, 196–205. [Google Scholar] [CrossRef]
  16. Yang, K.-H.; Ching, J.; Zornberg, J.G. Reliability-Based Design for External Stability of Narrow Mechanically Stabilized Earth Walls: Calibration from Centrifuge Tests. J. Geotech. Geoenviron. Eng. 2011, 137, 239–253. [Google Scholar] [CrossRef]
  17. Zhang, J.; Zhang, L.M.; Tang, W.H. Reliability-Based Optimization of Geotechnical Systems. J. Geotech. Geoenviron. Eng. 2011, 137, 1211–1221. [Google Scholar] [CrossRef]
  18. Zhao, H.; Zhao, M.; Zhu, C. Reliability-based optimization of geotechnical engineering using the artificial bee colony algorithm. KSCE J. Civ. Eng. 2016, 20, 1728–1736. [Google Scholar] [CrossRef]
  19. Santos, M.G.C.; Silva, J.L.; Beck, A.T. Reliability-based design optimization of geosynthetic-reinforced soil walls. Geosynth. Int. 2018, 25, 442–455. [Google Scholar] [CrossRef]
  20. Mahmood, Z. Reliability-based optimization of geotechnical design using a constrained optimization technique. SN Appl. Sci. 2020, 2, 168. [Google Scholar] [CrossRef] [Green Version]
  21. Wu, Y.C.; Liu, C.N.; Lin, B.H. Reliability based design for deformation targeted segment mechanically stabilized earth wall. J. Geoengin. 2020, 15, 1–11. [Google Scholar] [CrossRef]
  22. Anderson, P.L.; Brabant, K. Increased Use of MSE Abutments. In Proceedings of the 22nd Annual International Bridge Conference, Pittsburg, PA, USA, 13–15 June 2005; Engineers Society of Western Pennsylvania (ESWP): Pittsburgh, PA, USA; pp. 375–382. [Google Scholar]
  23. Kim, D.; Salgado, R. Load and Resistance Factors for External Stability Checks of Mechanically Stabilized Earth Walls. J. Geotech. Geoenviron. Eng. 2012, 138, 241–251. [Google Scholar] [CrossRef]
  24. AASTHO. LRFD Bridge Design Spesifications; TRID: Grapevine, TX, USA, 2014; ISBN 0003-4932. [Google Scholar]
  25. Baecher, G.B. Geotechnical Risk Analysis User’s Guide, FHWA-RD-87-011; ROSAP: McLean, VA, USA, 1987. [Google Scholar]
  26. Chalermyanont, T.; Benson, C.H. Reliability-Based Design for Internal Stability of Mechanically Stabilized Earth Walls. J. Geotech. Geoenviron. Eng. 2004, 130, 163–173. [Google Scholar] [CrossRef]
  27. Open TURNS Open Treatment of Uncertainties, Risk’s aNd Statistics, An Open Source Source Platform. Available online: https://www.researchgate.net/publication/29605221_OpenTURNS_an_Open_Source_initiative_to_Treat_Uncertainties_Risks′N_Statistics_in_a_structured_industrial_approach (accessed on 12 March 2022).
  28. Baudin, M.; Dutfoy, A.; Iooss, B.; Popelin, A.-L. OpenTURNS: An Industrial Software for Uncertainty Quantification in Simulation. In Handbook of Uncertainty Quantification; Ghanem, R., Higdon, D., Owhadi, H., Eds.; Springer International Publishing: Cham, Switzerland, 2016; ISBN 978-3-319-11259-6. [Google Scholar]
  29. Hasofer, A.M.; Lind, N.C. An exact and invariant second-moment code format. J. Eng. Mech. Div. 1974, 100, 111–121. [Google Scholar] [CrossRef]
  30. Liu, P.L.; Der Kiureghian, A. Multivariate distribution models with prescribed marginals and covariances. Probabilistic Eng. Mech. 1986, 1, 105–112. [Google Scholar] [CrossRef]
  31. Hohenbichler, M.; Rackwitz, R. NON-NORMAL DEPENDENT VECTORS IN STRUCTURAL SAFETY. ASCE J. Eng. Mech. Div. 1981, 107, 1227–1238. [Google Scholar] [CrossRef]
  32. Lu, Z.H.; Cai, C.-H.; Zhao, Y.-G. Structural Reliability Analysis Including Correlated Random Variables Based on Third-Moment Transformation. J. Struct. Eng. 2017, 143, 04017067. [Google Scholar] [CrossRef]
  33. Lu, Z.H.; Cai, C.H.; Zhao, Y.G.; Leng, Y.; Dong, Y. Normalization of correlated random variables in structural reliability analysis using fourth-moment transformation. Struct. Saf. 2020, 82, 101888. [Google Scholar] [CrossRef]
  34. Low, B.K.; Tang, W.H. Efficient Spreadsheet Algorithm for First-Order Reliability Method. J. Eng. Mech. 2007, 133, 1378–1387. [Google Scholar] [CrossRef]
  35. Youn, B.D.; Choi, K.K.; Du, L. Adaptive probability analysis using an enhanced hybrid mean value method. Struct. Multidiscip. Optim. 2005, 29, 134–148. [Google Scholar] [CrossRef]
  36. Powell, M.J.D. A Direct Search Optimization Method That Models the Objective and Constraint Functions by Linear Interpolation. In Advances in Optimization and Numerical Analysis; Gomez, S., Hennart, J., Eds.; Springer: Dordrecht, The Netherlands, 1994; pp. 51–67. [Google Scholar]
  37. Powell, M.J.D. Direct search algorithms for optimization calculations. Acta Numer. 1998, 7, 287–336. [Google Scholar] [CrossRef]
  38. Ingold, T.S. Reinforced Earth; Thomas Telford Limited: London, UK, 1982. [Google Scholar]
  39. Vesic, A.S. Analysis of ultimate loads of shallow foundations. ASCE J. Soil Mech. Found. Div. 1973, 99, 45–73. [Google Scholar] [CrossRef]
  40. Hummit, G.M. Statistical Analysis of Data from a Comparative Laboratory Test Program Sponsored by ACIL; No. AEWES-Misc Paper-4-785; U.S. Army Engineer Waterways Experiment Station Vicksburg Ms Geotechnical Lab: Vicksburg, MS, USA, 1966. [Google Scholar]
  41. Foye, K.C.; Salgado, R.; Scott, B. Assessment of Variable Uncertainties for Reliability-Based Design of Foundations. J. Geotech. Geoenviron. Eng. 2006, 132, 1197–1207. [Google Scholar] [CrossRef]
  42. Wolff, T.F. Evaluating the Reliability of Existing Levees, Technical Report; U.S. Army Engineer Waterways Experiment Station Geotechnical Laboratory: Vicksburg, MS, USA, 1994. [Google Scholar]
  43. Lacroix, Y.; Horn, H.M. Direct Determination and Indirect Evaluation of Relative Density and Its Use on Earthwork Construction Projects. In Evaluation of Relative Density and its Role in Geotechnical Projects Involving Cohesionless Soils; Selig, E.T., Ladd, R.S., Eds.; ASTM International: West Conshohocken, PA, USA, 1973; pp. 251–280. ISBN 978-0-8031-5534-3. [Google Scholar]
  44. Munwar Basha, B.; Sivakumar Babu, G.L. Reliability assessment of internal stability of reinforced soil structures: A pseudo-dynamic approach. Soil Dyn. Earthq. Eng. 2010, 30, 336–353. [Google Scholar] [CrossRef]
  45. Negussey, D.; Wijewickreme, W.K.D.; Vaid, Y.P. Constant-volume friction angle of granular materials. Can. Geotech. J. 1988, 25, 50–55. [Google Scholar] [CrossRef]
  46. Verdugo, R.; Ishihara, K. The Steady State of Sandy Soils. Soils Found. 1996, 36, 81–91. [Google Scholar] [CrossRef] [Green Version]
  47. Low, B.K. Reliability-based design applied to retaining walls. Geotechnique 2005, 55, 63–75. [Google Scholar] [CrossRef]
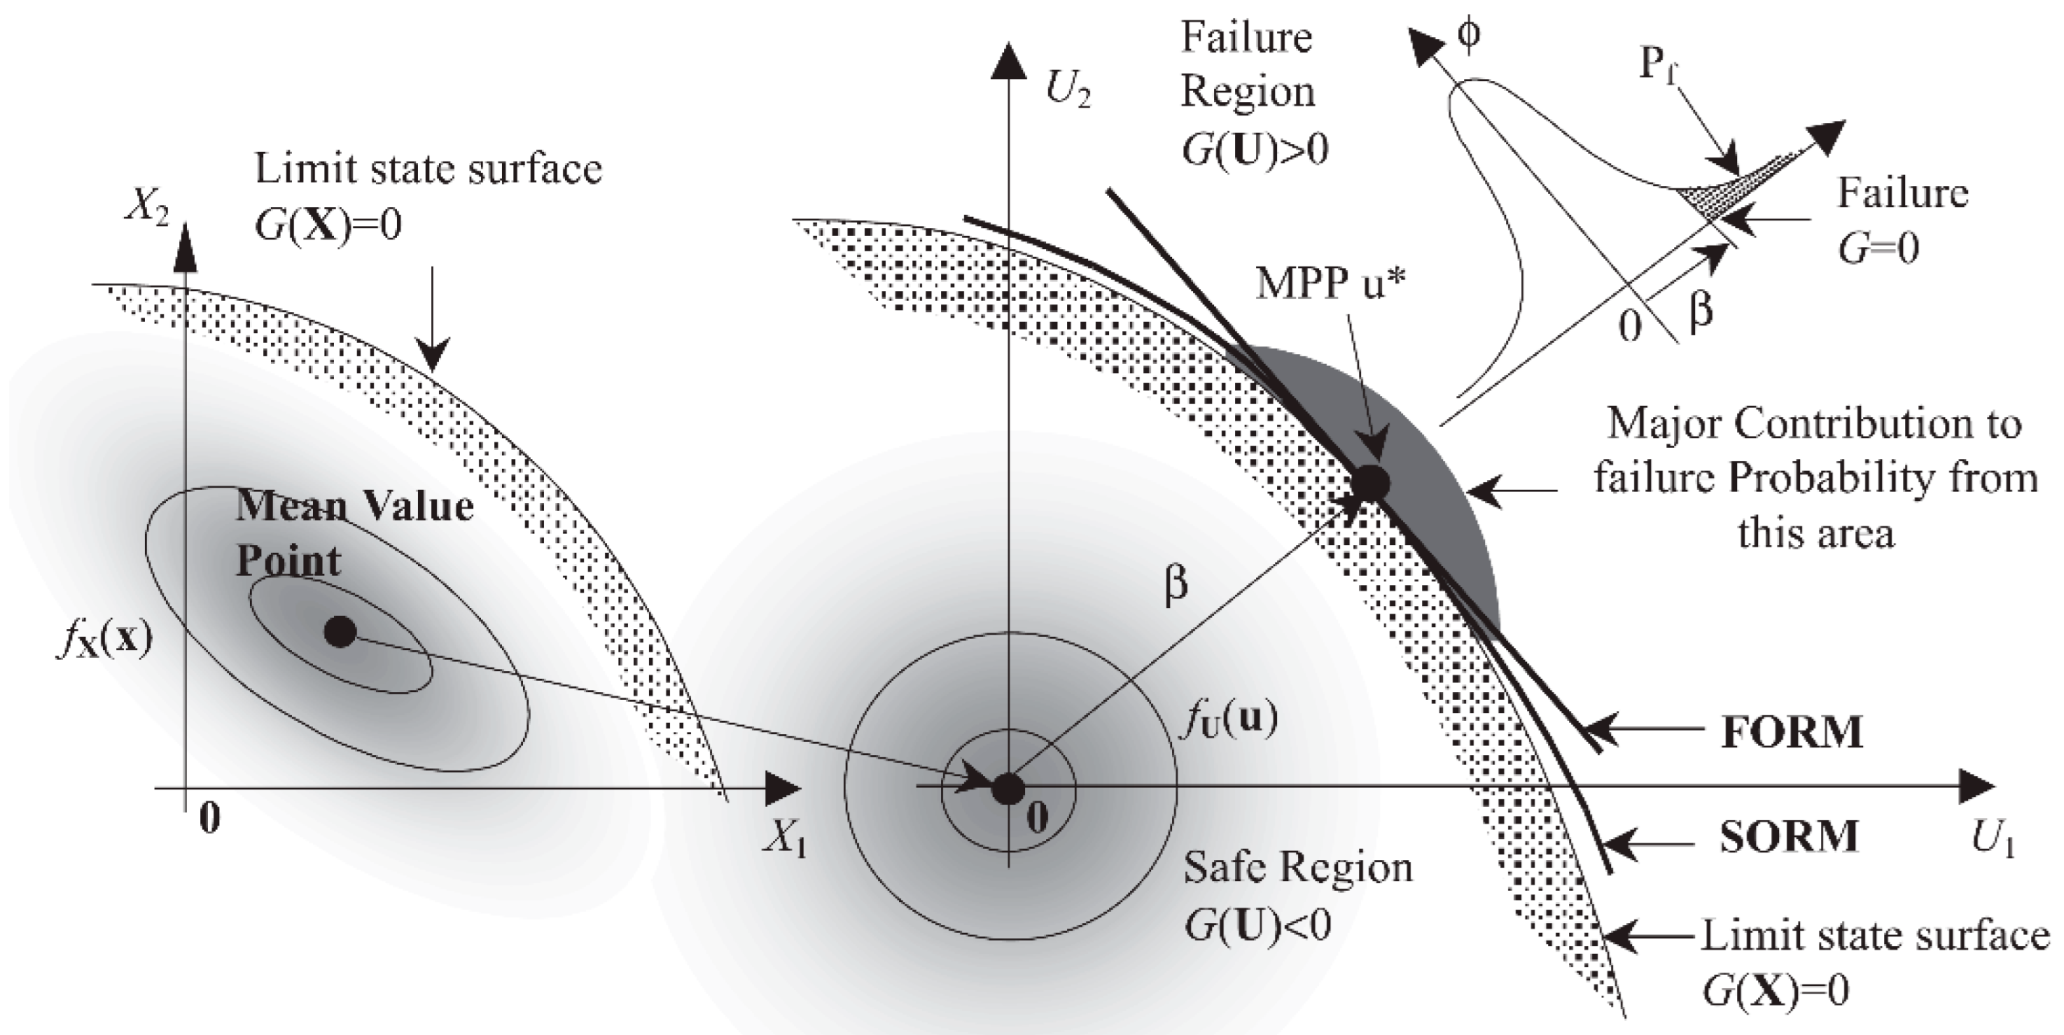
Figure 1. First- and second-order reliability methods.
Sustainability 14 04968 g001
Figure 2. Flowchart for reliability-based optimization.
Sustainability 14 04968 g002
Figure 3. External stability for MSE wall with horizontal backfill and traffic surcharge.
Sustainability 14 04968 g003
Figure 5. Evolution of absolute, relative error of cost function and constraint error during RBO of the MSE wall of height H = 6 m for design constraints of (a) sliding, (b) overturning, and (c) bearing capacity failures, respectively.
Sustainability 14 04968 g005
Figure 6. Reliability-based optimized results of the MSE wall for β T = 3.
Sustainability 14 04968 g006
Figure 7. Reliability indices of the optimized design.
Sustainability 14 04968 g007
Figure 8. Capacity/demand ratio of the optimized design.
Sustainability 14 04968 g008
Figure 9. Importance factors of uncertain variables of optimized design for different height of the MSE wall. (a) H = 1.5 m, (b) H = 3 m, (c) H = 6 m, (d) H = 10 m, (e) H = 15 m, and (f) H = 20 m.
Sustainability 14 04968 g009
Figure 10. Reliability-based optimized results modified for AASHTO’s minimum length requirement (a) relationship between optimal length, L o p t , and height, H (b) relationship between L o p t / H and height, H .
Sustainability 14 04968 g010
Table 1. Summary of load factors.
Load FactorDescriptionValue and Its Description
LF E V Vertical pressure from dead load of earth fill1.00
1.35
For sliding & eccentricity
For bearing capacity
LF E H Horizontal earth load1.50
1.50
For sliding & eccentricity
For bearing capacity
LF L S _ V Vertical pressure from live surcharge load1.75For bearing capacity
LF L S _ H Horizontal pressure from live surcharge load1.75For sliding, eccentricity & bearing capacity
Table 2. Summary of resistance factors.
Resistance FactorDescriptionValue
RF S L Sliding resistance1.0
RF B C Bearing resistance0.65
Table 3. Equivalent height of soil for vehicular loading on abutment perpendicular to traffic.
MSE Wall Height H (m)heq (m) q 0 a   ( kN / m )
1.51.224
3.00.918
≥6.00.612
a unit weight of soil is taken as 20 kN/m3 for vehicular loading.
Table 4. Equivalent height of soil for vehicular loading on abutment parallel to traffic.
MSE Wall
Height H (m)
heq (m)
Distance from Wall Backface to Edge of Traffic = 0 mDistance from Wall Backface to the Edge of Traffic ≥ 0.3 m
1.51.50.6
3.01.050.6
≥6.00.60.6
Table 5. Equivalent height of soil for vehicular loading used in this study.
MSE Wall Height H (m)heq (m)q a (kN/m)
1.51.2024
2.01.0921.8
2.50.9919.8
3.00.9018
3.50.8216.4
4.00.7615.2
4.50.7014
5.00.6613.2
5.50.6212.4
≥6.00.6012
a unit weight of soil is taken as 20 kN/m3 for vehicular loading.
Table 6. Distribution and statistics of uncertain variables.
VariableDistributionMeanCOVStd. Dev.
ϕ R (o)Lognormal360.0250.9
γ R (kN/m3)Normal200.0501
ϕ F (o)Lognormal300.0250.75
γ F (kN/m3)Normal180.0500.9
ϕ F N (o)Lognormal330.0250.825
γ F N (kN/m3)Normal180.0500.9
q (kN/m2)Lognormalvaries0.2varies
Table 8. Summary of optimization results of MSE wall for H = 6 m height.
State d L / H Reliability Index
L (m)C(d) (m2) β S L β e β B C
Initial63618.45810.16711.812
Optimized3.84523.0690.6414.2713.0004.272
Table 9. Optimization results of the MSE wall for β T = 3 for heights ranging from H = 1.5 m to 20 m.
H ( m ) Reliability IndexCritical Limit State L o p t / H
β S L β e β B C
1.536.4688.98SL1.695
235.2288.246SL1.277
2.534.2657.312SL1.033
333.4616.268SL0.878
3.53.13435.472e0.786
43.45235.188e0.740
4.53.73734.905e0.703
53.95334.669e0.677
5.54.14234.442e0.655
64.27134.272e0.641
74.41734.061e0.624
7.54.47533.971e0.618
104.66933.631e0.595
12.54.77633.416e0.582
154.84233.271e0.573
17.54.88733.168e0.567
204.91933.091e0.562
Table 10. Optimization results for β T = 3 modified for AASHTO’s minimum L / H ratio requirements.
H (m) L o p t / H Reliability   Index ,   β
1.51.6953
21.2773
2.51.0333
30.8783
3.50.7863
40.7403
4.50.7033
50.73.595
5.50.74.230
60.74.701
70.75.292
7.50.75.549
100.76.470
12.50.76.858
150.77.105
17.50.77.274
200.77.397
Publisher’s Note: MDPI stays neutral with regard to jurisdictional claims in published maps and institutional affiliations.