Abstract
Urban system is a complex entirety composed of various subsystems, including land, population, economy, and society. The coordinated development of these subsystems is important for ensuring the advancement and improvement of the new urbanization process. Quantitatively evaluating the coordinated development level of a city or urban agglomeration is conducive to scientific urban planning and decision-making. In this paper, we constructed a multi-index evaluation system that includes land urbanization, population urbanization, economic urbanization, and social urbanization indicators to assess the degree of coordinated urbanization development. Experiments were then conducted in the central area of the Yangtze River Delta (YRD) from 2000 to 2019 using remote sensing images and statistical yearbook data. The driving factors of the urbanization evolution were also evaluated by the Geographically and Temporally Weighted Regression (GTWR) model. The conclusions were drawn as follows: (1) The degree of coordinated urbanization development in the study area was constantly improving, from an extremely uncoordinated level in 2000 to a high-quality coordinated level in 2019; (2) During the period 2000–2019, the distribution of the cities with high coordinated development levels presented a northwest-southeast pattern, and the gravity center of the region constantly moved to the south; (3) In terms of the impact of various urbanization subsystems on the coordinated urbanization development in the YRD, economic urbanization had the greatest impact, while land urbanization had the least impact. (4) In connection with the problems existing in different dimensions of urbanization, we put forward corresponding development countermeasures and path suggestions based on the actual situation of the study area.
1. Introduction
Urbanization is a multidimensional and complex process. Rapid urbanization often leads to uncoordinated development among internal subsystems, which frequently leads to the occurrence of incomplete urbanization, resulting in various problems such as arable land loss and soaring house prices [1,2]. In 2007, Lu et al. pointed out in a report that “China’s land urbanization has exceeded the population urbanization”, which attracted the Chinese government’s attention. At present, the urbanization of China is gradually entering a mature period, in which the development quality of urbanization is particularly important [3,4]. The new urbanization plan of China proposes to realize high-quality urbanization with “people” as its core. This means that the coordinated development of population, economy, land, and society is critically important in future urbanization development [5]. In addition, China has an unevenly distributed large population. Taking the Hu Huanyong Line as the boundary, 36% of China’s land is inhabited by 96% of the population. The gathering of the population has also led to the overall development of the economy and cities, which has promoted the formation of many urban agglomerations in the eastern region. These urban agglomerations are a powerful driving force in the development of China’s urbanization, and they are also important choices for accelerating economic development [6,7]. The Yangtze River Delta (YRD) urban agglomeration is the most economically developed urban agglomeration in China. Since the establishment of the Joint Meeting of Directors of 14 Urban Cooperation Organizations of the Yangtze River Delta in 1992, the YRD urban agglomeration has continued to expand. On 1 December 2019, the State Council of China issued the outline of the Yangtze River Delta regional integration development plan. In the plan, the YRD is officially designated as the entire area including the city of Shanghai and the provinces of Jiangsu, Zhejiang, and Anhui. Of these, 27 cities (including their districts) constitute the central area of YRD regional integration, whose role is to radiate and drive the high-quality development of the whole region. Due to their unique geographical locations, these 27 cities have continuously developed, and now occupy a leading position in China in terms of population and economics. This area represents the most high-quality area of comprehensive development in China, and the urbanization process is also ahead of other areas. The problems exposed in the urbanization process of this region are typical and have a good reference significance for the research of the coordinated urbanization development in other regions.
Since the reform and opening up in China, rapid urbanization has achieved remarkable results, but many problems have been exposed. Some scholars have found that the early urbanization stage in China did not handle the coordinated development of various subsystems, and they dubbed this pathological development a “cervical fracture” [8,9]. Other scholars pointed out that “low urbanization” and “semi-urbanization” have been common in the process of urbanization in China. These all seriously affect the high-quality development of China’s urbanization [10,11]. When evaluating the dimension of coordinated urbanization development, early studies mainly used a single indicator, and the most common method was to use the value of urban household registered population divided by the total regional population to represent the level of population urbanization, and the ratio of urban construction land area or built-up area divided by the total area of regional land to represent the level of land urbanization [12,13]. Since a single indicator cannot accurately reflect the overall picture of urbanization, later studies have continued to expand the research dimensions to include two-dimensional and three-dimensional models [14,15,16,17]. Recently, Lu proposed that urbanization development should include four subsystems, namely land, economy, population, and society [18]. Since the revelation of China’s new urbanization plan in 2014, research has mainly been focused on constructing a comprehensive index system to evaluate the coordinated development of urbanization based on the above four dimensions. The existing research works have mainly used the coupling coordination model to explore the degree of various factors in the coordinated development index system for their specific purposes [16,17,19]. Coupling theory can be effectively used to analyze the urbanization development of various subsystems in urbanization. Thus, it is an important tool for studying the coordination relationship between two or more interacting systems. [20]. Based on panel data and a spatial analysis model, some scholars have studied the spatiotemporal variation of coordinated urbanization development in different regions [19,21,22]. In addition, the analysis of the driving factors of coordinated urbanization development has also gradually become a research hotspot [13,23]. Using these methods, it is difficult to consider time and space dimensions at the same time. However, the Geographically and Temporally Weighted Regression (GTWR) model solves this limitation well and has been widely used to analyze the spatiotemporal characteristics of driving mechanisms in various research fields in recent years, such as poverty, logistics, environmental protection, foreign trade, and so on [24,25,26,27].
Previous studies have relied heavily on statistical yearbook data for data acquisition, and the method for driving mechanism studies has been relatively simple. Therefore, in this paper, taking the central cities of the YRD as the study area, we constructed a comprehensive evaluation index system for coordinated urbanization development that contained the four dimensions of population, the economy, land, and society. We made full use of night light remote sensing data to reflect the dynamic change of land urbanization and explored the spatiotemporal differences of the coordinated urbanization development in the region combined with panel data; finally, we used the GTWR model to discuss the driving factors of the coordinated urbanization development in the central area of the YRD. The results of this study provide a decision-making basis for the high-quality urbanization development of other regions.
2. Materials and Methods
2.1. Materials
2.1.1. Study Area
The YRD covers the whole land area of Jiangsu, Zhejiang, and Anhui provinces and Shanghai city, with an area of 358,000 square kilometers. The center area of YRD contains 27 cities and is located from 28°01′ to 32°34′ N and 115°45′ to 123°25′ E, accounting for 63% of the area of the entire YRD (Figure 1). Due to their unique geographical location, these 27 cities are in an advantageous position compared to other cities of China in terms of population and economics. According to statistics in 2019, these 27 cities account for nearly 20.4% of the GDP of mainland China and 11.6% of the population. Therefore, the development status of urbanization in this region plays an important role in driving the high-quality development of the entire YRD region, promoting synergistic development in the YRD metropolitan area, and helping the YRD region to grow into a world-class urban agglomeration. Therefore, in this article, we selected this region as the study area to explore the coordinated urbanization development lever and its driving factors in the past 20 years.
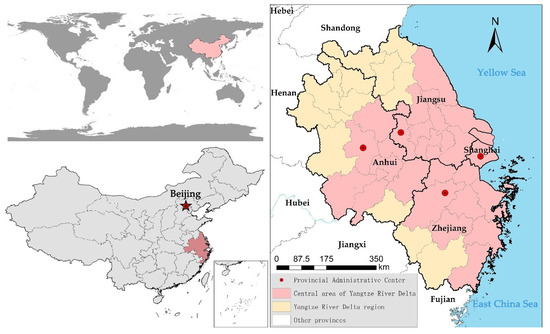
Figure 1.
Location of the central area of the Yangtze River Delta.
2.1.2. Data Sources
In order to construct the comprehensive evaluation index system, most socioeconomic data were extracted from the China City Statistical Yearbook, Jiangsu Statistical Yearbook, Zhejiang Statistical Yearbook, Anhui Statistical Yearbook, Shanghai Statistical Yearbook, and the Statistical Communique of the People’s Republic of China National Economic and Social Development from 1999 to 2019.
Due to the lack of built-up area data in the statistical yearbook for some years, and the strongly subjective nature of built-up area data in some areas, the built-up area data required in this article were extracted from 20 views of nighttime light (NTL) images provided by National Oceanic and Atmospheric Administration (NOAA) [28]. Due to the difference in satellite technology, the images needed in this study include Defense Meteorological Satellite Program (DMSP), Operational Linescan System (OLS), and National Polar-orbiting Partnership (NPP) Visible Infrared Imaging Radiometer System (VIRS). These images range from February to June, with less cloud cover and better image quality. Although the spatial resolution of NTL images is lower than that of remote sensing images such as the Landsat series, NTL can be more continuous in time, and from the perspective of physical characteristics, it is less affected by cloud cover. At the same time, considering that the urban construction speed in the YRD area is too fast, the NTL image can eliminate some empty cities, thus more accurately reflecting the real situation of urbanization. The parameters are shown in Table 1.

Table 1.
List of data sources.
2.2. Research Method
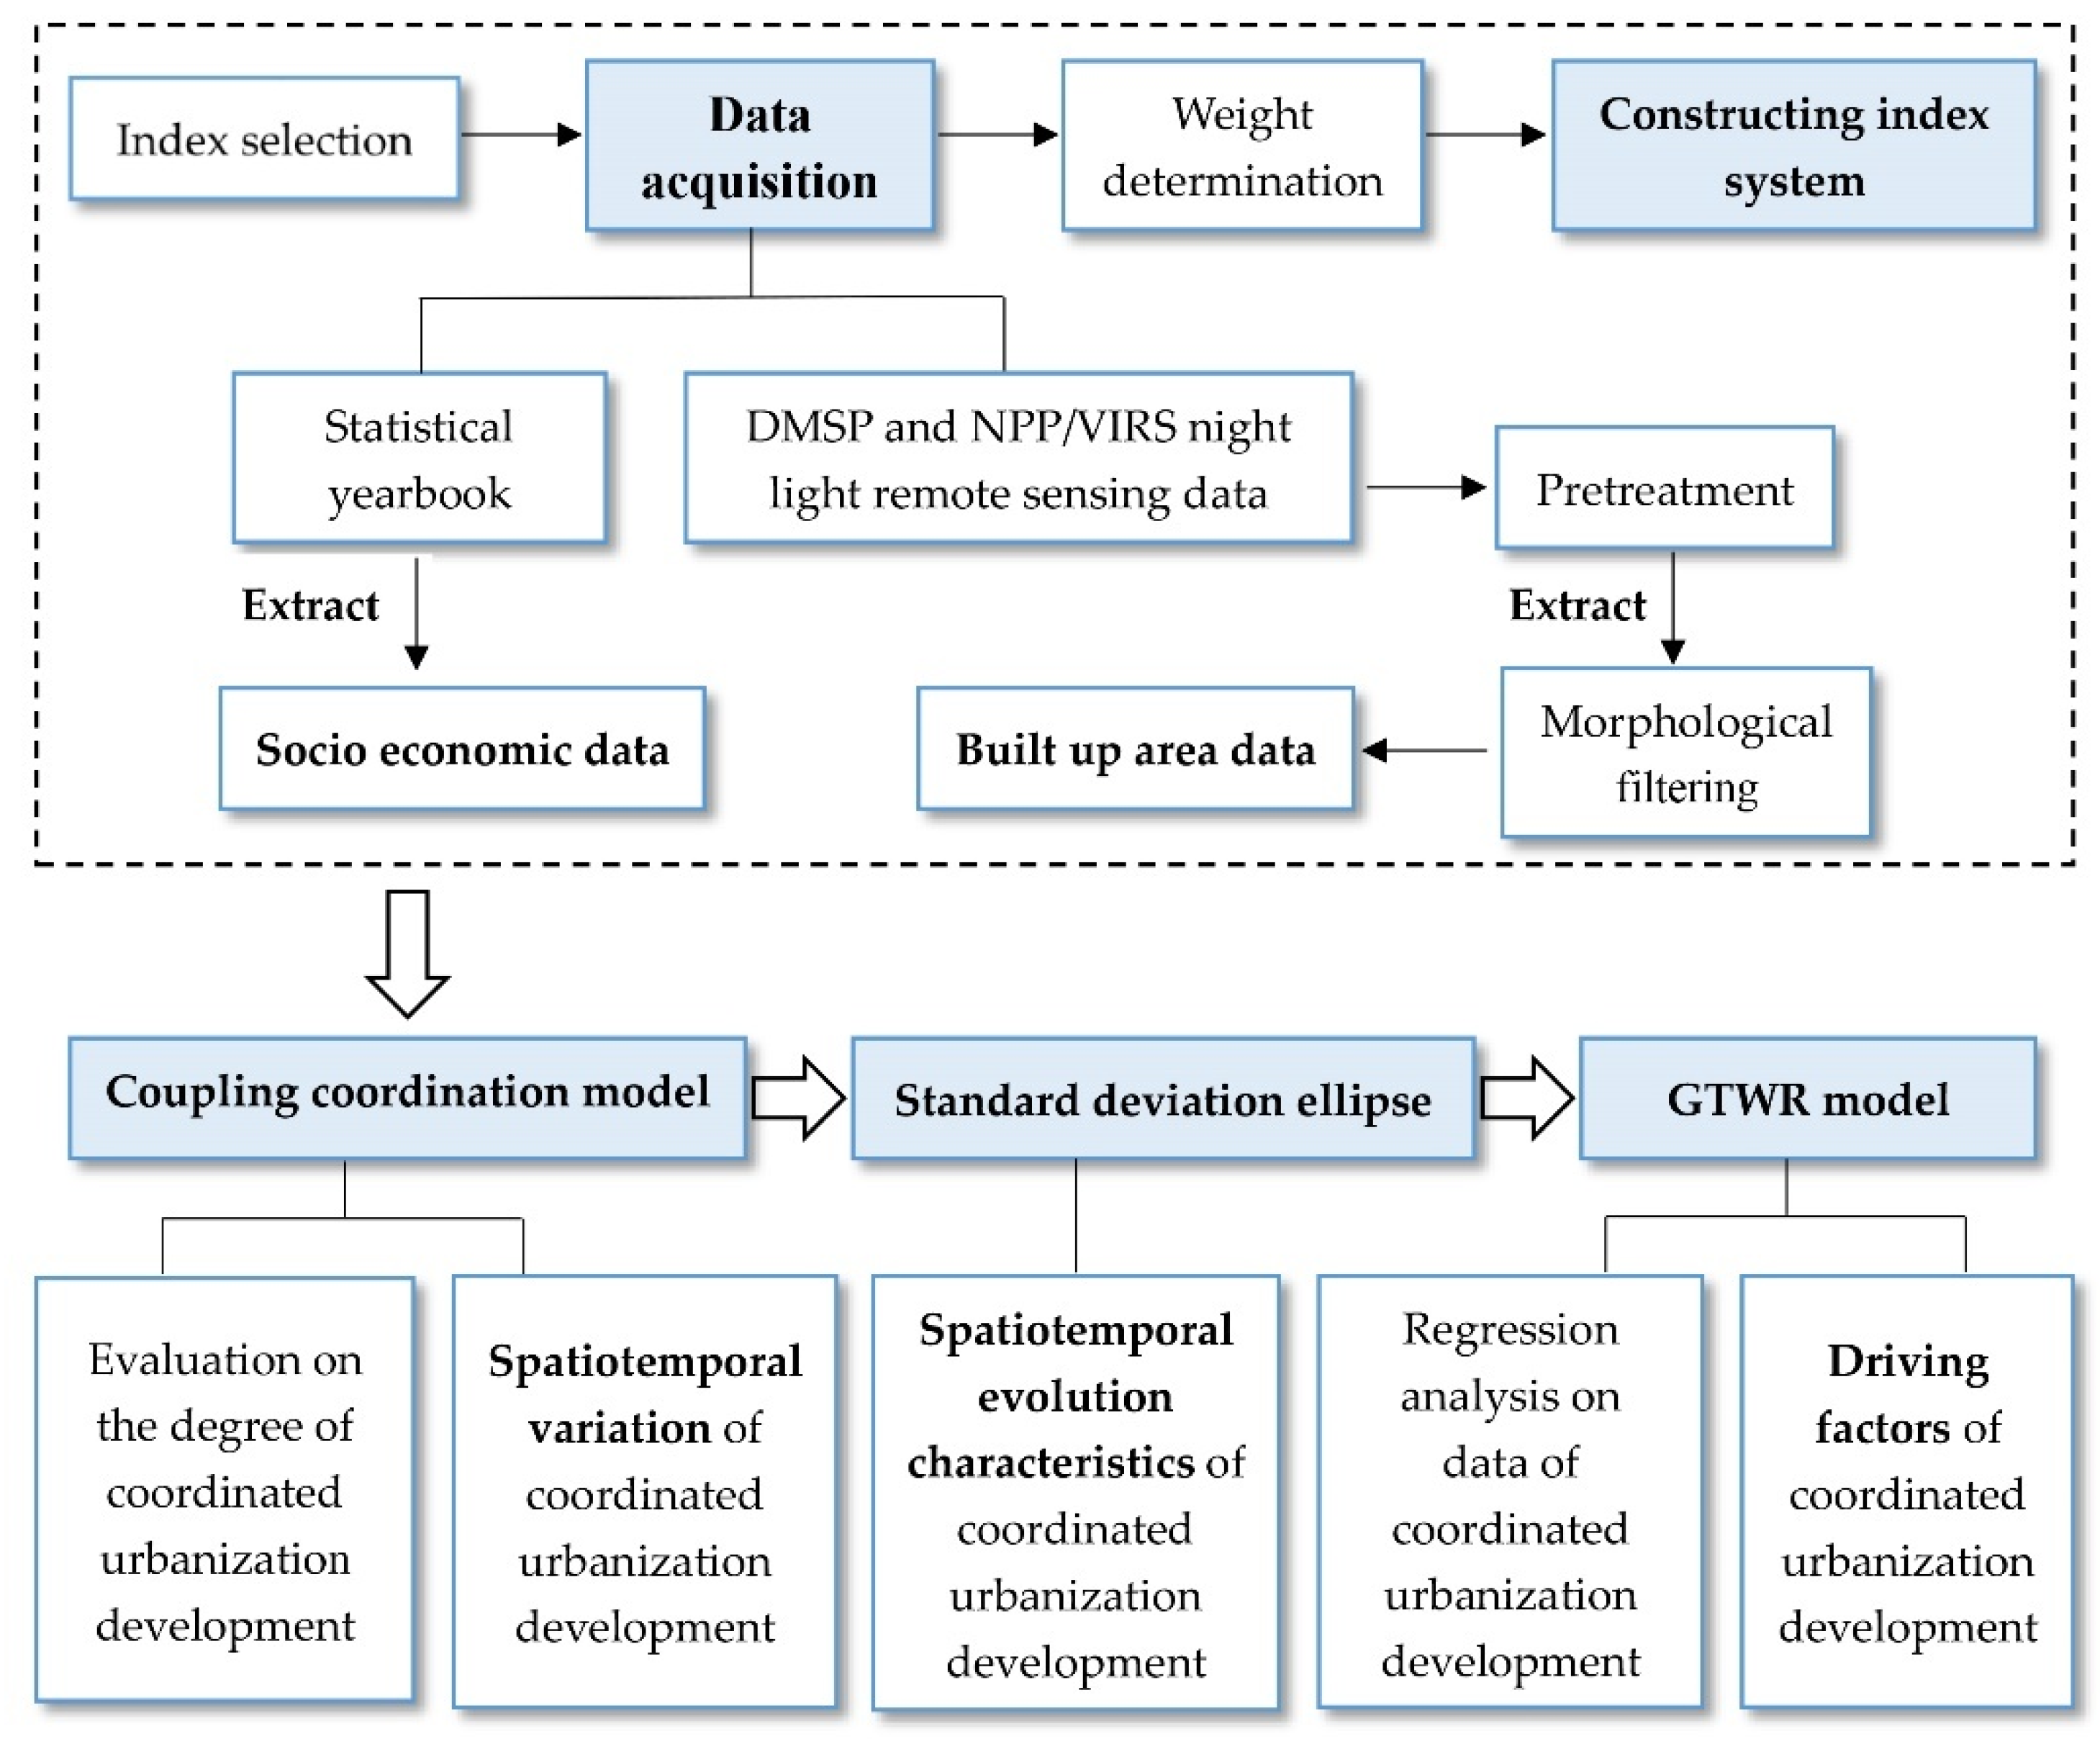
In this paper, we constructed a comprehensive index system that obtained the relevant data from the night light images and statistical yearbooks to evaluate the coordinated urbanization development level in the central area of the YRD. The experiments were then conducted by integrating several models, such as the coupling coordination model, Standard Deviation Ellipse (SDE), and GTWR model. The spatiotemporal variation of the coordinated urbanization development level in the central area of the YRD during the past two decades was explored, and the driving factors that affected this area were analyzed. The overall research framework of this paper is shown in Figure 2.
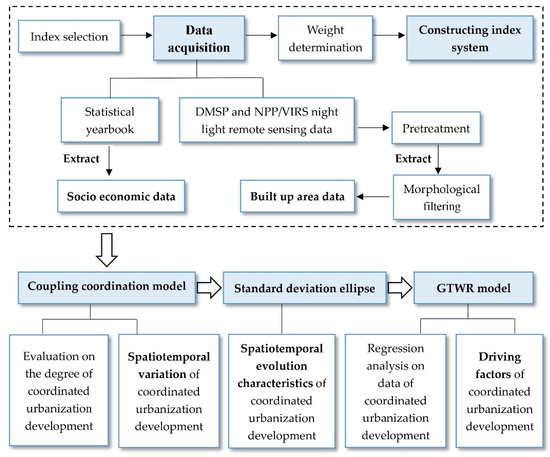
Figure 2.
Research framework.
2.2.1. Construction of Evaluation Index System
Due to the unique geographical location and superior economic development of the central area of the YRD, and the fact that the overall urbanization level is much higher than most areas of China, the coordinated level of urbanization development in this region presents certain particularities. Therefore, this paper drew on the basic connotation of new urbanization in China and related research results [8,12,29,30], selected indexes from the four dimensions of population, economy, land, and society, and used the entropy method to obtain the weight of each index.
Finally, an index system for evaluating the coordinated urbanization development in the central area of the YRD was constructed (Table 2). Finally, 17 indicators were determined as the indicators of this research. Among them, the population urbanization (PU) subsystem includes 3 indicators including the urbanization rate of permanent population (X1), and the economic urbanization (EU) subsystem includes 5 indicators including per capita GDP (X4). The land urbanization (LU) subsystem includes 4 indicators including built-up area (X8). The social urbanization (SU) subsystem includes 5 indicators including the number of college students per 10,000 people (X13). Of the four subsystems, population urbanization is the core factor that reflects the concentration of the non-agricultural population in urban areas, land urbanization is the carrier that represents the expansion of urban areas, economic urbanization is the driving force that denotes the concentration of non-agricultural economies in urban areas and social urbanization illustrates the completeness degree of urban infrastructure and public services.
Table 2.
Evaluation index system for coordinated urbanization development in the Yangtze River Delta.
2.2.2. Extraction of Urban Built-Up Area
Due to the differences in the sensors and spatial resolution between the two kinds of NTL data, the images cannot be directly used before preprocessing [31]. In this paper, the DMSP/OLS data of each year were preprocessed for relative correction and continuity correction, and the NPP/VIRS data of each year were preprocessed for fitting, smoothing, and continuity correction [32]. Since the DN value of NTL data can more sensitively identify the range of urban built-up areas, the areas of the YRD were extracted by the morphological filtering method.
The morphological filtering method is a tool for image analysis and processing based on morphological representation, which is widely used in image denoising, enhancement, boundary analysis, and other fields [33]. Erosion and dilation are the two most basic operations in the morphological filtering method. Given the image M and the structural element N, the dilation D(M) and erosion E(M) operations and the opening operations are as follows:
This formula indicates that the binary image E(M) is produced by N corrosion M. D(M) is the set of points (x, y): if the origin of N is shifted to the point (x, y), then N will be completely contained in M.
This formula indicates that the binary image D(M) is produced by the dilation of N to M. D(M) is the set of points (x, y): if the origin of N is shifted to (x, y), then its intersection with M is not empty.
Therefore, the open operation of M and N is expressed as the following equation:
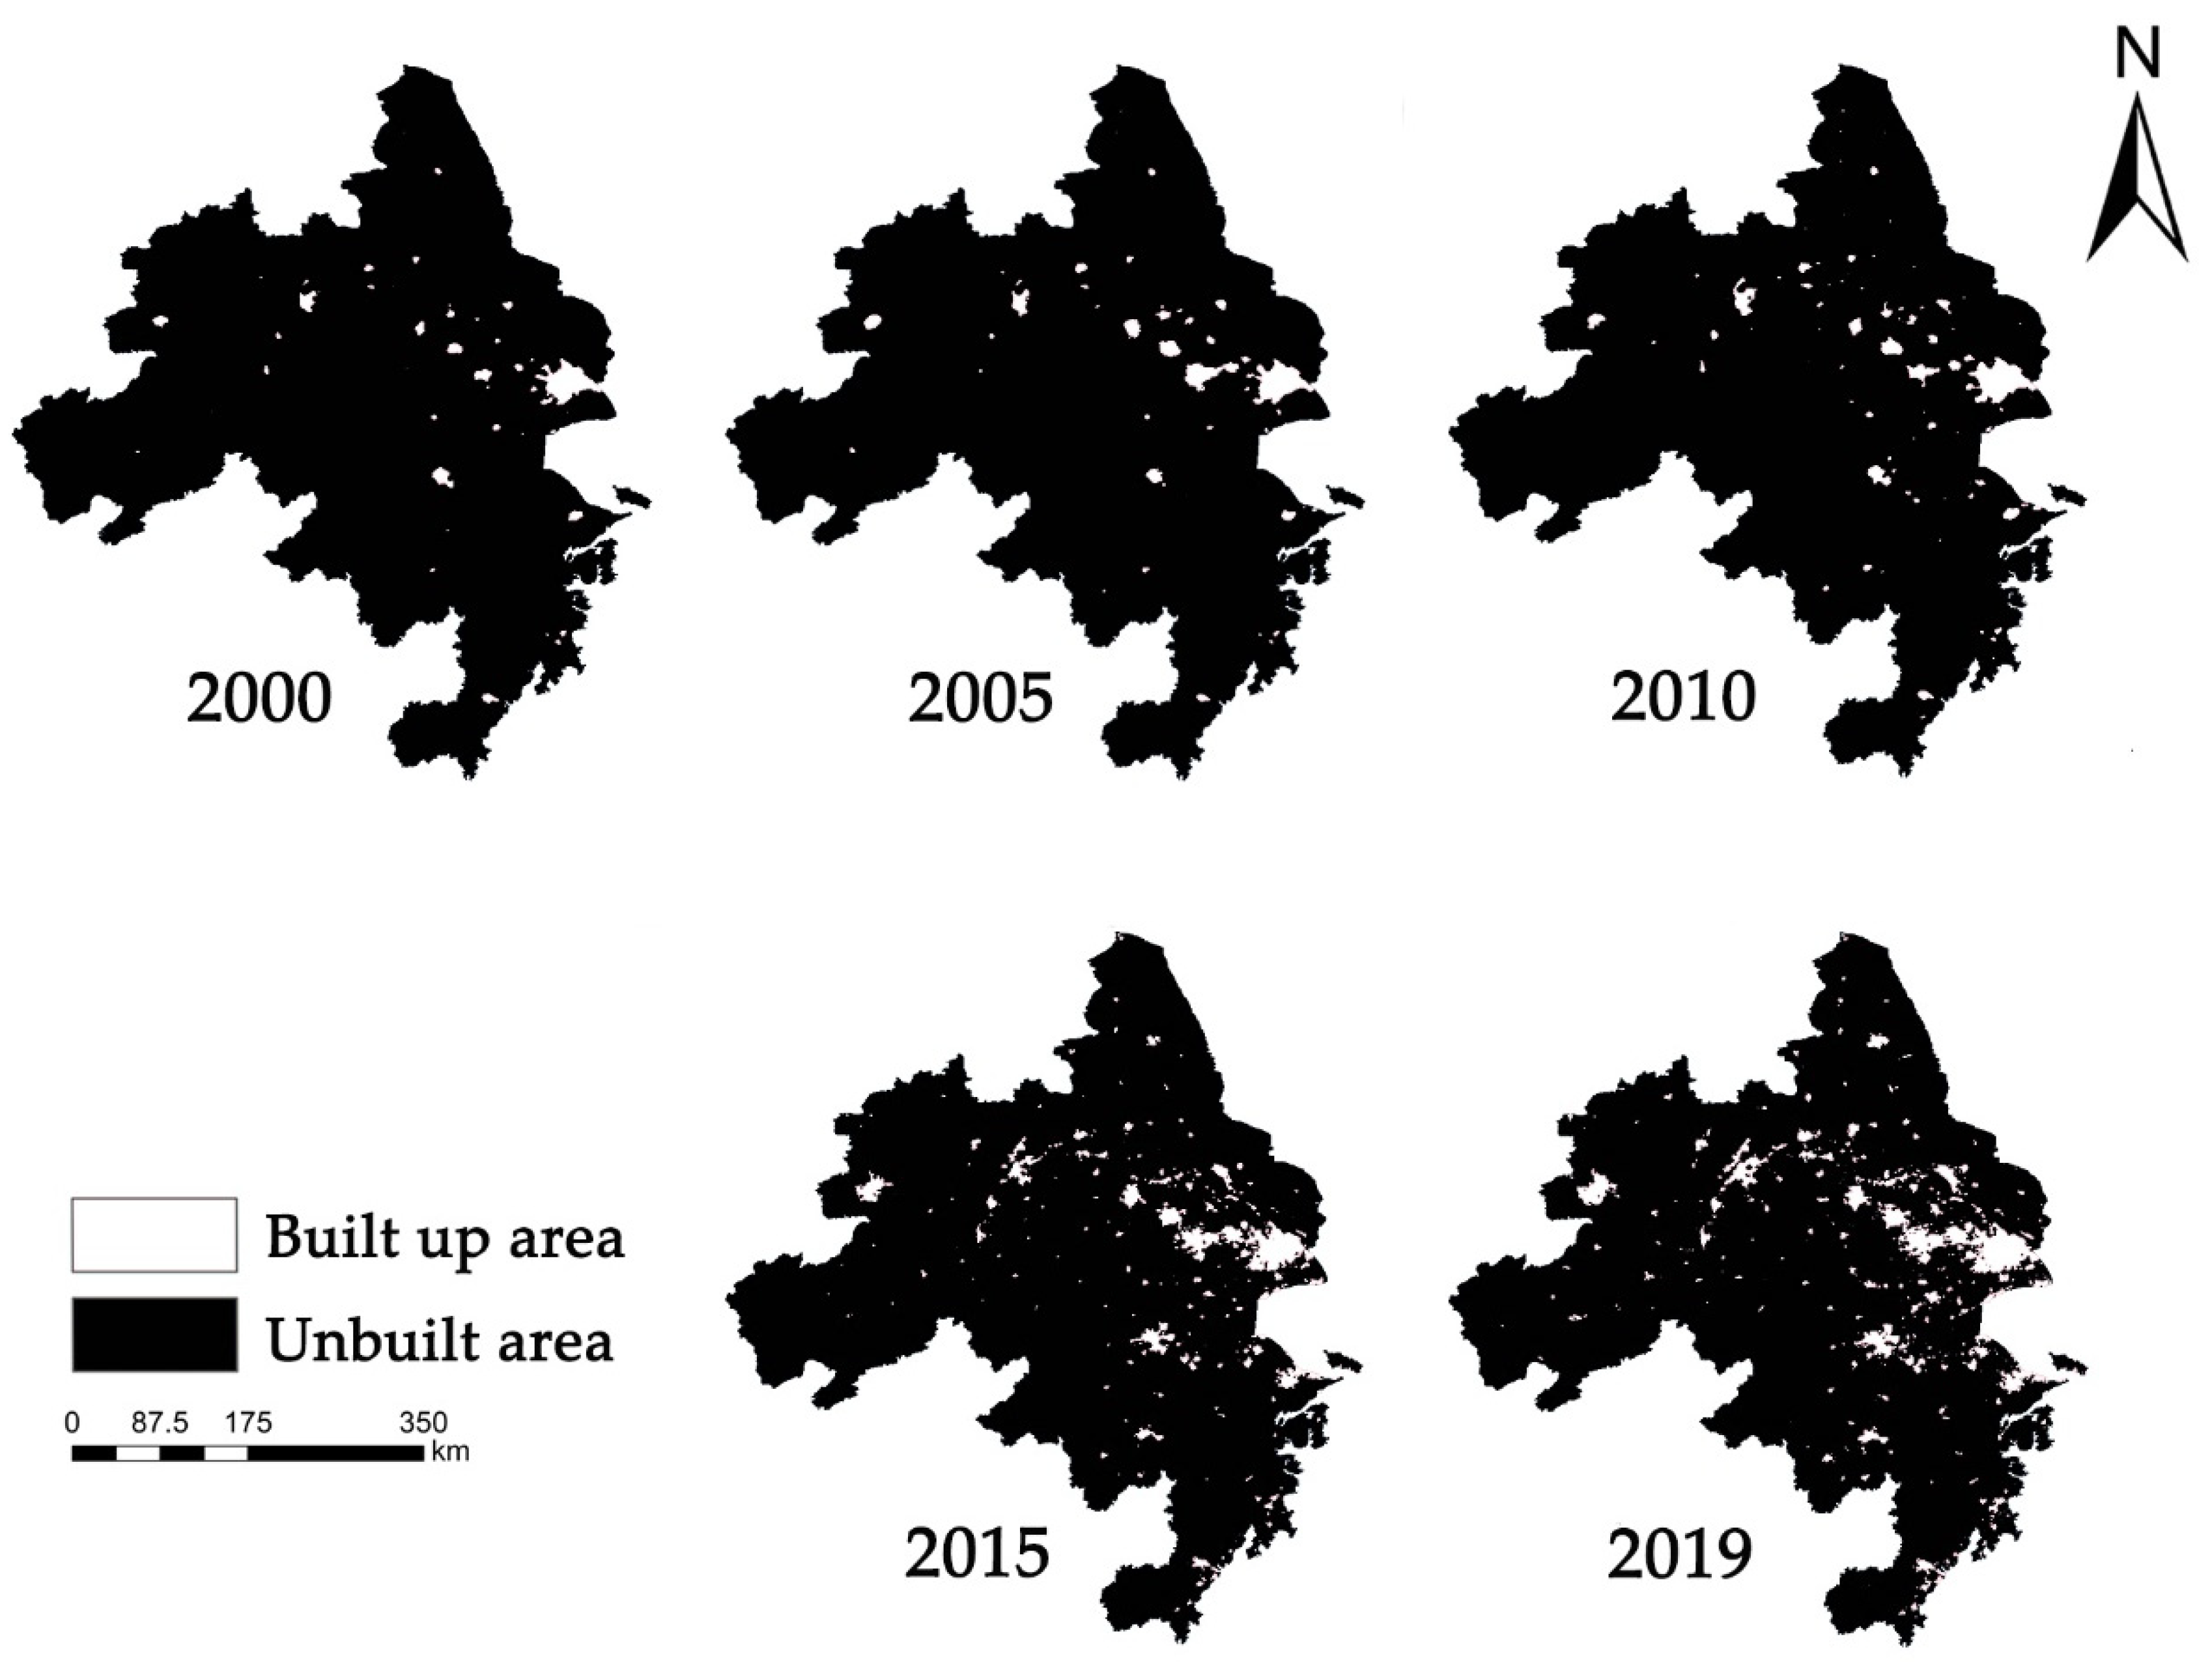
The erosion operation can obtain the inner boundary of the image edge. The opening operation first uses the erosion operation to eliminate the bright details, so that the brightness of the image is weakened, and the dilation operation filters out the removed noise when restoring brightness information [34]. Therefore, the built-up areas were extracted from NTL images; the results passed the accuracy verification, and the reliability was high. Five-phase built-up area images were selected as the schematic diagram of the built-up area change (Figure 3).
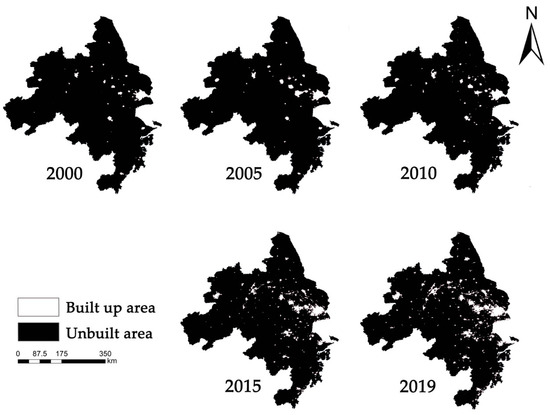
Figure 3.
Changes in the area of built-up areas in the central area of the Yangtze River Delta.
2.2.3. Coupling Coordination Model
To better describe the mutual influence and interaction mechanism among each urbanization subsystem and quantitatively analyze the coupling status and evolutionary trends of each subsystem in the urbanization process, a coupling coordination model borrowing the coupling concept, which comes from physics, was constructed [16,20,35,36].
The coupling model is as follows:
where PU, EU, LU, and SU denote population, economy, land, and social urbanization, respectively, and C denotes the overall coupling degree of each subsystem.
Further, we introduced the coordination degree model to quantitatively evaluate the coordinated development status of each subsystem which integrates the development degree T and overall coupling degree C. The formulas for this are as follows:
where D denotes the degree of coupling coordination; T denotes the comprehensive development level of each subsystem in urbanization; and are the weights of each subsystem. In this study, the various subsystems of urbanization are considered to be equally important, and so the weights are all 0.25.
According to the D value, the coordination stage is divided, and the coordination degree level is obtained. The classification results are shown in the Table 3 below.
Table 3.
Classification results of coordination stage and coordination degree.
2.2.4. Standard Deviation Ellipse Model
SDE can accurately reveal the spatial distribution characteristics of each geographic element and is suitable for comparing spatial distribution changes in time series. The main parameters of SDE include the spatial center of gravity, major axis, minor axis, and azimuth angle [37,38,39]. The center of gravity refers to the point that can maintain the balance of the spatial distribution pattern of the research object. Generally, different weights are given according to the difference in the spatial position of the research area. The center of gravity of the SDE is calculated as follows:
where denotes the center of gravity of the coupling coordination degree. n denotes the number of cities, the central area of the YRD consists of 27 cities, thus in this paper, n = 27. represents the coupling coordination degree of the ith city, and and represent the abscissa and ordinate of the ith city, respectively.
The maximum dispersion direction of the research object distribution is defined as the major axis Y, which is the main trend direction. The minimum dispersion direction of the data distribution is defined as the minor axis X, which is the secondary trend direction. The azimuth angle θ of the SDE is defined as the clockwise angle between the long axis Y direction and the north direction, which is used to characterize the main distribution direction of the research object. The calculation formula of each parameter is as follows:
where θ is the azimuth angle of the ellipse, and , respectively, represent the deviation from the research object to the coordinate of the average center, and and represent the standard deviation of the x-axis and the y-axis, and they are the minor and major axes of the SDE, respectively. The larger the difference between and , the more significant the directional characteristics of the research object.
2.2.5. Geographically and Temporally Weighted Regression Model
This study uses the above methods to explore the coordinated urbanization development status and spatiotemporal distribution in the central area of the YRD. However, the driving factors of the research objects are different in different spatial locations. Therefore, the GTWR model was introduced to analyze the factors affecting the coordinated urbanization development in the central area of the YRD. GTWR improves upon the Geographically Weighted Regression (GWR) model by introducing time feature parameters into the model. It reveals the spatial stability of cross-sectional data while taking into account the temporal stability, which can effectively reduce model errors and parameter estimation errors [24,26,40,41]. The GTWR model expression is as follows:
where represents the spatiotemporal coordinates of the ith city, represents the spatiotemporal intercept term of the ith city, is the dependent variable of the ith city, and represents the kth explanatory variable of the ith city; represents the regression coefficient of , and is the error term. The higher the absolute value of the regression coefficient, the greater the influence of the explanatory variable on the dependent variable.
3. Results
3.1. Spatiotemporal Characteristics of Coordinated Urbanization Development
3.1.1. Temporal Characteristics Analysis
Using the above methods, the urbanization indexes of population, the economy, land, and society in the central area of the YRD in the past 20 years, as well as the coupling degree C, development degree T, coordination degree D, coordination level, and coordination degree were calculated, the results are shown in Table 4.
Table 4.
Coordination degree results of urbanization development in the central area of the Yangtze River Delta.
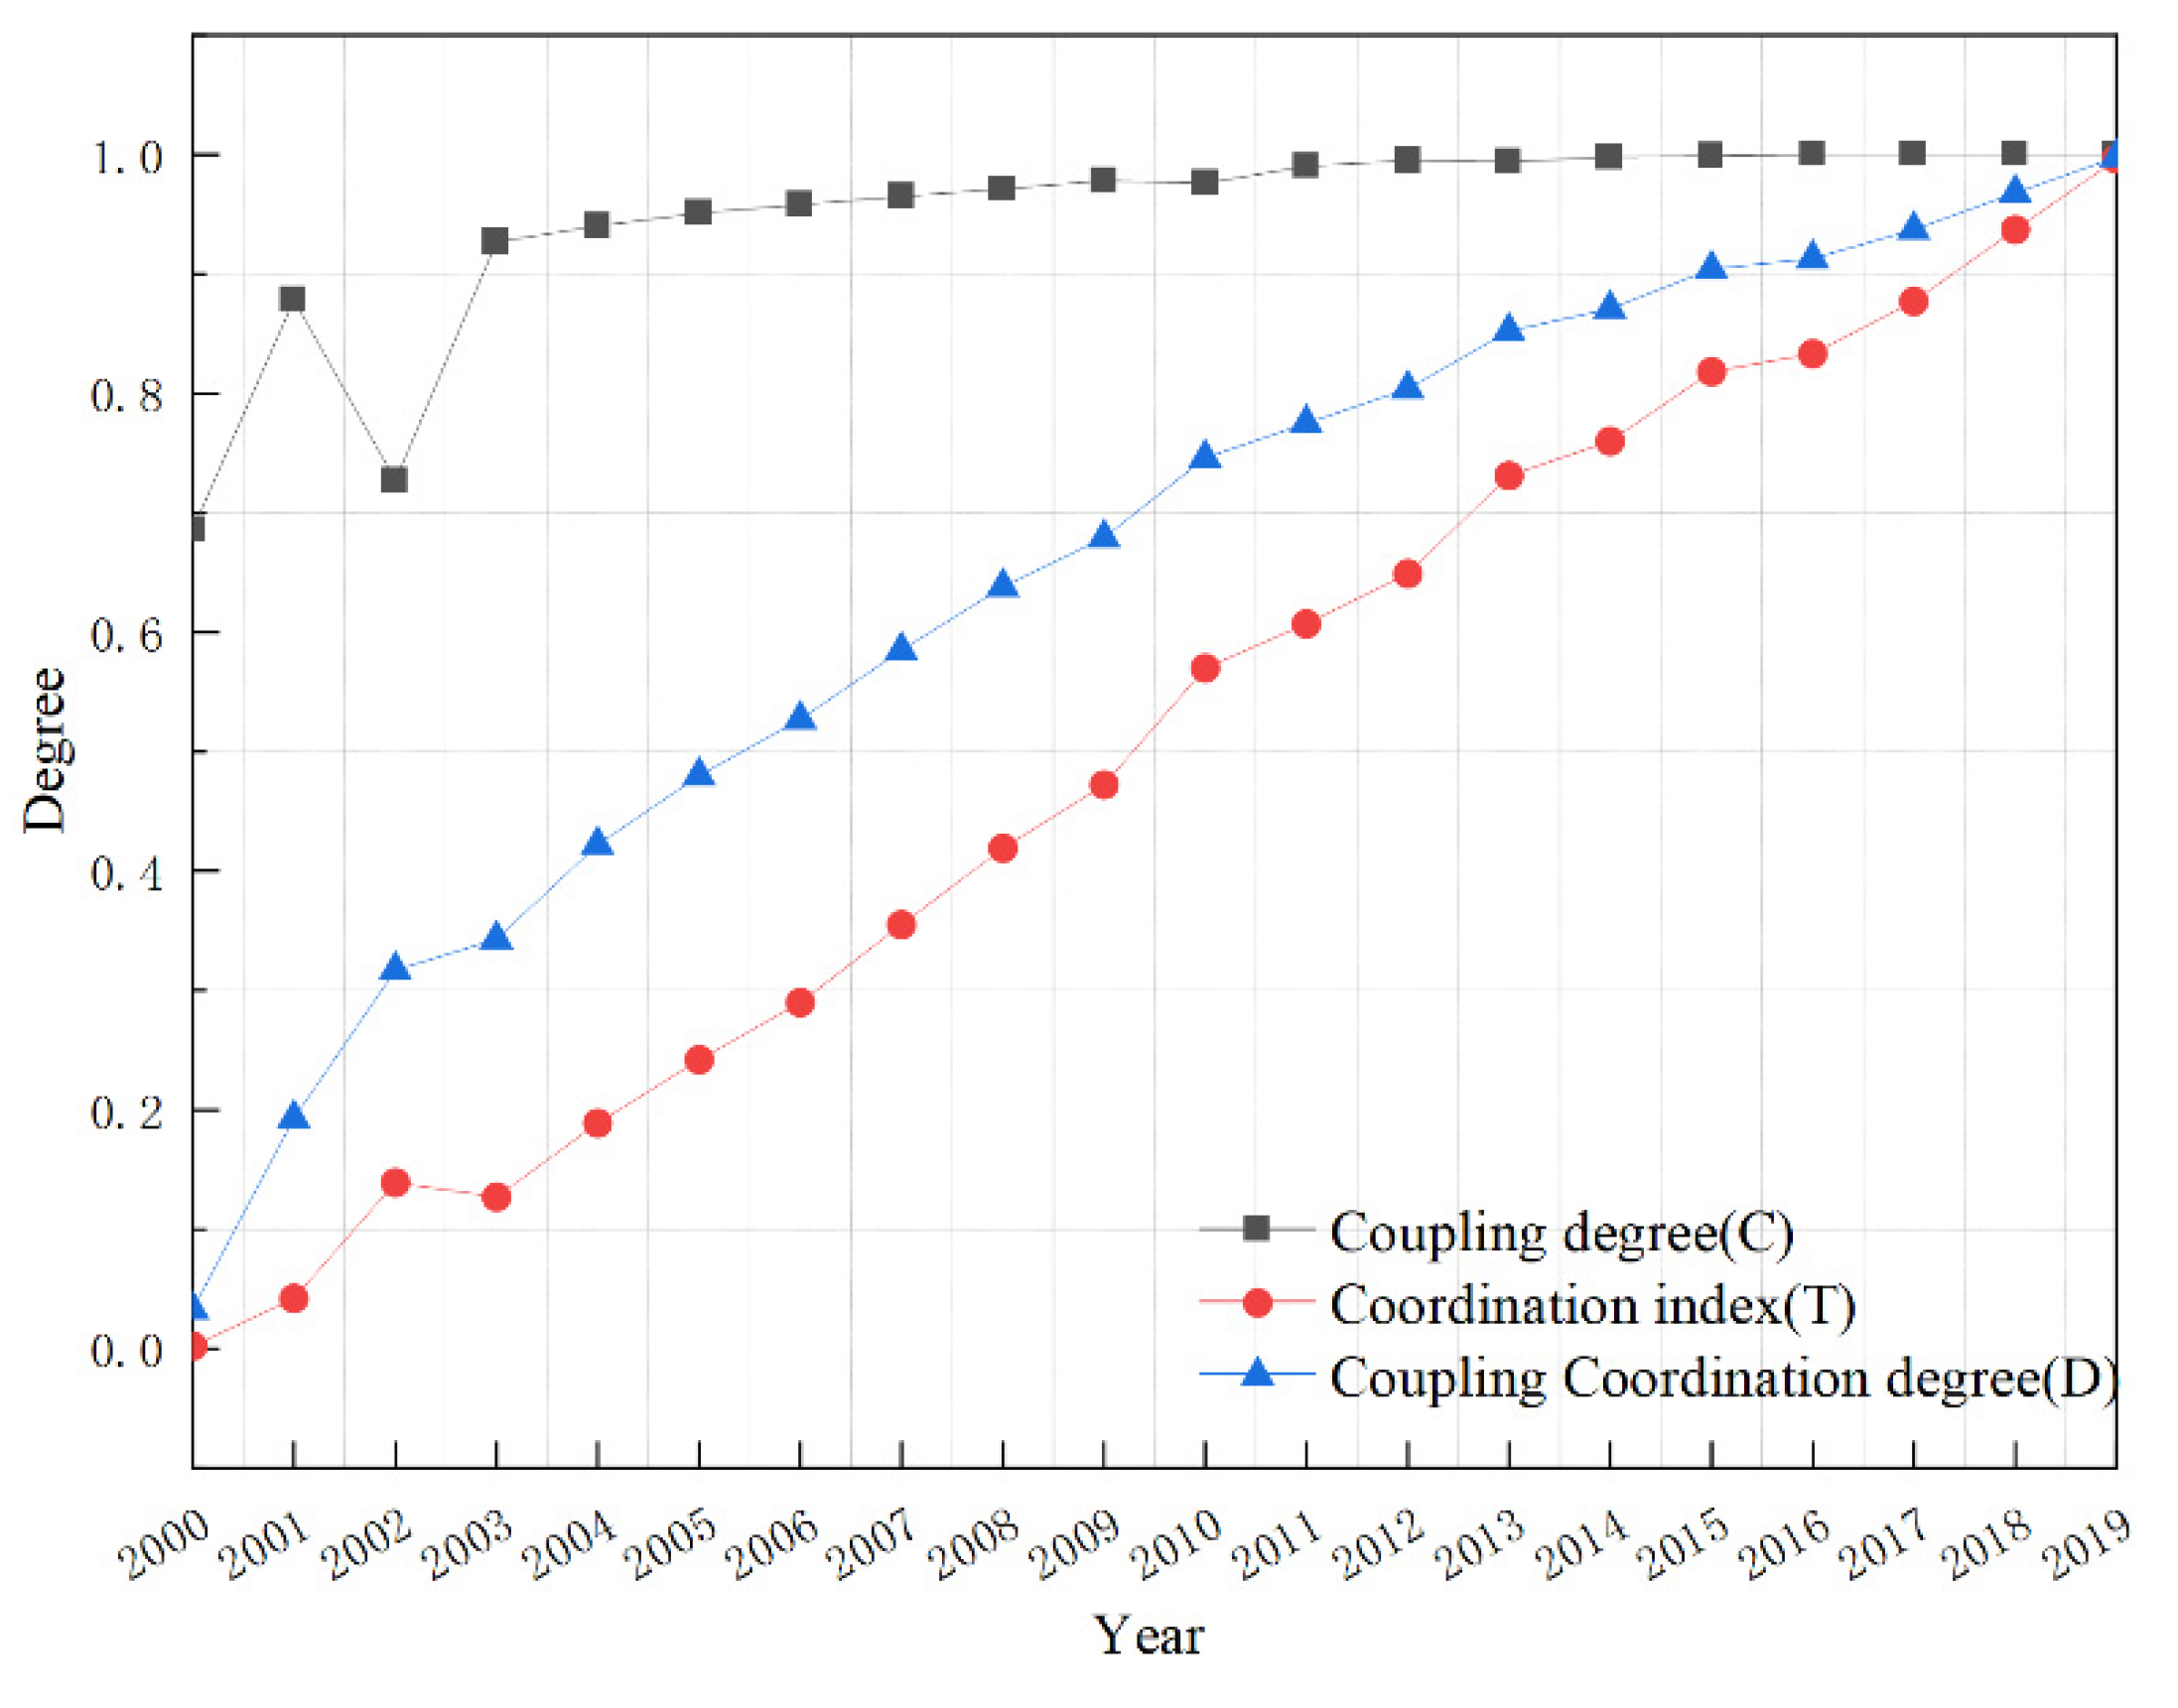
During the entire study period, the coordinated degree T and coupling coordination degree D of urbanization in the central area of the YRD increased steadily; the D value increased from 0.033 in 2000 to 0.998 in 2019, the coordination degree changed from the extremely disordered level to high-quality coordinated level, and the coordinated development process was dramatic (Figure 4).
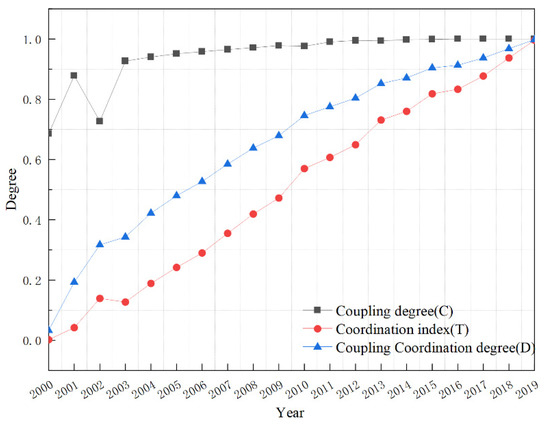
Figure 4.
Coordinated urbanization development trend in the central area of the YRD.
3.1.2. Spatial Characteristics Analysis
(1) Grade analysis of coordination degree
To intuitively illustrate the spatial change of coordination development of 27 cities, taking 2000, 2005, 2010, 2015, and 2019 as the research years, the coordination degrees were calculated respectively, and the spatiotemporal distribution result for the coordination level was determined according to the above coordination degree classification standard (Figure 5).
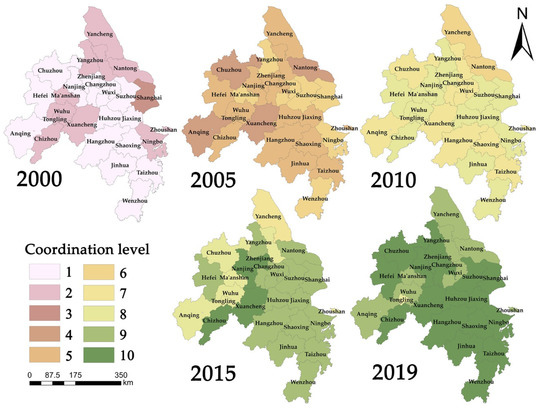
Figure 5.
Spatiotemporal distribution of urbanization coordination level in the central area of the YRD.
As shown in Figure 5, in 2000, all the cities were in a state of disorder, and the distributions of extremely disordered areas were mainly in the western part of Anhui Province, the central part of Jiangsu Province, and the central and southern parts of Zhejiang Province. Considering that these areas were advanced in development in their respective provinces and had better economic conditions, at the initial stage of development, they made a great deal of effort to expand their population and land area, resulting in a lack of coordination between subsystems.
In 2005, the urbanization coordination status in most regions had improved, and cities such as Shanghai, Suzhou, Ma’anshan, and Wenzhou initially reached a barely coordinated level. It is worth noting that the development of Ma’anshan City was relatively slow, so the development of each urbanization subsystem was balanced, and the coordination status in each period was relatively good.
In 2010, all the cities reached a coordinated level, with 15 cities reaching the intermediately coordinated level. Nanjing, Hefei, Huzhou, and other cities with a level of extreme imbalance in 2000 reversed this trend in this period, which proves that these cities paid attention to the coordinated development of various urbanization subsystems during their rapid economic development period and finally achieved a good coordination level.
In 2015, the coordinated development of each city continued to improve: 16 cities achieved a well-coordinated level, 4 cities improved and achieved a high-quality coordinated level, and only Yancheng City was still at a barely coordinated level.
In 2019, the number of high-quality coordinated cities had increased to 18, and the whole of Zhejiang Province was at this level. The cities with a well-coordinated level were mainly concentrated in the middle of Anhui Province and the northeast of Jiangsu Province, and only Tongling City of Anhui Province was at the intermediately coordinated level.
(2) Analysis of dynamic change of center of gravity
In order to explore the dynamic evolution of the coordinated urbanization development degree in the central area of the YRD, this paper used the SDE method to describe the dynamic change of the center of gravity of coordinated urbanization development over the past 2 decades.
To ensure that the ellipse was clear, the results of five years were selected for display (Figure 6). It can be seen that, except for 2015, the standard deviation elliptical azimuths of the other years are similar; that is, the long axis of the ellipse presents a northwest-southeast direction, indicating the expansion direction of the coordinated development of 27 cities during the study period.
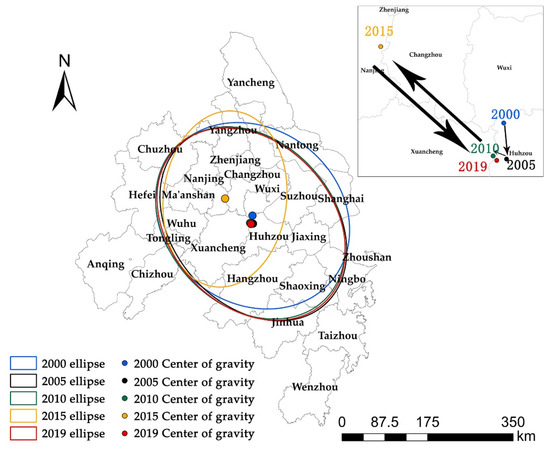
Figure 6.
Standard Deviation Ellipse (SDE) of the coordinated urbanization development degree in the central area of the YRD.
Comparing the ellipses’ short axis for each year, it was found that after 2000, the short axis was shortened, and the difference rate between the long axis and the short axis increased, indicating that the coordinated urbanization development strengthened, and gradually concentrated on the cities in the direction of the long axis. It is worth noting that the direction of the long axis in 2015 was different from that in other years, showing a northeast-southwest direction. However, the long axis of the ellipse in 2015 was similar to the short axis in the direction and length of other years. After comparing this with Figure 6, it was found that the cities on the long axis of the ellipse reached a high-quality coordinated state earlier than other cities in 2015, and the coordinated development situation was slightly better than other cities. Due to the leading economic development of Nanjing and Zhenjiang, the coordinated state of urbanization in these cities has been the best since 2010. Although the economic development of most areas of Anhui Province was relatively slow, after 2010, Anhui Province obtained a large number of policy inclinations with the help of the “Pan Yangtze River Delta” concept. Meanwhile, by learning from a large number of coordinated urbanization development cases in other areas of the Yangtze River Delta, the degree of coordinated urbanization development in some areas of Anhui Province was at the forefront of the region, thus forming the state of the SDE in 2015. Besides, during the study period, the movement direction of the center of gravity demonstrated a southward trend, which indicates that the coordinated urbanization development in the south of the YRD was better.
3.2. Analysis of Driving Factors and Their Spatiotemporal Distribution of Coordinated Urbanization Development
3.2.1. Calculation Results with GTWR
From the results mentioned above, there is an obvious spatial heterogeneity in terms of the coordinated urbanization development status. Therefore, based on the panel data from 2000 to 2019, with the coordination degree D value as the dependent variable, and the indicators in the evaluation index system as the explanatory variables, the GTWR model was used to further discuss the driving factors of urbanization development as well as the spatiotemporal distribution of each factor. Through the multicollinearity test, the variance inflation factor (VIF) of each index was within 10, which could be further used for the GTWR analysis. From the GTWR calculation results (Table 5), all parameters were found to be within a reasonable range, and the R2 and the adjusted R2 values were close to 1, proving that the influence of explanatory variables on dependent variables could be better measured.
Table 5.
Related parameters calculated by GTWR.
The driving factors of the coordinated urbanization status in different periods were calculated by the GTWR model, which were shown in Table 6. The regression coefficients of the driving factors such as fiscal revenue per km2, per capita financial education expenditure, per capita GDP, population density, and built-up area varied greatly, which indicated that the coordinated urbanization development levels of cities in the central area of YRD were quite different, which needs to be discussed in detail. Therefore, this paper selected four factors, population density, fiscal revenue per km2, built-up area and per capita financial education expenditure to depict the spatiotemporal pattern of the influence of population, the economy, land, and society on coordinated urbanization development.
Table 6.
Comparison of regression coefficients of various factors over 20 years.
3.2.2. Analysis of Spatiotemporal Variation of Driving Factors
(1) Population density
The average influence coefficient of population density on the coordinated urbanization development in the central area of the YRD has increased first and then decreased over the past 20 years (Figure 7). The negative high influence areas of population density are mainly distributed in the west of Anhui Province and the south of Zhejiang Province, which shows that a large number of people are gathered in these areas, but other supporting infrastructure cannot fully afford the burden of population, which makes the development of population urbanization faster than other subsystems.
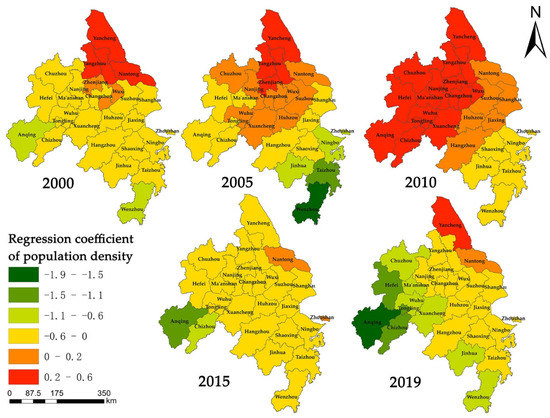
Figure 7.
Spatiotemporal distribution of regression coefficient of population density.
The positive influence area of population density is distributed in the north of Jiangsu province year-round. Yancheng and Nantong have a large area and few people. The permanent population of Yancheng City has even experienced a rapid decrease in recent years. Therefore, the positive impact of population density on these areas is more obvious. It is worth noting that the positive influence areas of population density in 2010 are significantly different. The main reason for this is that the “Pan-Yangtze River Delta” concept was proposed in 2008, and six cities in Anhui Province were officially expanded to the YRD in 2010. The investment enthusiasm of the region has been improved, the momentum of economic development was high, the demand for the population was large, and the positive effect of population density was obvious.
(2) Fiscal revenue per km2
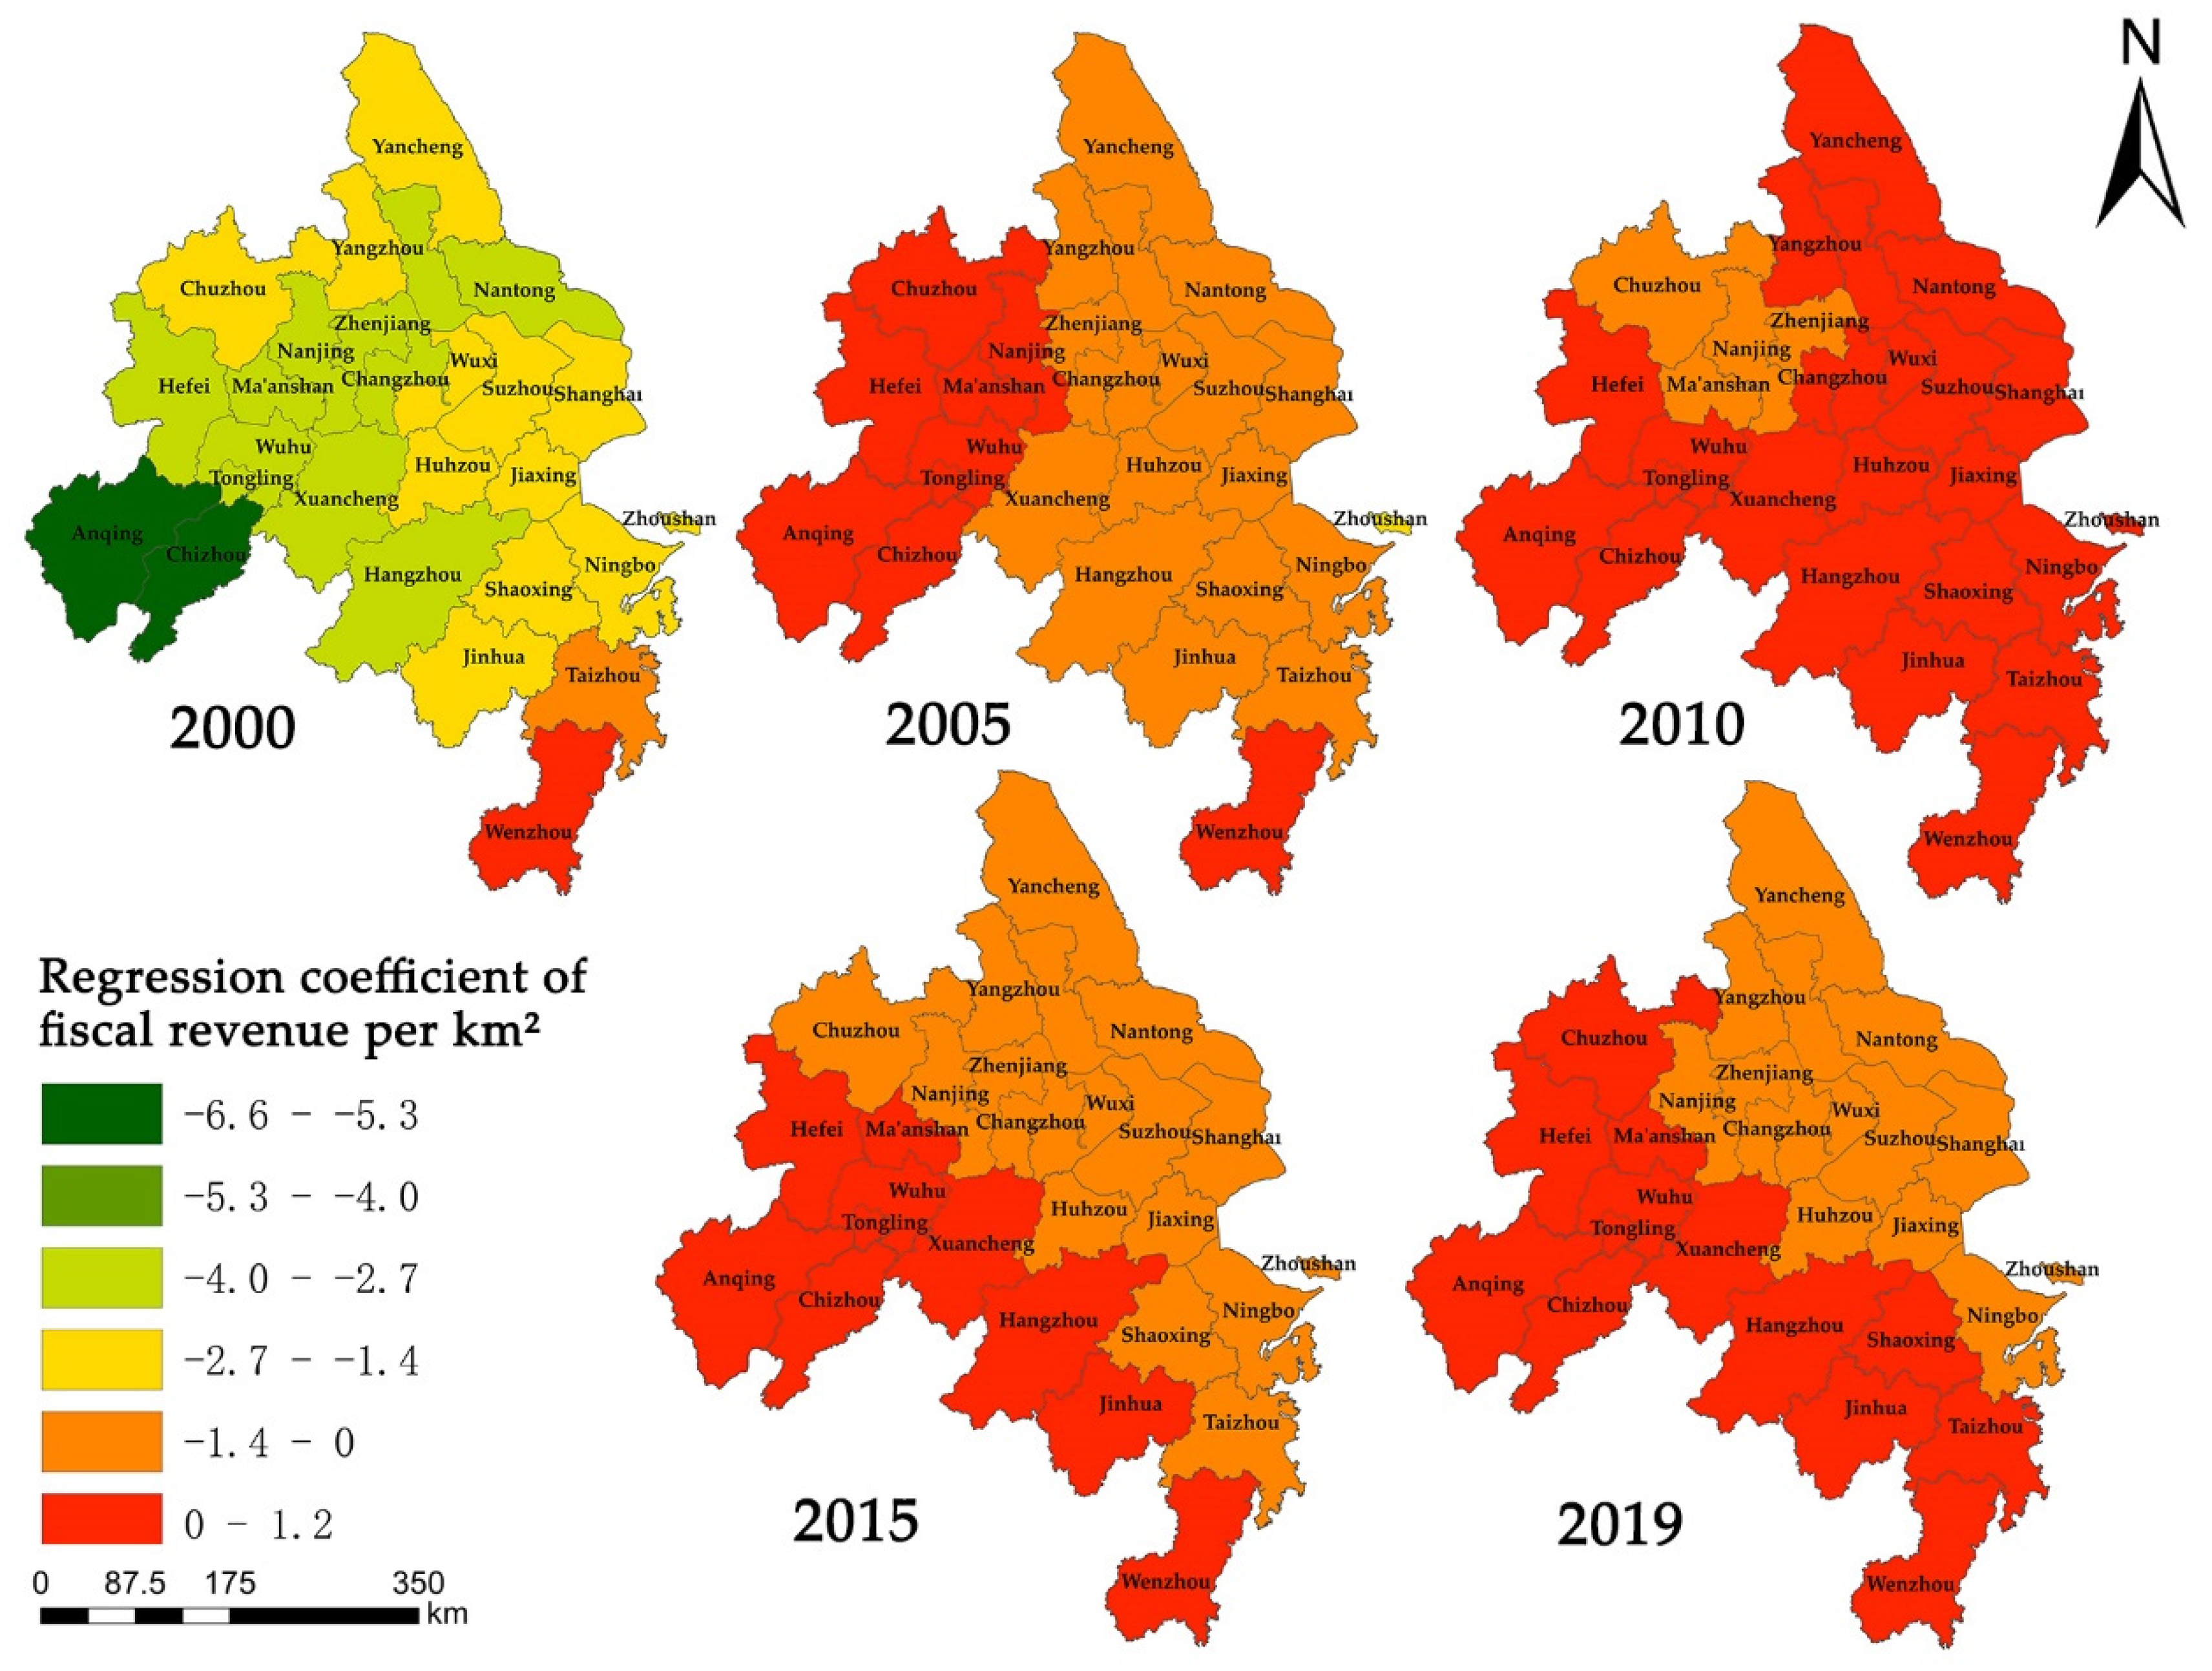
Due to the wide sources of fiscal revenue, the influence on coordinated urbanization development cannot be generalized. On the one hand, the government regulates and distributes fiscal revenue so that the funds are used in the most needed areas, which is beneficial to the coordinated development of the region. On the other hand, if the government pursues high finance, it will inevitably lead to the increase of tax revenue and reduce the enthusiasm for social production, which will damage the coordinated development of the region. The average influence coefficient of fiscal revenue per km2 on the coordinated urbanization development in the central area of the YRD gradually increased and basically reached a stable level after 2005 (Figure 8). By 2019, the number of positive and negative influence areas was the same. During the period, the positive influence was mainly focused on the south of Zhejiang Province. The economic development of these areas is relatively slow, the scale of fiscal revenue is relatively high and the government’s macro distribution tends to be good for the coordinated urbanization development in these areas. The overall economic development of the negative influence region is relatively good and the fiscal revenue base is large, but the scale is relatively small, and the market autonomy is strong. Therefore, the fiscal revenue per km2 has a negative influence on the coordinated urbanization development in these areas.

Figure 8.
Spatiotemporal distribution of regression coefficient of fiscal revenue per km2.
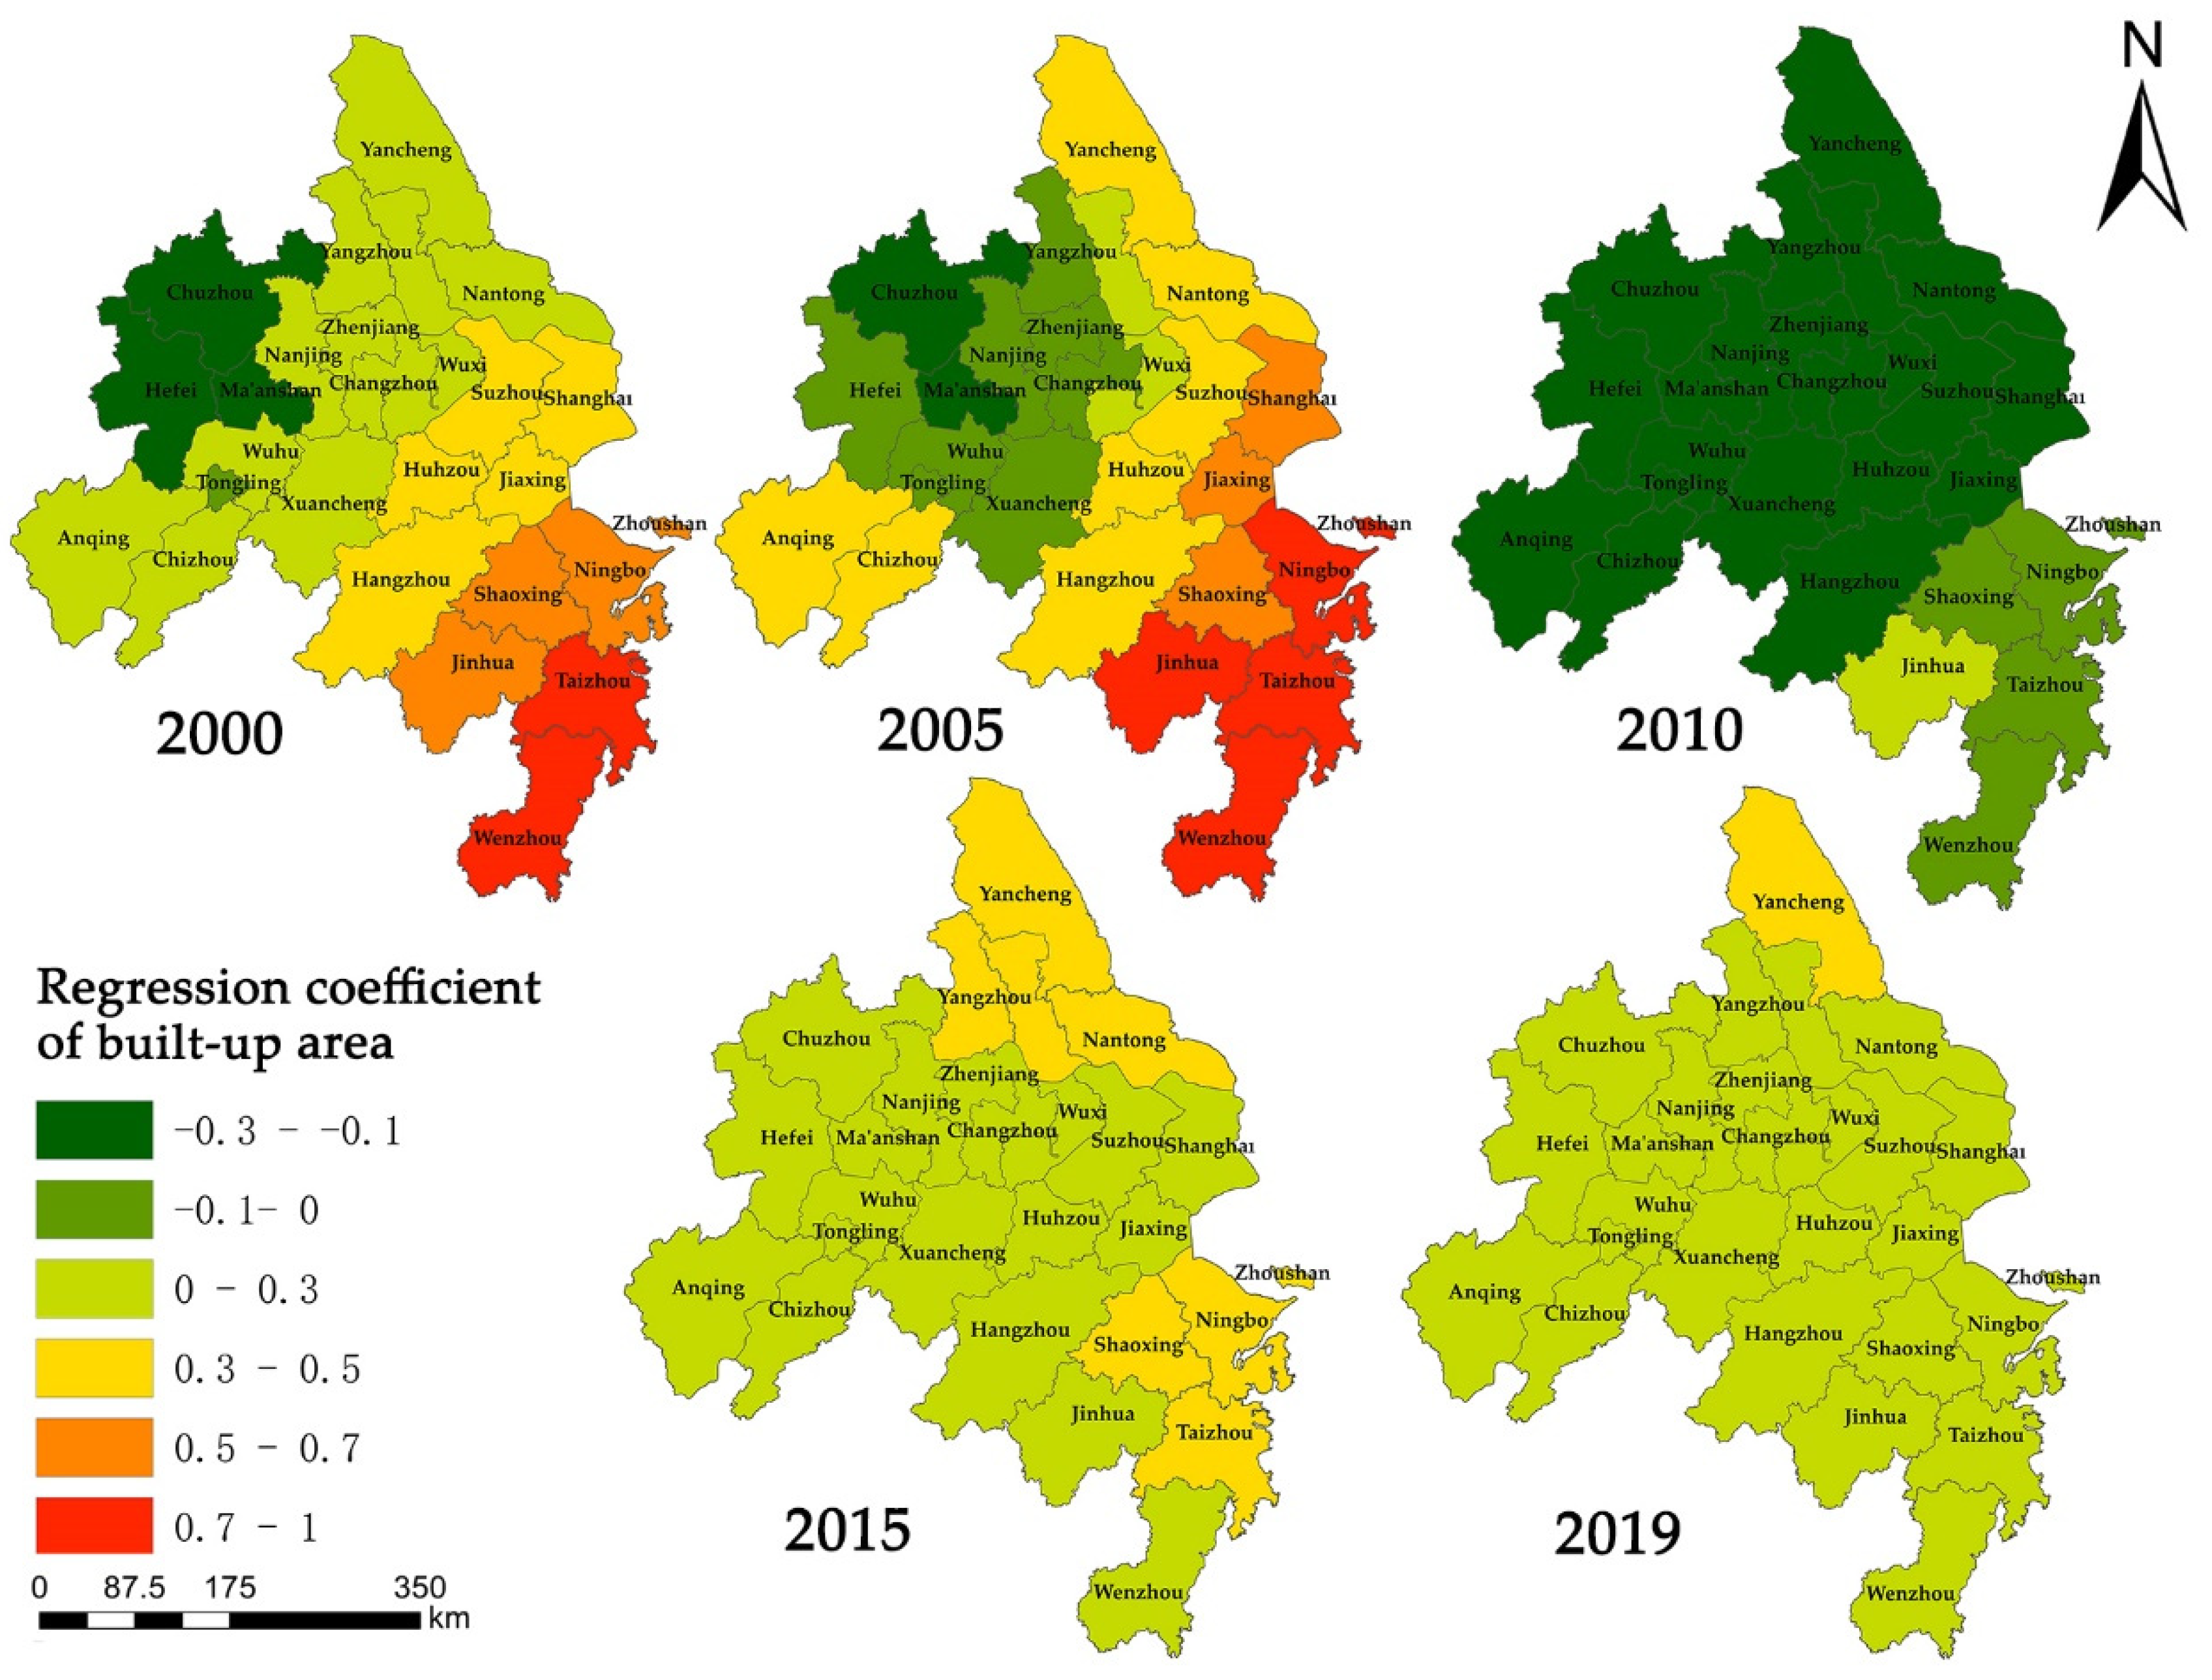
(3) Built-up area
Early in the study period, the influence of the built-up area on the coordinated urbanization development in the central area of the YRD had a large spatial difference. The increase of the built-up area had a negative impact on the coordinated urbanization development of the northwest cities and a positive influence on the cities in the southeast (Figure 9). By 2015, the influence of the built-up area was stable in a weak positive state. It is worth noting that in 2010, except Jinhua City, the built-up area had a negative influence on the whole central area, which is similar to the influence of population density. Due to the “Pan Yangtze River Delta” concept and the continuous expansion of the YRD, the investment enthusiasm of the region continued to rise and the built-up area expanded rapidly in this period, resulting in the uncoordinated development of land urbanization and other subsystems and a negative influence.

Figure 9.
Spatiotemporal distribution of the regression coefficient of built-up area.
(4) Per capita financial education expenditure
During the study period, the influence of per capita financial education expenditure on coordinated urbanization development developed from an overall strong positive influence in the early stage to an overall negative influence in the later stage (Figure 10). From 2000 to 2005 and then to 2010, the influence capability of per capita financial expenditure on education gradually decreased, but it was always a positive influence. Education investment can improve the overall quality of the population, optimize the population structure, and improve labor efficiency and optimize coordinated urbanization development. However, the short-term effect of education investment is not obvious, and the high proportion of financial funds used for education expenditure will also cause the poor coordination of regional development.
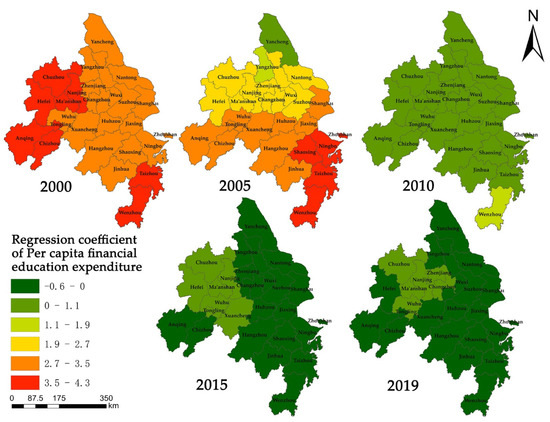
Figure 10.
Spatiotemporal distribution of regression coefficient of per capita financial education expenditure.
At the initial development stage of the central area of the YRD, there was a large professional talent gap. The implementation of education investment can directly promote the progress of science and technology, thus promoting full development. However, with the rapid development of the YRD, its location advantages gradually became obvious, attracting a large number of advanced scientific and technological workers and professionals from various fields. The talent gap gradually narrowed, and education investment was more focused on basic education. The influence of the continuous increase of per capita financial education expenditure was gradually weakened, and some regions even experienced a negative influence.
4. Discussions
4.1. Spatiotemporal Variation of Coordinated Urbanization Development
4.1.1. Time Characteristics
According to the comprehensive research results, the urbanization process in the central area of the YRD can be summarized into three stages:
(1) Disorder stage (2000–2005).
In this stage, the coordination degree increased from 0.033 to 0.48, and the coordination degree developed from an extremely disordered level to being on the verge of disordered, indicating that the development among various subsystems in the study area tended to be orderly but the whole area still remained at a disordered level. Compared with the urbanization index of each subsystem, it is found that the land and population urbanization developed rapidly, the social and economic urbanization developed relatively slowly, the overall development level of each subsystem was low, and the interdependence degree was low, which led to a disordered level of coordination.
(2) Running-in stage (2006–2011).
In this stage, the coordination degree continued to increase from 0.53 to 0.78. The development of each subsystem was more orderly, developing from a barely coordinated level to an intermediately coordinated level. Benefitting from the “Pan Yangtze River Delta” concept, the area of the YRD constantly expanded; at the same time, the superior development prospects attracted a large amount of floating population. Therefore, the population urbanization in this stage exhibited high-speed development, but the development of economic urbanization in the same period did not yet match it, and the regional economy had not yet shown the trend of rapid development.
(3) Coordination stage (2012–2019).
In this stage, the coordination degree finally reached the high-quality coordinated level, and its value increased from 0.804 to 0.998. With the proposal of the Development Planning of Yangtze River Delta Urban Agglomeration in 2016, this region had become one of the regions with the highest degree of economic development and the strongest innovation ability in China. The favorable location further attracted the influx of a large amount of talent and capital. At the same time, the plan proposed in its outline that the YRD should closely follow the two development keys of “integration” and being “high quality”. Therefore, land urbanization and social urbanization in the same period were also developing in a stable and orderly manner, and the coordination degree constantly improved.
4.1.2. Spatial Characteristics
From the perspective of the distribution of the coordination degree level, the overall coordinated development state of 27 cities has been shown to have improved, and the coordination level has continuously improved. As the core city of the YRD, Shanghai was far more powerful than other cities in all aspects, and its coordinated development level was always in the leading position. Some cities with relatively slow economic development, such as those in south-central Anhui and north-eastern Jiangsu, showed better coordination degree in the early stage than other cities in the same period, mainly because each subsystem of urbanization in these areas developed at a relatively slow speed, so the coordination degree in the early stage was relatively good. The remaining regions with rapid economic development had gradually transformed from the stage of rapid development and expansion to the later stage of high-quality development, indicating that the state of coordinated development was significantly improved. However, the above-mentioned regions with sluggish economic development entered the period of rapid expansion in the same period, so they gradually fell behind in terms of their coordination degree.
Considering the change of the center of gravity of the SDE in the development of the coordination degree, the spatial expansion direction of the coordinated urbanization development was mainly concentrated in the long axis direction and showed a concentration trend towards the long axis. The main reason for this was that the cities in this direction were advanced in terms of the development in the central area of the YRD, with high comprehensive strength, early coordinated urbanization development, and a good coordination status. Besides, the focus of coordinated development shifted southward, mainly because the southern cities in the central area are mainly in Zhejiang Province. In contrast to the development pattern of northern Jiangsu, central Jiangsu, and southern Jiangsu, the overall development of Zhejiang Province was relatively balanced and there was no obvious regional difference. At the same time, in recent years, the GDP growth rate of Zhejiang Province has been higher than that of the other two provinces. The industrial structure is reasonable, and the development momentum is good. Finally, the coordinated development center of urbanization has shifted to the south.
4.2. Characteristics of Driving Factors
According to the results of the GTWR model, this paper selected four factors to describe the subsystems of coordinated urbanization development. According to the results, we find that there are obvious differences in time and space between different subsystems in terms of coordinated urbanization development. In general, the influence on the coordinated urbanization development follows the order of economic urbanization > social urbanization > population urbanization > land urbanization. The rapid economic development in the YRD area has promoted the improvement of regional infrastructure and social services, thus attracting more high-quality talents. At the same time, the overall development pace of the YRD has been fast. Although it had experienced multiple instances of expansion through regional adjustments, including more cities, the overall land area was relatively scarce; thus, it should pay more attention to the efficient use of land resources to prevent the blind expansion of the urban area. Overall, a virtuous circle had been formed among the subsystems in the central area of the YRD, which leads to the continuous improvement of coordinated urbanization development.
4.3. Development Suggestions
Several suggestions can be made for the future development of the central area of the YRD:
(1) Optimizing countermeasures for economic urbanization
Economic development can promote the optimization of the industrial structure and attract the population by providing employment opportunities, thereby improving the urbanization level. However, the rapid economic growth, to a certain extent, will also limit the development of urbanization. From the regression coefficient of the per capita fiscal revenue, it can be seen that the overall impact of economic urbanization in the study area has gradually increased, but some local areas are still negatively affected. Therefore, all cities in the central region of the YRD should not blindly pursue rapid growth of economy and technology but should pay attention to the development quality of urbanization. At the same time, according to the different characteristics and environments of each region, they should continuously optimize the industrial structure and further strengthen the economic advantages.
The central cities of the YRD, such as Shanghai, Nanjing, and Wuxi, have strong comprehensive strength, better-coordinated urbanization development, and a more balanced influence from each subsystem. Therefore, in future development, the agglomeration effect of these core cities should be brought into play, and the radiation driving function should be expanded, promoting the high-quality improvement of new urbanization in the whole region. For example, by way of industrial transfer, part of the manufacturing industry or producer services can be transferred to the surrounding small cities, which can reduce labor costs and promote the development of the surrounding small cities, improving the overall coordination of regional urbanization.
For Huaibei, Western Anhui, and other cities, coordinated urbanization development is generally more complex, and the role of population and economic factors is more important. In the future development, these small cities should be more active in terms of docking with large cities such as Shanghai, Hefei, Nanjing, and Hangzhou, strengthening their cooperation in government, industry, science and technology, education, culture, health, sports, etc., constantly improving the city’s popularity and attracting excellent talent and capital to realize the benign situation of mutual benefit, win-win situation and common development between cities. At the same time, these cities need to constantly improve the coordination degree of their urbanization and promote high-quality urbanization development in the YRD area.
(2) Optimizing countermeasures for social urbanization
Overall, social urbanization in the study area has played a positive role in promoting the coordinated development of urbanization, and the effect is significant. However, as time goes by, the influence of social urbanization factors has gradually decreased. Except for a small part of central and northern Anhui, most other areas have even had a negative impact.
The main reason is that the investment return period in social urbanization is long, and the impact on the development of urbanization is difficult to see results in a short period. The central area of the YRD, as the pioneer area of economic development in China, has accumulated a lot of wealth in the past decades and has been widely used in the construction of social infrastructure, medical care, education, transportation, and other aspects. However, some cities did not take into account their actual situation and made blind investments without making reasonable plans. Intensive investment in the short term will lead to the waste of social resources and even negative impacts, thus affecting the coordinated development of the overall urbanization.
Therefore, all cities should focus their actual conditions in the future development, and rationally plan the proportion of social urbanization investment, to maximize the benefits of social resources. The social urbanization factors in Shanghai city, Zhejiang, Jiangsu, and southern Anhui province are already in a negative impact, so these areas should comprehensively consider all factors, formulate a reasonable social urbanization resource investment plan, and build. Additionally, the focus of development in the fields of medical, health care, education, technology, and construction of social infrastructure should be implemented on quality, and the benefits of investment are guaranteed to be implemented in the lives of the residents.
(3) Optimizing countermeasures for population urbanization
Except for Yancheng city, the population urbanization of other cities in the study area has a negative impact on the coordinated development of urbanization. At present, the resident population of cities has reached 162 million, accounting for 11.6% of China’s total population. As the population continues to increase, the social resources and land occupied per capita will decrease accordingly, and the resulting resource pressure will ultimately affect the development of urbanization. Therefore, in view of the current population status, it is necessary to further control the rapid expansion of the population.
In recent years, there has been a serious population loss in the northern part of Jiangsu province, and a large number of people have poured into Shanghai city, central and southern Jiangsu province to seek job chances. These regions should actively seek opportunities for industrial transfer, create more employment positions, and at the same time introduce corresponding preferential policies to improve the city’s reputation, retain local talents while attracting the inflow of foreign population, so as to realize the coordinated development of urbanization.
In the western cities of Anhui, the population has a negative impact on the coordinated development of urbanization. The main reason is that a large number of rural labor forces are concentrated in cities, and the cities cannot bear the load in the short term. These regions should actively seek institutional innovation, increase the degree of industrial concentration by establishing industrial parks, and at the same time continuously improve the industrial level, create enough job opportunities and social resources to carry the population gathering and turn the disadvantages of population concentration into population advantages. In addition, it is necessary to actively seek in-depth cooperation with developed regions in government affairs, education, industry, culture, science, technology, etc., continuously improve the city’s popularity, and attract outstanding talents and capital, so as to achieve a benign situation of mutual benefit and win-win between cities.
(4) Optimizing countermeasures for land urbanization
The impact of land urbanization has gradually stabilized from the initial “positive in the south and negative in the north” to a weak positive degree in the whole region, indicating that the region has paid attention to the quality of urbanization development in recent years, and the quality of land urbanization development is relatively high. The key to the healthy development of land urbanization is to continuously improve the intensive utilization degree of land resources and make deep use of the stock land. The urbanization development cannot simply pursue the expansion of land-use area but should take the actual development status of the region as the standard, aiming to provide high-quality production and living places for the urban residents in the region.
In future development, it is necessary to continue to strictly control the disorderly expansion of land, improve the intensive utilization of land stock, and plan and allocate land scientifically and rationally. Secondly, for cities with a certain urbanization foundation and rapid population agglomeration, it is necessary to appropriately increase the urban construction land quota, to balance the development of various factors in the process of urbanization.
To sum up, the process of urbanization is a manifestation of the dynamic changes and interactions of factors such as population, economy, society, and land. In the context of new urbanization, the urbanization development in the central area of the YRD cannot only consider the improvement of the urbanization level in a certain dimension, but must adhere to the concepts of innovation, coordination, and openness, explore scientific and effective economic development methods, and formulate healthy reasonable land resource management measures, improve the city’s supporting service system, create a green, healthy, and suitable new urban form, and further promote the healthy development of urbanization. In addition, different administrative regions have different historical backgrounds, geographical environments, and economic development conditions, so relevant factors should be fully considered when formulating urbanization development strategies.
5. Conclusions
The YRD area has gained a strategically important status in recent developments, not only for itself but the whole economic belt of Yangtze River. Coordinated urbanization development in the central area of the Yangtze River Delta is therefore of great significance. In this study, we used the coupling coordination model and Standard Deviation Ellipse method to explore the spatiotemporal variation of coordinated urbanization development in the central area of the YRD from 2000 to 2019. The GTWR model was used to study the driving factors of the coordinated urbanization development in this area because of the many factors involved in the coordinated development process. The results indicate that coordinated urbanization development in the central area of the YRD has experienced a change in status from disorder to coordination, and the cities with well-coordinated development have been mainly distributed along the northwest-southeast direction. In addition, economic urbanization had the greatest influence on the coordinated urbanization development in this region, and land urbanization had the least influence.
The present study is limited to the four dimensions of population, the economy, land, and society to evaluate the coordinated development of urbanization. However, as the influencing factors of the development become more complex and diversified, additional dimensions such as the environment and ecology should be added in further studies. At the same time, the emergence of some new social sensing data forms, such as floating vehicle trajectory and mobile positioning data, may provide more accurate information, which should be the focus of future research.
Author Contributions
Conceptualization, F.T. and G.T.; Data curation, F.T. and G.T.; Formal analysis, F.T. and G.T.; methodology, F.T. and G.T.; software, F.T. and Y.W; validation, F.T. and Y.W.; writing-original draft preparation, F.T. and T.Z.; writing-review and editing, F.T. and T.Z.; visualization, F.T. and T.Z.; supervision, G.T.; project administration, T.Z. and G.T. and funding acquisition, F.T. and G.T. All authors have read and agreed to the published version of the manuscript.
Funding
This research was funded by the National Natural Science Foundation of China under Grant 41930102, 41301514, and 41401456, in part by the National Social Science Foundation of China under Grant 19ZDA189; in part by the Natural Science and Technology Project of Nantong (MS12021082, MS12020075); in part by the National College Students Innovation and Entrepreneurship Training Program Grant 202110304041Z.
Institutional Review Board Statement
Not applicable.
Informed Consent Statement
Not applicable.
Data Availability Statement
Not applicable.
Acknowledgments
The authors would like to thank the anonymous reviewers who provided insightful comments on improving this article.
Conflicts of Interest
The authors declare no conflict of interest.
References
- Deng, X.; Huang, J.; Rozelle, S.; Zhang, J.; Li, Z. Impact of urbanization on cultivated land changes in China. Land Use Policy 2015, 45, 1–7. [Google Scholar] [CrossRef]
- Chen, M.; Liu, W.; Lu, D. Challenges and the way forward in China’s new-type urbanization. Land Use Policy 2016, 55, 334–339. [Google Scholar] [CrossRef]
- Chen, M.; Liu, W.; Tao, X. Evolution and assessment on China’s urbanization 1960–2010: Under-urbanization or over-urbanization? Habitat Int. 2013, 38, 25–33. [Google Scholar] [CrossRef]
- Lu, D.; Chen, M. Several viewpoints on the background of compiling the “National New Urbanization Planning (2014–2020)”. Acta Geogr. Sin. 2015, 70, 179–185. [Google Scholar]
- Wang, X.-R.; Hui, E.C.-M.; Choguill, C.; Jia, S.-H. The new urbanization policy in China: Which way forward? Habitat Int. 2015, 47, 279–284. [Google Scholar] [CrossRef]
- Shen, L.; Zhou, J. Examining the effectiveness of indicators for guiding sustainable urbanization in China. Habitat Int. 2014, 44, 111–120. [Google Scholar] [CrossRef]
- Liu, Y.; Liu, Y.; Chen, Y.; Long, H. The process and driving forces of rural hollowing in China under rapid urbanization. J. Geogr. Sci. 2010, 20, 876–888. [Google Scholar] [CrossRef]
- Zheng, W.; Walsh, P.P. Economic growth, urbanization and energy consumption—A provincial level analysis of China. Energy Econ. 2019, 80, 153–162. [Google Scholar] [CrossRef]
- John, F. Four Theses in the Study of China’s Urbanization. Int. J. Urban Reg. Res. 2006, 30, 440–451. [Google Scholar]
- Zhang, L.; Zhao, S.X. Reinterpretation of China’s under-urbanization: A systemic perspective. Habitat Int. 2003, 27, 459–483. [Google Scholar] [CrossRef]
- Lin, G.C.S. Peri-urbanism in Globalizing China: A Study of New Urbanism in Dongguan. Eurasian Geogr. Econ. 2013, 47, 28–53. [Google Scholar] [CrossRef]
- Chen, A.; Gao, J. Urbanization in China and the Coordinated Development Model—The case of Chengdu. Soc. Sci. J. 2019, 48, 500–513. [Google Scholar] [CrossRef]
- Sun, P.; Song, W.; Xiu, C.; Liang, Z. Non-coordination in China’s urbanization: Assessment and affecting factors. Chin. Geogr. Sci. 2013, 23, 729–739. [Google Scholar] [CrossRef] [Green Version]
- Lin, Y.; Li, Y.; Ma, Z. Exploring the Interactive Development between Population Urbanization and Land Urbanization: Evidence from Chongqing, China (1998–2016). Sustainability 2018, 10, 1741. [Google Scholar] [CrossRef] [Green Version]
- Han, H.; Li, H. Coupling Coordination Evaluation between Population and Land Urbanization in Ha-Chang Urban Agglomeration. Sustainability 2020, 12, 357. [Google Scholar] [CrossRef] [Green Version]
- Lv, T.; Wang, L.; Zhang, X.; Xie, H.; Lu, H.; Li, H.; Liu, W.; Zhang, Y. Coupling Coordinated Development and Exploring Its Influencing Factors in Nanchang, China: From the Perspectives of Land Urbanization and Population Urbanization. Land 2019, 8, 178. [Google Scholar] [CrossRef] [Green Version]
- Ma, L.; Cheng, W.; Qi, J. Coordinated evaluation and development model of oasis urbanization from the perspective of new urbanization: A case study in Shandan County of Hexi Corridor, China. Sustain. Cities Soc. 2018, 39, 78–92. [Google Scholar] [CrossRef]
- Lu, D. Function orientation and coordinating development of subregions within the Jing-Jin-Ji Urban Agglomeration. Progr. Geogr. 2015, 34, 265–270. [Google Scholar]
- Zhang, Y.; Su, Z.; Li, G.; Zhuo, Y.; Xu, Z. Spatial-Temporal Evolution of Sustainable Urbanization Development: A Perspective of the Coupling Coordination Development Based on Population, Industry, and Built-Up Land Spatial Agglomeration. Sustainability 2018, 10, 1766. [Google Scholar] [CrossRef] [Green Version]
- Li, Y.; Li, Y.; Zhou, Y.; Shi, Y.; Zhu, X. Investigation of a coupling model of coordination between urbanization and the environment. J. Environ. Manag. 2012, 98, 127–133. [Google Scholar] [CrossRef]
- Guo, Y.; Wang, H.; Nijkamp, P.; Xu, J. Space–time indicators in interdependent urban–environmental systems: A study on the Huai River Basin in China. Habitat Int. 2015, 45, 135–146. [Google Scholar] [CrossRef]
- Wang, Z.; Liang, L.; Sun, Z.; Wang, X. Spatiotemporal differentiation and the factors influencing urbanization and ecological environment synergistic effects within the Beijing-Tianjin-Hebei urban agglomeration. J. Environ. Manag. 2019, 243, 227–239. [Google Scholar] [CrossRef] [PubMed]
- Xu, D.; Hou, G. The Spatiotemporal Coupling Characteristics of Regional Urbanization and Its Influencing Factors: Taking the Yangtze River Delta as an Example. Sustainability 2019, 11, 822. [Google Scholar] [CrossRef] [Green Version]
- Fotheringham, A.S.; Crespo, R.; Yao, J. Geographical and Temporal Weighted Regression (GTWR). Geogr. Anal. 2015, 47, 431–452. [Google Scholar] [CrossRef] [Green Version]
- Mirzaei, M.; Amanollahi, J.; Tzanis, C.G. Evaluation of linear, nonlinear, and hybrid models for predicting PM2.5 based on a GTWR model and MODIS AOD data. Air. Qual. Atmos. Health 2019, 12, 1215–1224. [Google Scholar] [CrossRef]
- Ge, L.; Zhao, Y.; Sheng, Z.; Wang, N.; Zhou, K.; Mu, X. Construction of a Seasonal Difference-Geographically and Temporally Weighted Regression (SD-GTWR) Model and Comparative Analysis with GWR-Based Models for Hemorrhagic Fever with Renal Syndrome (HFRS) in Hubei Province (China). Int. J. Environ. Res. Public Health 2016, 13, 1062. [Google Scholar] [CrossRef] [Green Version]
- Wang, H.; Zhang, B.; Liu, Y.; Liu, Y.; Xu, S.; Zhao, Y.; Chen, Y.; Hong, S. Urban expansion patterns and their driving forces based on the center of gravity-GTWR model: A case study of the Beijing-Tianjin-Hebei urban agglomeration. J. Geograph. Sci. 2020, 30, 297–318. [Google Scholar] [CrossRef]
- NOAA National Centers for Environmental Information (NCEI). Available online: https://www.ngdc.noaa.gov (accessed on 17 April 2022).
- Jing, C.; Tao, H.; Jiang, T.; Wang, Y.; Zhai, J.; Cao, L.; Su, B. Population, urbanization and economic scenarios over the Belt and Road region under the Shared Socioeconomic Pathways. J. Geograph. Sci 2020, 30, 68–84. [Google Scholar] [CrossRef] [Green Version]
- Avtar, R.; Tripathi, S.; Aggarwal, A.K.; Kumar, P. Population–Urbanization–Energy Nexus: A Review. Resources 2019, 8, 136. [Google Scholar] [CrossRef] [Green Version]
- Bian, J.; Li, A.; Lei, G.; Zhang, Z.; Nan, X.; Liang, L. Inter-Calibration of Nighttime Light Data Between DMSP/OLS And NPP/VIIRS in the Economic Corridors of Belt And Road Initiative. In Proceedings of the IGARSS 2019–2019 IEEE International Geoscience and Remote Sensing Symposium, Yokohama, Japan, 28 July–2 August 2019; pp. 9028–9031. [Google Scholar]
- Tan, Y.; Wu, P.; Zhou, G.; Li, Y.; Bai, B. Combining Residual Neural Networks and Feature Pyramid Networks to Estimate Poverty Using Multisource Remote Sensing Data. IEEE J. Sel. Top. Appl. Earth Obs. Remote Sens. 2020, 13, 553–565. [Google Scholar] [CrossRef]
- Huang, W.; Wang, R.; Zu, S.; Chen, Y. Low-frequency noise attenuation in seismic and microseismic data using mathematical morphological filtering. Geophys. J. Int. 2017, 211, 1296–1318. [Google Scholar] [CrossRef]
- Huang, W.; Wang, R.; Zhang, D.; Zhou, Y.; Yang, W.; Chen, Y. Mathematical morphological filtering for linear noise attenuation of seismic data. Geophysics. 2017, 82, V369–V384. [Google Scholar] [CrossRef]
- Wang, D.; Sun, F. Geographic Patterns and Coupling-coordination Between Urbanization and Land Transportation Accessibility in the Yangtze River Economic Zone. Sci. Geogr. Sin. 2018, 38, 1089–1097. [Google Scholar]
- Ding, L.; Zhao, W.; Huang, Y.; Cheng, S.; Liu, C. Research on the Coupling Coordination Relationship between Urbanization and the Air Environment: A Case Study of the Area of Wuhan. Atmosphere 2015, 6, 1539–1558. [Google Scholar] [CrossRef] [Green Version]
- Kent, J.; Leitner, M. Efficacy of standard deviational ellipses in the application of criminal geographic profiling. J. Investig. Psychol. 2007, 4, 147–165. [Google Scholar] [CrossRef]
- Wang, B.; Shi, W.; Miao, Z. Confidence analysis of standard deviational ellipse and its extension into higher dimensional euclidean space. PLoS ONE 2015, 10, e0118537. [Google Scholar] [CrossRef]
- Ceccato, P.; Vancutsem, C.; Klaver, R.; Rowland, J.; Connor, S.J. A vectorial capacity product to monitor changing malaria transmission potential in epidemic regions of Africa. Malaria J. 2012, 2012, 595948. [Google Scholar] [CrossRef] [Green Version]
- Yang, T.-C.; Shoff, C.; Matthews, S.A. Examining the spatially non-stationary associations between the second demographic transition and infant mortality: A Poisson GWR approach. Spat. Demogr. 2013, 1, 17–40. [Google Scholar] [CrossRef] [Green Version]
- Huang, B.; Wu, B.; Barry, M. Geographically and temporally weighted regression for modeling spatio-temporal variation in house prices. Int. J. Geogr. Inf. Sci. 2010, 24, 383–401. [Google Scholar] [CrossRef]


Publisher’s Note: MDPI stays neutral with regard to jurisdictional claims in published maps and institutional affiliations. |
© 2022 by the authors. Licensee MDPI, Basel, Switzerland. This article is an open access article distributed under the terms and conditions of the Creative Commons Attribution (CC BY) license (https://creativecommons.org/licenses/by/4.0/).