Article

Poverty-Returning Risk Monitoring and Analysis of the Registered Poor Households Based on BP Neural Network and Natural Breaks: A Case Study of Yunyang District, Hubei Province

1
College of Oceanography and Space Informatics, China University of Petroleum (East China), Qingdao 266580, China
2
College of Computer Science and Technology, China University of Petroleum (East China), Qingdao 266580, China
*
Author to whom correspondence should be addressed.
Sustainability 2022, 14(9), 5228; https://doi.org/10.3390/su14095228
Submission received: 22 March 2022 / Revised: 21 April 2022 / Accepted: 23 April 2022 / Published: 26 April 2022
(This article belongs to the Section Sustainable Urban and Rural Development)

Abstract

:
To address the problem of subjectivity in determining the poverty-returning risk among registered poor households, a method of monitoring and analyzing the poverty-returning risk among households based on BP neural network and natural breaks method was constructed. In the case of Yunyang District, Hubei Province, based on the data of the poverty alleviation and development system, we constructed a monitoring system for the poverty-returning risk for the registered poor households. The spatial distribution pattern of households under the poverty-returning risk was analyzed from two scales of district and township, respectively, by combining Geographic Information Science, and the influence degree of indicators on the poverty-returning risk using mean impact value (MIV). The results show that: (1) The spatial distribution of the poverty-returning risk among the registered poor households in the study area basically coincides with the local natural poverty-causing factors and the degree of social and economic development. (2) The Poverty-Returning Risk Index for each township represents a globally strong spatial dependence with a Moran’s I coefficient of 0.352. (3) The past poverty identification status of registered poor households is the main factor to reduce the poverty-returning risk, and the past policy should remain unchanged for a period of time. (4) Improving the quality of education within households and focusing on helping households with older average age can further reduce the poverty-returning risk.

1. Introduction

Poverty is a major constraint to sustainable rural development [1] and has been a global problem [2]. Since 1970, with the transition of Western countries to a post-industrial society, many poverty issues have emerged [3]. According to the Millennium Development Goals: Country Report 2015, despite significant progress in global poverty reduction, more than 836 million people still live in extreme poverty without adequate food, clean water and sanitation in 2015 [4]. Alleviating poverty and achieving social equity and justice have become core objectives and strategic economic and social development requirements in all countries [5,6].
China is currently the largest developing country globally, and the management of rural poverty has been the focus of the Chinese government’s poverty alleviation and development planning and policy formulation [2,7]. With the successful completion of the battle against poverty, poor districts and counties around the country have been able to be lifted out of poverty one after another. In the process of the battle against poverty and result consolidation and expansion, preventing poverty returning and reducing the poverty-returning risk have become one of the most realistic and urgent issues among all challenges [8]. The establishment of a risk monitoring and early warning mechanism is an inevitable requirement for stabilizing the results of the battle against poverty, and is the key to changing post-facto assistance into pre-emptive prevention and achieving a dynamic zero poverty population [8]. In 2015, The State Council Leading Group Office of Poverty Alleviation and Development built a large centralized national poverty alleviation and development information system, containing five subsystems that support poverty alleviation and development business management, supervision and evaluation, business collaboration, decision support, and public service functions, and constructed a six-level business network covering the central government, provinces, cities, counties, townships, and administrative villages. The poverty alleviation and development information system has accumulated big data covering 128,000 poor villages, more than 30 million poor households, and more than 90 million poor people for the seven years from 2013 to 2019, providing a basis for quantitative studies to monitor the poverty-returning risk [9].
Unlike poverty measurement which is a measure of the extent to which different households are affected by poverty [10], G.L. et al. define the poverty-returning risk as to the likelihood of returning to poverty [11], B.W. et al. define the poverty-returning risk as to the probability of returning to poverty for the registered poor households that have been lifted out of poverty [12]. In this study, we defined the poverty-returning risk index (PRRI) to quantitatively measure the possibility of poverty returning after poverty alleviation for the registered poor households. From an objective conception, the PRRI refers to the possibility of returning to poverty of the registered poor households due to the variability of the development (economic, social, educational, scientific, and technological, etc.) within the country and the feeding power of the natural and ecological environment. In terms of subjective conceptions, PRRI refers to the possibility of returning to poverty status due to the inherent vulnerability and instability of the results of being lifted out of poverty among the registered poor households. According to statistics, from 2000 to 2015, China’s rural poverty-returning rate was basically above 20%, and 62% of the poor population was even returned to poverty in 2009 [13,14]. According to the preliminary survey of the Chinese government in 2020, nearly 2 million people who had been lifted out of poverty were at risk of returning to poverty.
Opinions of the Central Leading Group for Rural Work on Improving the Mechanism for Dynamically Monitoring the Prevention of Poverty Returning and Supporting Poverty Alleviation,No.7 [2021] Document of the Central Leading Group for Rural Work [15] mentions that advanced technical means should be fully utilized to provide timely classification and grading of early warning information back to the grassroots for verification. We should improve the big data monitoring platform for poverty-returning prevention, further strengthen the sharing of industry data and information, reduce the burden on the grassroots, rely on the national monitoring information system for poverty-returning prevention, make good use of the results of the national census on poverty alleviation, further improve the basic database of monitoring objects, do not duplicate construction, optimize the monitoring index system, coordinate the use of information resources, and avoid duplication of filling out forms and reporting data collection information. Thus, it is of great practical significance to fully explore the data of the national registered poor households information system, explore the characteristics of the poverty-returning risk in the existing data, formulate a scientific and reasonable index system for monitoring the poverty-returning risk, build a model for monitoring the poverty-returning risk, help poverty alleviation workers monitor the poverty-returning risk of the registered poor households, identify the indicators that affect the poverty-returning risk, provide decision support for the government to reduce the poverty-returning risk of the registered poor households, to dynamically adjust the help measures, improve the efficiency of the government, reduce the pressure of grassroots work, and consolidate the results of poverty alleviation.
In summary, the following research questions are posed in this paper. (1) To explore whether the poverty-returning risk still exists in the study area by mining the data of the registered poor households information system and selecting a typical sample. (2) To explore the relationship between the spatial distribution of the poverty-returning risk among the study area’s registered poor households and the distribution of local natural and socioeconomic conditions.(3) To explore which indicators reduce the poverty-returning risk, the degree of impact of each indicator, and what measures the government can take to reduce the poverty-returning risk.(4)To explore which indicators increase the poverty-returning risk and what measures the government can take to avoid increasing risk.

2. Research Review

Research outside of China has focused on the analysis of the causes of poverty [16,17], the identification and prediction of poverty levels [18,19], wealth disparity [20,21], and sustainable development [22,23,24], but little work has been seen on poverty-returning risk monitoring. The research on the top-level architecture of poverty-returning risk monitoring in China started earlier, and the results focused on the analysis of the causes of poverty-returning [25,26,27,28], the classification of poverty-returning warning types [29], the construction of poverty-returning warning models [25] and the construction of poverty-returning warning mechanisms [29,30,31]. Research on how to specifically implement poverty-returning risk monitoring started relatively late, and some scholars used hierarchical analysis and the Delphi method to assess the poverty-returning risk by combining grassroots research experience and expert scoring results [32,33]. Some scholars used logistic regression models to assess the poverty-returning risk using data of the registered poor households by field monitoring and researching [8], and relying on ordered Logit models to reveal the basic causes of the dynamic transformation of poverty [11]. Some scholars have combined the time-series relationship within the poverty alleviation data to construct a Hidden Markov Model for poverty alleviation object status prediction to achieve the prediction of poverty, lifting out of poverty, and poverty-returning status [34]. With the rapid development of interdisciplinary methods such as machine learning, scholars have tried to reduce the artificial subjectivity of the poverty-returning risk monitoring, such as using integrated learning algorithms to achieve accurate classification of three categories of people who have not escaped from poverty, have been lifted out from poverty, and have returned to poverty [35]. Borrowing and extending the Monte Carlo simulation method for calculating VaR (Value at Risk), scholars calculated the poverty-returning risk (probability) for households that had been lifted out of poverty [12].
In general, the research on the poverty-returning risk monitoring has made great progress, but there are still the following shortcomings: (1) Less mining of the data of the national registered poor households information system and focusing on redesigning indicators to collect data, which will increase the burden of grassroots staff in practice; (2) Lack of typicality in the selection of samples, although it has achieved wide coverage, little exploration of the typical characteristics of the data itself; (3) The data mining mostly stays in linear or generalized linear models, while the complex problem of the poverty-returning risk monitoring, which involves human behavior, has strong non-linear characteristics. Although machine learning related methods have been used in the field of the poverty-returning risk monitoring research, the current research still remains with the classification problem of monitoring whether the registered poor households will return to poverty without carrying out the problem of determining the poverty-returning risk; (4) It mainly focuses on regional poverty-returning research, while the conclusions obtained are somewhat different from the requirements of accurate monitoring of the poverty-returning risk to households and people.
Based on this, this paper takes the former national poverty-stricken county, Yunyang District, as an example, verifies the data based on the registered poor household data, using on-site research and big data verification, and extracts the main influencing factors of the poverty-returning risk by using correlation analysis. On this basis, we constructed a poverty-returning risk monitoring system, extracted typical samples by natural breaks, trained a BP neural network for poverty-returning risk monitoring, quantified and analyzed the poverty-returning risk for the registered poor households in the Yunyang District, analyzed the sources and spatial distribution patterns of the poverty-returning risk at both household and township scales, and gave the extent to which each indicator affects the poverty-returning risk. It narrows the research granularity of poverty-returning risk monitoring, makes the research object more refined, and provides certain solution ideas to solve the problems of complicated operation, vague factors, large discretion, and too strong subjectivity in poverty-returning risk monitoring.

3. Materials and Methods

3.1. Technique Route and Research Analysis

3.1.1. Technique Route

The study of poverty returning, is characterized by non-linearity, uncertainty, and spatiality under the combined effect of natural and social factors, and it is often difficult to obtain ideal results by simple cause-and-effect analysis using linear methods [36].
Based on the calculation and processing of the data of the registered poor households from the study area, this paper determines the main risk factors for poverty-returning after the normality test and correlation analysis of the factors influencing poverty-returning. The natural breaks method is used to classify the ranking and obtain the training sample data of PRRI. By repeatedly training and learning through BP neural network and constantly revising the weights, the simulation network model of PRRI is calculated.
This is performed by using the trained network to calculate the PRRI for each household, analyzing the risk sources from two scales of each township and Yunyang District, summarizing the conclusions, and putting forward targeted suggestions, the technique flowchart is shown in Figure 1.

3.1.2. Research Analysis

There was a dearth of available data that had been collected from the registered poor households in the poverty alleviation work, considering the “causes of poverty” that lead ordinary households to become deeply poor and be identified, since poor households are logically consistent with the “causes of returning to poverty” that lead the households to the poverty-returning risk and become identified as returning to poverty [8]. Referring to previous scholars who used GDP indicators to measure poverty [37,38], we considered using individual economic indicators to monitor the poverty-returning risk. The No.6 [2020] Document of the State Council Leading Group Office of Poverty Alleviation and Development, Opinions of the State Council Leading Group of Poverty Alleviation and Development on Establishing the Mechanism for Monitoring the Prevention of Poverty Returning and Supporting Poverty Alleviation (hereinafter referred to as Opinions), determines the scope of monitoring registered poor households by monitoring per household capita disposable income. We decided to use the “per household capita net income” from the national registered poor households information system as an indicator to reflect the poverty-returning risk of the registered poor households.
According to China’s National Bureau of Statistics, the main difference between peasants per household capita net income and per household disposable income is that transfer expenses such as social security contributions and property expenses such as interest on living loans are deducted from the net income. In China’s criteria for identifying poverty, poverty alleviation, and poverty-returning, separate ranges are set for per household capita disposable and per household capita net income, such as per household capita disposable above 1.2 times the first poverty criteria (per household capita net income above 1.2 times the second poverty criteria), with the selection of the two indicators determined by the local government, and whether returns to poverty or not depending on the number of times exceeded. Further, the difference between the two indicators is minor when the statistical unit is the year. Moreover, both are essentially used to reflect peasants’ income levels and can reflect the magnitude of the poverty-returning risk. According to the conclusion of Z.J. et al., “the poverty-returning risk is negatively correlated with the income” [39], and combined with the Opinions, it is known that the higher the per household capita net income of households, the lower the poverty-returning risk. Therefore, it is feasible to select the per capita net income data provided by the Yunyang District Government.
However, according to the team’s extensive research, it was found that the update cycle of per household capita net income is long, the measurement work requires multi-departmental collaboration, and there are data barriers between departments, so the workload of grassroots measurement is large and cumbersome. The average value of labor force score, the number of people in the household, the average age of the household, the average value of education status score of the household, and the past poverty determination score of the household out of poverty are all easy to obtain and calculate. The update frequency is fast, and the grassroot forces such as the rural revitalization department and the majority of rural cadres and rural grid members are constantly collecting them in real-time. Therefore, we considered using these indicators to realize the characterization of the per household capita net income with established cards and thus realize the dynamic monitoring of the poverty-returning risk.

3.2. Overview of the Study Area

Yunyang District, located in northwest Hubei Province, is the core water source area of the South-North Water Transfer Project and Qinba concentrated destitute areas, spanning 32°25′ to 33°16′ north latitude, across 110°07′ to 111°16′ east longitude. It is 92 km wide from north to south and 108 km long from east to west, with a total area of 3832 square kilometers, 16 towns, 3 townships, and one forest field. And was once a national poverty-stricken county that is old, mountainous, border-located, poor, and near to the Sanxia Reservoir (Figure 2). Local residents are actively exploring relocation to alleviate poverty. By the end of 2019, the poverty incidence rate of Yunyang District dropped from 35.63% in 2014 to 0.21%. Over the five years, more than 160,900 people were lifted out of poverty. In April 2020, approved by the Hubei Provincial People’s Government, Yunyang District withdrew from the poverty-stricken county sequence. However, an epidemic was encountered in 2020, and the task of consolidating the results of poverty alleviation is arduous. Some registered poor households have a greater poverty-returning risk.

3.3. Data Source and Pre-Processing

The original data of the indicators are obtained from the data of registered poor households 2018 of the Yunyang District, Shiyan City, Hubei Province. In this paper, the data are processed as needed. Five indicators are selected: the household labor force mean score, the number of people in the household, the mean age in household, the household education status mean score, and the past poverty determination mean score of the registered poor households. The values assigned as needed are described as follows (Table 1).
1.
The household labor force mean score: the ratio of the sum of labor force scores in households to the number of people in households
The number of labor force members in a household is an important factor affecting the poverty-returning of a household and has a direct impact on the level. If a household has no labor force or lacks labor force, it will be easy to return to poverty. As the number of labor force members in a household increases, the probability of poverty-returning will gradually decrease. In rural areas, a larger labor force means a stable and sustainable family income, especially with the promotion of the work of shifting customs and wisdom, the productivity of the labor force is constantly improving. In contrast, the support measures for households lacking or without labor are usually “blood transfusion poverty alleviation”, which is more dependent on the targeting and policy stability of support [8]. The household labor force scoring is shown in Table 1.
2.
The number of people in the household
The number of family members is also an important factor affecting the poverty-returning risk, and when the number of family members is more than two and less than or equal to six, such families usually have a reasonable family structure and are less likely to return to poverty. When the number of family members is too small or too large, they are prone to deep poverty or return to poverty [28].
3.
The mean age in household: the ratio of the total age of each household member to the total number of household members
Z.X. [28] concluded from the statistical analysis of the basic data of poverty-returning families that, first, the population pyramid of the poverty-returning group is oblique “gourd-shaped”, and the total dependency ratio of the labor force in the prime of life is too high and burdensome, and how to allocate the originally limited family resources is undoubtedly the primary problem they face. Second, “aging” is particularly prominent. This group has entered the stage of deep aging, especially the old-age couples without children and elderly single households in rural areas that have outstanding pension problems.
4.
The household education status mean score: the ratio of the sum of education status scores in households to the number of people in households
Low education level, lack of professional skills, and weakened ability to become rich are important reasons for rural people who have been lifted out of poverty to return to poverty. In particular, with the increasing modernization of agricultural production and the transformation of modern production methods, many people who have been lifted out of poverty with relatively low knowledge and skills have encountered difficulties in sustainable livelihood development, such as “difficulties in adaptation, employment, and development” [14]. In this paper, the values are assigned in [1,5] for different educational situations (Table 1).
5.
The past poverty determination mean score of the registered poor households
The registered poor households are identified by the precise poverty alleviation system, which basically represents the original poverty situation within the household. It is still necessary to maintain a focus on them after they are lifted out of poverty to prevent them from returning to poverty [29]. This paper assigns values based on past poverty determination (Table 1).
As the units of each indicator are not uniform, the data are controlled in the range of [0, 1] by normalization.
Normalized formula:
Y = X - X m i n X m a x - X m i n
where X is the value before normalization, Xmax and Xmin are the maximum and minimum values before normalization, respectively, and Y is the value after normalization.

3.4. Indicators Selection

The data are tested for normality using skewness and kurtosis [40], while their corresponding Z-scores are calculated. According to the test, the data of the five selected indicators did not obey a normal distribution (Table 2).
On this basis, Spearman correlation analysis is conducted between the selected indicators and the per household capita net income to clarify the main influencing factors of the poverty-returning risk. Meanwhile, it is also used to provide basic information for the construction of the artificial neural network model. The results of the correlation analysis are shown in Table 3.
As shown in Table 3, the mean age in households, the household education status mean score, and the past poverty determination of the registered poor households have a highly significant positive relationship with the per household capita net income. The household labor force mean-score and the number of people in the households have a highly significant negative relationship with the per household capita net income. These indicators can be used to characterize per household capita net income and the higher per household capita net income, the lower the poverty-returning risk. Therefore, the analysis shows that the mean age in households, the household education status mean score, and the past poverty determination of the registered poor households are the main factors to reduce the poverty-returning risk. The household labor force mean-score and the number of people in the households are the main factors to increase the poverty-returning risk. These five indicators can be used to reveal the poverty-returning risk. So far, we have identified five indicators used to calculate PRRI in preparation for the following construction of the index system of PRRI and the calculation of the risk level of poverty-returning.

3.5. Methods

3.5.1. Constructing the Indicator System of the Poverty-Returning Risk Index

According to the results of correlation analysis and the principles of data availability and processability, this paper selects the household labor force mean score, the number of people in the household, the mean age in the household, the household education status mean score, and the past poverty determination mean score of the registered poor households to construct the index system of the poverty-returning risk (noted as X1-X5, respectively).

3.5.2. Divide the Level to Obtain Training Samples by Natural Breaks

Natural breaks is a statistical method for classifying categories and classes of values based on their distribution characteristics. The natural breaks maximizes the differences between classes, similar group values, and sets boundaries at the values with large differences for classification [41,42,43,44].
Since there is no universal evaluation standard for the study of PRRI, coupled with the skewed distribution of data samples (Table 3), the natural breaks is used to classify the levels (Table 4), and each row of data in the Table corresponds to the boundary values of different influencing factors at each poverty-returning risk level. The natural poverty index is divided into five levels, the ranking of indicators is adjusted to the same direction as the increase of the poverty-returning risk according to the correlation coefficient between each indicator. The per capita net income within the household and the five poverty-returning risk levels are set linearly, based on which linear interpolation is performed between each level to expand the sample of training data constructed for the artificial neural network.

3.5.3. BP Neural Network Construction

In this paper, a BP network containing only one hidden layer (three layers) is selected for simulation, among which, the number of neurons in the hidden layer is initially designed based on experience, and its empirical formula is:
N H = N 1 N 0 + N P 2
where NH is the number of nodes in the hidden layer; N1 is the number of nodes in the input layer; N0 is the number of nodes in the output layer; Np is the number of training samples, while the statistics to test the optimal number of hidden layer neurons is evaluated using the training speed, (i.e., the least number of training is optimal).
The training function is ‘traingdm’, which is a batch feedforward neural network training method, which not only has a faster convergence speed, but also introduces a momentum term, which effectively avoids the local minimum problem in the network training. In this network, the target error is set to 10−10, the maximum number of training times is 10−5, and other parameters use default values. There are 5 input neurons (indicators of the poverty-returning risk), 28 hidden layer neurons after repeated testing, 1 output neuron (PRRI), and the topology of the PRRI simulation network model is 5 × 28 × 1.
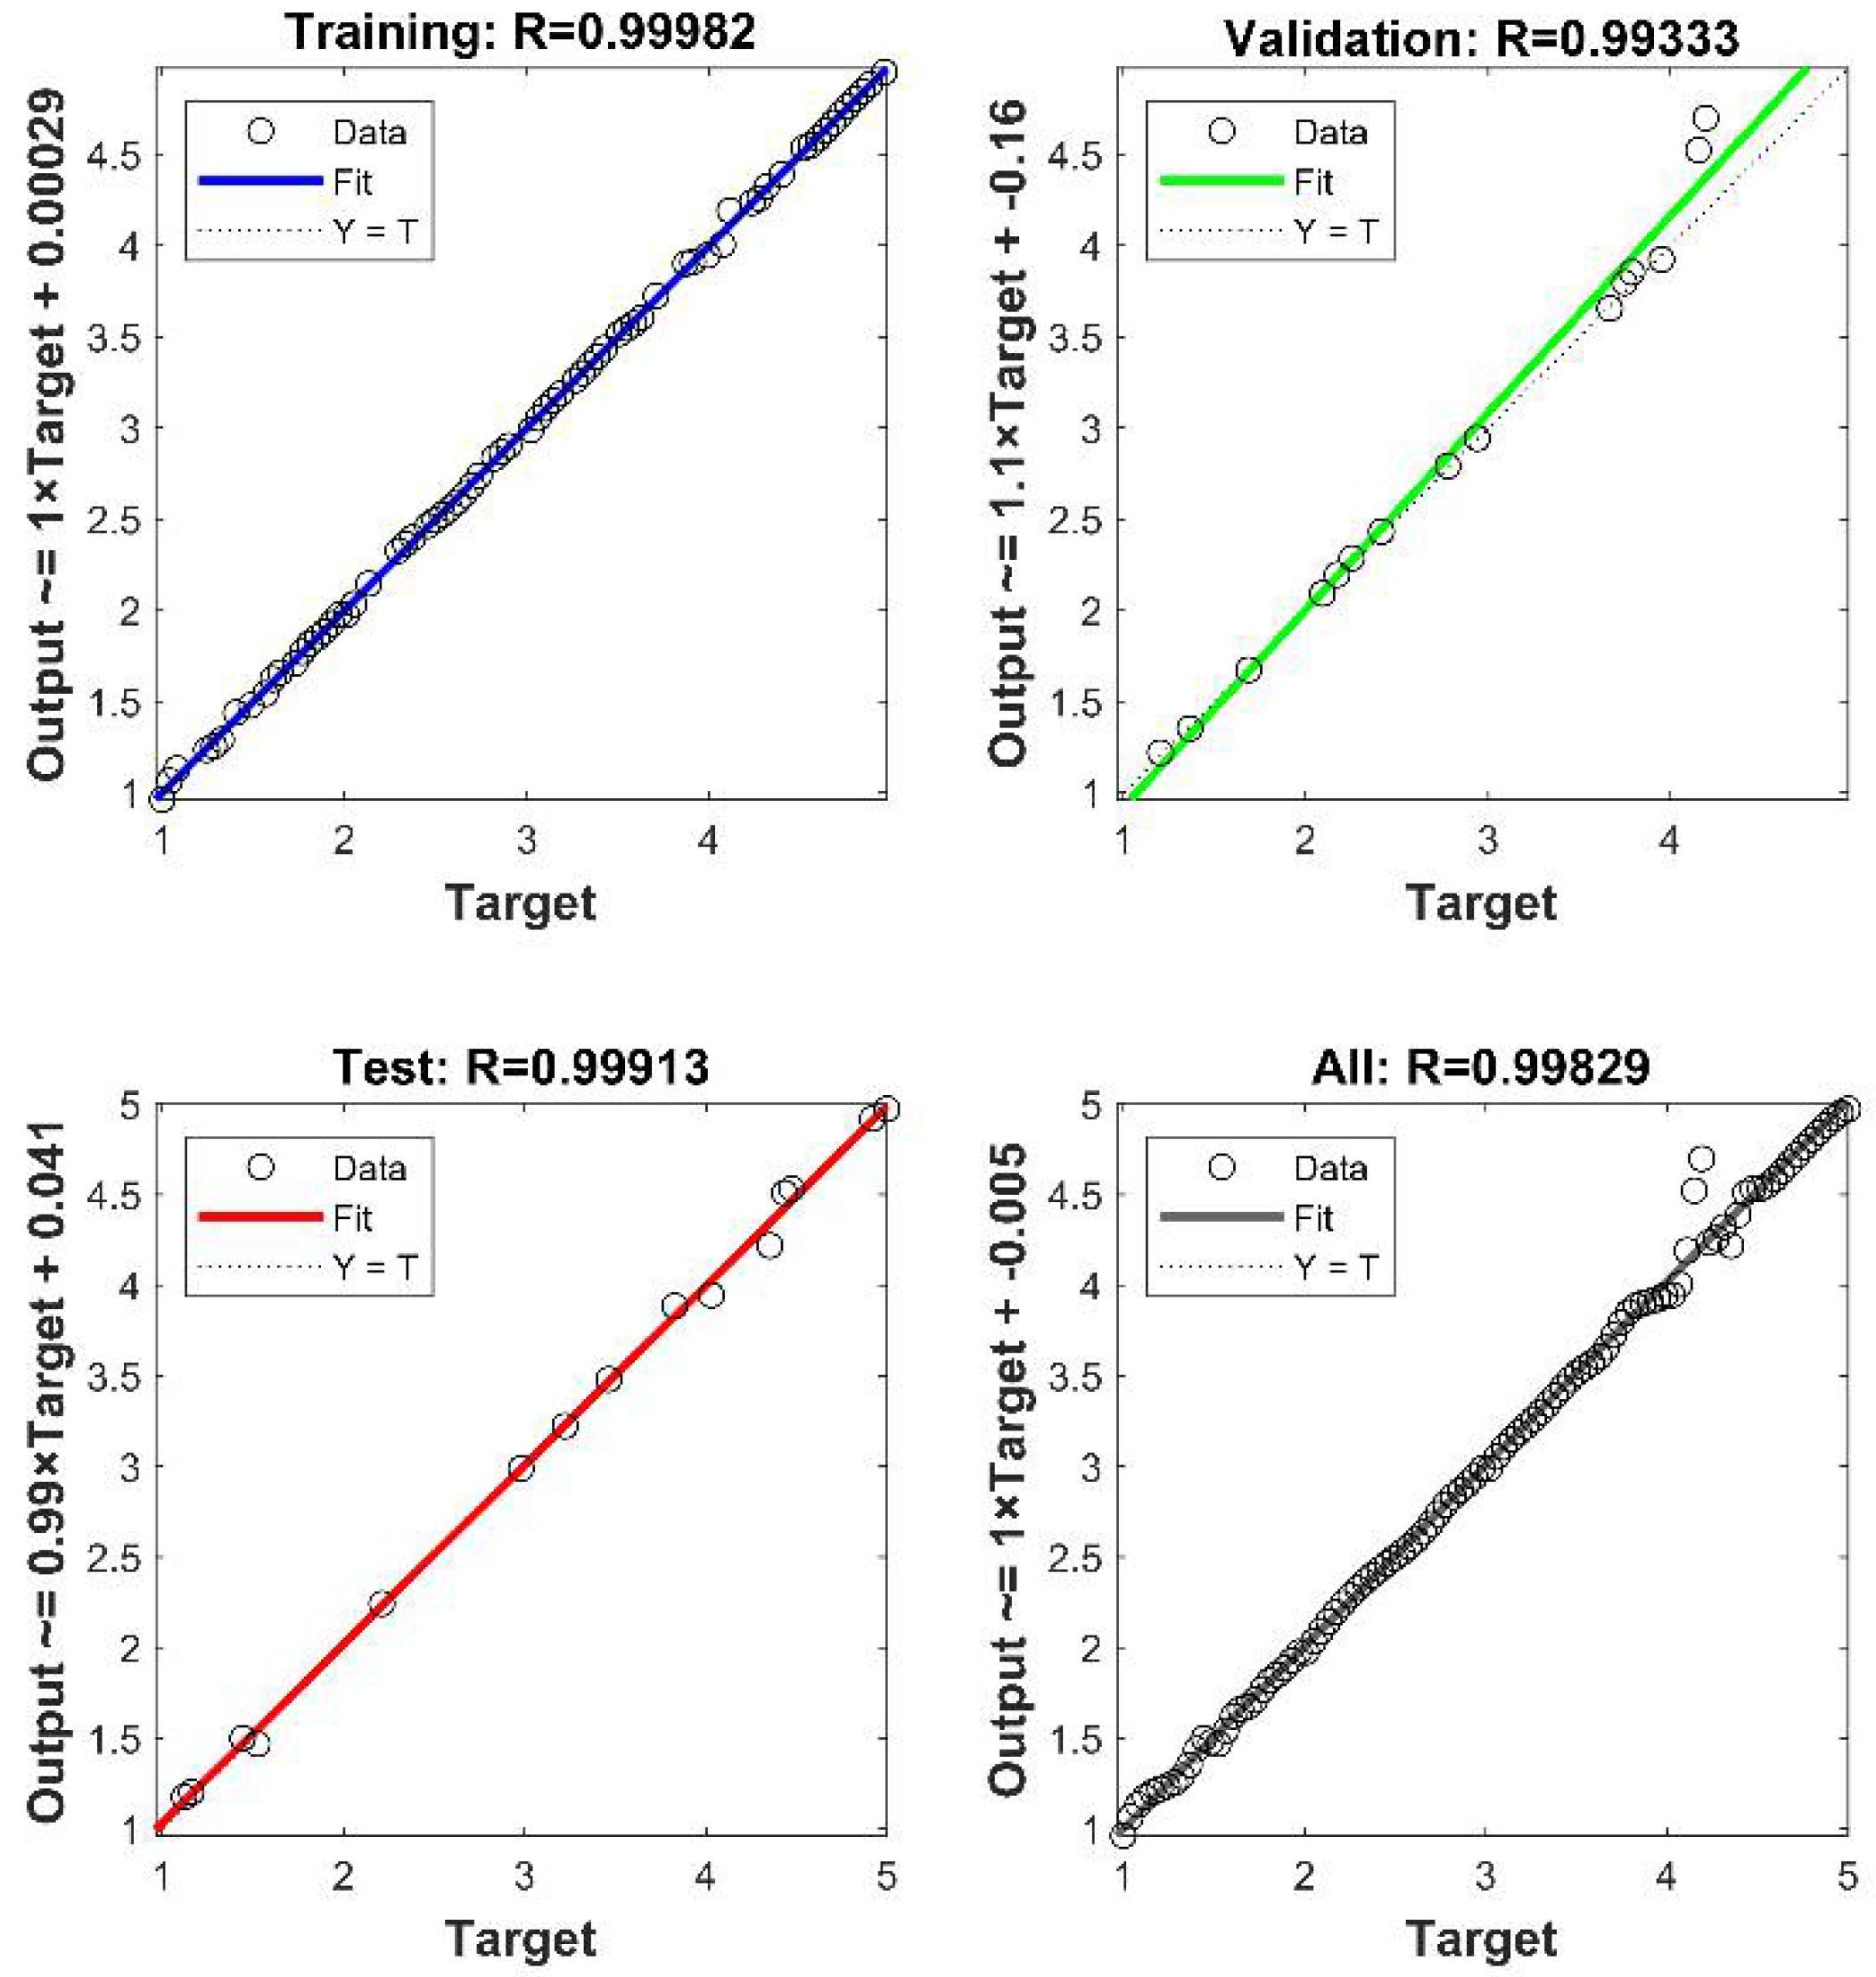
The BP neural network is simulated 2739 times to achieve the preset accuracy with an actual error of 0.01%, and the R-values of both the test and validation sets are above 0.998, which is a good fit (Figure 3). Overall, the training results of the BP neural network are good, and the PRRI model established with the neural network is accurate and effective, and could be used to simulate the PRRI of each household.

3.5.4. Mean Impact Value

MIV is an indicator that evaluates the importance of the independent variable on the dependent variable [45] and can be used to measure the degree of influence of the selected indicators on the output of the neural network. It is considered as one of the best indicators to evaluate the correlation of variables in neural networks [46]. Its sign indicates the direction in which the independent variable is correlated with the dependent variable, and the absolute magnitude represents the relative importance of the influence of the independent variable on the dependent variable [47].
The contribution of the i-th indicator xi to the output value y of the BP neural network is further calculated as
β i = M I V i i = 1 n M I V i

3.5.5. Spatial Autocorrelation Model

The spatial autocorrelation model was used to analyze the spatial dependence distribution patterns of PRRI in the townships of Yunyang District. Spatial autocorrelation was used to test the significance of the association between the value of an elemental attribute and its neighboring elemental attribute values [48]. There are global spatial autocorrelation and local spatial autocorrelation. In this paper, the global Moran’s I index was used to reflect the degree of spatial dependence of PRRI among the townships in the Yunyang District.

4. Results

The normalized data of 48,864 households to be analyzed were fed into the trained network and run to produce the results of each household’s PRRI. It is worth noting that there are values beyond the set poverty-returning risk level 1–5 in the simulated results of the neural network. We give this explanation: when setting the poverty-returning risk level, we adjust the indicator ranking in the same direction as the increase of the poverty-returning risk based on the correlation coefficient between each indicator and the per capita net income of the household, and linearly set the poverty-returning risk level and interpolate to obtain the training samples. However, the nonlinear neural network does not monotonically increase and may appear to be out of the set range when performing the fitting learning.

4.1. Overall Analysis of the Yunyang District

It was calculated that the sample households had different poverty-returning risks, and with reference to the previous hierarchical classification method [32], the specific meaning PRRI is given in this paper (Table 5). The average PRRI of the sample is 3.3986, with a standard deviation of 1.3397. From the distribution of the PRRI, 24.14% of the respondents had a PRRI less than 2 (low risk), 18.89% had a PRRI of 2–3 (low risk), 20.86% had a PRRI of 3–4 (medium risk), 13.32% had a PRRI of 4–5 (high risk), and 22.79% had a PRRI greater than 5 (very high risk). As a former national poverty-stricken county, Yunyang District has a large base of registered poor households. After being lifted out of poverty, owing to various reasons such as the impact of the epidemic, the households that had finished being lifted out of poverty faced the poverty-returning risk again. Yunyang District has a single industrial structure and a complex composition of population sources, especially self-recovery ability has become weak after the epidemic, generating a large number of households with a high poverty-returning risk to be lifted out of poverty. It should be noted that in the coming period of time, there is still a need to follow up and monitor the households registered to ensure that poverty will not return, so as to consolidate the quality of poverty alleviation.

4.2. Analysis by Township

According to the above calculation method, the risk level of poverty-returning for each household can be calculated. The households are grouped according to their townships, the average value of PRRI and the proportion of households in each interval are obtained for each township. Therefore, the initial data are arranged from highest to lowest according to the very high risk (PRRI 5). The table of the proportion of households with different poverty-returning risk indices in each township is obtained (Table 6), and some of the middle township data are omitted due to the large amount of data.
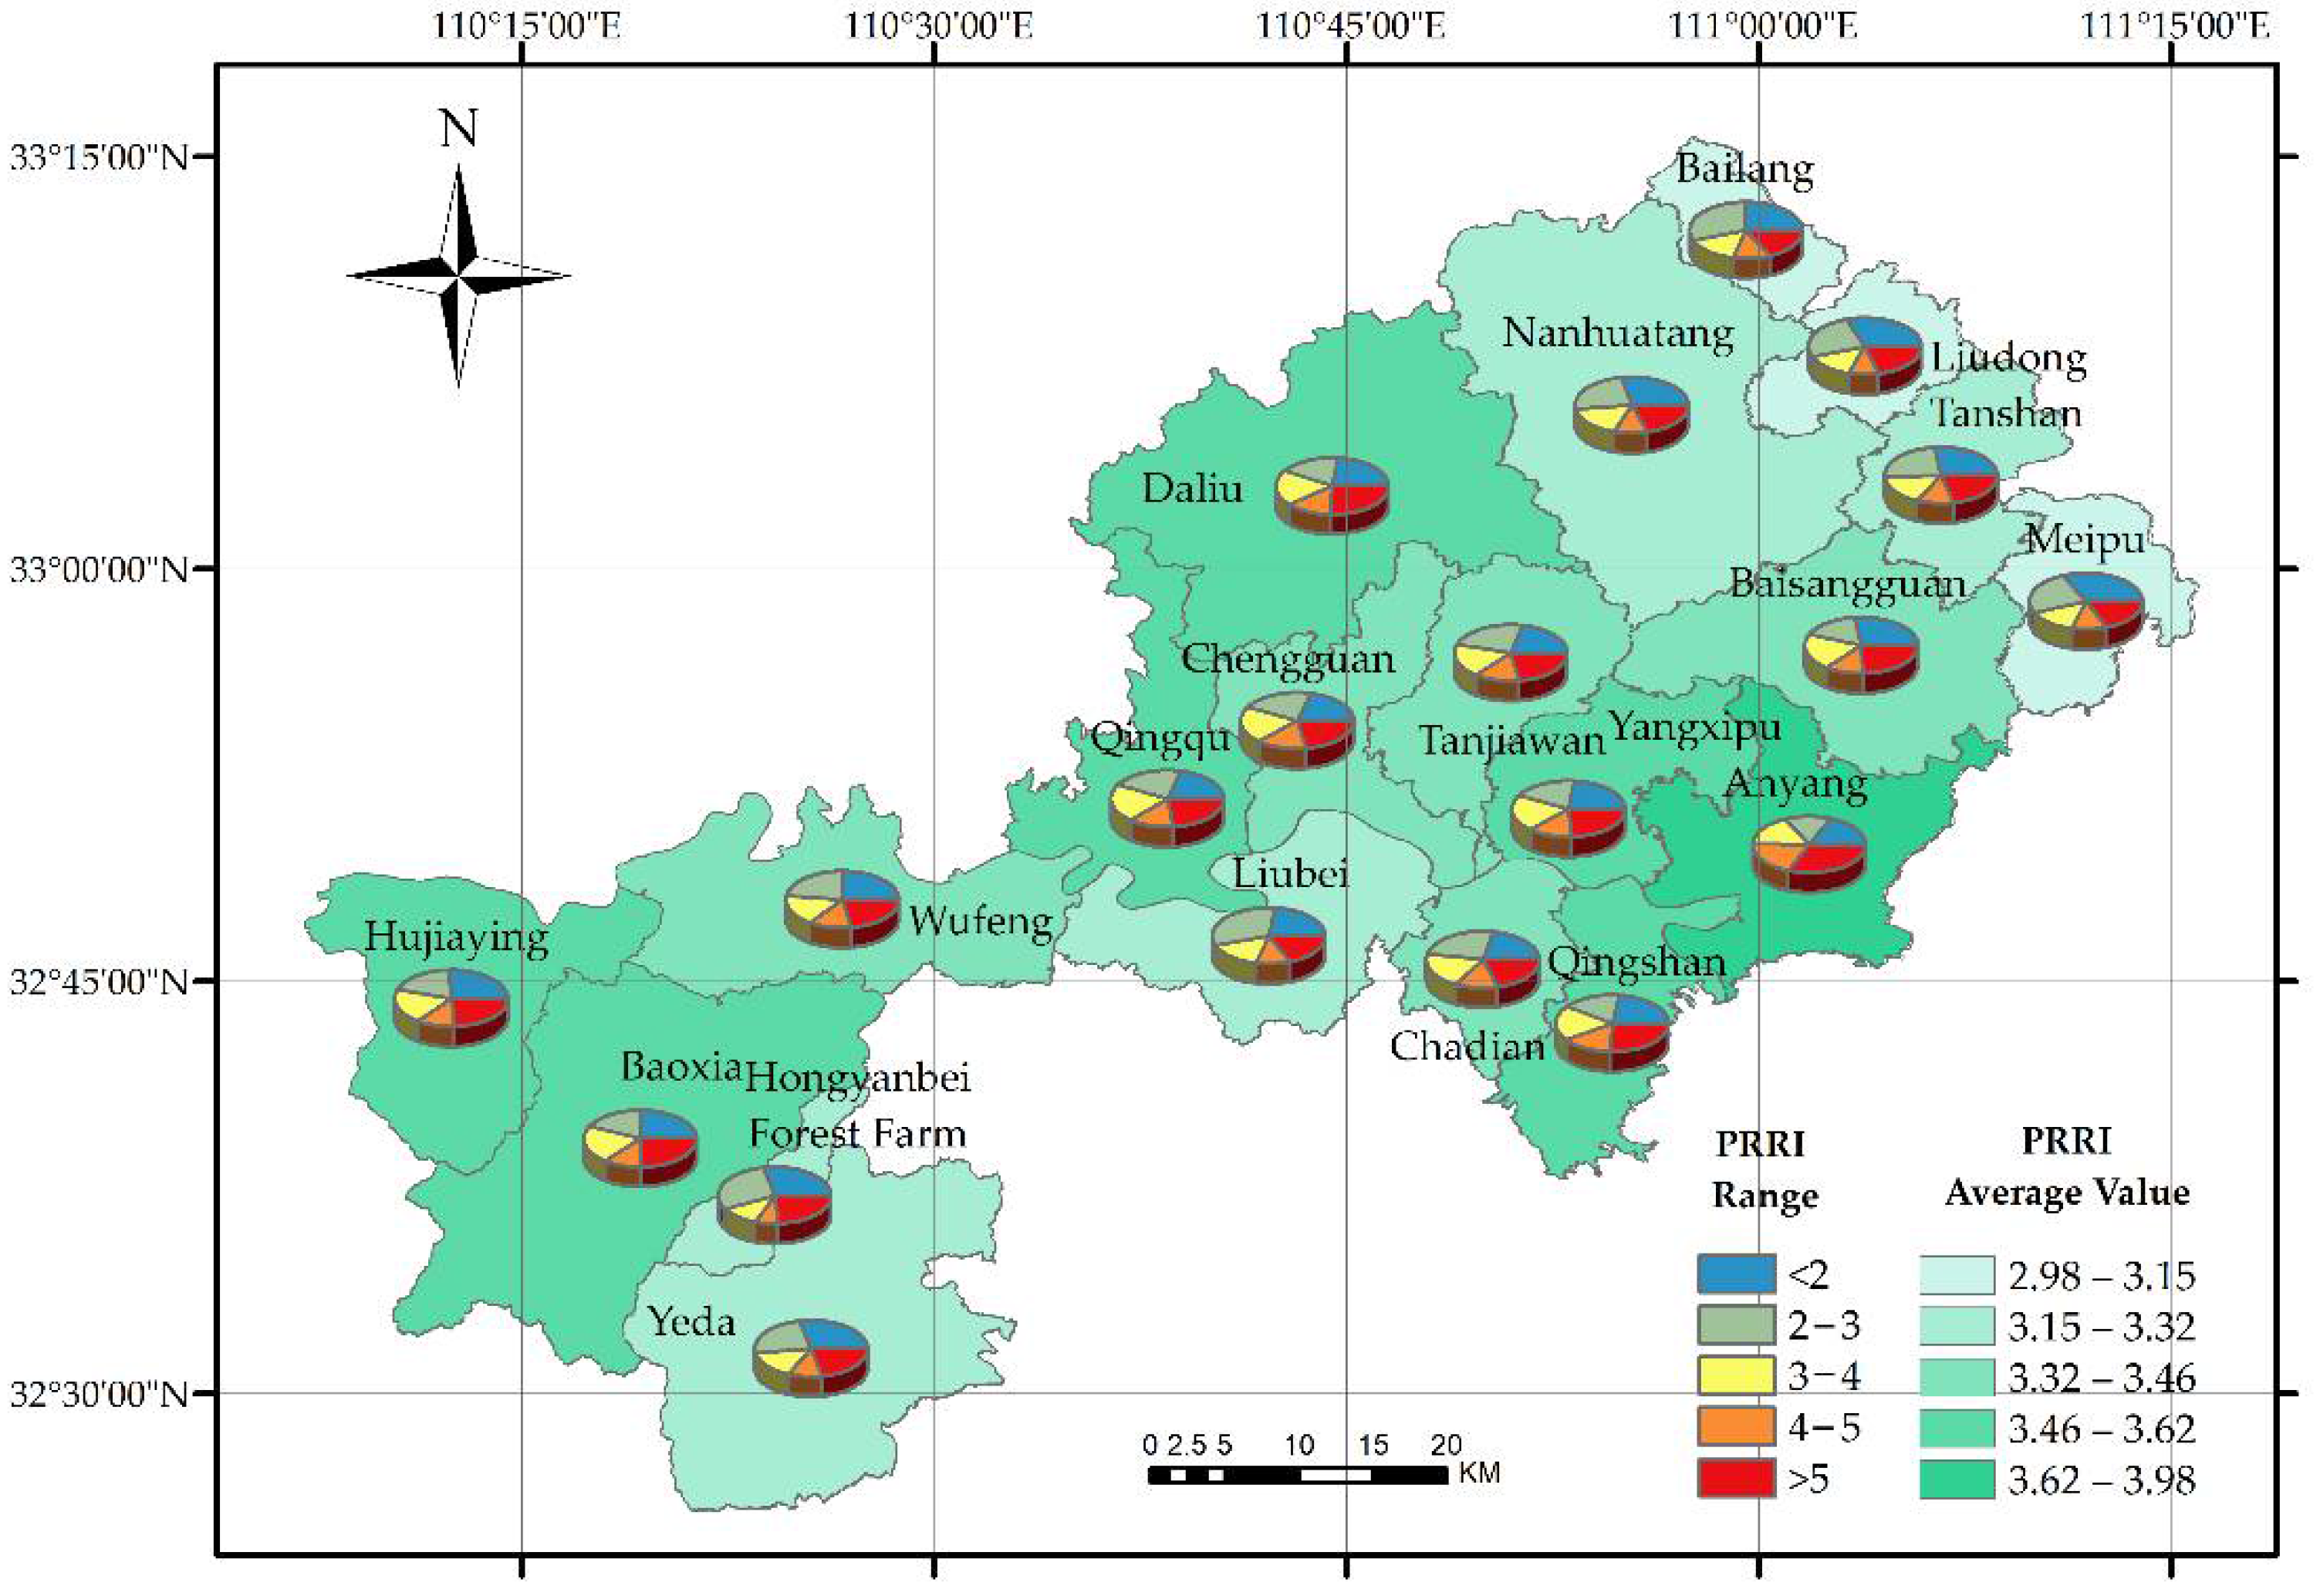
As can be seen from Table 6 and Figure 4, Anyang Township has the highest percentage of households with PRRI 5, reaching 33%, and the corresponding average value is also the highest among all townships. The percentage of households with PRRI 5 in Bailang Township is only 15%, which is smaller than the corresponding percentage in all other township areas; the percentage of households with PRRI 5 in Meipu Township and Liupi Township is also lower, and the difference in the number of households with PRRI 5 among the last three township areas is smaller.
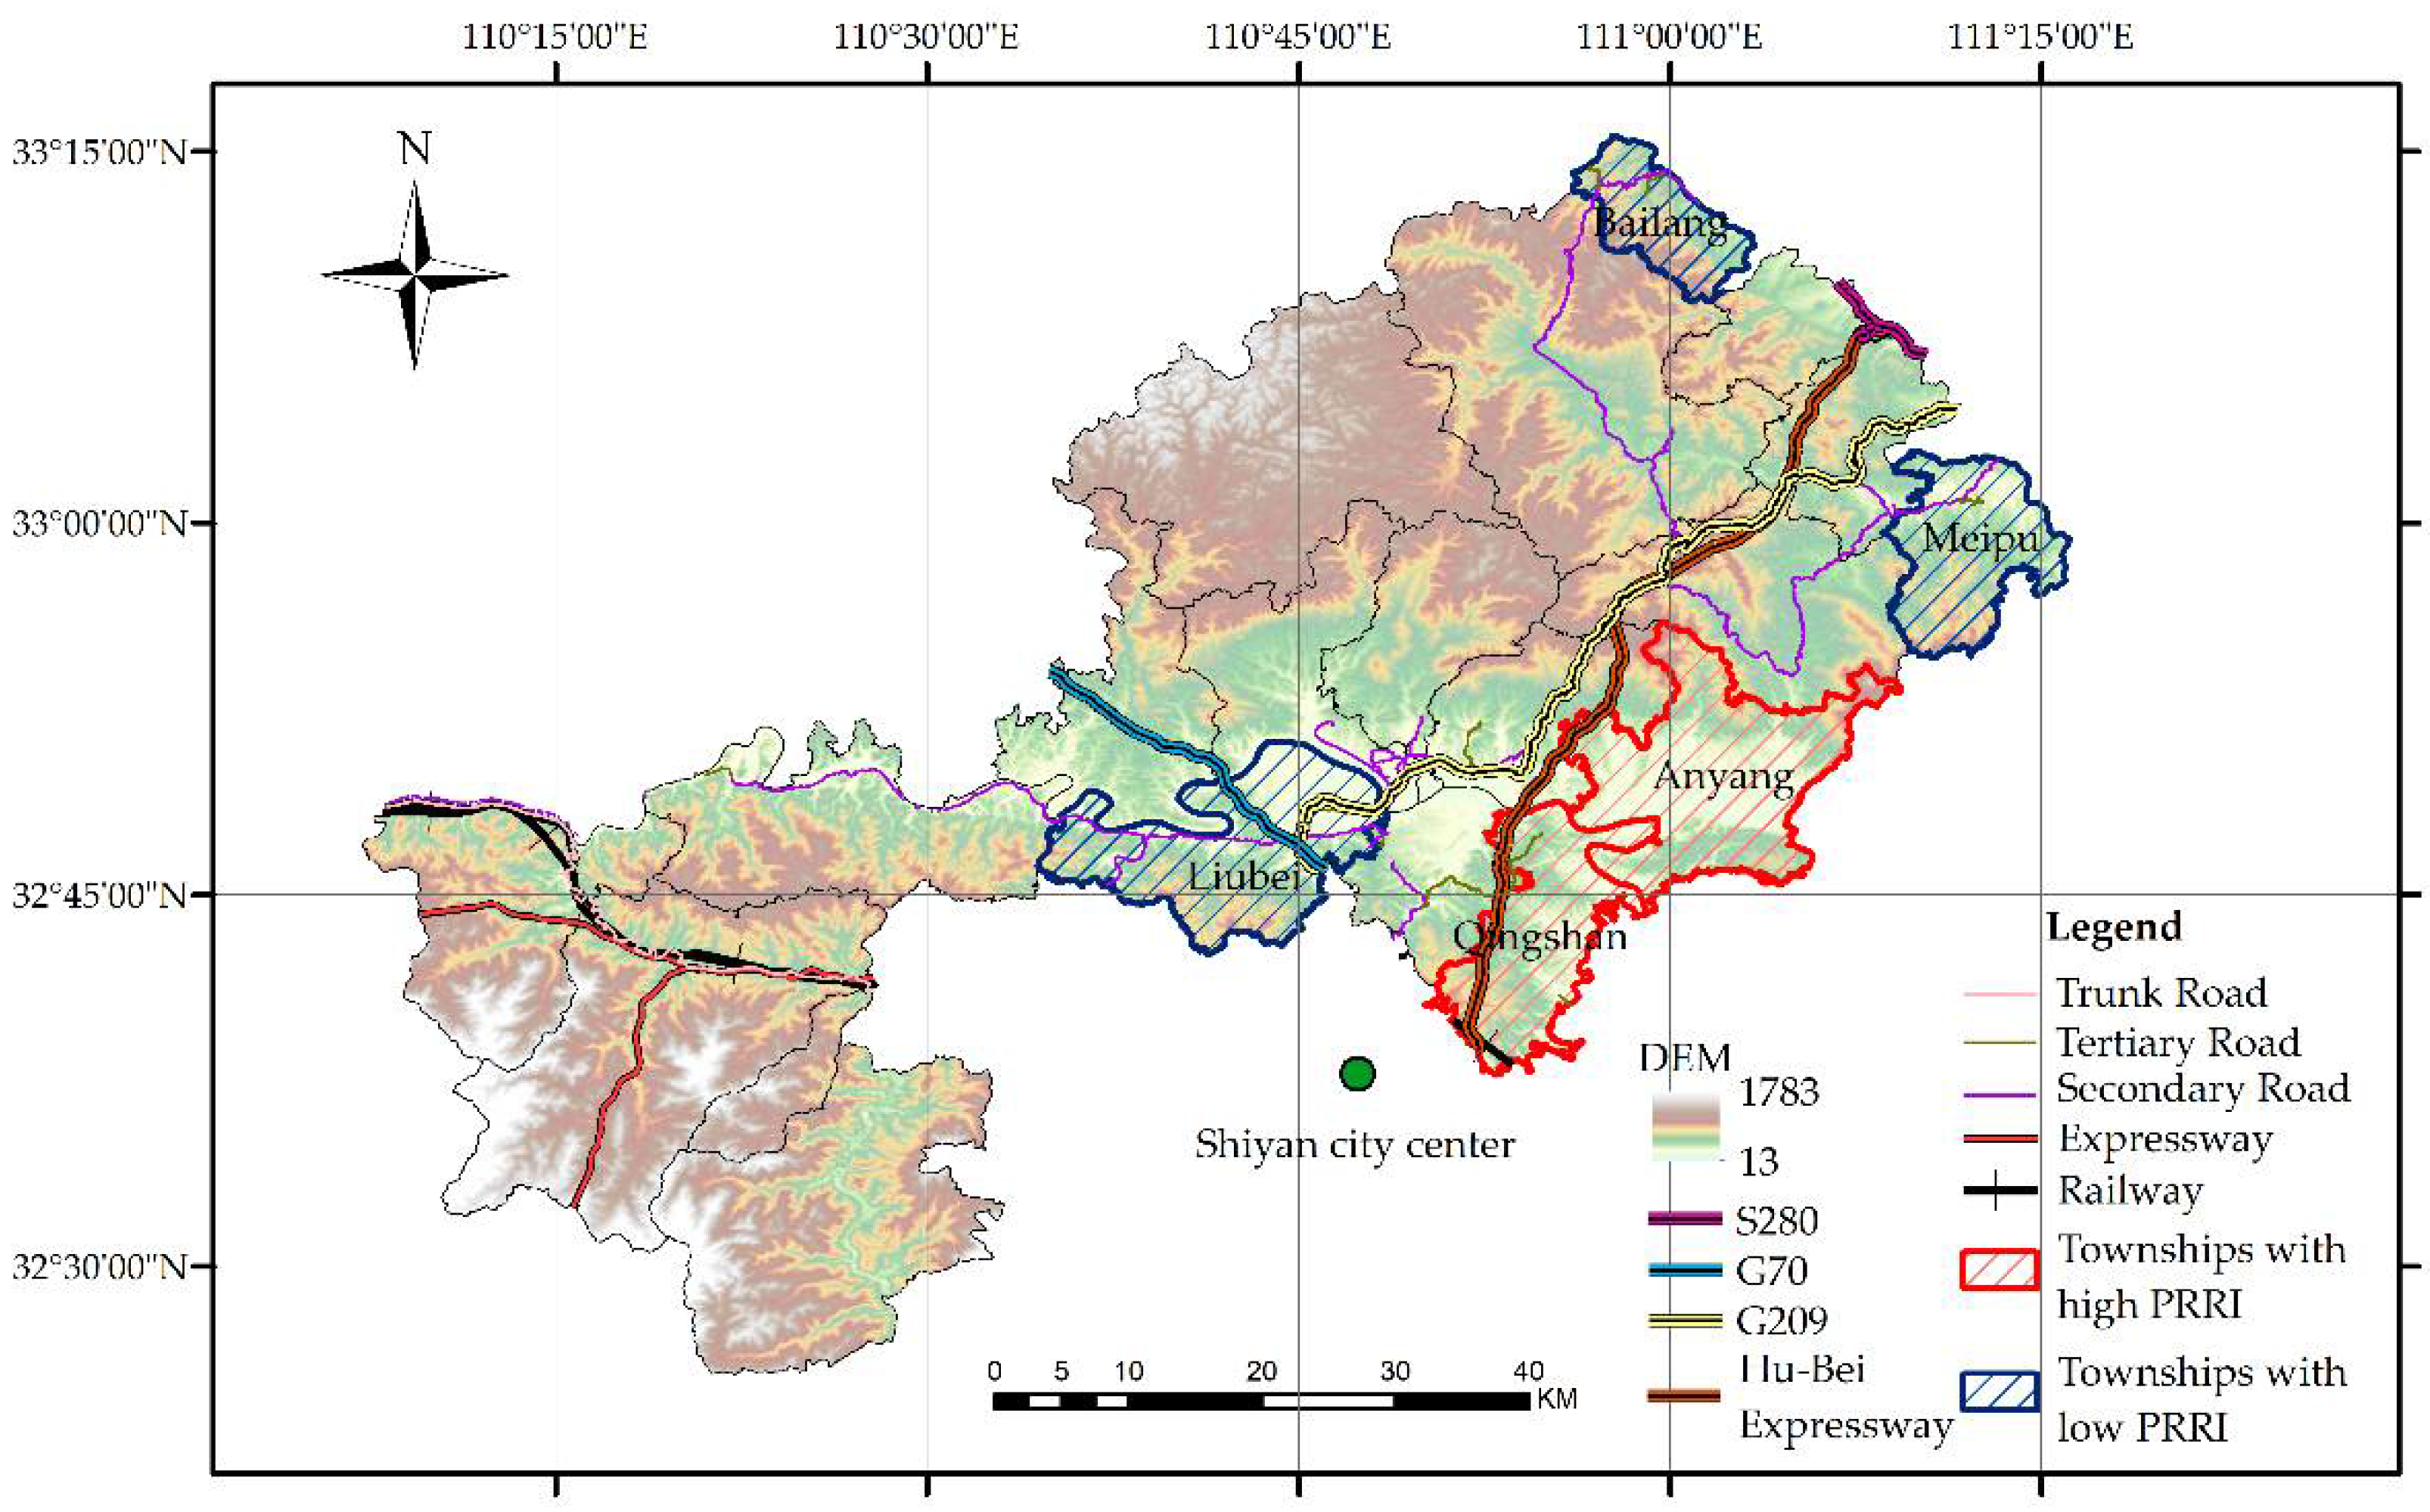
The spatial distribution of PRRI for the registered poor households in the study area basically coincides with the local natural poverty-causing factors and the degree of social and economic development. As can be seen from Figure 4 and Figure 5, Liubei Township, which has a low PRRI, is located in the south-central part of Yunyang District, while Bailang Township and Meipu Township, which also have a low PRRI, are located in the northeastern part of Yunyang District. At the same time, Liubei Township is located in the southeast of Shiyan City, Hubei Province, and is connected by two main routes, G209 and G70, which strengthen the connection between the two places and make the commercial circulation and personnel exchange between them more convenient, thus guaranteeing the local economic development to a certain extent. Bailang Township and Meipu Township in the northeast of Yunyang District are close to three main traffic routes, G209, S280, and Hu-bei Expressway, which strengthen their connection with many townships in the north, and are also protected by traffic, enabling economic development; while Anyang Township and Qingshan Township in the southeast of Yunyang District have a higher PRRI and a higher number of high-risk households. They are separated from Shiyan City to the south by hills, and the traffic to the city is far less developed than the above three townships, which also leads to less communication between the two townships and the outside world. The relatively closed environment makes the economic and labor force development of the two townships limited, and the poverty-returning risk is naturally higher.
Moran’s I index is obtained based on the PRRI scores of each township using the global spatial autocorrelation, and 9999 randomization operations are used to improve the robustness of the results. The results show that the global Moran’s I index for each township is 0.35 and the original hypothesis is rejected at a significant level of 1%, indicating that there is a strong global spatial dependence of PRRI for each township in Yunyang District.

4.3. Analysis by Indicators

In this paper, the training sample data was tested several times, and the MIV values of the selected five indicators are −0.587, −0.384, 0.776, −1.360, −2.108, respectively. The contribution of each indicator is further calculated in Figure 6.
The results show that the order of importance of the influence of each factor on the PRRI is as follows: X5 (past poverty determination of the registered poor households), X4 (household education status scores mean), X3 (household average age), X1 (mean value of labor force score within the households), and X2 (number of people in the households). Among them, the contribution of X5 to Y is more than 40%, indicating that X5 has a more prominent effect on the PRRI. In addition, only X3 correlates with Y in the same direction, i.e., X3 influences the increase of Y, while the other indicators influence the decrease of Y. Considering that the government should prioritize one type of people to help or formulate certain types of targeted policies to reduce the poverty-returning risk, it is necessary to select the indicators that have a greater impact on the poverty-returning risk. The government should first ensure that the policies of households with high past poverty recognition scores are not lifted and set a certain transition period, thus ensuring that the poverty-returning risk does not change drastically. The quality of education within the household should be further improved, especially to ensure that young people within the household attend school on time. For those households with older average age in the household, the focus should be on their living and spiritual needs to avoid further increase of the poverty-returning risk.

5. Discussion

Previous articles have been almost limited to studies on poverty, and few have been conducted on poverty-returning. In addition, past studies have been almost limited to the regional scale, with few studies at the household level, and even fewer studies on monitoring the poverty-returning risk at the household level.
Some of the registered poor households in the study area still have a poverty-returning risk. This is basically consistent with existing studies. L.Z. et al. pointed out the following, that Yunyang District is located in the Qinba concentrated destitute areas, there is a scarcity of arable land resources, the contradiction between man and land is prominent, economic development and ecological protection contradiction is prominent, the task of sustainable development is arduous [49]. Poverty alleviation vulnerability of the registered poor households is the cause of poverty-returning risk [50], Z.Q. pointed out that the residents of the study area, especially the large number of relocated households entering the study area, have insufficient endogenous development capacity, their livelihoods are vulnerable, and they are highly susceptible to sudden external factors and return to poverty [51]. In the upcoming period, it is still necessary to follow up and monitor the registered poor households [52], to ensure that they do not return to poverty and to consolidate the quality of being lifted out of poverty [53]. Based on the above analysis, the poverty-returning risk still exists in the study area for the registered poor households, which requires continuous monitoring.
The spatial distribution of the poverty-returning risk among households that have been lifted out of poverty in the study area basically coincides with the local natural poverty-causing factors and the degree of industrial development. There is a strong global spatial dependence of PRRI in each township of Yunyang District. The PRRI for each township represents a globally strong spatial dependence with a Moran’s I coefficient of 0.352. There is no existing research on the poverty-returning risk in Yunyang District, but L.Z. et al. pointed out that the natural resource endowment and the stage of economic and social development of the township in Yunyang District vary greatly and that the township with certain functional attributes is concentrated [49]. L.J. et al. used township as the study unit and pointed out a strong correlation between the effectiveness of poverty alleviation and the topography of natural poverty-causing factors [54]. X.Y. et al. pointed out that regional vulnerability of poverty-returning is dominated by natural environmental endowment and economic development level, and there is a two-way association between the regional vulnerability of poverty-returning and individual poverty-returning [55]. Therefore, the spatial distribution of the poverty-returning risk among the registered poor households basically coincides with the local natural poverty-causing factors and the degree of industrial development, and there are spatial agglomeration characteristics.
The past poverty determination mean score of the registered poor households is the main factor in reducing the poverty-returning risk. The past policy should remain unchanged for a period of time. This is basically consistent with existing studies. B.Z. pointed out that a transition period should be set up for the policy of poverty alleviation and should not be stopped quickly [56]. The precise poverty alleviation system identifies the registered poor households, representing the original poverty situation within the household. It is still necessary to focus on them after they are lifted out of poverty to prevent them from returning to poverty [29]. Therefore, the past poverty identification determination mean score of the registered poor households is the main factor in reducing the poverty-returning risk. The relevant policy should be kept stable for a period of time.
The household education status mean score, the household labor force mean score, and the number of people in the household have decreasing effects in order on reducing the poverty-returning risk. This is basically consistent with existing studies. With the increasing modernization of agricultural production and the transformation of modern production methods, many people who have been lifted out of poverty with relatively low knowledge and skills have encountered difficulties in sustainable livelihood development, such as “difficulties in adaptation, employment, and development” [14]. Keeping them updated with agricultural development in contemporary society helps reduce their likelihood of returning to poverty [57]. Kate Bird et al. pointed out that the lack of professional skills and competencies leads to an increasing accumulation of poverty [58]. Government needs to pay attention to how to improve the quality of education of the registered poor households to reduce the poverty-returning risk. The support measures for households lacking or without labor are usually “blood transfusion poverty alleviation”, which is more dependent on the targeting and policy stability of support [8]. X.Y. et al. pointed out that the dominant factor of the individual vulnerability to poverty-returning was the overall quality of the household labor force [55]. Z.X. pointed out that the number of labor force members in a household is an essential factor affecting the poverty-returning of a household [28] In addition, combined with Thomas Hofmarcher’s research on the relationship between education and poverty, this paper argues that the government can further reduce the poverty-returning risk by improving the quality of education within the household [59], and providing jobs for the labor force.
The mean age in households affects the increased poverty-returning risk, and the government should focus on this type of household and give appropriate policies to help them. This is basically consistent with existing studies. Antonino Polizzi et al. analyzed in detail the relationship between the composition of the household and in-work poverty [60]. Y.L. et al. pointed out that age is the main factor affecting the vulnerability of poverty-returning [61], and H.L. et al. pointed out that age has an impact on preventing the poverty returning [62]. Y.X. et al. pointed out that the elderly in rural areas face the arduous task of stable poverty alleviation and challenges such as a relatively single source of income [63]. Timely attention should be paid to the lives and spiritual needs of the elderly [64]. Therefore, the focus should be on households with an older average age within the household to avoid a further increase in the poverty-returning risk.

6. Conclusions

It is of great practical significance to monitor and analyze the poverty-returning risk of the registered poor households, explore the characteristics of the poverty-returning risk in existing data, and identify important indicators that affect the poverty-returning risk, so as to provide decision support for the government to reduce the poverty-returning risk of the registered poor households. In this paper, a concrete and measurable index system was constructed, and BP neural network and natural breaks were used to simulate the poverty-returning risk of each household, which provides a reference for establishing the risk monitoring method of returning to poverty.
The innovation points of this paper are as follows: (1) The nonlinear BP neural network is introduced into the field of poverty-returning risk monitoring. (2) Compared with previous studies that focused on the measurement of regional poverty degree, this paper reduces the granularity of observation to achieve more scientific and accurate poverty-returning risk monitoring at the household level. (3) This paper makes full use of the data of the China Poverty Alleviation and Development Information System and uses PRRI to represent the poverty-returning risk of the registered poor households, so as to meet the requirements of the Opinions on establishing monitoring methods to prevent returning to poverty and provide a new idea for the poverty-returning risk monitoring.
Although this paper provides a household level monitoring method for the poverty-returning risk, there are still some deficiencies. At present, the research bureau is limited to the data of more than 40,000 households in the Yunyang district, which has not reached the level of mass data. The calculated average poverty-returning risk in each township has a small gap, and there are problems such as insufficient data and limited spatial scale. Many other factors affecting poverty-returning, such as the implementation of policies and the spiritual aspect of the indoor population, remain to be explored. A large amount of documented data in the poverty alleviation and development information system, which has been established for many years, is of great help to solving relevant problems and is worth further exploration. This paper looks forward to exploring new ideas for linking poverty prevention with rural revitalization together with all the workers in poverty prevention, constantly improving the monitoring index system of poverty-returning risk and building a mature dynamic monitoring method for poverty-returning risk based on local conditions.

Author Contributions

Conceptualization, R.Z. and Y.H.; methodology, W.C.; software, R.Z. and J.M.; validation, Z.Y.; formal analysis, H.X.; investigation, D.F.; resources, Y.H.; data curation, R.Z.; writing—original draft preparation, R.Z.; writing—review and editing, R.Z. and Y.H.; visualization, D.F. and H.X.; supervision, R.Z., Y.H., W.C. and H.X.; project administration, Y.H.; funding acquisition, Y.H. All authors have read and agreed to the published version of the manuscript.

Funding

This research was funded by National Natural Science Foundation of China (grant number 41976184).

Institutional Review Board Statement

Ethical review and approval were waived for this study, as the details about the participants have been anonymized, and there is hardly any risk associated with this research. Besides, the written informed consent for publication has been obtained from all participants.

Informed Consent Statement

Informed consent was obtained from all subjects involved in the study.

Data Availability Statement

Not applicable.

Acknowledgments

The authors wish to express thanks to the help from the government of Yunyang District to this paper.

Conflicts of Interest

The authors declare no conflict of interest.

References

  1. Yang, Y.; Liu, Y. The Code of Targeted Poverty Alleviation in China: A Geography Perspective. Geogr. Sustain. 2021, 2, 243–253. [Google Scholar] [CrossRef]
  2. Guo, Y.; Zhou, Y.; Liu, Y. Targeted Poverty Alleviation and Its Practices in Rural China: A Case Study of Fuping County, Hebei Province. J. Rural Stud. 2019. [Google Scholar] [CrossRef]
  3. Ma, L.; Che, X.; Zhang, J.; Fang, F.; Chen, M. Rural Poverty Identification and Comprehensive Poverty Assessment Based on Quality-of-Life: The Case of Gansu Province (China). Sustainability 2019, 11, 4547. [Google Scholar] [CrossRef] [Green Version]
  4. Motala, S.; Ngandu, S.; Mti, S.; Arends, F.; Winnaar, L.; Khalema, E.; Makiwane, M.; Ndinda, C.; Moolman, B.; Maluleke, T.; et al. Millennium Development Goals: Country Report 2015; Statistics South Africa: Pretoria, South Africa, 2015. [Google Scholar]
  5. Ramírez, J.M.; Díaz, Y.; Bedoya, J.G. Property Tax Revenues and Multidimensional Poverty Reduction in Colombia: A Spatial Approach. World Dev. 2017, 94, 406–421. [Google Scholar] [CrossRef]
  6. Sapena, J.; Almenar, V.; Apetrei, A.; Escrivá, M.; Gil, M. Some Reflections on Poverty Eradication, True Development and Sustainability within CST. J. Innov. Knowl. 2018, 3, 90–92. [Google Scholar] [CrossRef]
  7. Li, E.; Deng, Q.; Zhou, Y. Livelihood Resilience and the Generative Mechanism of Rural Households out of Poverty: An Empirical Analysis from Lankao County, Henan Province, China. J. Rural Stud. 2019. [Google Scholar] [CrossRef]
  8. Zhang, W.; Wu, Y.; Gong, Y. Risk Prediction of Returning to Poverty and Analysis of Risk Factors for the Registered Poor Households: Based on the Data Obtained from the On- site Monitoring and Investigation of the Registered Poor Households in the 25 Provinces in 2019. Reform 2020, 110–120. Available online: http://www.cnki.com.cn/Article/CJFDTotal-REFO202012009.htm (accessed on 9 December 2021).
  9. People’s Daily Online. Poverty Registration-Poverty Alleviation Network Exhibition. Available online: http://fpzg.cpad.gov.cn/429463/430986/430987/index.html (accessed on 3 March 2022).
  10. li, X.; Zhou, Y.; Chen, Y. Theory and Measurement of Regional Multidimensional Poverty. Acta Geogr. Sin. 2020, 75, 753–768. [Google Scholar] [CrossRef]
  11. Lv, G.; Cui, X.; Sun, B. The Focus of Dynamic Monitoring and Accurate Assistance to Prevent Poverty-Returning—An Empirical Analysis Based on CFPS Data. Public Finance Res. 2021, 8, 16–30. [Google Scholar] [CrossRef]
  12. Wu, B.; Xiao, S.; Ma, Y. The Risk of Returning to Poverty among Families of Ethnic Minorities with Small Population: Measuring Methods, Influencing Factors and Policy Orientation. Northwest. J. Ethnol. 2021, 2, 119–135. [Google Scholar] [CrossRef]
  13. Ding, J.; Chen, B. On Establishment of the Model of Sustainable Alleviation of Poverty and Settlement of the Return to Poverty in Rural Areas. J. Soc. Sci. 2010, 52–57+188. Available online: http://www.cnki.com.cn/Article/CJFDTOTAL-SHKX201001008.htm (accessed on 9 December 2021).
  14. Zheng, R.; Cao, G. Re-Poverty Population: Influencing Factors, Mechanism and Risk Control. J. Agro-Forestry Econ. Manag. 2016, 15, 619–624. [Google Scholar] [CrossRef]
  15. The Central Leading Group for Rural Work. Guidance from the Central Leading Group for Rural Work on Improving the Dynamic Monitoring and Assistance Mechanism for Preventing Returning to Poverty. Available online: http://nrra.gov.cn/art/2021/8/4/art_46_191281.html (accessed on 3 March 2022).
  16. Tran, T.Q.; Nguyen, H.T.T.; Hoang, Q.N.; Nguyen, D.V. The Influence of Contextual and Household Factors on Multidimensional Poverty in Rural Vietnam: A Multilevel Regression Analysis. Int. Rev. Econ. Finance 2022, 78, 390–403. [Google Scholar] [CrossRef]
  17. Krauss, A. How Natural Gas Tariff Increases Can Influence Poverty: Results, Measurement Constraints and Bias. Energy Econ. 2016, 60, 244–254. [Google Scholar] [CrossRef] [Green Version]
  18. Watmough, G.R.; Marcinko, C.L.; Sullivan, C.; Tschirhart, K.; Mutuo, P.K.; Palm, C.A.; Svenning, J.-C. Socioecologically Informed Use of Remote Sensing Data to Predict Rural Household Poverty. Proc. Natl. Acad. Sci. USA 2019, 116, 1213–1218. [Google Scholar] [CrossRef] [Green Version]
  19. Maleček, P.; Čermáková, K. In-Work Poverty in the Czech Republic: Identification of the Most Vulnerable Groups. Procedia Econ. Finance 2015, 30, 566–572. [Google Scholar] [CrossRef] [Green Version]
  20. Jean, N.; Burke, M.; Xie, M.; Davis, W.M.; Lobell, D.B.; Ermon, S. Combining Satellite Imagery and Machine Learning to Predict Poverty. Science 2016, 353, 790–794. [Google Scholar] [CrossRef] [Green Version]
  21. Elinder, M.; Erixson, O.; Waldenström, D. Inheritance and Wealth Inequality: Evidence from Population Registers. J. Public Econ. 2018, 165, 17–30. [Google Scholar] [CrossRef]
  22. Burke, M.; Driscoll, A.; Lobell, D.B.; Ermon, S. Using Satellite Imagery to Understand and Promote Sustainable Development. Science 2021, 371, eabe8628. [Google Scholar] [CrossRef] [PubMed]
  23. Ajibade, I.; Boateng, G.O. Predicting Why People Engage in Pro-Sustainable Behaviors in Portland Oregon: The Role of Environmental Self-Identity, Personal Norm, and Socio-Demographics. J. Environ. Manage. 2021, 289, 112538. [Google Scholar] [CrossRef] [PubMed]
  24. Bezáková, M.; Bezák, P. Which Sustainability Objectives Are Difficult to Achieve? The Mid-Term Evaluation of Predicted Scenarios in Remote Mountain Agricultural Landscapes in Slovakia. Land Use Policy 2022, 115, 106020. [Google Scholar] [CrossRef]
  25. Bao, G.; Yang, H. Research on China’s Poverty-Returning Phenomenon and Its Early Warning Mechanism. J. Lanzhou Univ. Soc. Sci. 2018, 46, 123–130. [Google Scholar] [CrossRef]
  26. Zhang, W. Establishing an Early Warning Mechanism for the Risk of Returning to Poverty to Solve the Risk of Returning to Poverty. Peoples Trib. 2019, 68–69. Available online: http://www.cnki.com.cn/Article/CJFDTOTAL-RMLT201923028.htm (accessed on 9 December 2021).
  27. Geng, X. An Analysis of Risks and Factors Influencing the People Returning to Poverty in Ethnic Minority Areas. J. Yunnan Minzu Univ. Soc. Sci. 2020, 37, 68–75. [Google Scholar] [CrossRef]
  28. Xiao, Z.; Wang, Z. Basic Characteristics of the Households Re-Experiencing Poverty and Policy Responses: A Data Analysis of 22 Counties of 12 Provinces. J. Yunnan Minzu Univ. Soc. Sci. 2020, 37, 81–89. [Google Scholar] [CrossRef]
  29. Fan, H. Exploring the construction of early warning mechanism for returning to poverty. Stud. Social. Chin. Charact. 2018, 57–63. Available online: http://www.cnki.com.cn/Article/CJFDTOTAL-SPEC201801010.htm (accessed on 9 December 2021).
  30. Shen, Q. Early Warning Mechanisms for Returning to Poverty in Ethnic Areas of the Northeast Frontier in the Post Poverty Alleviation Era. J. North Minzu Univ. Soc. Sci. 2020, 41–48. Available online: http://www.cnki.com.cn/Article/CJFDTOTAL-XBDR202006006.htm (accessed on 9 December 2021).
  31. Xiao, M.; Zhang, R. Risk Control Strategy of Returning to Poverty in China’s Post-Poverty Era: Based on the Perspective of Risk Source Analysis and Human Resource Development. J. CCPS CAG 2021, 25, 58–65. [Google Scholar] [CrossRef]
  32. Gu, X.; Xue, X. Risk Assessment of Out-of-Poverty Households Returning to Poverty:A Case Study of Typical Poverty-Stricken Counties in Western Henan Province. J. Henan Polytech. Univ. Soc. Sci. 2021, 22, 22–30. [Google Scholar] [CrossRef]
  33. Wang, R.; Luo, H. Early Warning and Evaluation of the Risk of Returning to Poverty in the Context of Poverty Exit. Stat. Decis. 2021, 37, 81–84. [Google Scholar] [CrossRef]
  34. He, J.; Hong, S.; Zhou, Y.; Shen, S.; Zou, M. State Prediction of Poverty Alleviation Objects Based on HMM and Multidimensional Data. J. Syst. Simul. 2021, 1–9. Available online: http://www.cnki.com.cn/Article/CJFDTotal-XTFZ20211028000.htm (accessed on 9 December 2021).
  35. Li, C.; Wang, W.; Guo, L.; Chen, G. Identification Model of Poverty—Returning Population Based on Ensemble Learning Algorithm—Taking File and Card Data of Poor Households in F County of H Province as an Example. Jiangsu Agric. Sci. 2021, 49, 231–237. [Google Scholar] [CrossRef]
  36. Liu, Y.; Hu, Z.; Zhao, W.; Wang, Z. Research on Spatial Characteristics of Regional Poverty Based on BP Neural Network: A Case Study of Wuling Mountain Area. J. Geo-Inf. Sci. 2015, 17, 69–77. [Google Scholar] [CrossRef]
  37. Xu, Y.; Li, S.; Cai, Y. Spatial Simulation Using GIS and Artificial Neur al Network for Regional Poverty —A Case Study of Maotiaohe Watershed, Guizhou Province. Prog. Geogr. 2006, 25, 79–85. [Google Scholar] [CrossRef]
  38. Zeng, Y.; Zhang, G. Spatial Simulating in Regional Rural Poverty Based on GIS and BP Neural Network: A New Appraisement Method on Regional Rural Poverty. Geogr. Geo-Information Sci. 2011, 27, 70–75. [Google Scholar]
  39. Zhang, J.; Ruan, Z.; Rui, Y.; Li, T.; Liu, X.; Yang, H. Diagnosis of village poverty risk tolerance from the perspective of synergy theory: A case study of Pingli County in Shaanxi Province, China. Hum. Geogr. 2020, 35, 64–73. [Google Scholar]
  40. Yap, B.W.; Sim, C.H. Comparisons of Various Types of Normality Tests. J. Stat. Comput. Simul. 2011, 81, 2141–2155. [Google Scholar] [CrossRef]
  41. Li, N.; Xu, G. Grid Analysis of Land Use Based on Natural Breaks (Jenks) Classification. Bull. Surv. Mapp. 2020, 106. [Google Scholar] [CrossRef]
  42. Li, L.; Cai, L. The Spatio—Temporal Evolvement of Economic Linkage among Cities in Central Triangle Urban Agglomeration. Urban Probl. 2015, 7, 62–70. [Google Scholar] [CrossRef]
  43. Yang, J.; He, H.; Hu, Q.; Duan, J.; He, J. Relationships between Road Network Density and Spatial Distribution of Urban Functional Land: A Case Study of Central Urban Area in Yiyang City. Econ. Geogr. 2018, 38, 97–103. [Google Scholar] [CrossRef]
  44. Basofi, A.; Fariza, A.; Dzulkarnain, M.R. Landslides Susceptibility Mapping Using Fuzzy Logic: A Case Study in Ponorogo, East Java, Indonesia. In Proceedings of the 2016 International Conference on Data and Software Engineering (ICoDSE), Denpasar, Indonesia, 26–27 October 2016; pp. 1–7. [Google Scholar]
  45. Yan, C.; Zhang, T.; Sun, Y.; Tang, H.; Li, H. A Hybrid Variable Selection Method Based on Wavelet Transform and Mean Impact Value for Calorific Value Determination of Coal Using Laser-Induced Breakdown Spectroscopy and Kernel Extreme Learning Machine. Spectrochim. Acta Part B At. Spectrosc. 2019, 154, 75–81. [Google Scholar] [CrossRef]
  46. Chi, S.; Wang, L. Calculation Method of Probability Integration Method Parameters Based on MIV-GP-BP Model. Teh. Vjesn. 2021, 28, 160–168. [Google Scholar] [CrossRef]
  47. Xu, L.; Wang, W.; Zhang, T.; Yang, L.; Wang, S.; Li, Y. Ultra-Short-Term Wind Power Prediction Based on Neural Network and Mean Impact Value. Autom. Electr. Power Syst. 2017, 41, 40. [Google Scholar] [CrossRef]
  48. Goodchild, M.F.; Anselin, L.; Appelbaum, R.P.; Harthorn, B.H. Toward Spatially Integrated Social Science. Int. Reg. Sci. Rev. 2000, 23, 139–159. [Google Scholar] [CrossRef]
  49. Zhang, L.; Wang, Z.; Wei, C.; Gao, Y. Rural Revitalization Strategy Based on the Perspective of Rural Multifunctions: A Case of the Mountainous Areas in Yunyang District of Shiyan City, Western Hubei Province. Resour. Sci. 2019, 41, 1703–1713. [Google Scholar] [CrossRef]
  50. Yang, L.; Xie, C.; Li, M. Research on Risk Management of Returning to Poverty of the People Out of Poverty—Based on the Survey of M County in “Three Regions and Three Prefectures.”. J. Northwest. Ethn. Stud. 2021, 136–149. [Google Scholar] [CrossRef]
  51. Qin, Z. Livelihood Risk Prevention for Relocated Rural Households out of Poverty in Inhospitable Areas in the Context of Rural Revitalization: A Case Study of Shiyan City, Hubei Province. China Mark. 2022, 26–28. [Google Scholar] [CrossRef]
  52. Zuo, T.; Su, Q. On Income Level and Income Fluctuation Concerning Two Intervention Dimensions Targeting to Poverty Prevention during the Transitional Period: Combined with County Level Poverty Registration Data in Southwest China. J. Nanjing Agric. Univ. Sci. Ed. 2021, 21, 10–22. [Google Scholar]
  53. Wang, L.; Li, K.; Zhou, Z. An Analysis on the Features, Problems and Methods of China’s Poverty Governance in the Post-Poverty Alleviation Era. J. Lanzhou Univ. Sci. 2021, 49, 49–56. [Google Scholar]
  54. Jiang, L.; An, Y.; Tan, X.; Yu, H.; Wang, Z.; Chen, Y. The Spatial Differentiation and Influence Mechanism of Poverty Alleviation Effectiveness at the Village Level: A Case Study from 84 Villages Shaking off Poverty of Xinhuang County, Hunan Province. Geogr. Res. 2022, 41, 1136–1151. [Google Scholar] [CrossRef]
  55. Yan, X.; Qi, X.; Pan, Y.; Li, Y. Vulnerability Assessment of Return-to-Poverty under Poverty Elimination in China: A New Integrated Regional and Individual Perspective. J. Nat. Resour. 2022, 37, 440–458. [Google Scholar] [CrossRef]
  56. Zheng, B. A Thinking on Establishing a Permanent Mechanism for Poverty Alleviation after 2020. Macroecon. Manag. 2019, 17–25. [Google Scholar] [CrossRef]
  57. Eichsteller, M.; Njagi, T.; Nyukuri, E. The Role of Agriculture in Poverty Escapes in Kenya–Developing a Capabilities Approach in the Context of Climate Change. World Dev. 2022, 149, 105705. [Google Scholar] [CrossRef]
  58. Bird, K.; Chabé-Ferret, B.; Simons, A. Linking Human Capabilities with Livelihood Strategies to Speed Poverty Reduction: Evidence from Rwanda. World Dev. 2022, 151, 105728. [Google Scholar] [CrossRef]
  59. Hofmarcher, T. The Effect of Education on Poverty: A European Perspective. Econ. Educ. Rev. 2021, 83, 102124. [Google Scholar] [CrossRef]
  60. Polizzi, A.; Struffolino, E.; Van Winkle, Z. Family Demographic Processes and In-Work Poverty: A Systematic Review. Adv. Life Course Res. 2022, 52, 100462. [Google Scholar] [CrossRef]
  61. Li, Y.; Qi, X.; Lin, Y.; Wu, Y. Characteristics and Influencing Factors of Vulnerability to Re-Poverty in Liupan Mountainous Area within the Background of Poverty Withdrawal. J. Subtrop. Resour. Environ. 2019, 14, 63–70. [Google Scholar]
  62. Li, H. Analysis of Identity and the Blocking of Retur n to Poverty—Empirical Evidence Based on CFPS. Decis. Inf. 2021, 60–69. Available online: http://qikan.cqvip.com/Qikan/Article/Detail?id=7105856917 (accessed on 2 February 2022).
  63. Xin, Y.; Han, G. Governance of Relative Poverty in Rural Elderly after 2020: Trends, Challenges, and Countermeasures. Soc. Sci. Guangxi 2021, 7, 73–81. [Google Scholar] [CrossRef]
  64. Han, Z. Current Situation, Problems and Countermeasures of Targeted Poverty Alleviation by Improving Health Care for the Poor Elderly in Rural Areas. J. Beijing Vocat. Coll. Agric. 2022, 36, 33–38. [Google Scholar]
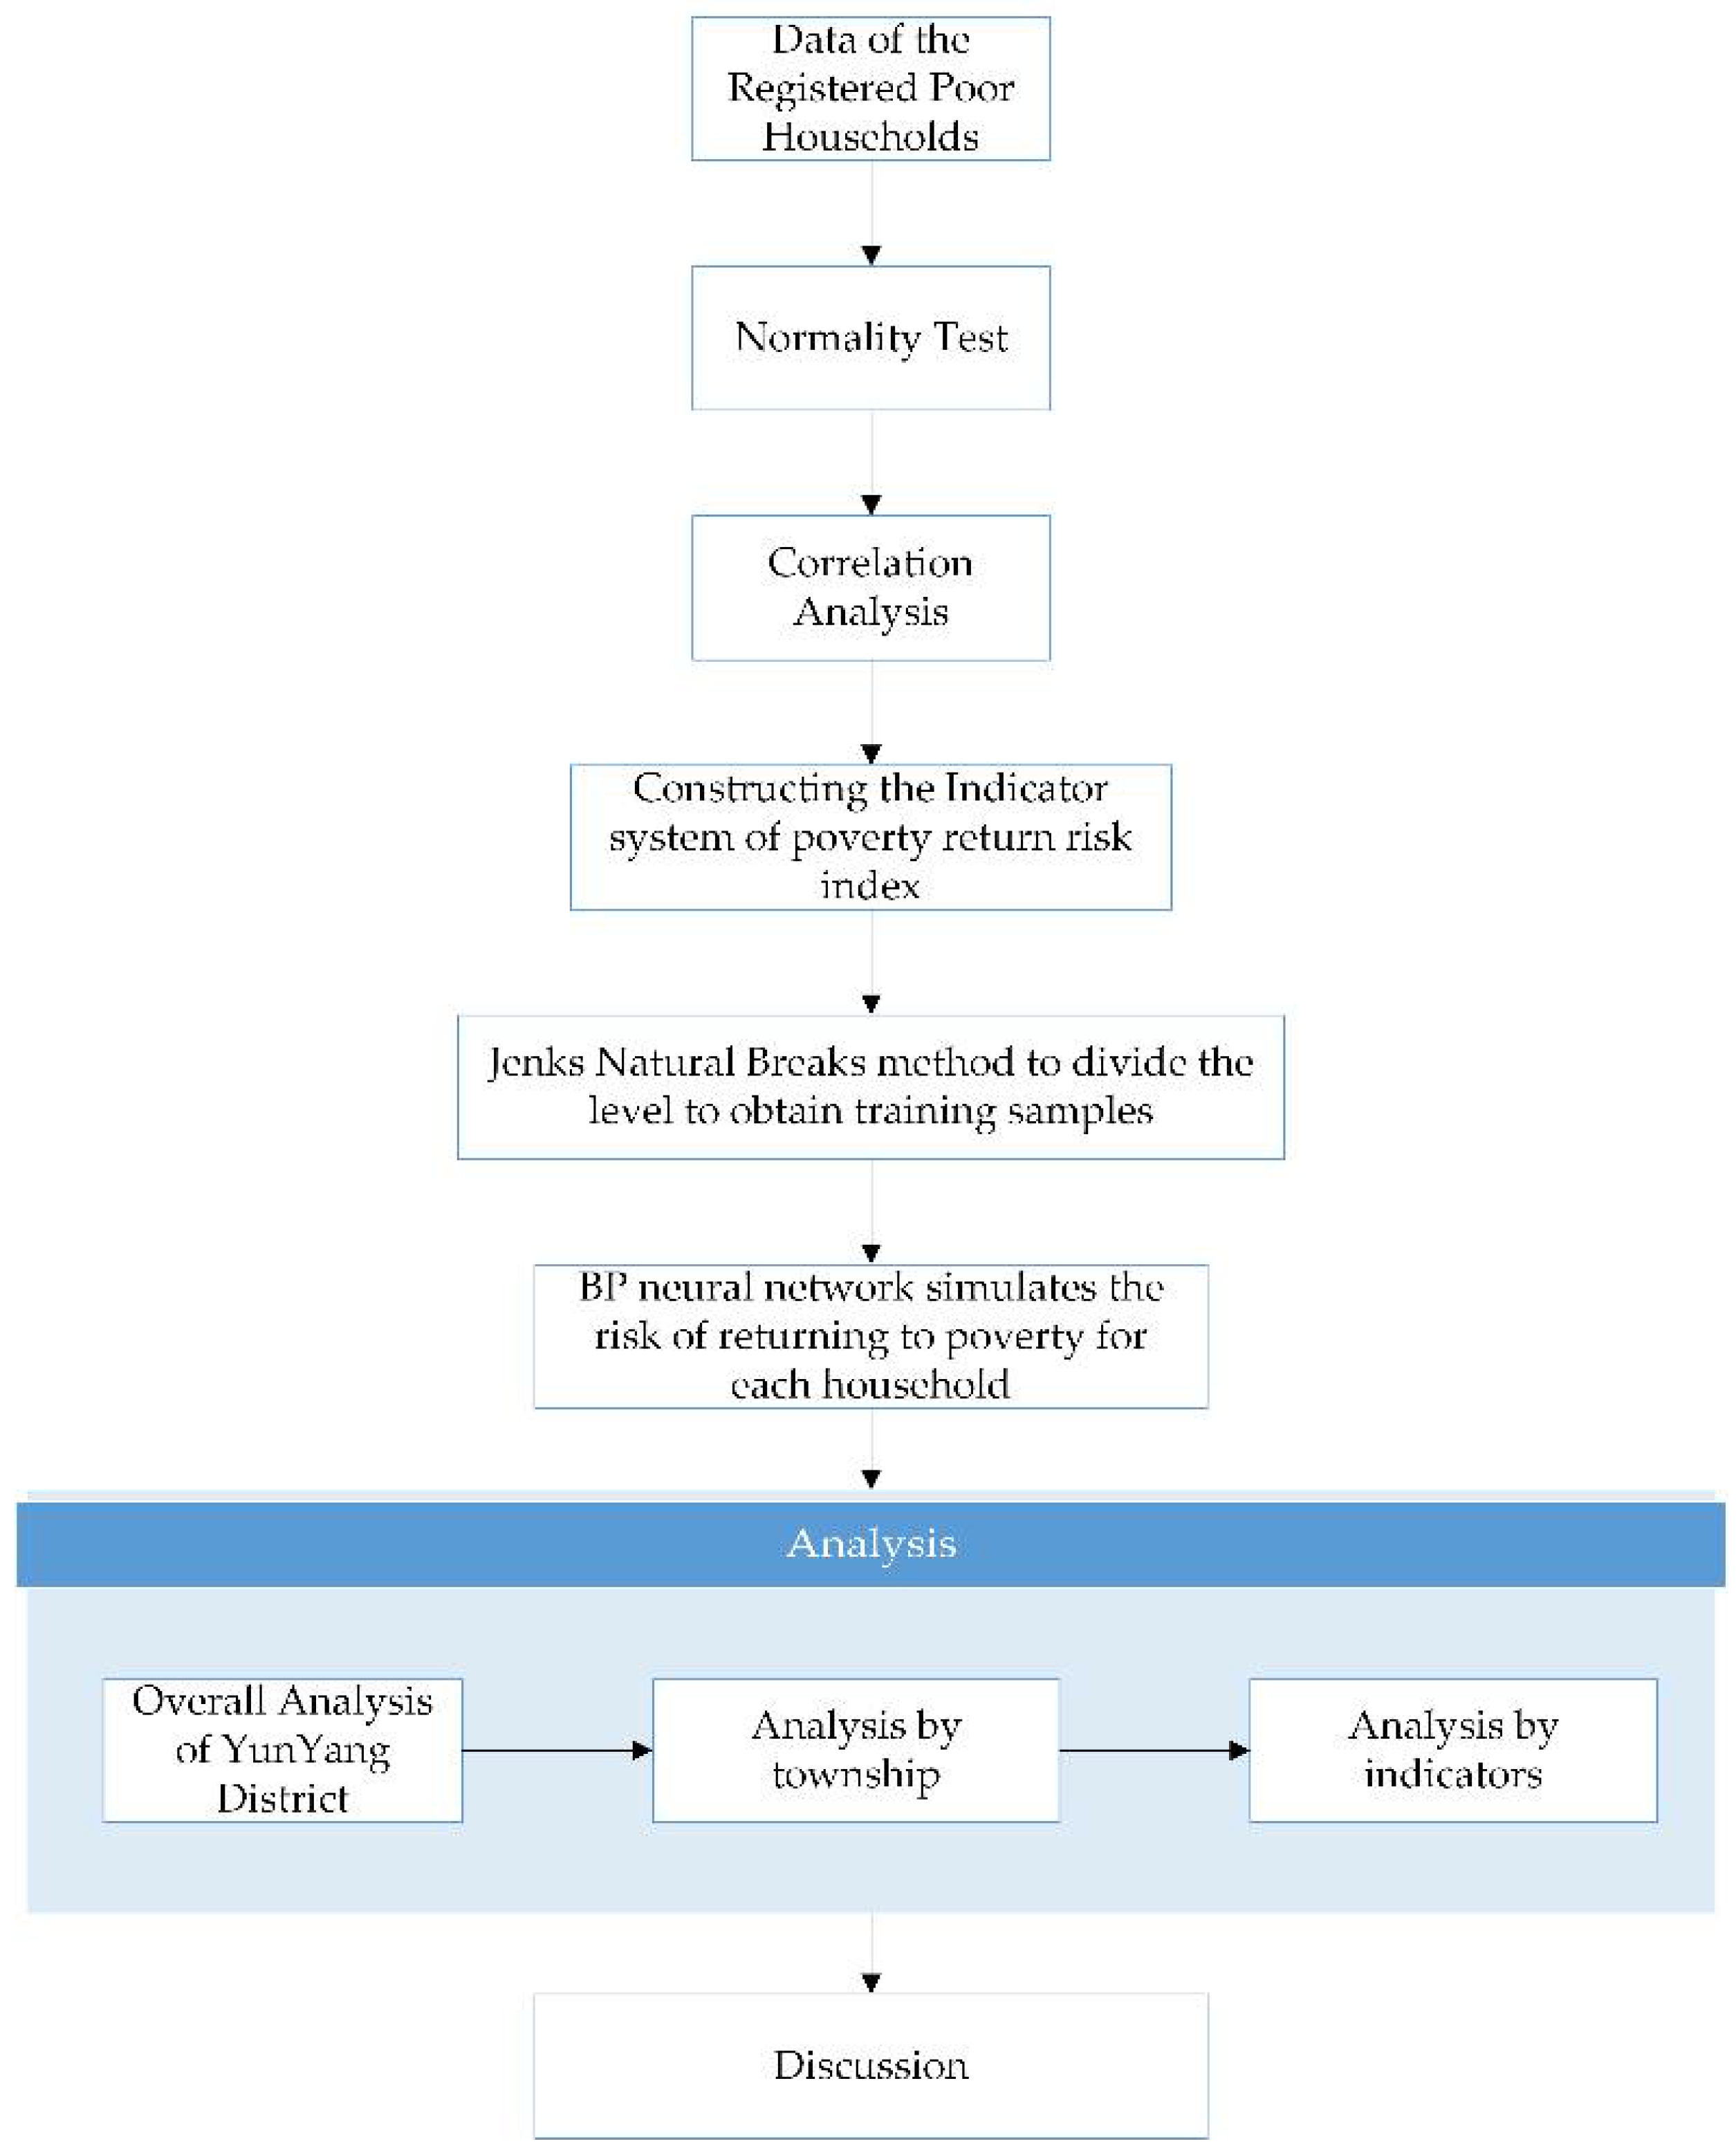
Figure 1. Technique flowchart.
Sustainability 14 05228 g001
Figure 2. Location and administrative divisions of the study area.
Sustainability 14 05228 g002
Figure 3. Neural network regression analysis.
Sustainability 14 05228 g003
Figure 4. Spatial distribution of the average value and percentage of the PRRI by township.
Sustainability 14 05228 g004
Figure 5. The traffic and DEM map of Yunyang District.
Sustainability 14 05228 g005
Figure 6. Contribution of each indicator to Y.
Sustainability 14 05228 g006
Table 1. Scoring instructions for each indicator.
Household Labor Force SituationEducationThe Past Poverty Determination of the Registered Poor HouseholdsScoring of Indicators
No labor forceIlliterate or semi-literateSpecial hardship support for poor households1
Loss of laborPrimary SchoolSpecial hardship support households2
Weak labor or semi-laborJunior High SchoolLow-income poor households3
General LaborHigh SchoolLow-income households4
Skilled WorkforceCollege and aboveGeneral poor households5
--General Farmers6
Note: Each column is a different case for the selected indicator, and the corresponding scoring for each case is on the far right.
Table 2. Statistical analysis of data skewness and kurtosis.
Labor Force SituationNumber of People in theHouseholdsAverage Age in
Households
Education StatusProperties of Poor
Households
Per Capita
Income
Number of cases48,86448,86448,86448,86448,86448,864
Skewness−0.1240.3600.5140.263−1.0512.408
Standard error of skewness0.0110.0110.0110.0110.0110.011
Kurtosis−0.864−0.342−0.4420.2960.05222.984
Kurtosis standard error0.0220.0220.0220.0220.0220.022
Z-score skewness−11.16632.44946.41823.698−95.545217.320
Z-score kurtosis−38.983−15.430−19.96513.3692.3631037.148
Table 3. Results of correlation analysis between the poverty-returning risk factors and per household capita net income in the study area.
Influencing FactorsCorrelation CoefficientSignificance Level
Mean value of labor force score within the households−0.039 **<0.001
Number of people in the households−0.181 **<0.001
Mean age in households0.163 **<0.001
Household education status mean score0.020 **<0.001
Past poverty determination of the registered poor households0.119 **<0.001
Note: ** Significance level 0.01.
Table 4. Levels of the poverty-returning risk index.
Mean Value of Labor Force Score within the HouseholdsNumber of
People in the Households
Mean Age in HouseholdsHousehold Education Status Mean ScorePast Poverty Determination of the Registered Poor HouseholdsPRRI
001111
0.15620.09090.59710.44440.82
0.40910.18180.43490.29170.63
0.62500.36360.29980.13890.24
110005
Note: Higher risk of PRRI means a higher poverty-returning risk.
Table 5. The meaning of the poverty-returning risk index.
PRRIMeaningRisk Levels
<2Extremely hard to return to povertylow risk
2–3Hard to return to poverty
3–4Moderate to return to povertymedium risk
4–5Easy to return to povertyhigh
>5Extremely easy to return to povertyvery high
Table 6. Proportion of households with different poverty-returning risk indices in each township.
Township NameAverage Value<2[2,3)[3,4)[4,5)>=5
Anyang3.980416.638%17.602%15.381%17.267%33.067%
Qingshan3.620222.199%20.040%15.218%16.524%26.017%
Daliu3.603922.718%20.485%15.507%15.507%25.781%
Baoxia3.528124.811%19.993%16.802%13.520%24.872%
Meipu2.978134.192%20.746%14.436%13.544%17.079%
Liubei3.202822.579%31.407%15.866%13.344%16.802%
Bailang3.146325.694%28.670%15.575%14.484%15.575%
Publisher’s Note: MDPI stays neutral with regard to jurisdictional claims in published maps and institutional affiliations.