Spatial Differentiation and Dynamic Evolution of Environmental Efficiency in Wheat Planting in China
Abstract
:1. Introduction
2. Review of Research
2.1. Definition of Environmental Efficiency
2.2. Environmental Efficiency Evaluation Methods
3. Research Methodology and Data Sources
3.1. Research Methodology
3.1.1. SBM-Undesirable Model
3.1.2. Theil Index
3.1.3. The Kernel Density Function
3.2. Data Sources and Indicator Selection
4. Spatial Variation Analysis of Environmental Efficiency of Wheat Cultivation
4.1. Descriptive Statistics of Spatial Variation in Environmental Efficiency of Wheat Cultivation
4.2. The Extent and Sources of Spatial Variation in the Environmental Efficiency of Wheat Cultivation
4.2.1. Decomposition of Spatial Differences in Environmental Efficiency of Wheat Planting: Based on Inter-Provincial Perspective
4.2.2. Decomposition of Spatial Gap in Environmental Efficiency of Wheat Planting in China: Based on a Regional Perspective
5. Analysis of the Dynamic Evolution of the Environmental Efficiency of Wheat Breeding
Dynamic Evolution of the Environmental Efficiency Distribution of Wheat Planting Based on Kernel Density Estimation
6. Conclusions and Suggestions for Countermeasures
Author Contributions
Funding
Institutional Review Board Statement
Informed Consent Statement
Data Availability Statement
Conflicts of Interest
References
- Cai, R. The input status of agricultural chemicals and its impact on the environment. China Popul. Resour. Environ. 2010, 20, 107–110. [Google Scholar]
- Wei, Q.; Zhang, B.; Jin, S. Construction and regional comparison of Green agricultural development index in China. Probl. Agric. Econ. 2018, 11, 11–20. [Google Scholar]
- Lv, N.; Zhu, L. A study on agro-environmental technical efficiency and green total factor productivity growth in China. Agric. Technol. Econ. 2019, 4, 95–103. [Google Scholar]
- Hailu, A.; Veeman, T.S. Non-parametric Productivity Analysis with Undesirable Outputs: An Application to the Canadian Pulp and Paper Industry. Am. J. Agric. Econ. 2001, 83, 605–616. [Google Scholar] [CrossRef]
- Liu, Y.; Li, Z.; Li, J. A comparative study of environmental efficiency evaluation methods. Pract. Underst. Math. 2010, 40, 84–92. [Google Scholar]
- Färe, R.; Grosskopf, S.; Pasurka, C.A. Pollution abatement activities and traditional productivity. Ecol. Econ. 2006, 62, 673–682. [Google Scholar] [CrossRef]
- Seiford, L.M.; Zhu, J. Modeling undesirable factors in efficiency evaluation. Eur. J. Oper. Res. 2002, 142, 16–20. [Google Scholar] [CrossRef]
- Tone, K. A slacks-based measure of super-efficiency in data envelopment analysis. Eur. J. Oper. Res. 2002, 143, 32–41. [Google Scholar] [CrossRef] [Green Version]
- Pan, D.; Ying, R. Methodology and empirical evidence for evaluating agricultural eco-efficiency in China—An analysis of SBM model based on non-expected output. J. Ecol. 2013, 33, 3837–3845. [Google Scholar]
- Du, J.; Wang, R.; Wang, X. Environmental total factor productivity and agricultural growth: A two-stage analysis based on DEA-GML index and panel Tobit model. China Rural. Econ. 2016, 3, 65–81. [Google Scholar]
- Li, C.; Cao, Y. Analysis of environmental efficiency measurement of dairy farming in China. Agric. Econ. Issues 2017, 38, 80–88, 111–112. [Google Scholar]
- Ge, P.; Wang, S.; Huang, X. Calculation of Green total factor productivity of China’s agriculture. Popul. Resour. Environ. China 2018, 28, 66–74. [Google Scholar]
- Liu, H.; Sun, S.; Li, C. Spatial differences in fertilizer use efficiency and dynamic evolution of distribution in China under environmental constraints. Agric. Econ. Issues 2019, 8, 65–75. [Google Scholar]
- Meng, X.; Zhou, H.; Du, L.; Shen, G. Technical efficiency of agricultural environment and green total factor productivity growth changes in China-a re-examination based on the perspective of combined farming and breeding. Agric. Econ. Issues 2019, 6, 9–22. [Google Scholar]
- Yang, F.; Xu, J.; Qing, P. Inducement of technological progress in Wheat production in China: Investment driven or price induced. Agrotech. Econ. 2018, 9, 100–111. [Google Scholar]
- Lai, S.; Du, P.; Chen, J. Non-point source pollution investigation and evaluation method based on unit analysis. J. Tsinghua Univ. (Nat. Sci.) 2004, 9, 1184–1187. [Google Scholar]
- Zhu, N.; Cao, B.; Qin, F. Wheat production efficiency based on fertilizer reduction potential and carbon reduction. Chin. Environ. Sci. 2018, 2, 784–791. [Google Scholar]

| Time Period | Research Methodology | Input Variables | Desired Output Variables | Non-Desired Output Variables | Literature Sources |
|---|---|---|---|---|---|
| 1991–2003 | DEA-GML | Number of employees in planting industry, total area of crops sown, total power of planting industry machinery, fertilizer application, year-end stock of draft animals, effective irrigation area. | Total output value of plantation industry | TN, TP, COD, pesticide residues, agricultural film residues | Du Jiang et al. (2016) [10] |
| 1998–2009 | Directional distance function, ML index | Number of employees in agriculture, forestry, animal husbandry and fishery, crop sowing area and aquaculture area, fertilizer use, total power of agricultural machinery, year-end stock drought animals, total amount of agricultural water use. | Total output value of agriculture, forestry, animal husbandry, and fishery | Standard emissions of COD, nitrogen, phosphorus, etc. | Pan Dan et al. (2013) [6] |
| 2001–2015 | SBM directional distance function, ML index | Number of employees in the plantation industry, total power of plantation machinery, total area of crops sown, chemical fertilizers, pesticides, agricultural films, total agricultural water consumption and agriculture. | Value added of plantation industry | Carbon emissions from farming | Ge Pengfei et al. (2018) [12] |
| 2001–2015 | Non-desired output SBM model with global covariance | Labor input, agricultural machinery and machine power, crop sowing, sown area, fertilizer of crops, application, agricultural film use, pesticide use, total agricultural energy consumption and total agricultural water consumption. | Total agricultural output | Agricultural carbon emissions and agricultural surface pollution. | Liu Huajun et al. (2019) [13] |
| 2004–2014 | SBM-Undesirable Model | Quantity of concentrate feed, green and roughage costs, quantity of labor, fixed asset input | Production of main products, the by-product output, | COD, TN, TP, Cu, Zn | Li Cuixia et al. (2017) [11] |
| 1998-By-product value | COD, TN, TP, Cu, Zn, super-SBM Models | Number of agricultural workers, agricultural land area, livestock and poultry farming input costs, total agricultural machinery power | Total agricultural output | Nitrogen Surplus Intensity on Agri-cultural Land | Meng, Xianghai et al. (2019) [14] |
| 2011–2015 | SBM model, MLindex | Number of employees in primary industry, total sown area of crops, total power of agricultural machinery, fertilizer use | Total output value of agriculture, forestry, animal hus-bandry and fishery | COD, TN, TP | Luna et al. (2019) [3] |
| Year | 2010 | 2011 | 2012 | 2013 | 2014 | 2015 | 2016 | 2017 | 2018 | 2020 | Average/Mean Value |
|---|---|---|---|---|---|---|---|---|---|---|---|
| Amur | 1 | 1 | 1 | 1 | 1 | 1 | 1 | 1 | 1 | 1 | 1 |
| Jiangsu | 1 | 1 | 1 | 1 | 1 | 1 | 1 | 1 | 1 | 1 | 1 |
| Inner Mongolia | 1 | 1 | 1 | 1 | 1 | 1 | 1 | 1 | 1 | 1 | 1 |
| Ningxia | 1 | 1 | 1 | 1 | 1 | 1 | 1 | 1 | 1 | 1 | 1 |
| Yunnan | 1 | 1 | 1 | 1 | 1 | 1 | 1 | 1 | 1 | 1 | 1 |
| Xinjiang | 1 | 1 | 1 | 0.735 | 0.718 | 0.728 | 0.733 | 0.770 | 0.741 | 0.742 | 0.817 |
| Hubei | 1 | 0.780 | 0.756 | 0.672 | 0.667 | 0.631 | 0.629 | 0.595 | 0.451 | one | 0.718 |
| Gansu | 1 | 0.696 | one | 0.692 | 0.661 | 0.589 | 0.581 | 0.666 | 0.649 | 0.569 | 0.710 |
| Shaanxi | 1 | 0.746 | 0.751 | 0.601 | 0.603 | 0.600 | 0.598 | 0.643 | 0.627 | 0.604 | 0.677 |
| Sichuan | 1 | 0.649 | one | 0.526 | 0.614 | 0.638 | 0.559 | 0.555 | 0.560 | 0.506 | 0.661 |
| Anhui (Province) | 1 | 0.646 | one | 0.528 | 0.542 | 0.453 | 0.483 | 0.560 | 0.519 | 0.661 | 0.639 |
| Shanxi | 0.741 | 0.853 | 0.771 | 0.615 | 0.617 | 0.544 | 0.556 | 0.591 | 0.553 | 0.518 | 0.636 |
| Hebei | 0.743 | 0.686 | 0.668 | 0.594 | 0.595 | 0.599 | 0.622 | 0.649 | 0.552 | 0.548 | 0.626 |
| Henan | one | 0.579 | 0.544 | 0.417 | 0.432 | one | 0.430 | 0.453 | 0.420 | 0.488 | 0.576 |
| Shandong | 0.774 | 0.520 | 0.544 | 0.403 | 0.443 | 0.500 | 0.487 | 0.471 | 0.480 | 0.496 | 0.512 |
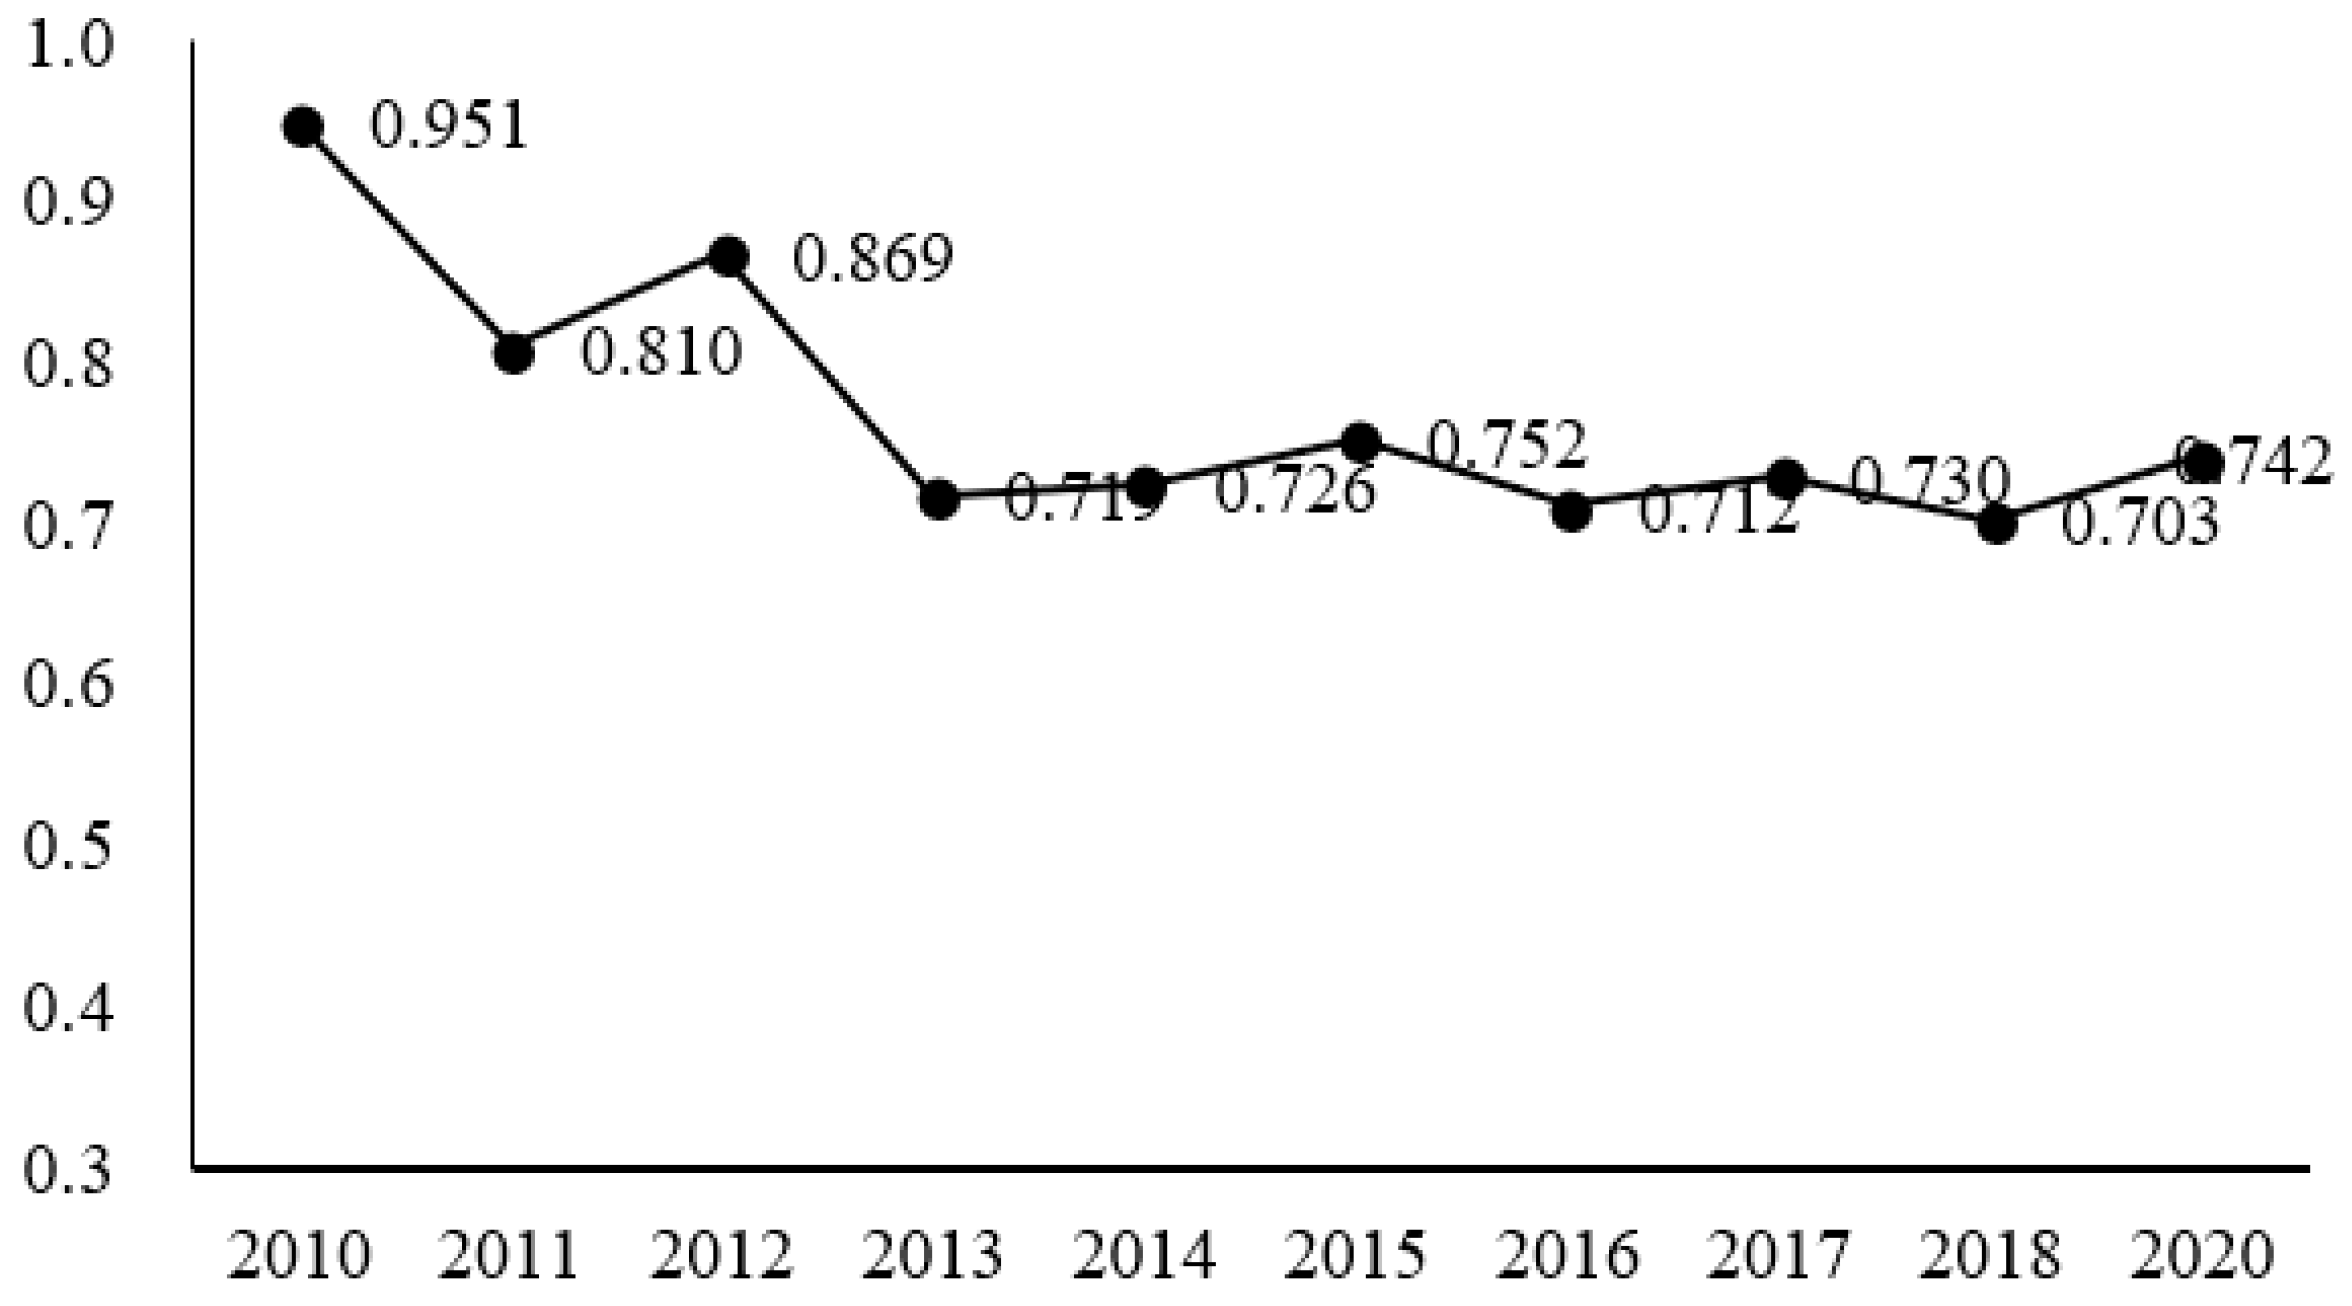
| average/mean value | 0.951 | 0.810 | 0.869 | 0.719 | 0.726 | 0.752 | 0.712 | 0.730 | 0.703 | 0.742 |
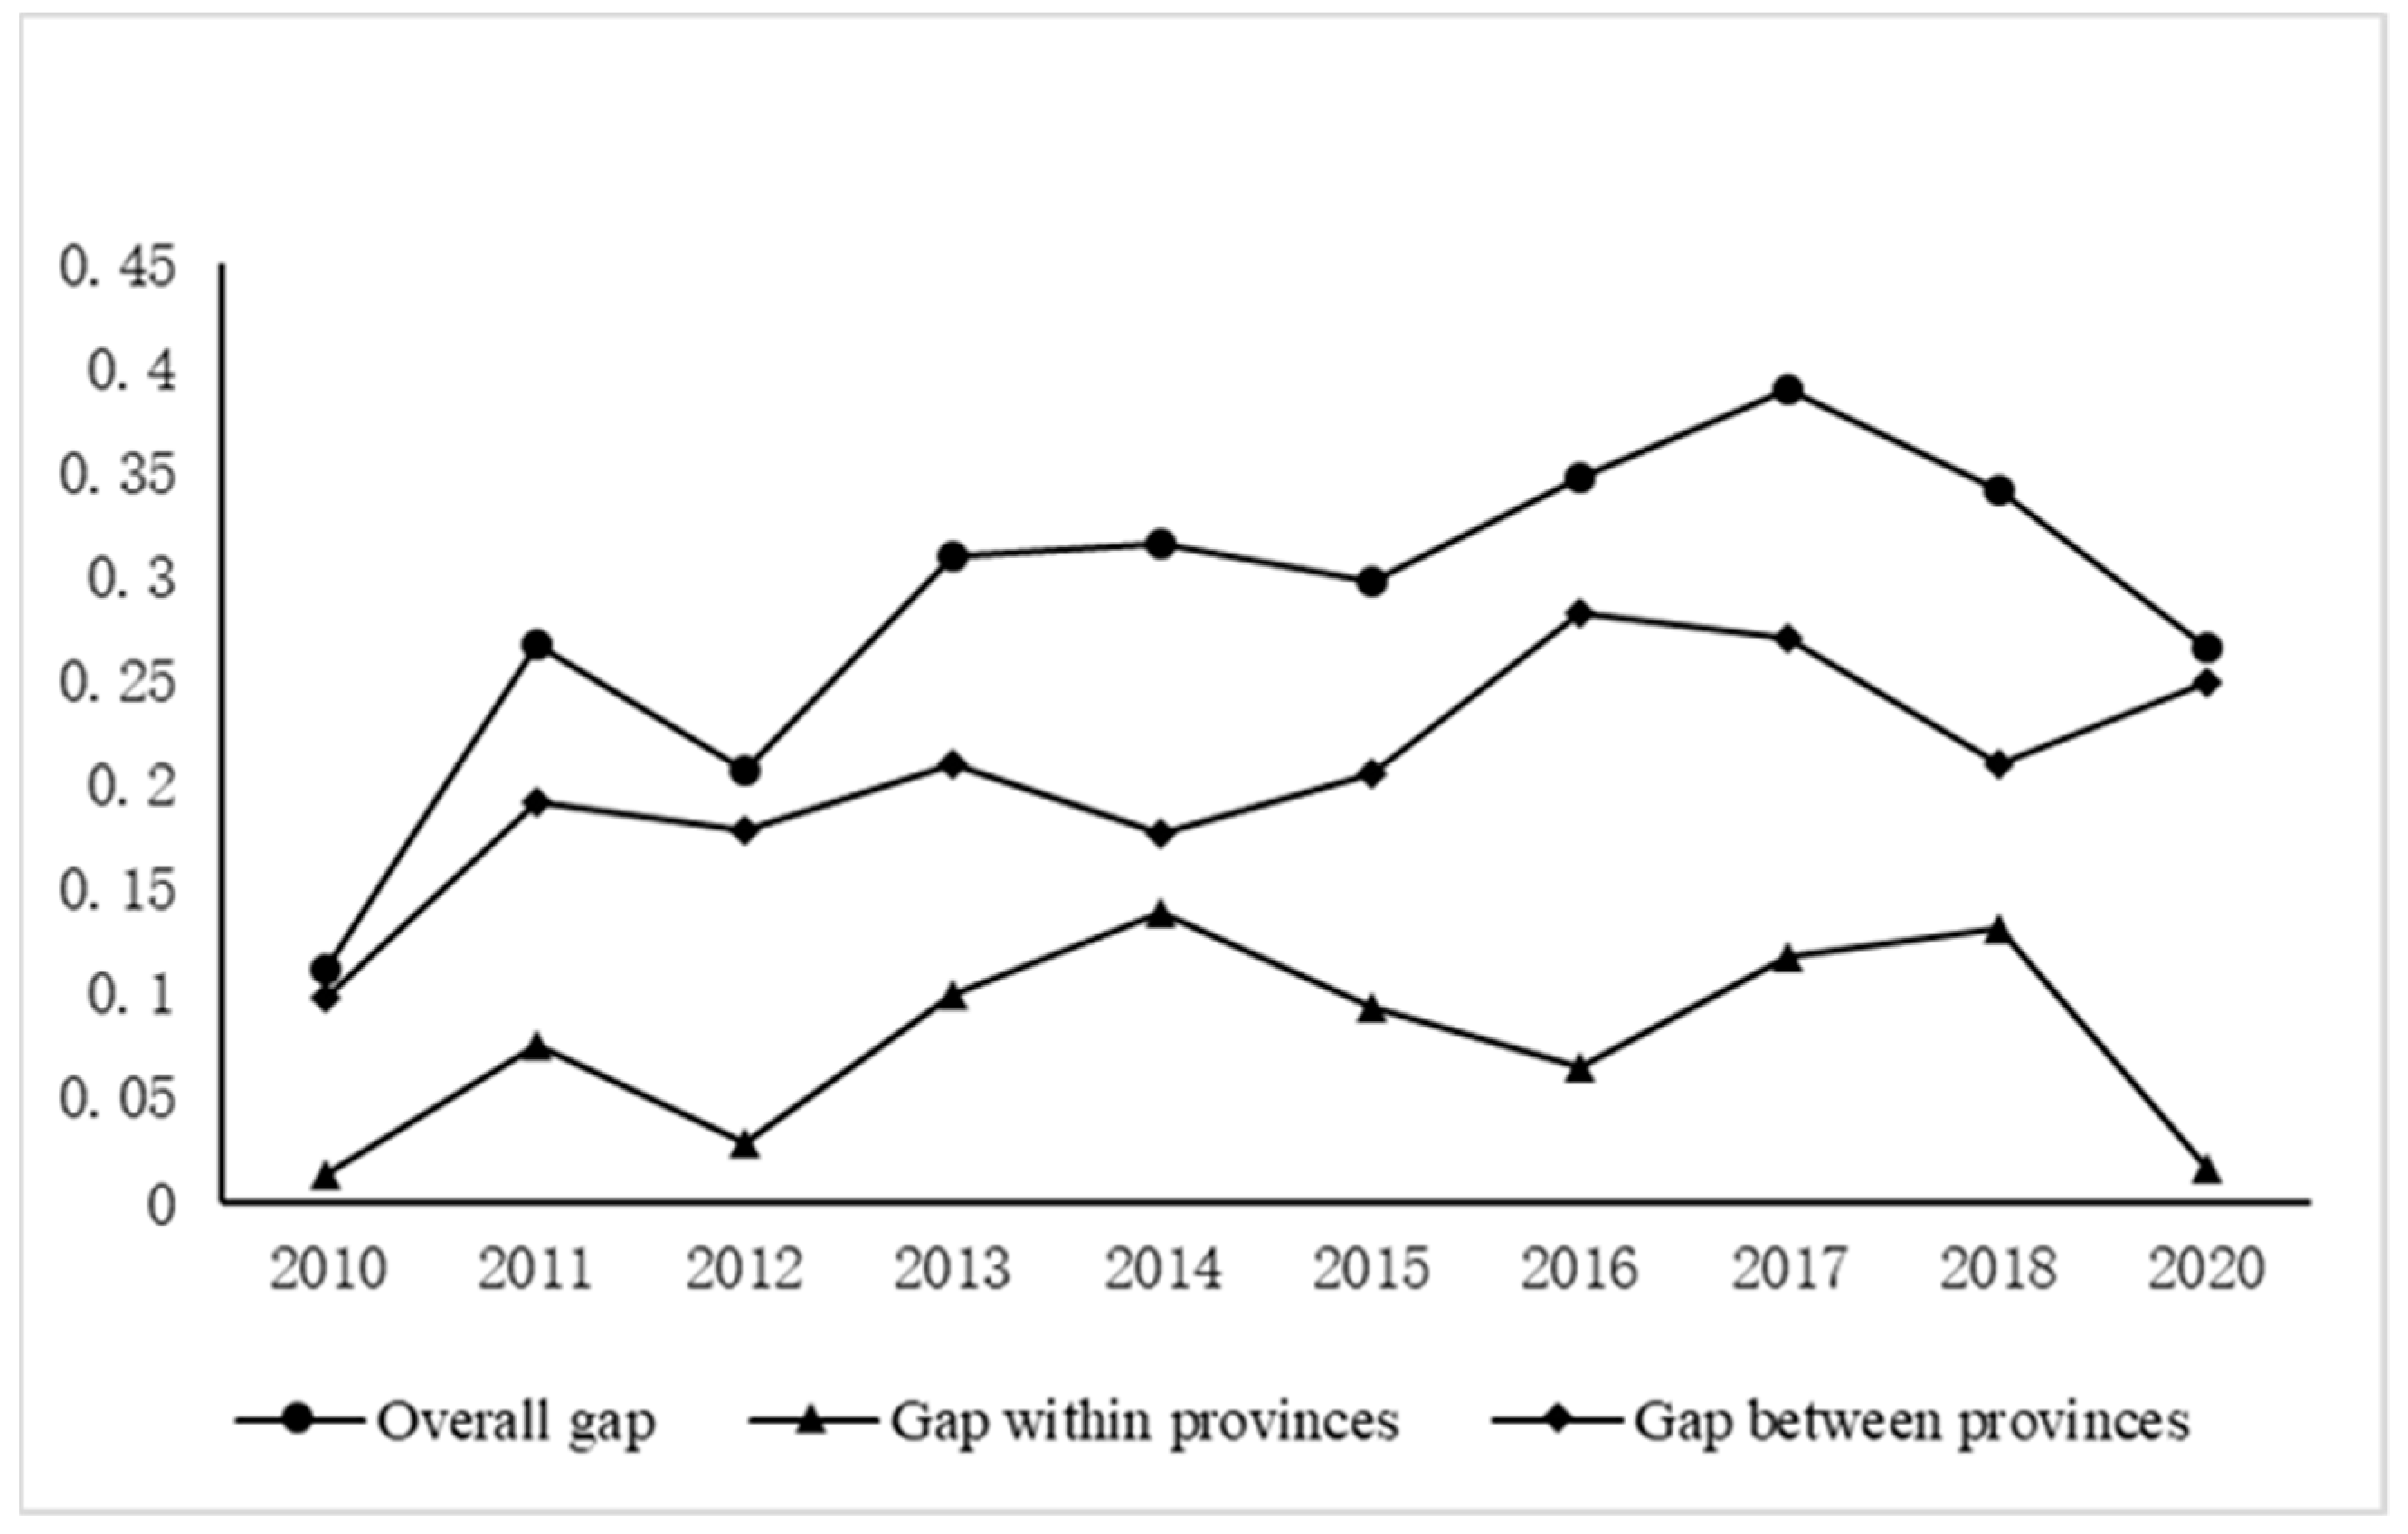
| Age | Overall Provincial Gap | Inter-Provincial Disparity | Inter-Provincial Gap |
|---|---|---|---|
| 2010 | 0.111 | 0.013 | 0.098 |
| 2011 | 0.267 | 0.075 | 0.192 |
| 2012 | 0.207 | 0.029 | 0.178 |
| 2013 | 0.309 | 0.099 | 0.210 |
| 2014 | 0.315 | 0.139 | 0.176 |
| 2015 | 0.298 | 0.093 | 0.205 |
| 2016 | 0.347 | 0.065 | 0.282 |
| 2017 | 0.389 | 0.118 | 0.271 |
| 2018 | 0.342 | 0.132 | 0.210 |
| 2020 | 0.266 | 0.017 | 0.249 |
| Region | Southwest Wheat Area | Middle and Lower Yangtze River Wheat Area | Yellow Huaihai Wheat Area | Northwest Wheat Area |
|---|---|---|---|---|
| Province | Xinjiang, Ningxia, Inner Mongolia | Sichuan, Hubei, Anhui, Jiangsu | Henan, Shandong, Hebei, Shaanxi | Yunnan, Gansu, Shanxi |
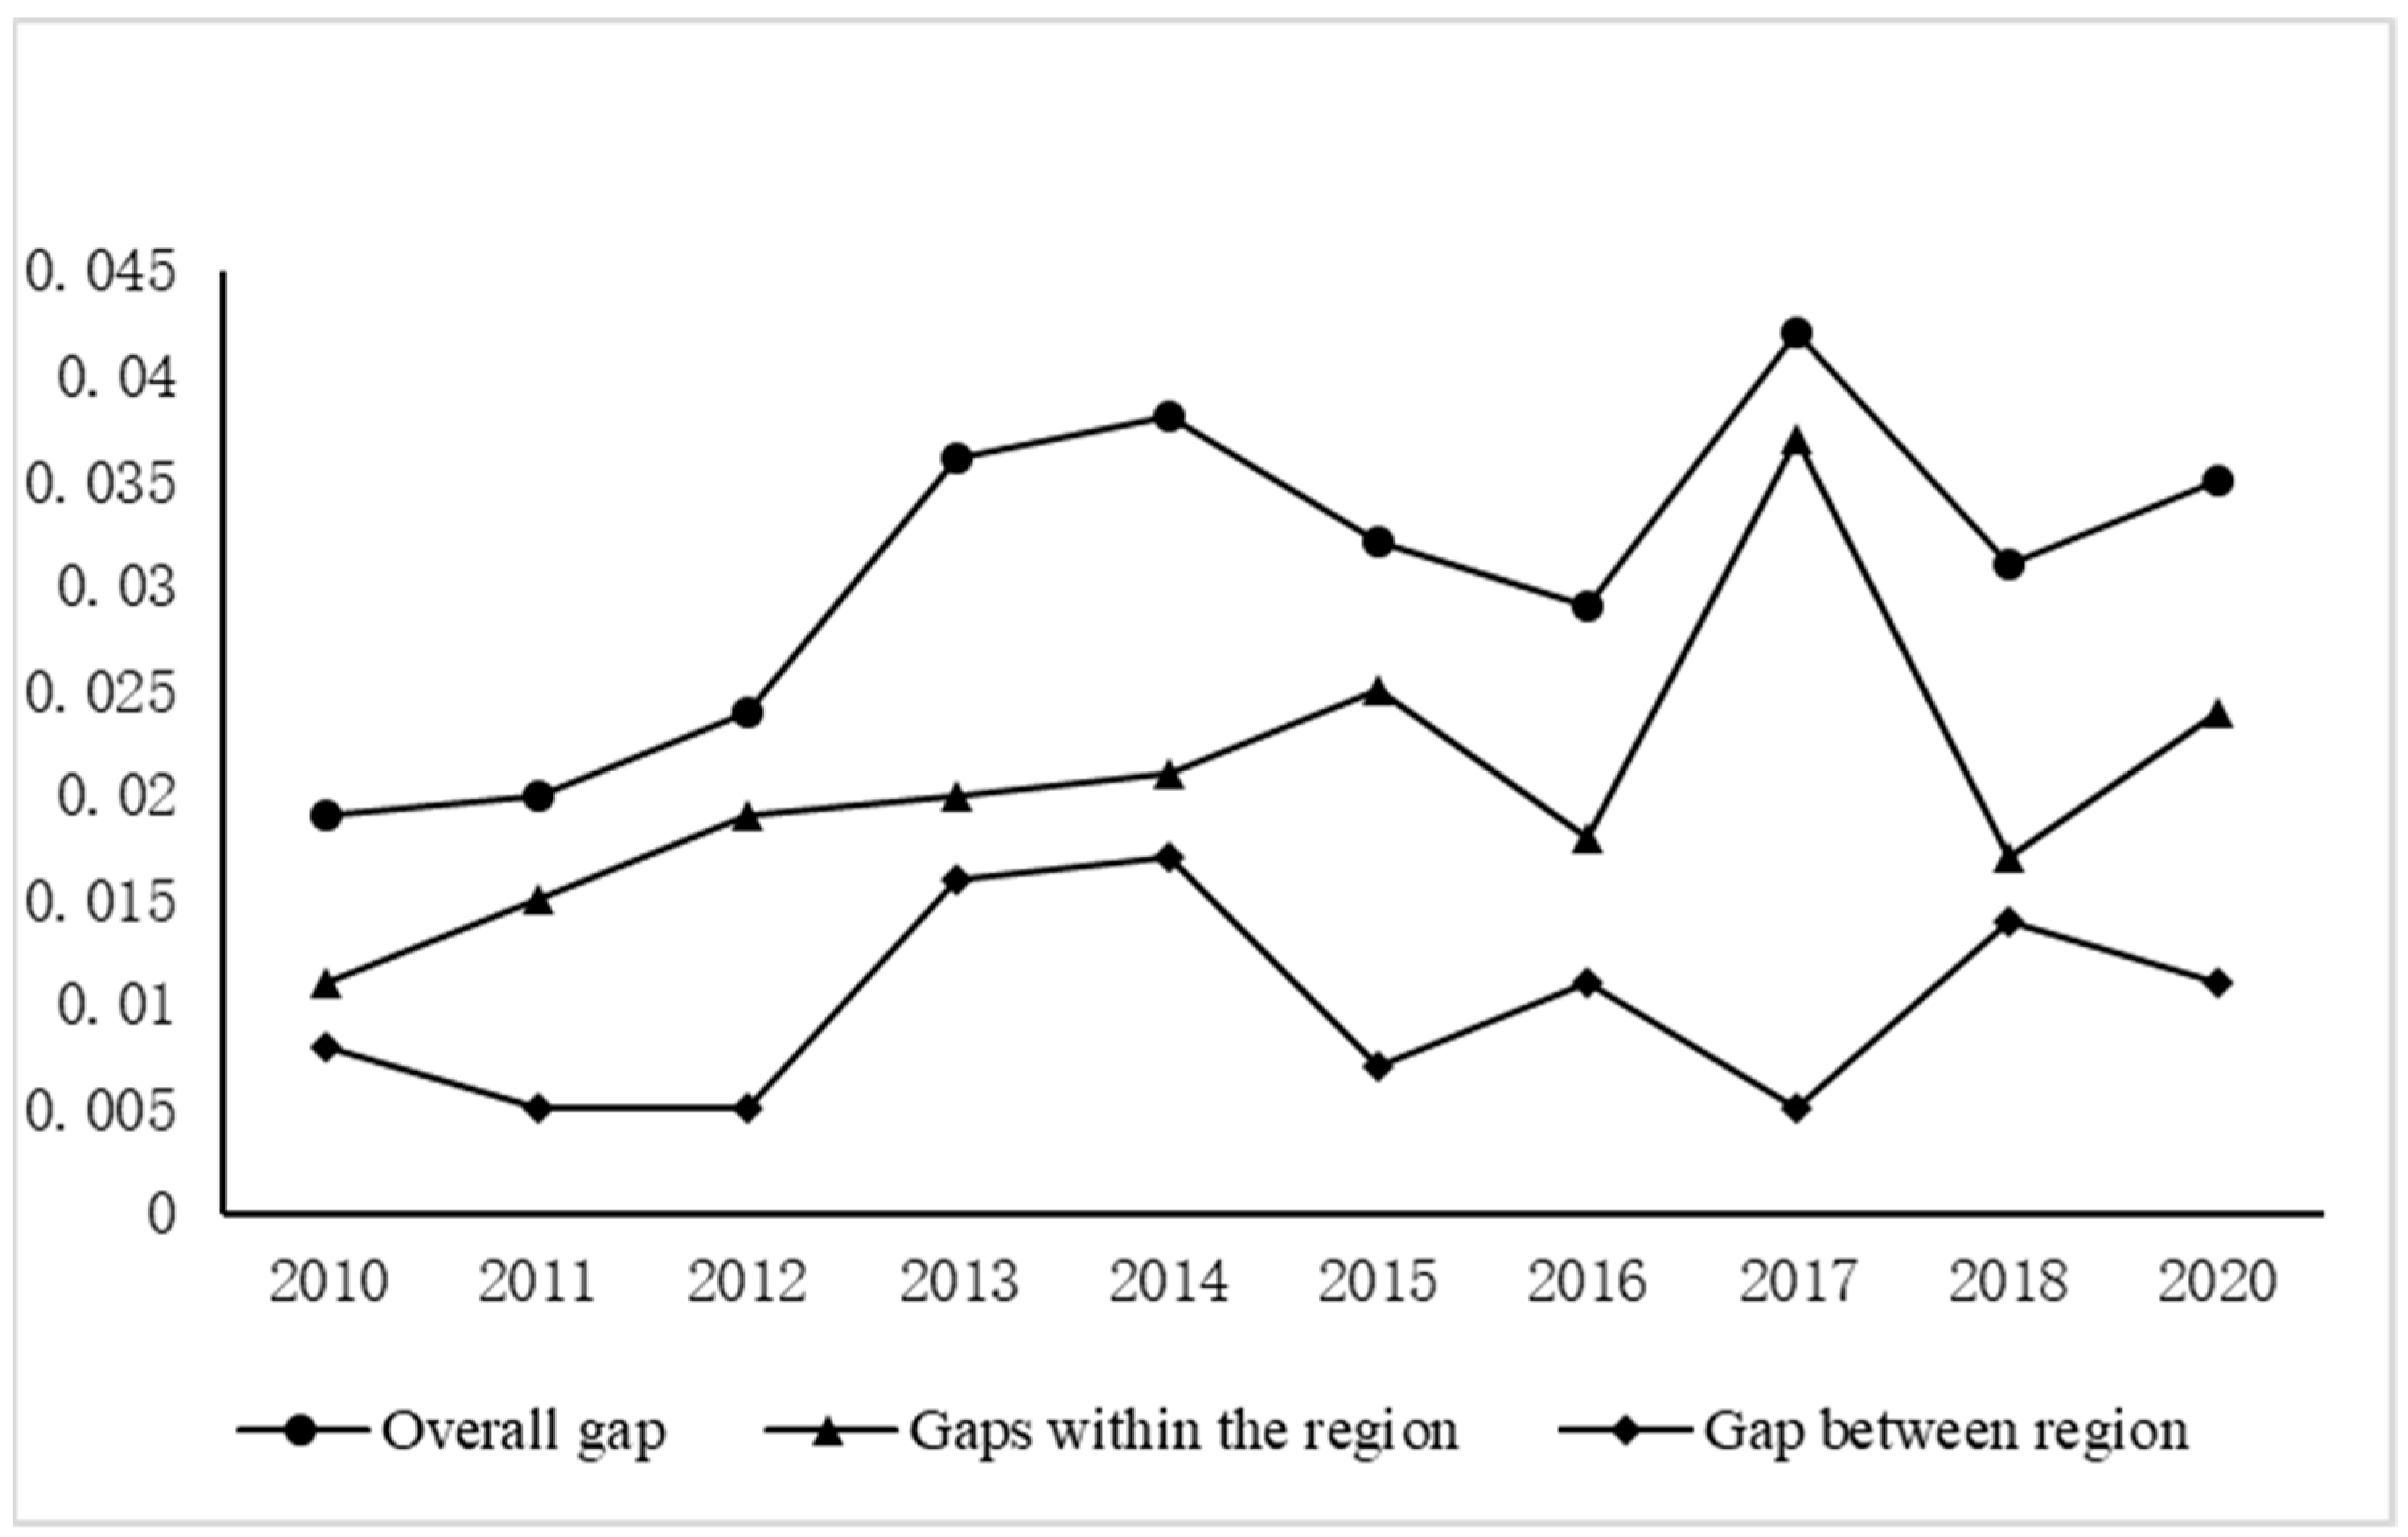
| Year | Overall Wheat Region Gap | Intra-Regional Disparities | Wheat Interval Gap |
|---|---|---|---|
| 2014 | 0.018 | 0.010 | 0.008 |
| 2015 | 0.023 | 0.013 | 0.010 |
| 2016 | 0.028 | 0.022 | 0.006 |
| 2014 | 0.038 | 0.021 | 0.017 |
| 2017 | 0.020 | 0.013 | 0.007 |
| 2018 | 0.019 | 0.010 | 0.009 |
| 2017 | 0.042 | 0.037 | 0.005 |
| 2018 | 0.031 | 0.017 | 0.014 |
| 2020 | 0.035 | 0.024 | 0.011 |
Publisher’s Note: MDPI stays neutral with regard to jurisdictional claims in published maps and institutional affiliations. |
© 2022 by the authors. Licensee MDPI, Basel, Switzerland. This article is an open access article distributed under the terms and conditions of the Creative Commons Attribution (CC BY) license (https://creativecommons.org/licenses/by/4.0/).
Share and Cite
Yu, Y.; Xu, Z.; Li, Y. Spatial Differentiation and Dynamic Evolution of Environmental Efficiency in Wheat Planting in China. Sustainability 2022, 14, 5241. https://doi.org/10.3390/su14095241
Yu Y, Xu Z, Li Y. Spatial Differentiation and Dynamic Evolution of Environmental Efficiency in Wheat Planting in China. Sustainability. 2022; 14(9):5241. https://doi.org/10.3390/su14095241
Chicago/Turabian StyleYu, Yaguai, Zanzan Xu, and Yuting Li. 2022. "Spatial Differentiation and Dynamic Evolution of Environmental Efficiency in Wheat Planting in China" Sustainability 14, no. 9: 5241. https://doi.org/10.3390/su14095241
APA StyleYu, Y., Xu, Z., & Li, Y. (2022). Spatial Differentiation and Dynamic Evolution of Environmental Efficiency in Wheat Planting in China. Sustainability, 14(9), 5241. https://doi.org/10.3390/su14095241


