Article

Spatial Differentiation and Dynamic Evolution of Environmental Efficiency in Wheat Planting in China

1
Business School, Ningbo University, Ningbo 315211, China
2
Donghai Academy, Ningbo University, Ningbo 315211, China
*
Author to whom correspondence should be addressed.
Sustainability 2022, 14(9), 5241; https://doi.org/10.3390/su14095241
Submission received: 10 March 2022 / Revised: 18 April 2022 / Accepted: 19 April 2022 / Published: 26 April 2022

Abstract

:
Improving the environmental efficiency of planting is one of the emphases of current agricultural work. The environmental efficiency of wheat planting brings some challenges to the regional coordinated development of wheat planting. In this paper, an SBM-undesirable model was used to measure the environmental efficiency of wheat planting in 14 Provinces of China from 2014 to 2018, with Theil index and kernel density estimation methods used to analyze its spatial variation and dynamic evolution. The results show that the spatial distribution pattern of wheat planting environmental efficiency was higher in the north and lower in 2018; Theil index decomposition results show that the overall difference decreased first and then increased, and that regional difference was the main reason. After considering the spatial factors, the interaction effect of wheat planting environmental efficiency among some different regions is considered.

1. Introduction

Wheat is one of the most important food crops in the world today, and it is first in planting area and production among grass crops. China is the second largest wheat sowing area and the first largest wheat producer in the world. According to the National Bureau of Statistics, in 2019, China’s wheat sown area was 344.77 million mu, wheat in China reached 235.684 thousand hectares and total output was 524.2 billion kg, accounting for 11.2 percent and 17.6 percent of the world’s total sown area and total output, respectively.
However, the continuous increase in wheat yield also brings corresponding environmental hazards. The planting process requires inputs that include chemical fertilizers, pesticides, and films, which are indispensable for production but lead to agricultural non-point source pollution resulting from harmful substances such as nitrogen and phosphorus flowing into water bodies, as well as environmental problems such as carbon emissions resulting from chemical fertilizer production, transportation, and use. However, research shows that, while the input of chemical fertilizers in China’s grain production is increasing, the utilization rate of chemical fertilizers is lower than that of developed countries (Cai Rong, 2010) [1]. Therefore, the problem of environmental pollution caused by excessive and improper use of chemical fertilizers in wheat planting is worth considering. When considering the efficiency of wheat planting, we should not only consider the simple input and output costs but also pay attention to the undesirable negative environmental effects, and comprehensively evaluate environmental optimization and wheat production, which is the best way to ensure the sustainable development of agriculture.
Environmental efficiency integrates production efficiency with environmental pollution control, with the goal of obtaining the largest output with the least input of factors related to the negative outputs, such as environmental pollution; it is more meaningful than traditional production efficiency. Therefore, this paper will use environmental efficiency instead of production efficiency to measure wheat planting in China’s provinces, understand the overall level and regional differences in wheat environmental efficiency in China, and further describe and analyze the spatial analysis and dynamic evolution of wheat planting environmental efficiency, to provide a breakthrough point for improving these factors for wheat planting in China and other provinces.

2. Review of Research

2.1. Definition of Environmental Efficiency

The concept of environmental efficiency originated in the 1970s and was first called eco-efficiency. In 1990, Schaltegger and Sturm proposed to consider eco-efficiency as the link between business activities and sustainable development, and in 1992, the World Business Council for Sustainable Development (WBCSD) defined environmental efficiency as the ratio of the economic value of products and services that meet human needs to their environmental load. In 1998, the World Organization for Economic Cooperation and Development (OECD) expanded the concept of eco-efficiency to include governments, industrial enterprises, and other organizations.
In recent years, policies to strengthen the management of agricultural surface source pollution have been intensively introduced, and the report on the 19th National Congress included the management of agricultural surface source pollution as one of the key outstanding environmental issues to be addressed. Promoting agricultural green development in agriculture is an important way to crack the pressure on resources and the environment for China’s agricultural development, and an objective requirement to meet the growing needs of people for a better life (Wei Qi et al., 2018) [2]. Along with the seriousness of agricultural pollution, many scholars have applied environmental efficiency to agricultural production in order to reduce environmental pollution while meeting production needs. Agro-environmental technical efficiency is a concept developed on the basis of traditional agricultural technical efficiency, which is a real agricultural technical efficiency that takes into account the cost of resources and the environment (Luna Na et al., 2019) [3]. The environmental efficiency cited in this paper is defined as the concept of environmental efficiency proposed by WBCSD in 1992, which is an efficiency that simultaneously aims at economic benefits and environmental protection and requires producers to provide higher value with lower material and energy inputs and lower emissions; the evaluation of environmental efficiency should take into account both economic and environmental benefits.

2.2. Environmental Efficiency Evaluation Methods

Foreign scholars started their research on environmental efficiency earlier, and analysis of the previous literature reveals that current, common methods for environmental efficiency evaluation include, at present, the stochastic frontier method (SFA) and data envelopment analysis (DEA). Compared with the SFA method, the DEA method can well reduce the influence of subjective factors, so it is predominantly used in environmental efficiency measurement research. The research of a large number of scholars has led to continuous improvements in the DEA method, the input method used more frequently in the early literature, where the unexpected output variables were treated as inputs (Hailu and Veeman, 2001) [4]. In order to improve the efficiency and expand the output, Zhu and Scheel et al. proposed the inverse conversion method to treat the inverse of the non-desired output as the desired output. However, the drawback of these two methods is that neither considers the actual production process and cannot reflect the essence of the production process; therefore, the calculation of environmental efficiency is biased or inaccurate (Liu, Y et al., 2010) [5]. Fare et al. (1989) [6] were the first to use the weak disposability of inputs and outputs to deal with pollution variables; to reduce non-desired outputs such as pollution, good outputs must be sacrificed, so a nonlinear form of hyperbolic was proposed. Seiford and Zhu (2002) [7] first multiplied the non-desired output by −1, and then found a suitable transformation vector to make all negative non-desired outputs positive; based on which, they constructed a DEA method to deal with non-desired outputs under VRS conditions, also known as the transformation vector method. Fare et al. (2003) [6] proposed a directional distance based on weak disposability and output perspective. They also proposed a directional distance function method based on weak disposability and output angle, and creatively proposed the Malmquist-Luenberger productivity index (ML index). In addition, Tone (2001) [8] proposed a new non-radial, non-angle DEA method, i.e., the SBM model, which takes into account the non-radial and non-angular, and considered the input-output slackness due to the choice of angle and radial direction.
China is a large agricultural country, but increase in agricultural production is accompanied by pollution problems; how to evaluate the efficiency of agricultural production on the basis of environmental benefits has become an increasingly popular direction of research by domestic scholars in recent years. Pan Dan (2013) [9] used the SBM model to measure the agricultural eco-efficiency of 30 provinces in China from 1998 to 2009, giving ways to improve agricultural eco-efficiency based on input change and output change; Du Jiang (2016) [10] used the DEA-GML index and panel Tobit model to analyze the Chinese agricultural environmental total factor productivity and its components’ national trends and regional and inter-provincial differences, dissecting their influencing factors. Li Cuixia (2017) [11] measured the environmental efficiency and improvement potential of dairy farms of different sizes in 29 provinces of China from 2004 to 2014, using the SBM-undesirable model, and analyzing the factors affecting environmental efficiency using the Tobit model. Additional studies are shown in Table 1; results of the studies will differ depending on the input variables, desired outputs, and non-desired outputs selected.
Analyzing the above studies, we find that the current research on agricultural environmental efficiency by domestic scholars mainly focuses on the concept and connotations of agricultural environmental efficiency, the actual measurement of agricultural eco-efficiency, and its influencing factors. The main aspects that can be improved are as follows. Firstly, the scope of research is not detailed enough, most being focused on the research objects of agriculture, forestry, animal husbandry, and fishery, as well as agriculture as a whole, but no separate research on the plantation industry or even the wheat plantation industry among them. Secondly, research is biased towards the actual measurement of agro-ecological efficiency, but ignores the analysis of its spatial differentiation and dynamic evolution of distribution, so cannot grasp the trend as a whole.
Based on this, this paper will take the wheat industry in the plantation industry as the research object, select agricultural surface source pollution as a non-desired, carbon emissions output factor, use the SBM-undesirable model in the DEA method to measure the environmental efficiency of the wheat plantation industry in 14 Chinese provinces of China from 2014 to 2018, and use the Theil index and Kernel method to examine the spatial environmental efficiency and dynamic evolution of distribution.

3. Research Methodology and Data Sources

3.1. Research Methodology

3.1.1. SBM-Undesirable Model

In this paper, we use provinces as decision units to construct the possibility bounds for the environmental efficiency of wheat cultivation. Assuming that the wheat production system has n decision units, each using m inputs (i = 1, 2, …, m), s1 desired outputs, and s2 non-desired outputs, denoted as x ∈ Rm, yg ∈ Rs1, yb ∈ Rs2, respectively, the matrices X, Yg, Yb can be defined as follows:
X = [x1, …, xn] ∈ Rm×n > 0
Yg = [yg1, …, ygn] ∈ Rs1×n > 0
Yb = [yb1, …, ybn] ∈ Rs2×n > 0
The set of production possibilities is transformed into: P = {(x, yg, yb)|x ≥ Xλ, yg ≥ λYg, yb ≥ λYb, λ ≥ 0}. where λ ∈ Rn is the weight vector.
Among the basic models of the DEA method, the SBM model not only has the advantages of the traditional CCR model but can also overcome the shortcomings of the traditional DEA model, taking both slack input and slack output into account, so as to evaluate the real efficiency level of each decision-making body more effectively. At the same time, the SBM model includes the non-radial and non-angular measurement methods of the DEA model, which can avoid the deviation and influence caused by the difference between radial and angular choices, and better reflect the essence of efficiency evaluation than other models.
Based on this, this paper selects the SBM-undesirable model in the DEA method as the research method. According to the definition, the SBM-undesirable model with unexpected output is as follows:
ρ = min 1 1 m i = 1 m S i x i 0 1 + 1 S 1 + S 2 ( r = 1 S 1 S r g y r 0 g + r = 1 S 2 S r b y r 0 b )
s . t . { x 0 = X λ + S y 0 g = Y g λ s g y 0 b = Y b λ s b s 0 , s g 0 , s b 0 , λ 0
where s, sg and s denote the input, desired output and non-desired output, respectively, and ρ* is the slack variable with respect to si = (∀i), the s r g (∀r), the s r b (∀ r) a function of decreasing function (I), (R) and (R), and 0 ≤ ρ* ≤ 1. The solution obtained from the function is optimal and the decision unit is fully efficient when and only when ρ* = 1, i.e., s = sg = sb = 0. When ρ* < 1, i.e., at least one of the three variables of s, sg and sb is not equal to 0, there is a loss of efficiency in the decision unit and it is necessary to improve the inputs and outputs, and the slack variables of the inputs and outputs are respectively the same as the original inputs and outputs. The ratio represents the magnitude of the input and the output should be improved.

3.1.2. Theil Index

This paper uses the Theil index and its decomposition method to measure regional disparities in the environmental efficiency of wheat cultivation. The advantage of the Theil index is that it can decompose the overall regional disparities into intra-regional disparities and inter-regional disparities, which can reveal the direction and magnitude of the intra-regional and inter-regional disparities, thus providing a convenient way to examine the main sources of the overall regional disparities. The smaller the value of the Theil index, the smaller the regional disparity, and the larger the value, the larger the regional disparity. In this paper, the Theil index measure and decomposition formula for the environmental efficiency of wheat cultivation is defined as:
(1) The overall Theil index for the environmental efficiency of wheat cultivation in China:
T = 1 n i = 1 n y i y ¯ log ( y i y ¯ ) ;
(2) The Theil index of the environmental efficiency gap of wheat cultivation among provinces within the region:
T k = 1 n i = 1 n y i k y k ¯ log ( y i k y k ¯ ) ;
(3) The intra-regional Theil index:
T w = k = 1 m ( n k n y ¯ k y ¯ ) T k
indicating intra-regional disparity in environmental efficiency;
The inter-regional Theil index:
T b = k = 1 m n k n ( y ¯ k y ¯ ) ln ( y ¯ k y ¯ )
representing the inter-regional disparity in environmental efficiency;
(4) The Theil index has additive decomposition characteristics, i.e., the overall regional disparity is equal to the intra-regional disparity plus the inter-regional difference. In the above formula, y represents environmental efficiency, n represents the total number of provinces in the study sample, y i k is the environmental efficiency within region k, and n k is the total number of provinces within region k. In this paper, we further define the intra-regional and inter-regional contribution rates, where the ratio of intra-regional to overall Theil index is the intra-regional contribution rate; the ratio of inter-regional to the overall Theil index is the inter-regional contribution rate.

3.1.3. The Kernel Density Function

The major difference between nonparametric and parametric estimation methods is that the former does not require prior determination of a specific model, thus avoiding sensitivity to the set model. The kernel density function, as one of the nonparametric estimation methods, can effectively examine the evolutionary trend of sample distribution dynamics. Therefore, it is widely used in sociology, economics, and geography, and has become a very popular nonparametric estimation method. In this paper, the kernel density function is used to estimate the distribution dynamics of the environmental efficiency of wheat cultivation in China, and the location, shape and extension of the distribution of environmental efficiency of wheat cultivation are obtained from the graph of kernel density estimation results.

3.2. Data Sources and Indicator Selection

According to the requirements of the SBM-undesirable model, this paper is based on 14 provinces in China, using the China Statistical Yearbook, the National Compilation of Cost-Benefit Information on Agricultural Products, the First National Pollution Source Census—Handbook Coefficient Manual on Fertilizer Loss Coefficients of Agricultural Pollution Sources, 2014–2018, the China Environmental Statistics Yearbook, and some indicators were derived from inter-statistical accounting.
The prerequisite for efficiency evaluation of a group of decision units using data envelopment analysis is the establishment of a reasonable system of evaluation indicators. The following issues need to be noted in the selection of indicators: (1) the covariance (high correlation) between evaluation indicators not having an impact on the stability and reliability of the model is an important feature of DEA model; (2) the selected evaluation indicators must be such that the “input indicators can produce output indicators, output indicators are produced from the input indicators”, that is, they must be able to truly reflect the production process, and try to avoid arbitrariness and subjectivity; (3) the appropriate number of indicators must be chosen based on the thumb rule in DEA theory (the number of decision units should be at least twice the number of evaluation indicators); (4) the selected indicators should lead to easily obtainable data because DEA is an efficiency evaluation method based on data.
The commonly used methods of index selection are the empirical judgment method, the principal component analysis method, the factor analysis method, etc. Since principal component analysis and factor analysis method, etc. extract principal components and factor variables, they can only improve the principal components and factors at the end, which is not consistent with the ultimate purpose of efficiency evaluation, being to improve the original input and output indicators, and is not conducive to managers identifying problems and finding ways to improve the efficiency of decision-making units. Therefore, based on the relevant studies of environmental efficiency evaluation, this paper selects the empirical judgment method as the basis of index selection. Referring to the input and output indicators of existing studies (as in Table 1) and those of this study, the indicators of this study are selected as follows.
The environmental efficiency indicators selected in this paper include factor inputs, desired outputs, and non-desired outputs. The input indicators include: labor input, raw material input, machinery input, and fertilizer input. The desired output indicator is the total output value of wheat based on 2013 years of constant prices; the non-desired output indicator is the surface source pollution from wheat cultivation. (1) Input indicators. The raw material input is the input of wheat seed cost, the labor input index is expressed in terms of the sum of the number of workers, which refers to days of labor and the number of days of direct labor of operators (including their family members) and hired workers in the per unit household used for the wheat production process, including the machinery. Input is expressed in terms of the wheat farm machinery power cost; the fertilizer input is expressed in terms of the year, mainly including nitrogen, phosphorus, potash, and compound fertilizer. Agricultural machinery and machinery costs, drawing on the study of the fertilizer application cost in the wheat cultivation process. Yang Fuxia et al. (2018) [15] report that production expenditures such as machinery operation costs, animal power costs, and drainage and irrigation costs are classified as agricultural machinery and machinery costs. (2) Expected output. In order to avoid the influence of price and considering the availability of data, the desired output is chosen as the total output value of wheat at constant price in 2013. (3) Non-desired output. Among them, the surface source pollution consists of total phosphorus and total nitrogen emissions from wheat cultivation, which is determined by using inventory analysis; chemical fertilizers, pesticides and agricultural plastic films in the wheat production process are the basic sources of pollution generated, and the main polluting elements are total nitrogen, and total phosphorus and mulch residues. The calculation method is as follows.
C ji = i = 1 3 N R × K ji E = SY i ρ ij LC ij
where E represents the amount of surface source pollution from wheat cultivation, SU i is the pollutant generation base of the pollution unit—because most of the nitrogen and phosphorus emissions during wheat cultivation originate from chemical fertilizer, so the index mainly refers to the discounted pure of chemical fertilizer use. ρ ij is the product intensity coefficient of unit i pollutant j; SU i ρ ij is the amount of wheat surface source pollutant generation of pollution unit i, that is, without SU i ρ ij being the maximum potential wheat surface pollutant generation during wheat cultivation without considering the factors of comprehensive resource utilization and management. LC ij is the emission coefficient of pollutant j per unit i. For the determination of ρ ij and LC ij coefficients, we mainly refer to Lai, S. Yun (2004) [16] and the Handbook of Coefficients for Fertilizer Loss Coefficients of Agricultural Pollution Sources.
The measurement of carbon emissions mainly refers to the calculation method of Zhu, Ning (2018) [17], which is obtained by multiplying the discounted amounts of nitrogen and phosphorus fertilizers with their carbon emission factors.

4. Spatial Variation Analysis of Environmental Efficiency of Wheat Cultivation

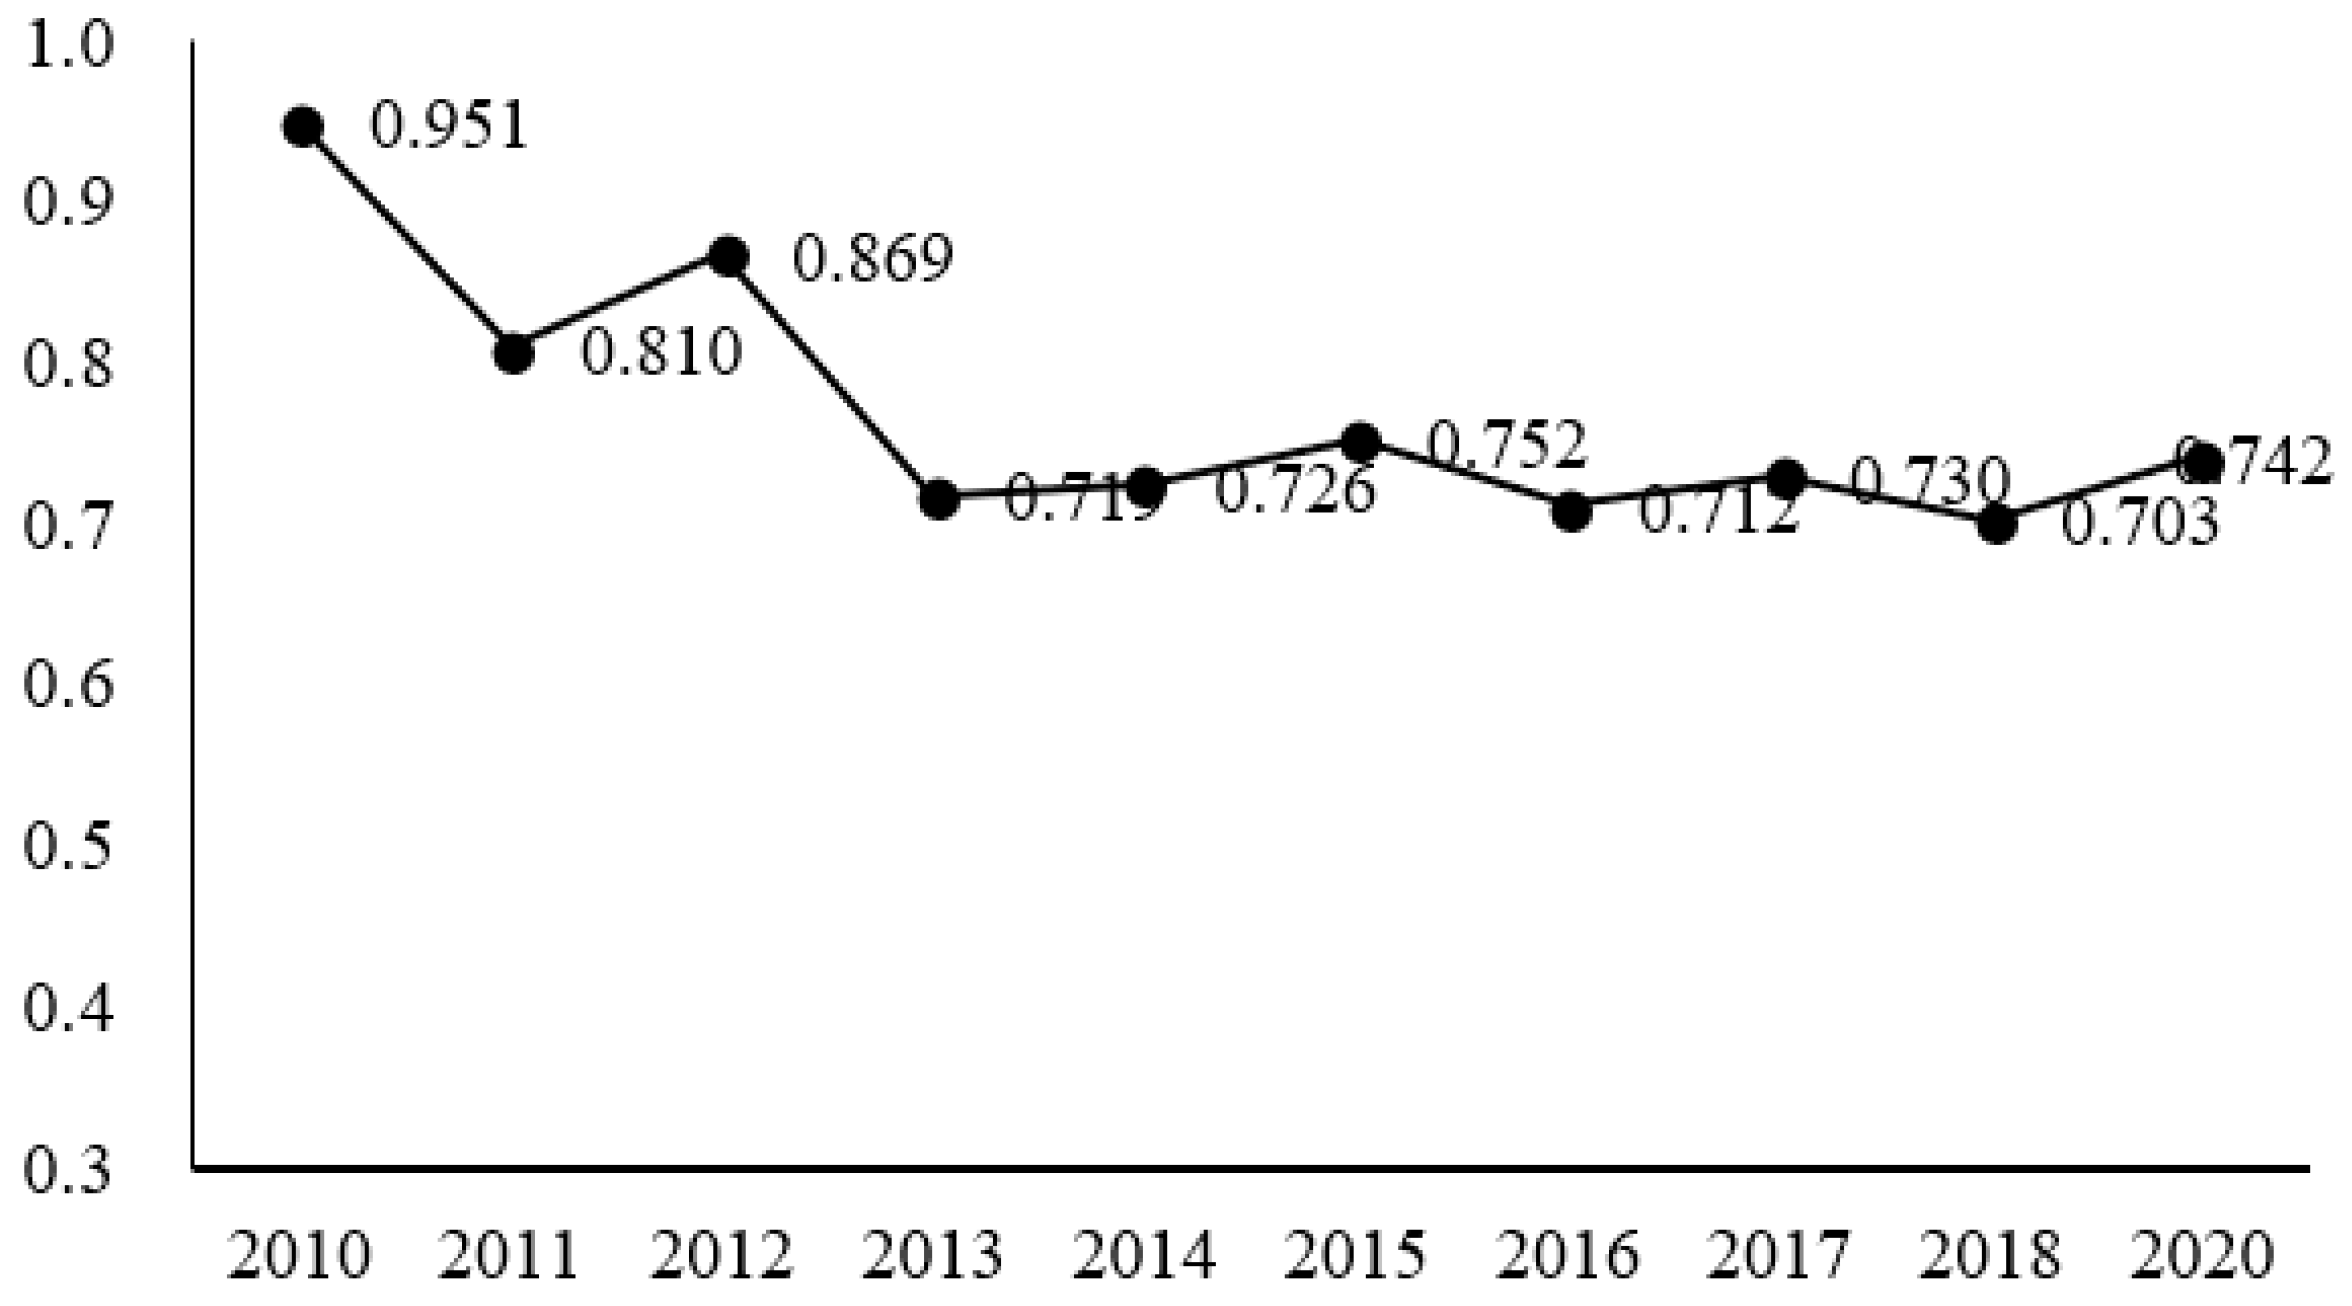
4.1. Descriptive Statistics of Spatial Variation in Environmental Efficiency of Wheat Cultivation

In this paper, the environmental efficiency measurement results of wheat cultivation in 14 provinces of China from 2014–2018 were selected (see Table 2). According to the measurement results, the average environmental efficiency value of wheat planting in each province from 2014 to 2018 is 0.8039. Only within the range of data for the years obtained from the measurement, Anhui, Hebei, Shandong, Inner Mongolia, Ningxia, and Xinjiang are above the national average, indicating that these regions are faring better at controlling crop pollution, planting at the forefront of production, environmental management and planting efficiency. The provinces that are all below the average level are Shanxi, Shaanxi, and Gansu; there is more room for improvement in the environmental efficiency of wheat cultivation in these provinces. In addition, the provinces at 0.7–0.9 show that the overall environmental efficiency of wheat cultivation in China is at a high level.
Horizontally, as can be seen from Figure 1, from 2010 to 2020, the annual average value of environmental efficiency of wheat planting in each province showed a trend of fluctuation and then a gradual decline. 2010 is the starting point of the research period, and it is also the highest point of the annual average value of wheat planting environmental efficiency, which is 0.247 different from the lowest point of 0.703 in 2018. The turning point in the environmental efficiency of wheat planting occurred in 2013. Before 2013 (excluding 2013), the average annual efficiency was always above 0.800, while in the years after 2013, the average environmental efficiency did not exceed 0.760. At the same time, the environmental efficiency of wheat planting decreased from 0.869 in 2012 to 0.719, with a range of 17.28%.

4.2. The Extent and Sources of Spatial Variation in the Environmental Efficiency of Wheat Cultivation

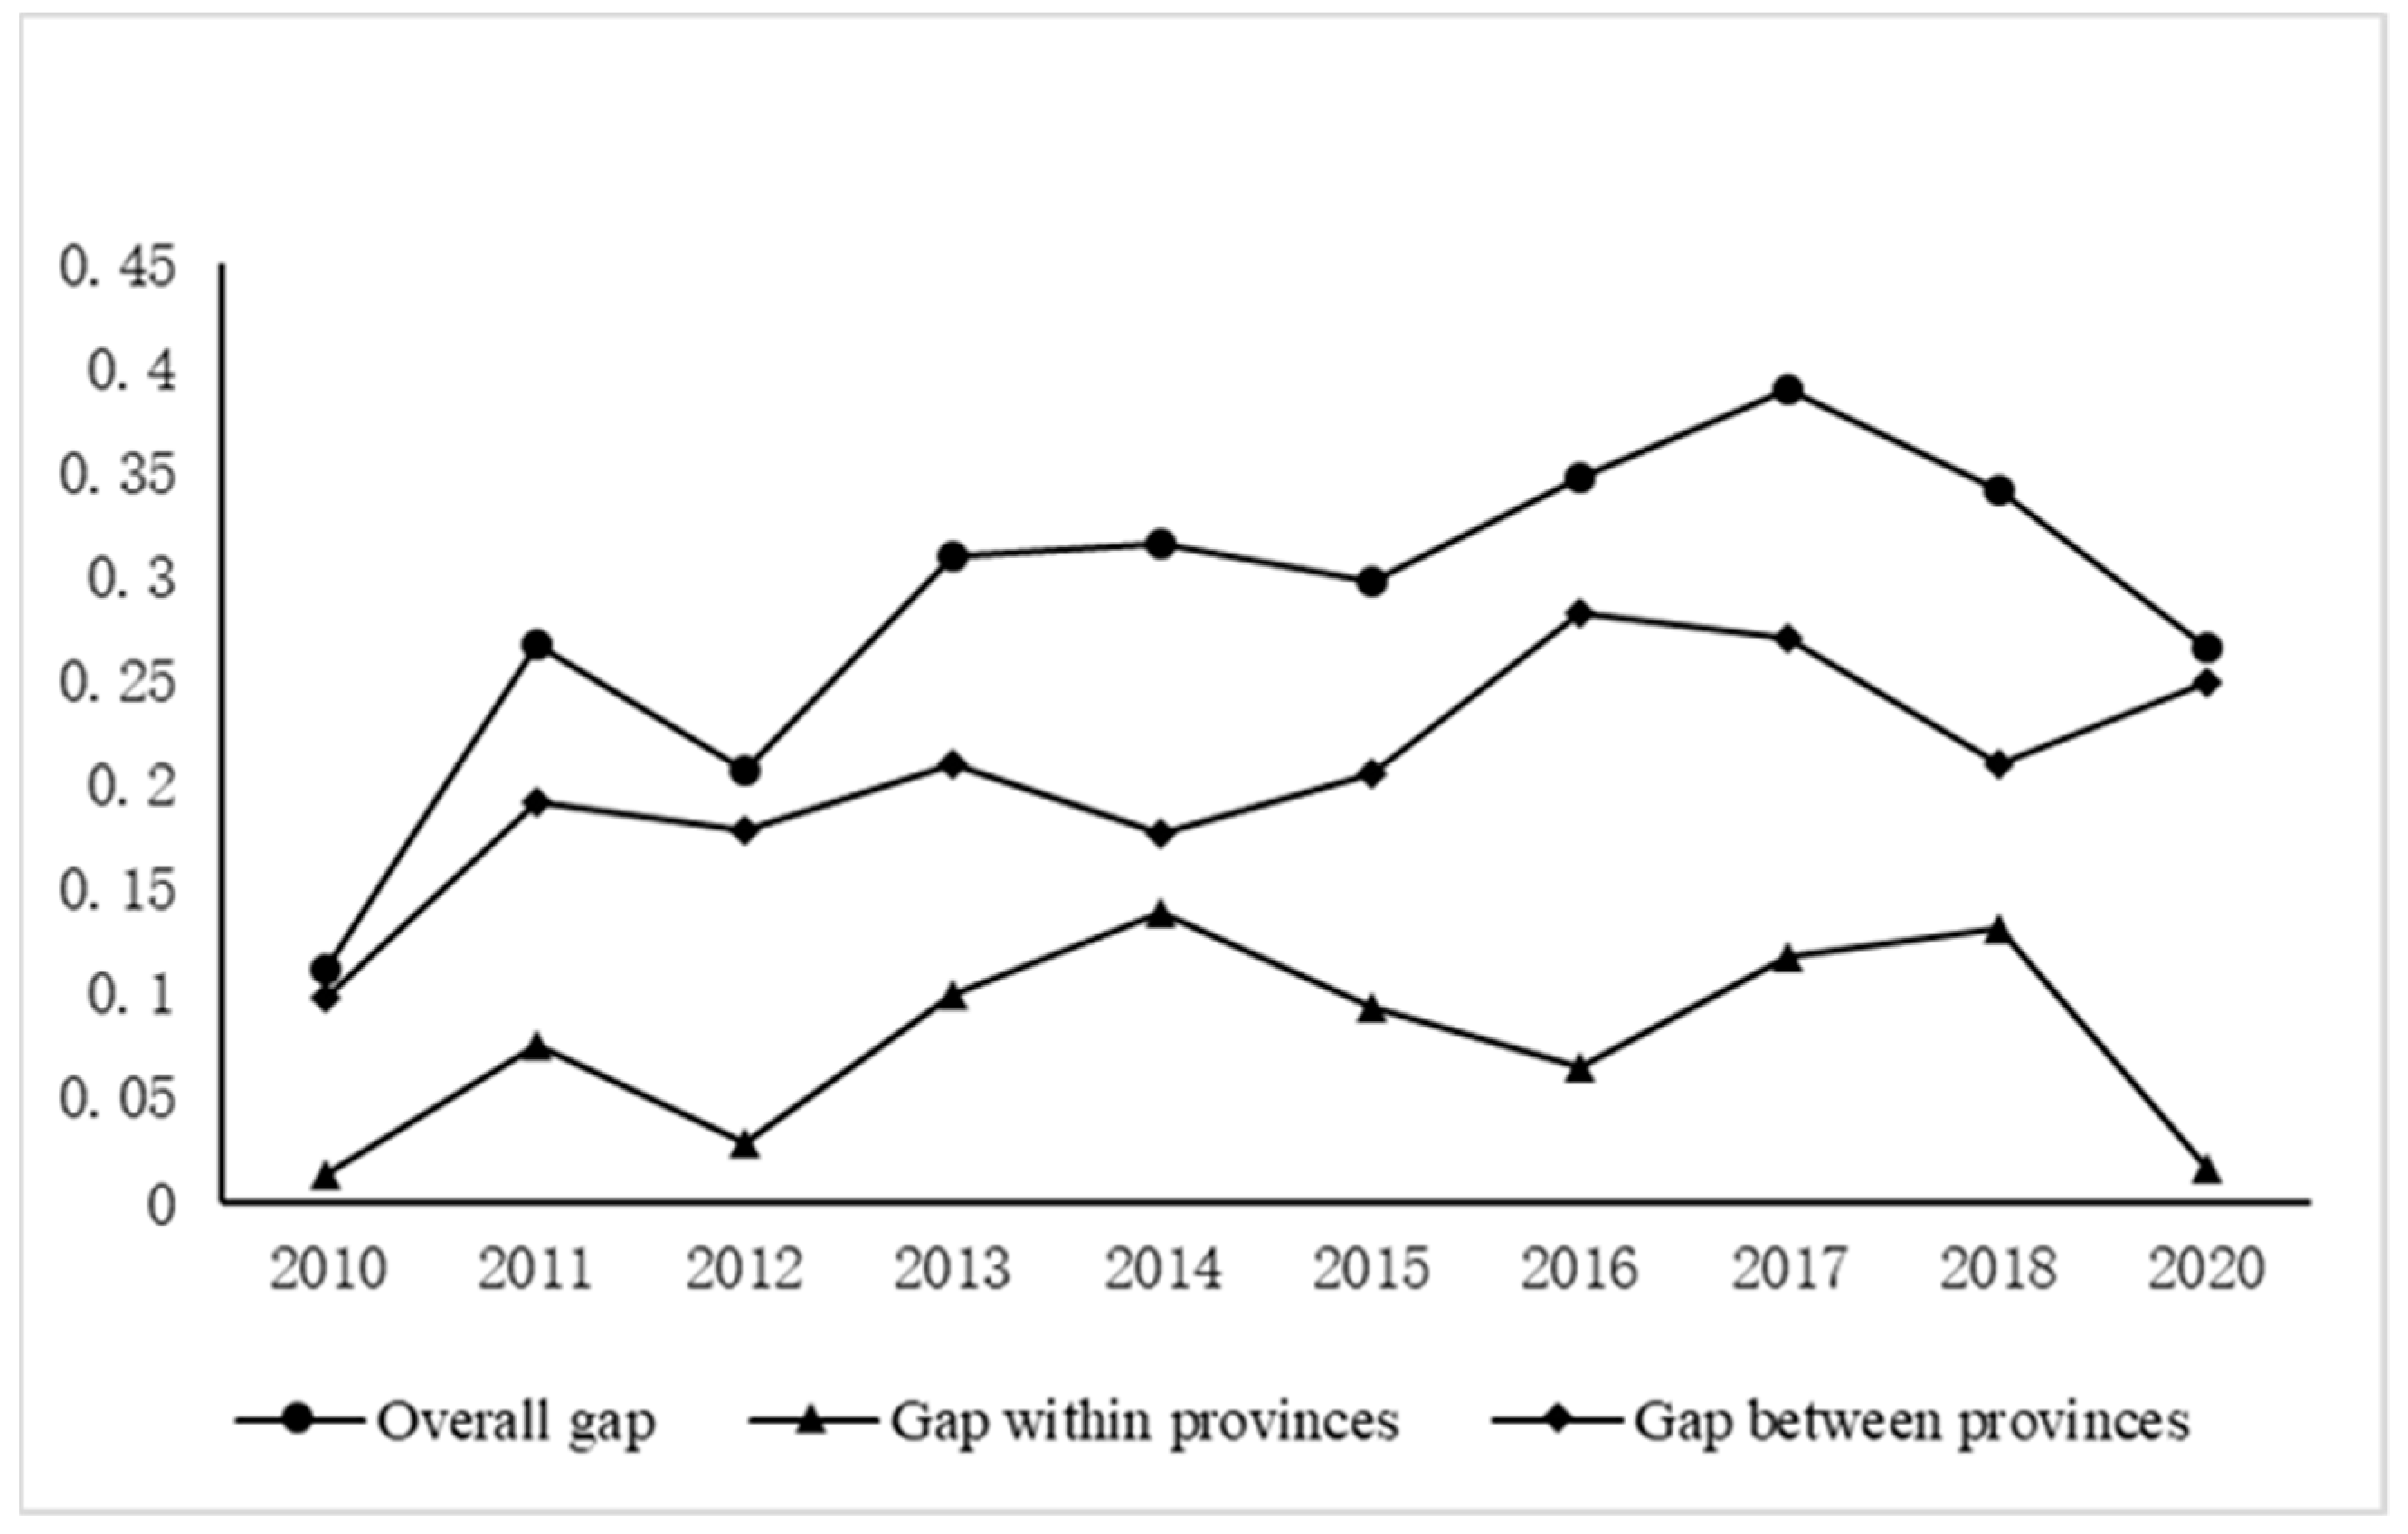
4.2.1. Decomposition of Spatial Differences in Environmental Efficiency of Wheat Planting: Based on Inter-Provincial Perspective

This paper decomposes the Theil index according to the administrative boundaries of each province in China and analyzes the unevenness of the environmental efficiency of wheat cultivation in China from an inter-provincial perspective. It can be seen from Figure 2 that inter-regional disparity becomes the main source of the overall regional disparity in China, and the unevenness of the environmental efficiency of wheat cultivation among provinces constitutes the main source of the overall regional disparity in China, while the contribution of environmental efficiency differences within provinces is relatively small. The trend of temporal evolution shows relatively smooth changes in the contribution of intra-regional disparities and inter-regional disparities. The overall spatial variation in environmental efficiency of wheat cultivation has increased and decreased during 2014–2018, with an increasing trend from 2014 and a decreasing trend from 2016–2018. The degree of variation in the wheat planting environmental efficiency of wheat cultivation ranged from 0.016–0.027, with the largest variation in 2016 and the smallest value occurring in 2018. On the provincial level, the overall regional disparity in China declined while the relative contribution of each decomposition remained roughly constant, reflecting the relative stability of the development gap in environmental efficiency of wheat cultivation in China on the provincial level.
From the time evolution trend, the change in the contribution rate of the inter-provincial gap and the inter-provincial gap is relatively stable. From 2010 to 2020 (see Table 3), the inter-provincial spatial difference in environmental efficiency of wheat planting increased and decreased. In 2010–2012, it first increased and then decreased, and in 2012–2017, it slowly increased. The difference degree of wheat planting environmental efficiency is 0.111–0.266, with the biggest difference in 2017 and the smallest value in 2010. From the provincial level, while the overall regional disparity in China is declining, the relative contribution of each decomposition item remains roughly unchanged, which reflects that the development gap of environmental efficiency of wheat planting in China is relatively stable at the provincial level.

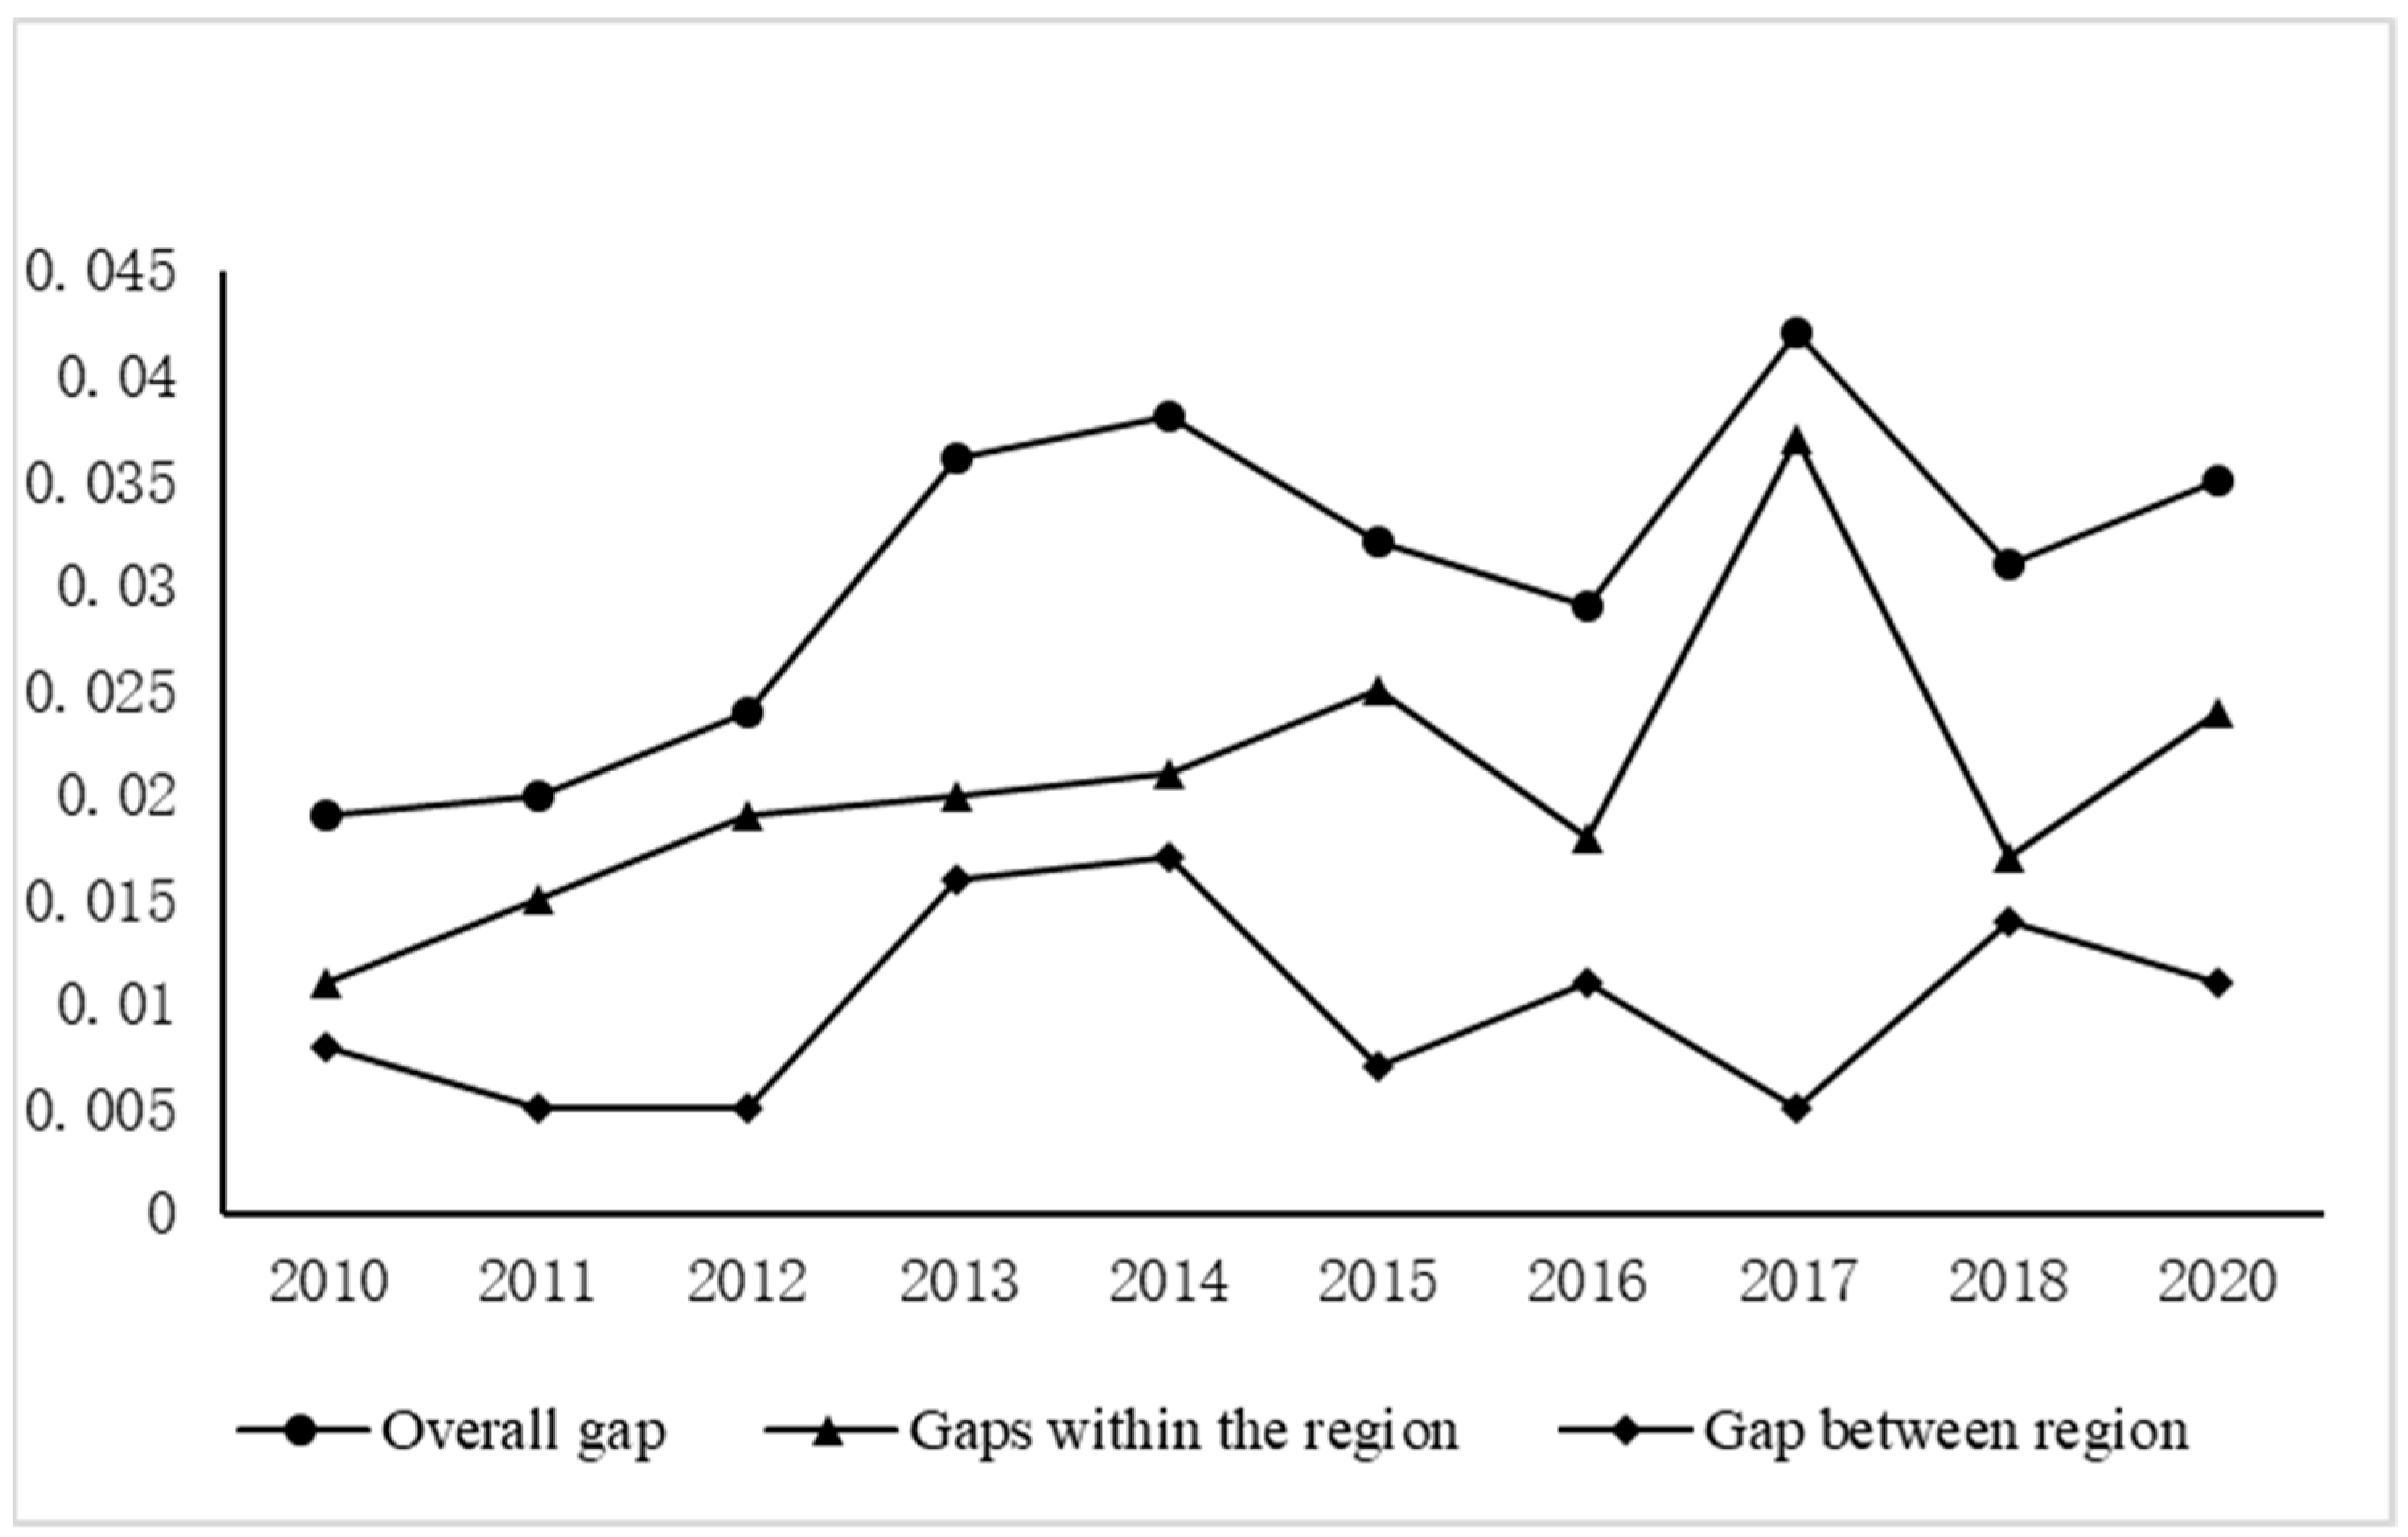
4.2.2. Decomposition of Spatial Gap in Environmental Efficiency of Wheat Planting in China: Based on a Regional Perspective

In this paper, the Theil index was decomposed according to the spatial scale of the four major regions of wheat cultivation-growing areas (see Table 4) using the Theil index decomposition method. Table 5 shows that the contribution of intra-regional disparity to the overall Theil index remained at 55–74% from 2014 to 2018, and the overall regional disparity in the environmental efficiency of wheat cultivation in China mainly comes from intra-regional non-equilibrium characteristics based on the regional perspective. Figure 3 shows that the non-equilibrium of wheat growing environmental efficiency in the southwest wheat region contributes the most to the overall regional disparity, followed by the Yellow and Huaihai wheat regions, and the intra-regional variation in the northwest region contributes the least to the overall regional disparity. The degree of contribution of variation in the middle and lower Yangtze River wheat region tends to rise after 2016, indicating an increase in spatial variation in the environmental efficiency of wheat cultivation in the region.

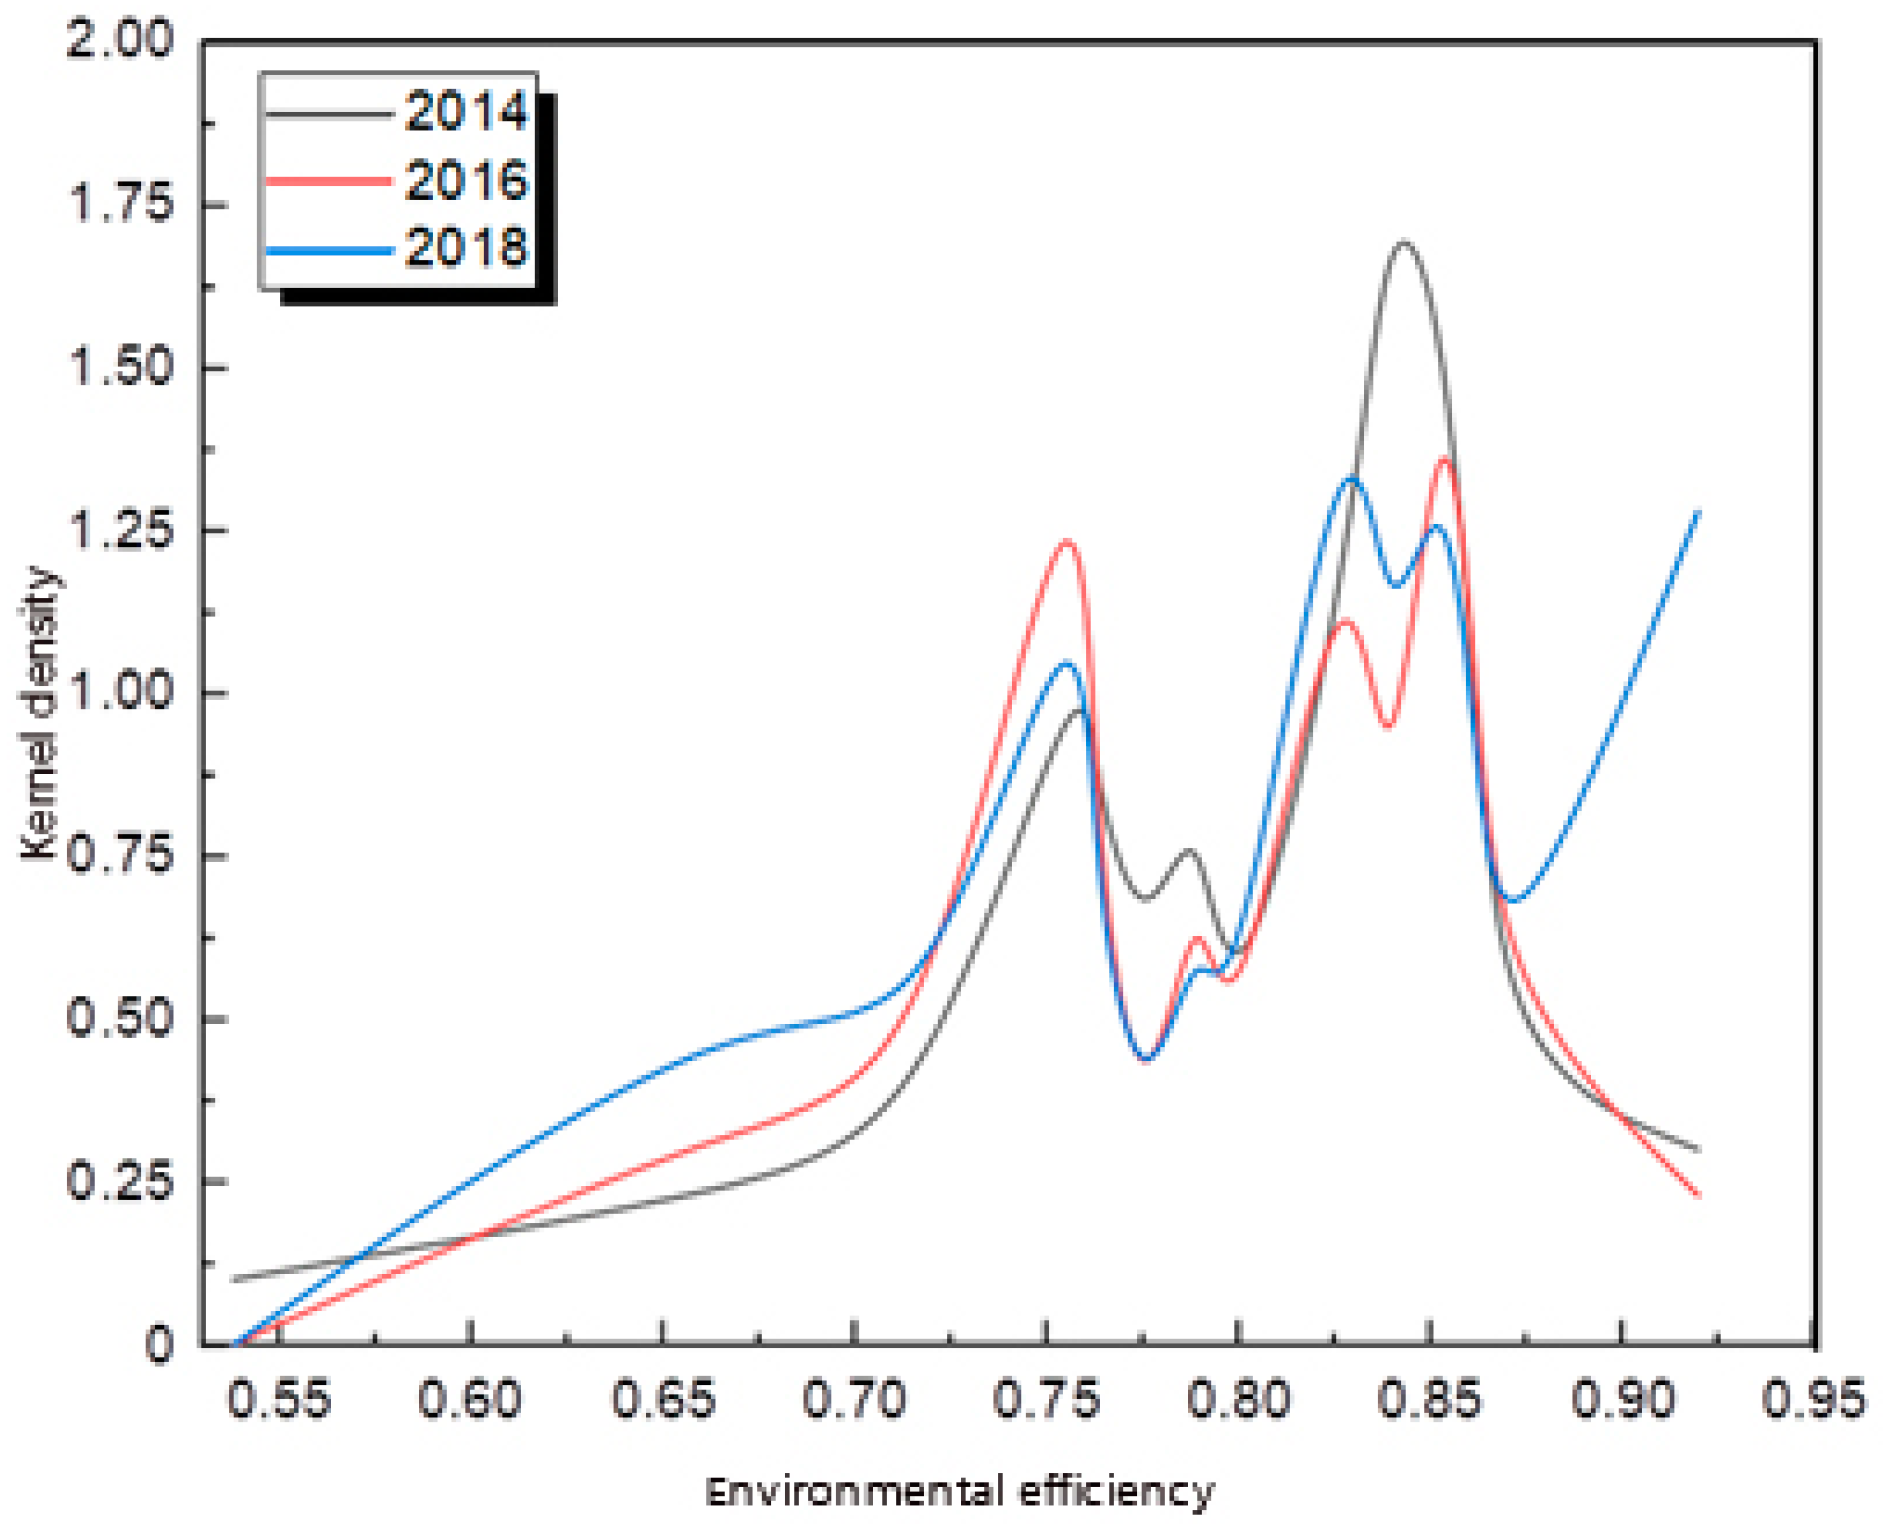
5. Analysis of the Dynamic Evolution of the Environmental Efficiency of Wheat Breeding

The results of the Theil index measure reflect the magnitude and sources of relative differences in the environmental efficiency of wheat cultivation. To more intuitively describe the dynamic evolution of the distribution of environmental efficiency of wheat cultivation in China, this paper uses the kernel density and MI index to analyze the density distribution pattern of fertilizer efficiency, and the relative interaction effects of each region within.

Dynamic Evolution of the Environmental Efficiency Distribution of Wheat Planting Based on Kernel Density Estimation

In this paper, we use the kernel density estimation method to portray the dynamics of the absolute difference distribution of the whole country and sub-provinces in the examined period based on wheat growing environmental efficiency data. Figure 4 shows that in 2014, the environmental efficiency of wheat cultivation in China showed a single-peaked distribution with a relatively steep kernel density function, reflecting that the environmental efficiency of wheat cultivation in most Chinese provinces was relatively similar. In 2016, the extreme value of the kernel density function decreased slightly. In 2018, the kernel density function showed a typical bimodal distribution, and there was a significant polarization of the environmental efficiency of wheat cultivation in China. Relative to 2014, the center of the distribution function shifted significantly to the right in 2016, indicating that the level of environmental efficiency of wheat cultivation in most cities increased significantly during this period. The spatial distribution of environmental efficiency of wheat cultivation in China from the inter-provincial perspective is shown in Figure 5. From Figure 6, it can be seen that the kernel density function curve of environmental efficiency of wheat cultivation in China by province, from 2014 to 2018, is relatively steep, and the environmental efficiency levels in most provinces are very similar, while the peak in the right tail indicates that the environmental efficiency of wheat cultivation in some provinces is relatively high. In 2018, the kernel density function curve is flatter and the increase in the thickness of the right trailing part is not significant, indicating that the interregional differences in the environmental efficiency of wheat cultivation in China have increased, but there is no significant polarization in the environmental efficiency of wheat cultivation in each province.
In the distribution position, the center point of the kernel density function of wheat planting environmental efficiency in the northern winter wheat region showed a trend of a left shift after 2013, with a large movement range, indicating that the environmental efficiency of wheat planting in this region decreased year by year after 2013. The center point of the kernel density function in the winter-sown area moved sharply to the left in 2012, and then became stable, indicating that the environmental efficiency of wheat planting in this wheat area decreased greatly after 2012, which should receive attention. For the whole area and the other two wheat regions, the moving trend is relatively stable, which means that the environmental efficiency of wheat planting is slowly improving.
Of the distribution pattern, those for the main peak width, northern winter wheat areas, and southern winter wheat areas have narrowed, indicating that the spatial differences of wheat planting environmental efficiency between China and the northern winter wheat areas has also narrowed, especially when comparing the main peak width and northern winter wheat areas, where significant decreases occurred after 2014. This indicates that the difference in wheat planting environmental efficiency between China and the northern winter wheat areas has been under control since 2014.
In terms of the number of distribution peaks, the peak of nuclear density in the whole country was in a multi-peak state until 2014, but the main peak density was high, and the multi-polarization trend was not obvious. After 2014, the double-peak state was maintained, the environmental efficiency of wheat planting in the side peak was between 0.4 and 0.6, and that in the main peak was close to 1. There is a main peak and a side peak; the value of the side peak is low, which indicates that the environmental planting efficiency of wheat in China has a certain gradient effect from 2010 to 2020, showing a polarization phenomenon. After 2014, the northern winter wheat region changed from double peaks to single peaks, and the environmental efficiency of wheat planting was concentrated between 0.4 and 0.6. During the study period, the peak kernel density in the spring wheat region and winter wheat region in South China was in a double peak state, which indicated that the environmental planting efficiency of wheat in these two regions had a certain gradient effect, but the lateral peak was low and the polarization was not obvious.
In this paper, we use the Moran index to analyze the interaction effect of environmental efficiency of wheat cultivation between different regions and determine whether the environmental efficiency of wheat cultivation in the surrounding areas affects the environmental efficiency of our own region. The results of the analysis are given in Figure 6. The mean value of the MI index is 0.179, and the p value was 0.009, which indicated that the influence of spatial factors on the environmental efficiency of wheat planting was obvious. With low environmental efficiency of wheat cultivation in the surrounding areas, it is more difficult for the low level areas to improve their own environmental efficiency of wheat cultivation, while being neighbors with the middle and high level areas will promote improvement in environmental efficiency.

6. Conclusions and Suggestions for Countermeasures

In this paper, the environmental efficiency of wheat cultivation in China and certain Chinese provinces was measured using a global reference non-expected output SBM model, based on which the Theil index measure and decomposition method were used to reveal the evolutionary trends of overall regional differences in China and their main sources, and the dynamic evolutionary characteristics of environmental efficiency were further examined using kernel density. The study concludes that (1) the environmental efficiency measures of wheat cultivation in each province show that Anhui, Hebei, Shandong, Inner Mongolia, and Xinjiang are faring relatively well in controlling crop pollution, cultivating environmental management, and cultivation efficiency, while the provinces of Shanxi, Shaanxi, and Gansu have much room for improvement. (2) During 2014–2018, the dynamic evolution of overall regional differences in China fluctuated to some extent, but the overall trend was decreasing; based on the regional perspective, the contribution of intra-regional differences to overall regional differences was decreasing, while the contributing main reasons of inter-regional disparities was increasing; based on the inter-provincial perspective, the contribution of inter-regional differences was greater than intra-regional differences. (3) From 2014 to 2018, the center of the kernel density function of environmental efficiency of wheat cultivation in China showed a right-shifting trend with evolutionary characteristics showing ‘broad-peak-spike-spike’, indicating that the overall environmental efficiency was continuously improving while the spatial differences showed a gradual decrease.
Based on the above findings, this paper argues that in improving the environmental efficiency of wheat cultivation, it is important to focus not only on the adequacy of environmental efficiency improvement in wheat cultivation, but also on its balance, in order to promote the coordinated development of cultivation regions. Specific recommendations follow. (1) More attention should be paid to environmental protection in wheat cultivation practices and the promotion of greening in wheat production methods and models, and especially identifying the provinces of key areas in Gansu, Shanxi, and Shaanxi, the key areas of concern for improving the environmental efficiency of wheat cultivation. (2) Attention should be paid to developmental differences in the process of improving the environmental efficiency of wheat cultivation in China, especially the inter-regional differences. Differentiated measures should be taken to improve the environmental efficiency of wheat cultivation in low-level provinces, to reduce the overall spatial differences, taking into account the level of agricultural development, workers, soil type and cultivation layout of each province. (3) The overall planning of each region should be further improved regarding the environmental efficiency of planting, relying on the spatial interaction between regions to give full play to the radiation and driving effect of areas with high environmental efficiency of wheat planting, and promoting the improvement of the environmental efficiency of wheat planting in low-level provinces.

Author Contributions

Conceptualization, Z.X.; methodology, Z.X.; software, Z.X.; validation, Z.X.; formal analysis, Z.X.; investigation, Z.X.; resources, Z.X.; data curation, Z.X.; writing—original draft preparation, Z.X.; writing—review and editing, Y.Y.; visualization, Y.L.; supervision, Y.Y.; project administration, Y.Y.; funding acquisition, Y.Y. All authors have read and agreed to the published version of the manuscript.

Funding

This study was funded by the Annual Project Grant from Longyuan Institute of Construction Finance in Ningbo University (Grant number: LYZDA2002). The project title was “Research on the impact of the development of Internet finance on the development 470 of the construction industry”.

Institutional Review Board Statement

Not applicable.

Informed Consent Statement

Not applicable.

Data Availability Statement

Not applicable.

Conflicts of Interest

The authors declare no conflict of interest.

References

  1. Cai, R. The input status of agricultural chemicals and its impact on the environment. China Popul. Resour. Environ. 2010, 20, 107–110. [Google Scholar]
  2. Wei, Q.; Zhang, B.; Jin, S. Construction and regional comparison of Green agricultural development index in China. Probl. Agric. Econ. 2018, 11, 11–20. [Google Scholar]
  3. Lv, N.; Zhu, L. A study on agro-environmental technical efficiency and green total factor productivity growth in China. Agric. Technol. Econ. 2019, 4, 95–103. [Google Scholar]
  4. Hailu, A.; Veeman, T.S. Non-parametric Productivity Analysis with Undesirable Outputs: An Application to the Canadian Pulp and Paper Industry. Am. J. Agric. Econ. 2001, 83, 605–616. [Google Scholar] [CrossRef]
  5. Liu, Y.; Li, Z.; Li, J. A comparative study of environmental efficiency evaluation methods. Pract. Underst. Math. 2010, 40, 84–92. [Google Scholar]
  6. Färe, R.; Grosskopf, S.; Pasurka, C.A. Pollution abatement activities and traditional productivity. Ecol. Econ. 2006, 62, 673–682. [Google Scholar] [CrossRef]
  7. Seiford, L.M.; Zhu, J. Modeling undesirable factors in efficiency evaluation. Eur. J. Oper. Res. 2002, 142, 16–20. [Google Scholar] [CrossRef]
  8. Tone, K. A slacks-based measure of super-efficiency in data envelopment analysis. Eur. J. Oper. Res. 2002, 143, 32–41. [Google Scholar] [CrossRef] [Green Version]
  9. Pan, D.; Ying, R. Methodology and empirical evidence for evaluating agricultural eco-efficiency in China—An analysis of SBM model based on non-expected output. J. Ecol. 2013, 33, 3837–3845. [Google Scholar]
  10. Du, J.; Wang, R.; Wang, X. Environmental total factor productivity and agricultural growth: A two-stage analysis based on DEA-GML index and panel Tobit model. China Rural. Econ. 2016, 3, 65–81. [Google Scholar]
  11. Li, C.; Cao, Y. Analysis of environmental efficiency measurement of dairy farming in China. Agric. Econ. Issues 2017, 38, 80–88, 111–112. [Google Scholar]
  12. Ge, P.; Wang, S.; Huang, X. Calculation of Green total factor productivity of China’s agriculture. Popul. Resour. Environ. China 2018, 28, 66–74. [Google Scholar]
  13. Liu, H.; Sun, S.; Li, C. Spatial differences in fertilizer use efficiency and dynamic evolution of distribution in China under environmental constraints. Agric. Econ. Issues 2019, 8, 65–75. [Google Scholar]
  14. Meng, X.; Zhou, H.; Du, L.; Shen, G. Technical efficiency of agricultural environment and green total factor productivity growth changes in China-a re-examination based on the perspective of combined farming and breeding. Agric. Econ. Issues 2019, 6, 9–22. [Google Scholar]
  15. Yang, F.; Xu, J.; Qing, P. Inducement of technological progress in Wheat production in China: Investment driven or price induced. Agrotech. Econ. 2018, 9, 100–111. [Google Scholar]
  16. Lai, S.; Du, P.; Chen, J. Non-point source pollution investigation and evaluation method based on unit analysis. J. Tsinghua Univ. (Nat. Sci.) 2004, 9, 1184–1187. [Google Scholar]
  17. Zhu, N.; Cao, B.; Qin, F. Wheat production efficiency based on fertilizer reduction potential and carbon reduction. Chin. Environ. Sci. 2018, 2, 784–791. [Google Scholar]
Figure 1. Distribution of average environmental efficiency.
Sustainability 14 05241 g001
Figure 2. Spatial differentiation of Theil index within and among regions: provincial perspective.
Sustainability 14 05241 g002
Figure 3. Spatial differentiation of the Theil index within and among regions.
Sustainability 14 05241 g003
Figure 4. Environmental efficiency of wheat cultivation in China from 2014 to 2018.
Sustainability 14 05241 g004
Figure 5. (a) Dynamic evolution of the distribution of overall environmental efficiency; (b) dynamic evolution of the winter wheat distribution in northern China; (c) dynamic evolution of the spring wheat distribution; (d) dynamic evolution of wheat distribution in winter and spring; (e) dynamic evolution of winter wheat distribution in southern China.
Sustainability 14 05241 g005
Figure 6. Environmental efficiency spatial interaction effects.
Sustainability 14 05241 g006
Table 1. Domestic studies on environmental efficiency of Chinese agriculture in recent years.
Time Period Research MethodologyInput VariablesDesired Output VariablesNon-Desired Output VariablesLiterature Sources
1991–2003DEA-GMLNumber of employees in planting industry, total area of crops sown, total power of planting industry machinery, fertilizer application, year-end stock of draft animals, effective irrigation area.Total output value of plantation industryTN, TP, COD, pesticide residues, agricultural film residuesDu Jiang et al. (2016) [10]
1998–2009Directional distance function, ML indexNumber of employees in agriculture, forestry, animal husbandry and fishery, crop sowing area and aquaculture area, fertilizer use, total power of agricultural machinery, year-end stock drought animals, total amount of agricultural water use.Total output value of agriculture, forestry, animal husbandry, and fisheryStandard emissions of COD, nitrogen, phosphorus, etc. Pan Dan et al. (2013) [6]
2001–2015SBM directional distance function, ML indexNumber of employees in the plantation industry, total power of plantation machinery, total area of crops sown, chemical fertilizers, pesticides, agricultural films, total agricultural water consumption and agriculture.Value added of plantation industryCarbon emissions from farmingGe Pengfei et al. (2018) [12]
2001–2015Non-desired output SBM model with global covarianceLabor input, agricultural machinery and machine power, crop sowing, sown area, fertilizer of crops, application, agricultural film use, pesticide use, total agricultural energy consumption and total agricultural water consumption.Total agricultural output Agricultural carbon emissions and agricultural surface pollution. Liu Huajun et al. (2019) [13]
2004–2014SBM-Undesirable ModelQuantity of concentrate feed, green and roughage costs, quantity of labor, fixed asset inputProduction of main products, the by-product output,COD, TN, TP, Cu, ZnLi Cuixia et al. (2017) [11]
1998-By-product valueCOD, TN, TP, Cu, Zn, super-SBM ModelsNumber of agricultural workers, agricultural land area, livestock and poultry farming input costs, total agricultural machinery powerTotal agricultural outputNitrogen Surplus Intensity on Agri-cultural LandMeng, Xianghai et al. (2019) [14]
2011–2015SBM model, MLindexNumber of employees in primary industry, total sown area of crops, total power of agricultural machinery, fertilizer useTotal output value of agriculture, forestry, animal hus-bandry and fisheryCOD, TN, TPLuna et al. (2019) [3]
Table 2. Comparison of environmental efficiency of wheat cultivation by provinces, 2014–2018.
Year2010201120122013201420152016201720182020Average/Mean Value
Amur11111111111
Jiangsu11111111111
Inner Mongolia11111111111
Ningxia11111111111
Yunnan11111111111
Xinjiang1110.7350.7180.7280.7330.7700.7410.7420.817
Hubei10.7800.7560.6720.6670.6310.6290.5950.451one0.718
Gansu10.696one0.6920.6610.5890.5810.6660.6490.5690.710
Shaanxi10.7460.7510.6010.6030.6000.5980.6430.6270.6040.677
Sichuan10.649one0.5260.6140.6380.5590.5550.5600.5060.661
Anhui (Province)10.646one0.5280.5420.4530.4830.5600.5190.6610.639
Shanxi0.7410.8530.7710.6150.6170.5440.5560.5910.5530.5180.636
Hebei0.7430.6860.6680.5940.5950.5990.6220.6490.5520.5480.626
Henanone0.5790.5440.4170.432one0.4300.4530.4200.4880.576
Shandong0.7740.5200.5440.4030.4430.5000.4870.4710.4800.4960.512
average/mean value0.9510.8100.8690.7190.7260.7520.7120.7300.7030.742
Table 3. Decomposition of spatial differences of environmental efficiency of wheat planting from a regional perspective.
AgeOverall Provincial GapInter-Provincial DisparityInter-Provincial Gap
20100.1110.0130.098
20110.2670.0750.192
20120.2070.0290.178
20130.3090.0990.210
20140.3150.1390.176
20150.2980.0930.205
20160.3470.0650.282
20170.3890.1180.271
20180.3420.1320.210
20200.2660.0170.249
Table 4. Regional division of wheat cultivation.
RegionSouthwest Wheat AreaMiddle and Lower Yangtze River Wheat AreaYellow Huaihai Wheat AreaNorthwest Wheat Area
ProvinceXinjiang, Ningxia, Inner MongoliaSichuan, Hubei, Anhui, JiangsuHenan, Shandong, Hebei, ShaanxiYunnan, Gansu, Shanxi
Table 5. Decomposition of spatial differences in environmental efficiency of wheat cultivation from a regional perspective.
YearOverall Wheat Region GapIntra-Regional DisparitiesWheat Interval Gap
2014 0.0180.0100.008
2015 0.0230.0130.010
2016 0.0280.0220.006
20140.0380.0210.017
2017 0.0200.0130.007
2018 0.0190.0100.009
20170.0420.0370.005
20180.0310.0170.014
20200.0350.0240.011
Publisher’s Note: MDPI stays neutral with regard to jurisdictional claims in published maps and institutional affiliations.

