
Analysis of the Driving Force of Land Use Change Based on Geographic Detection and Simulation of Future Land Use Scenarios

Abstract
:1. Introduction
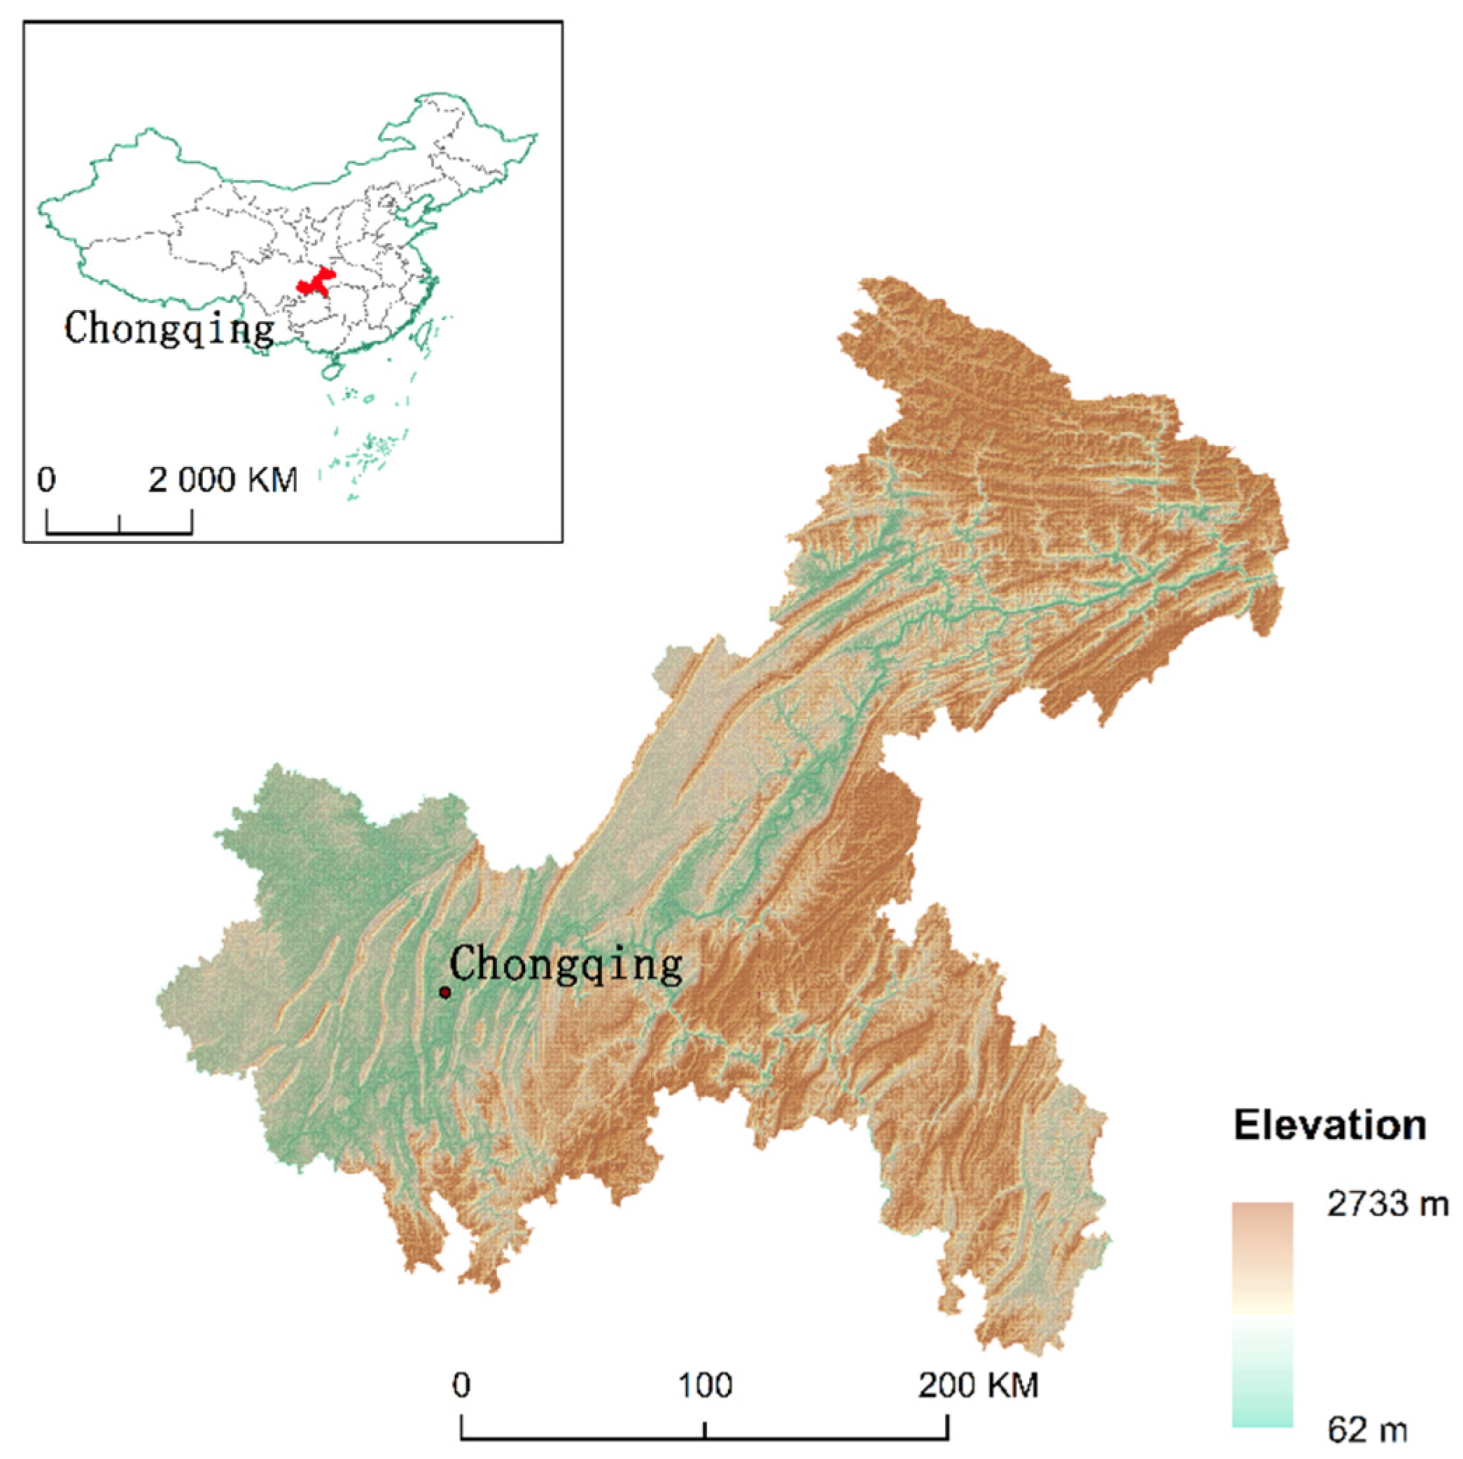
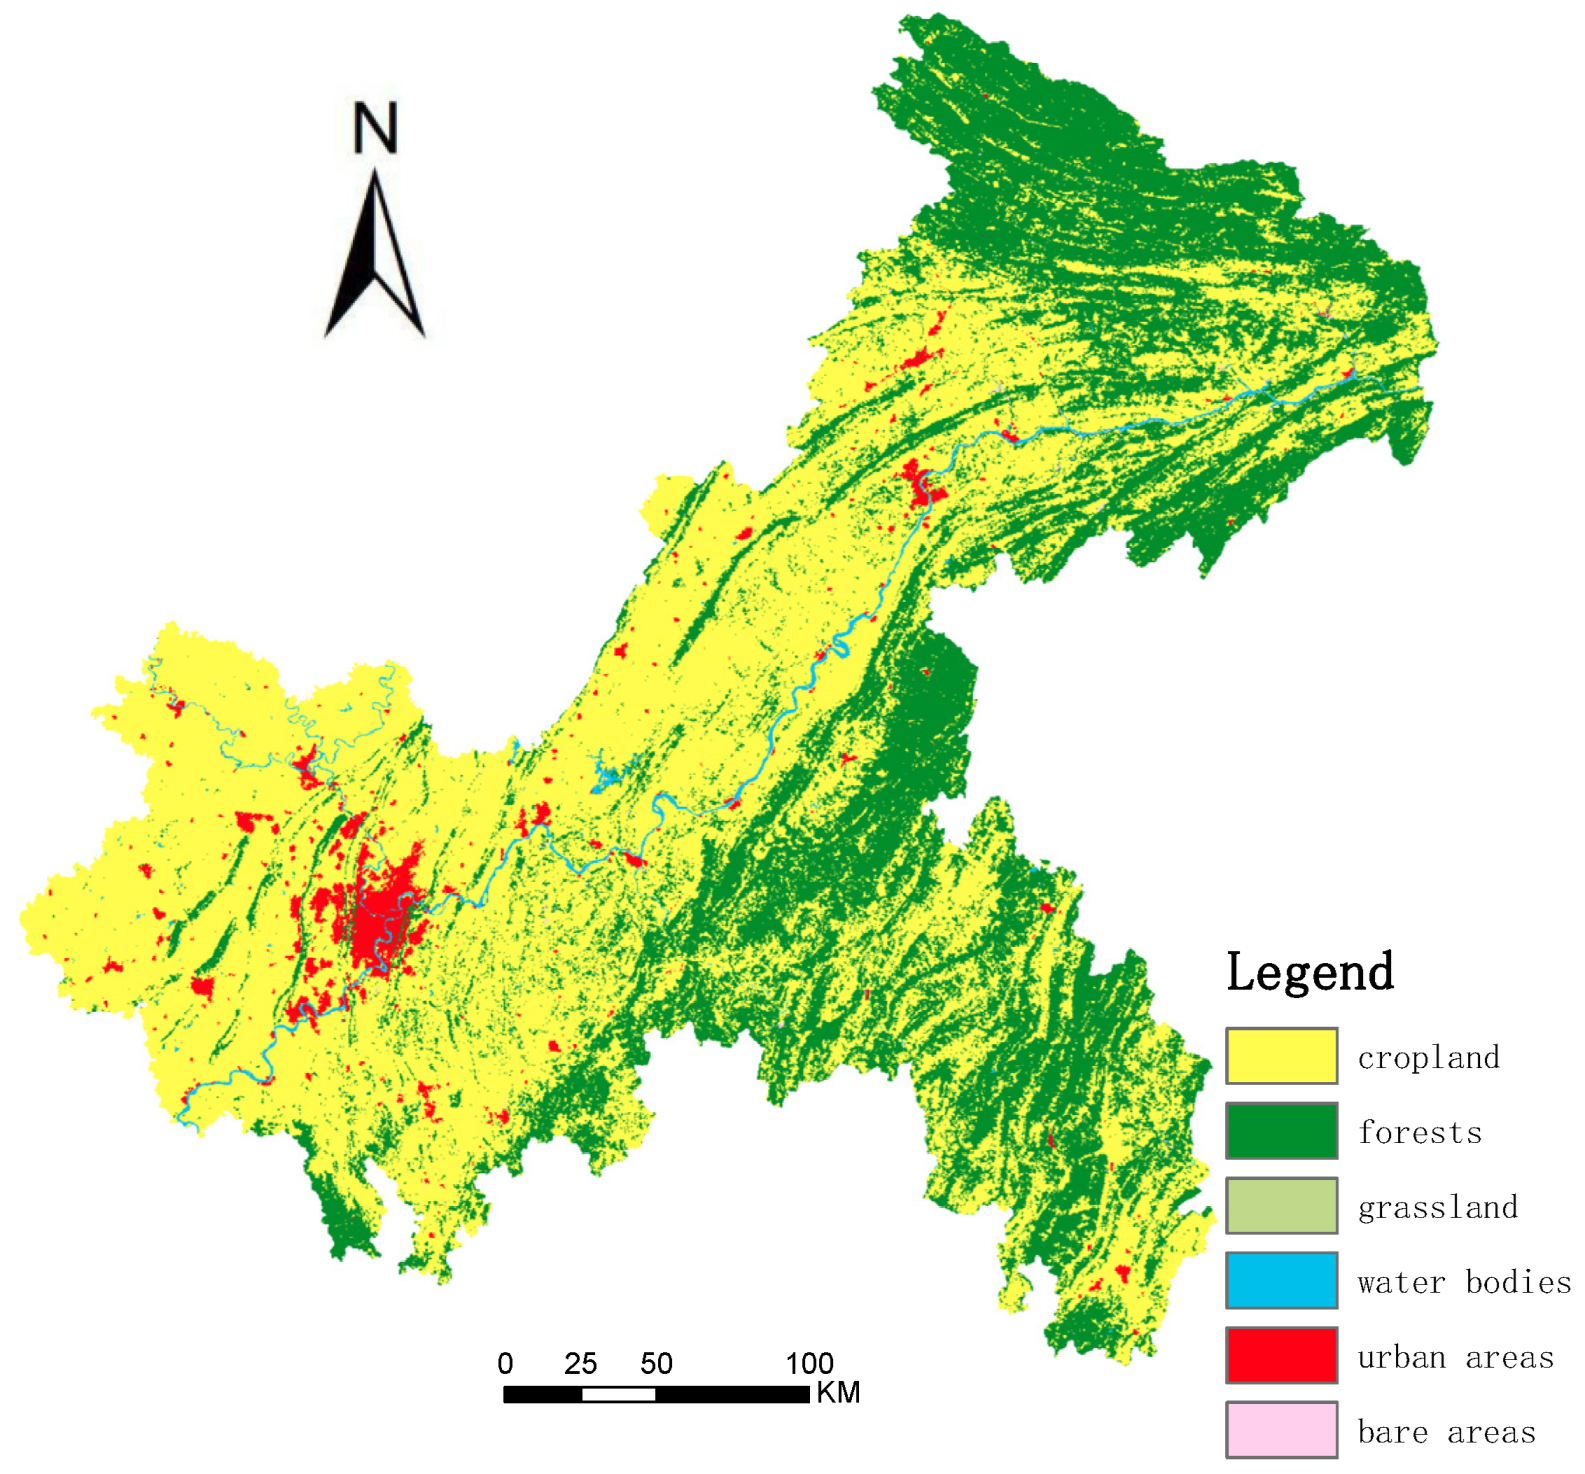
2. Study Area
3. Material and Methods
3.1. LULC Data
3.2. Methods
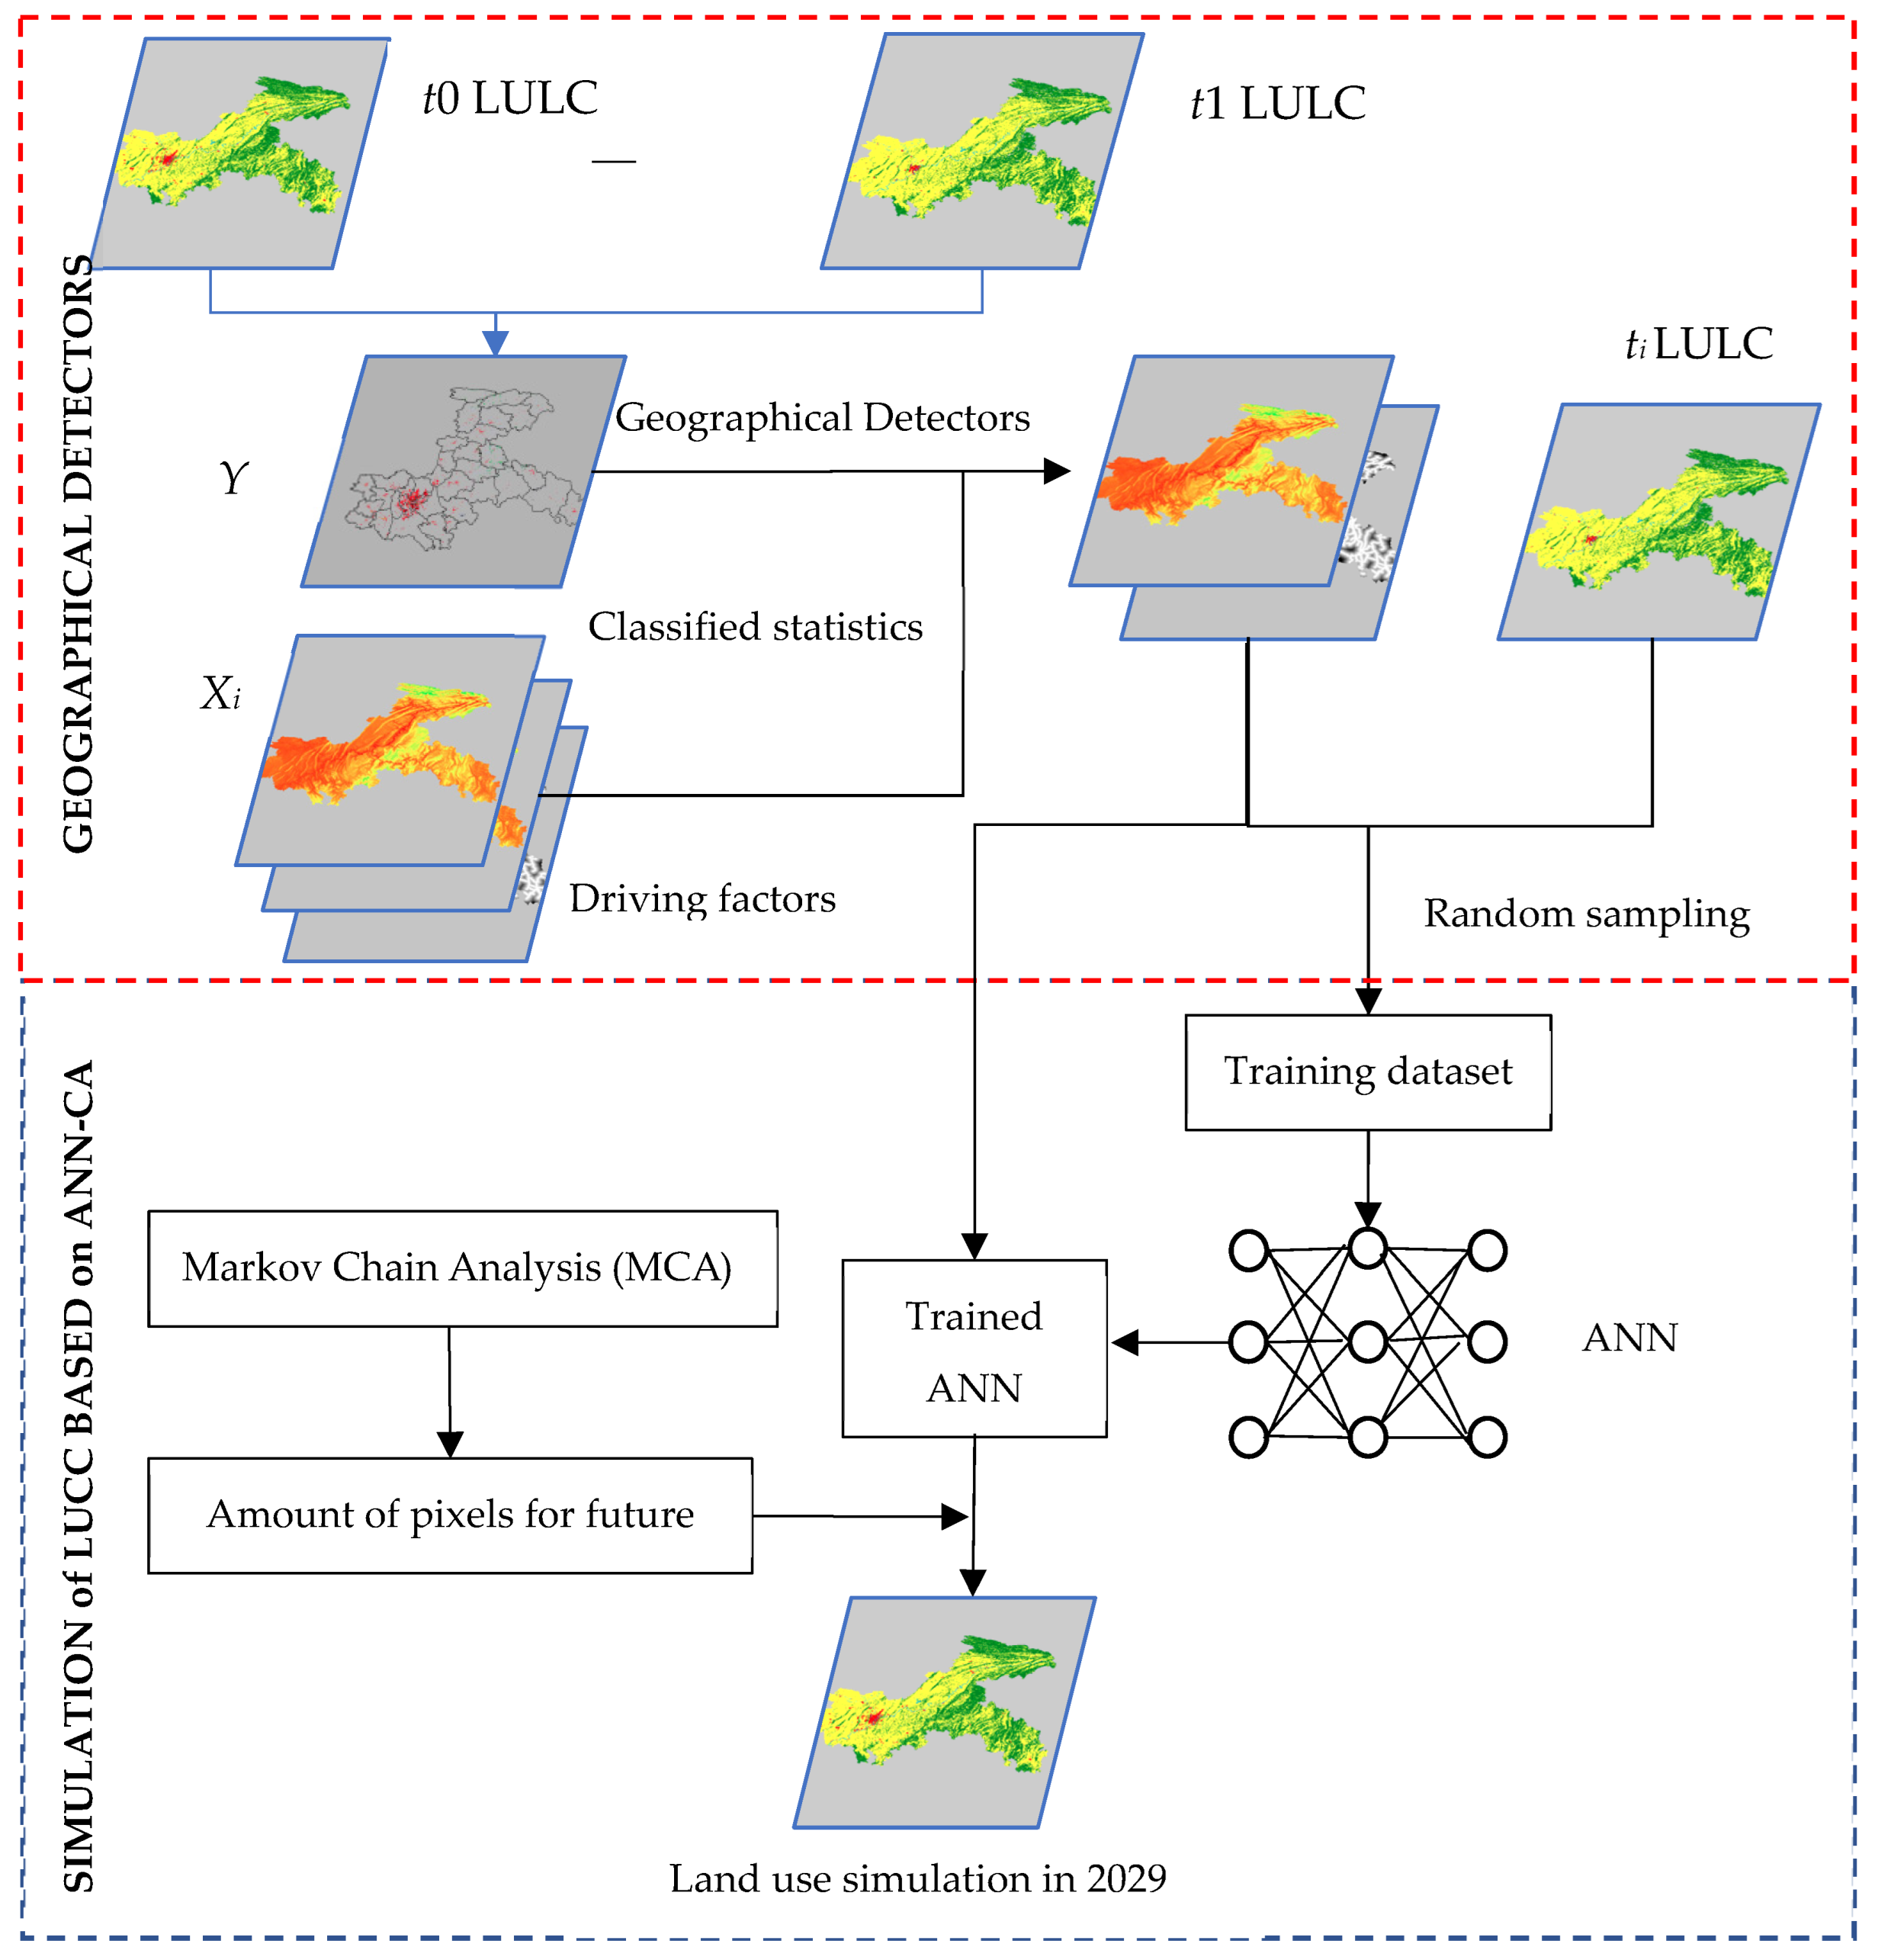
3.2.1. Research Method
- Geographic detector-based modeling
- Simulation of LULCC in Chongqing Based on ANN-CA
3.2.2. Workflow
4. Results and Discussion
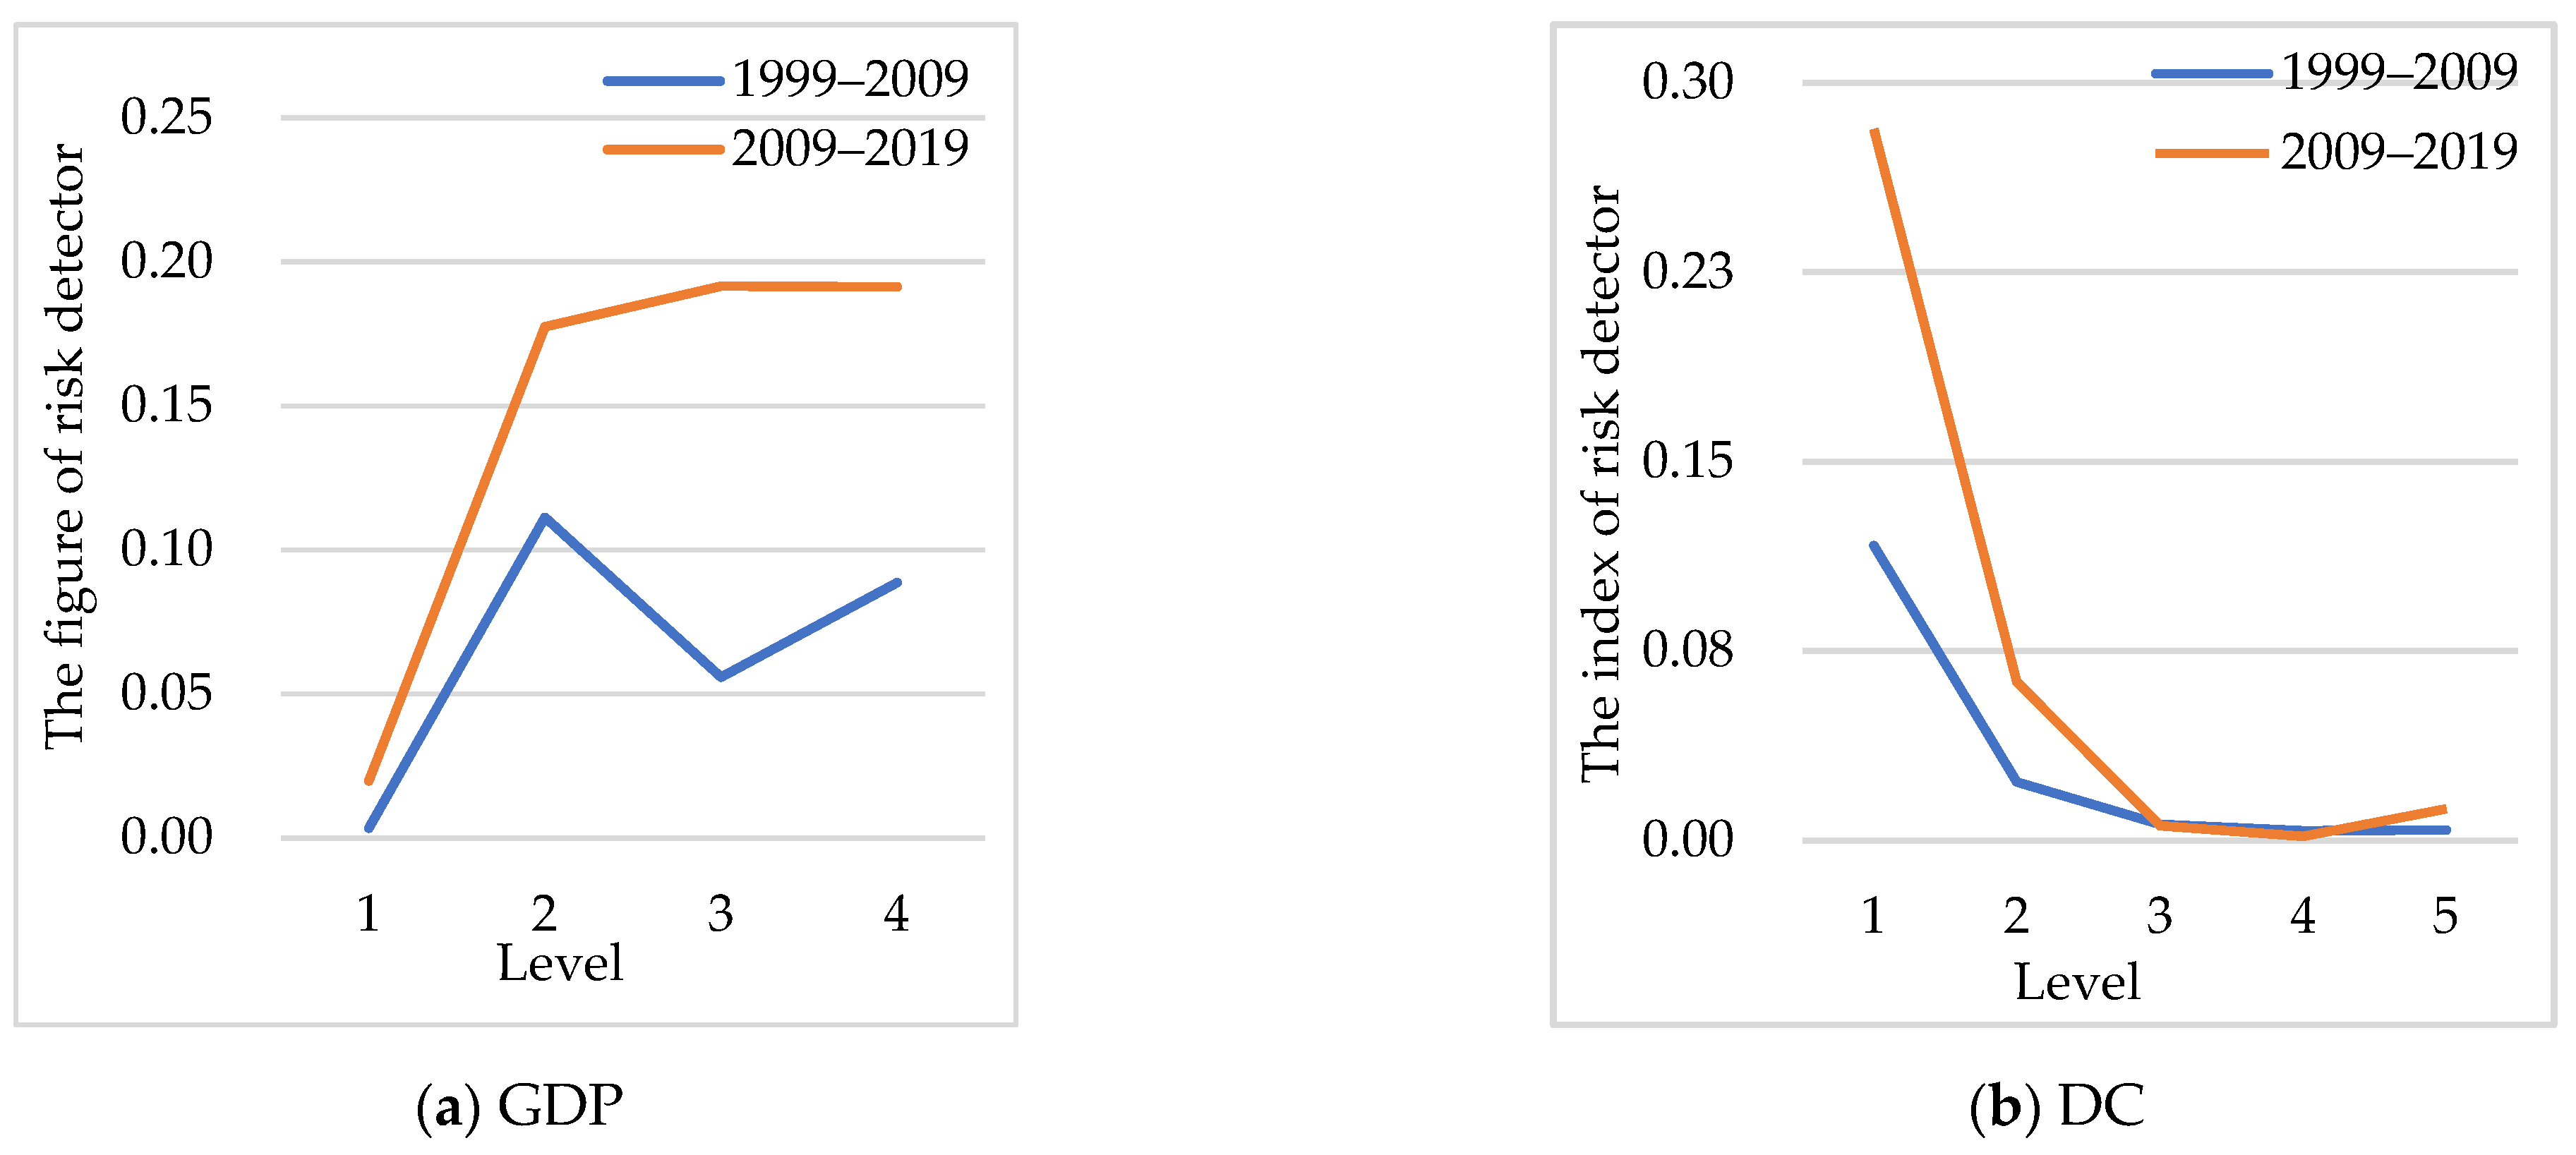
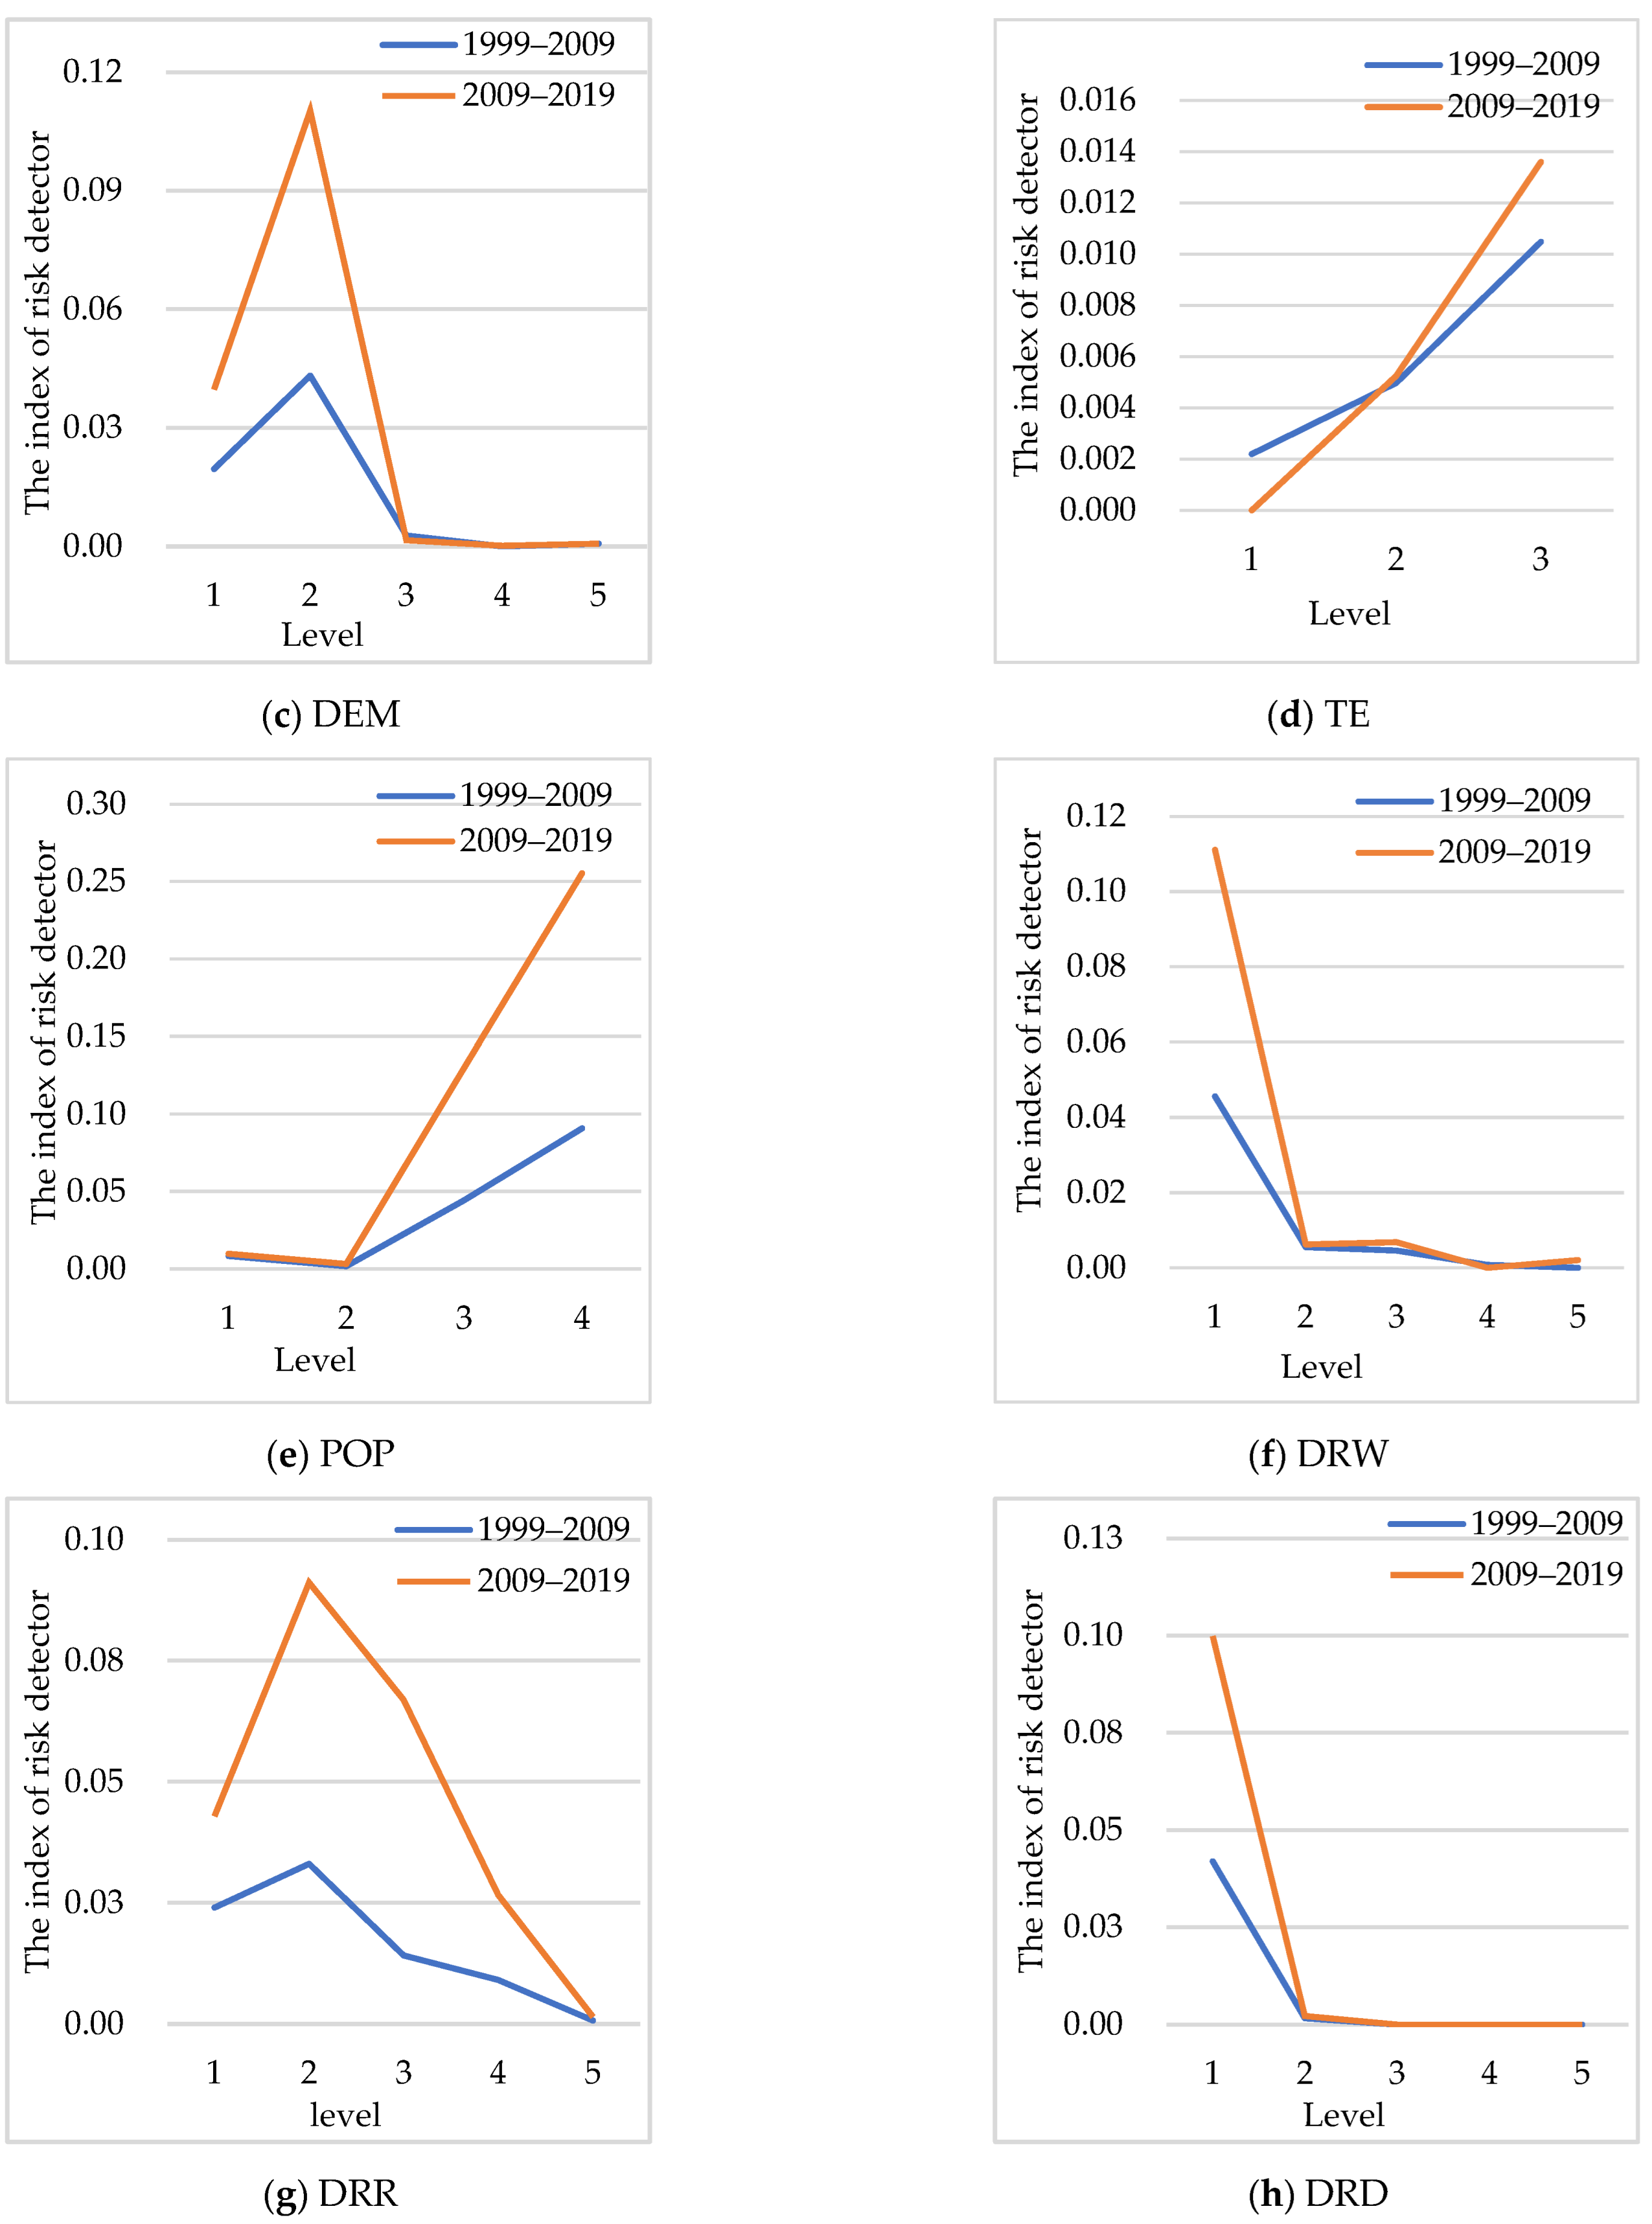
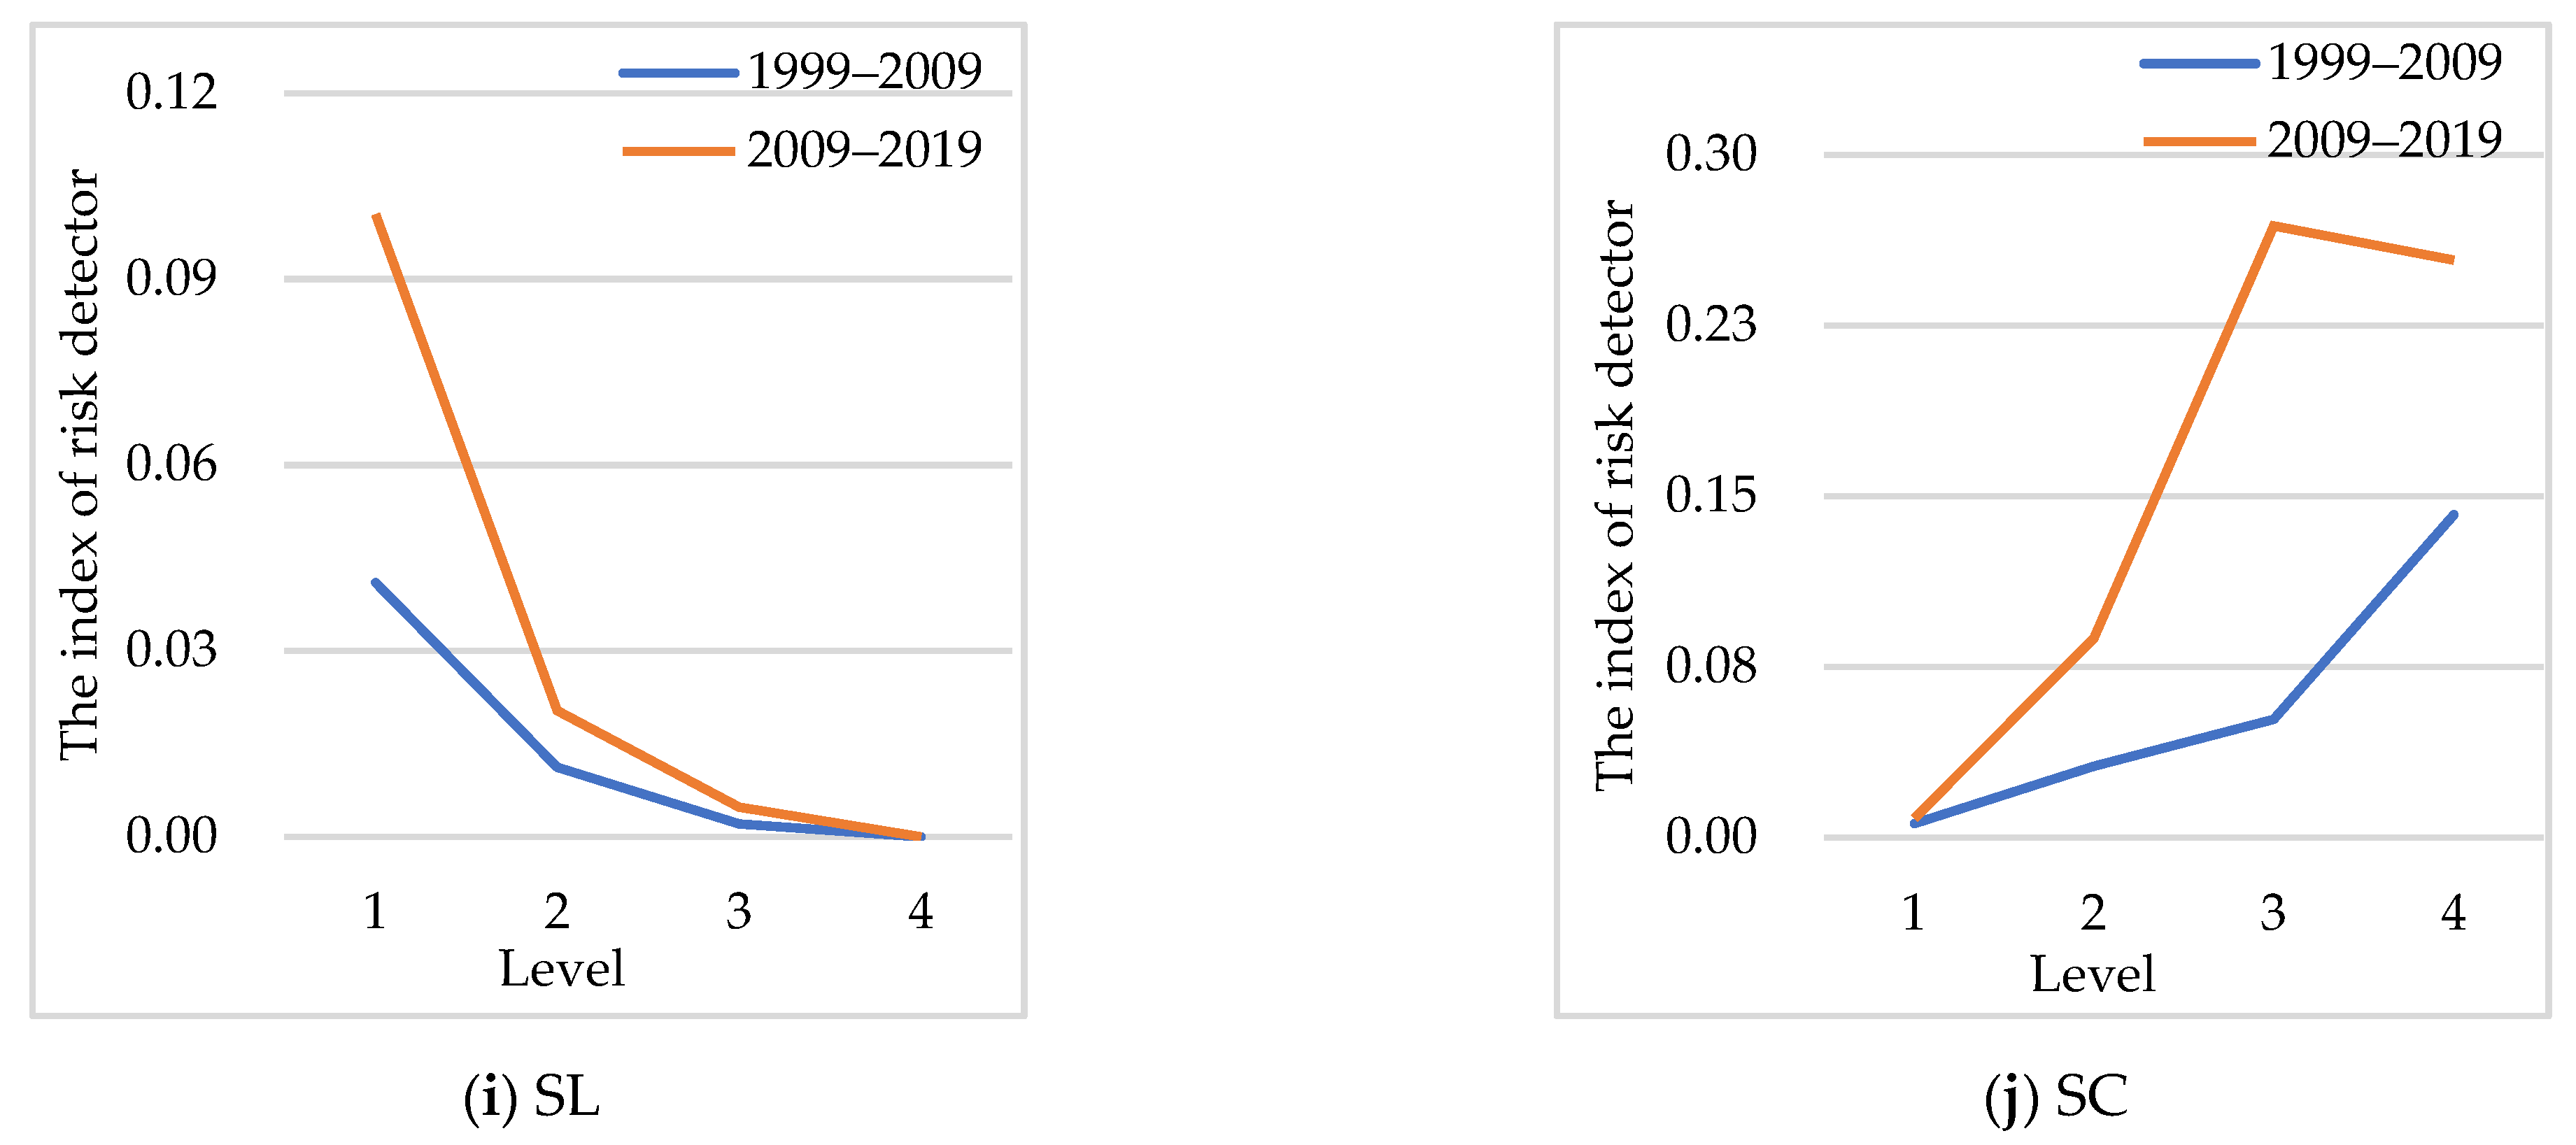
4.1. Driving Force Analysis of LULCC
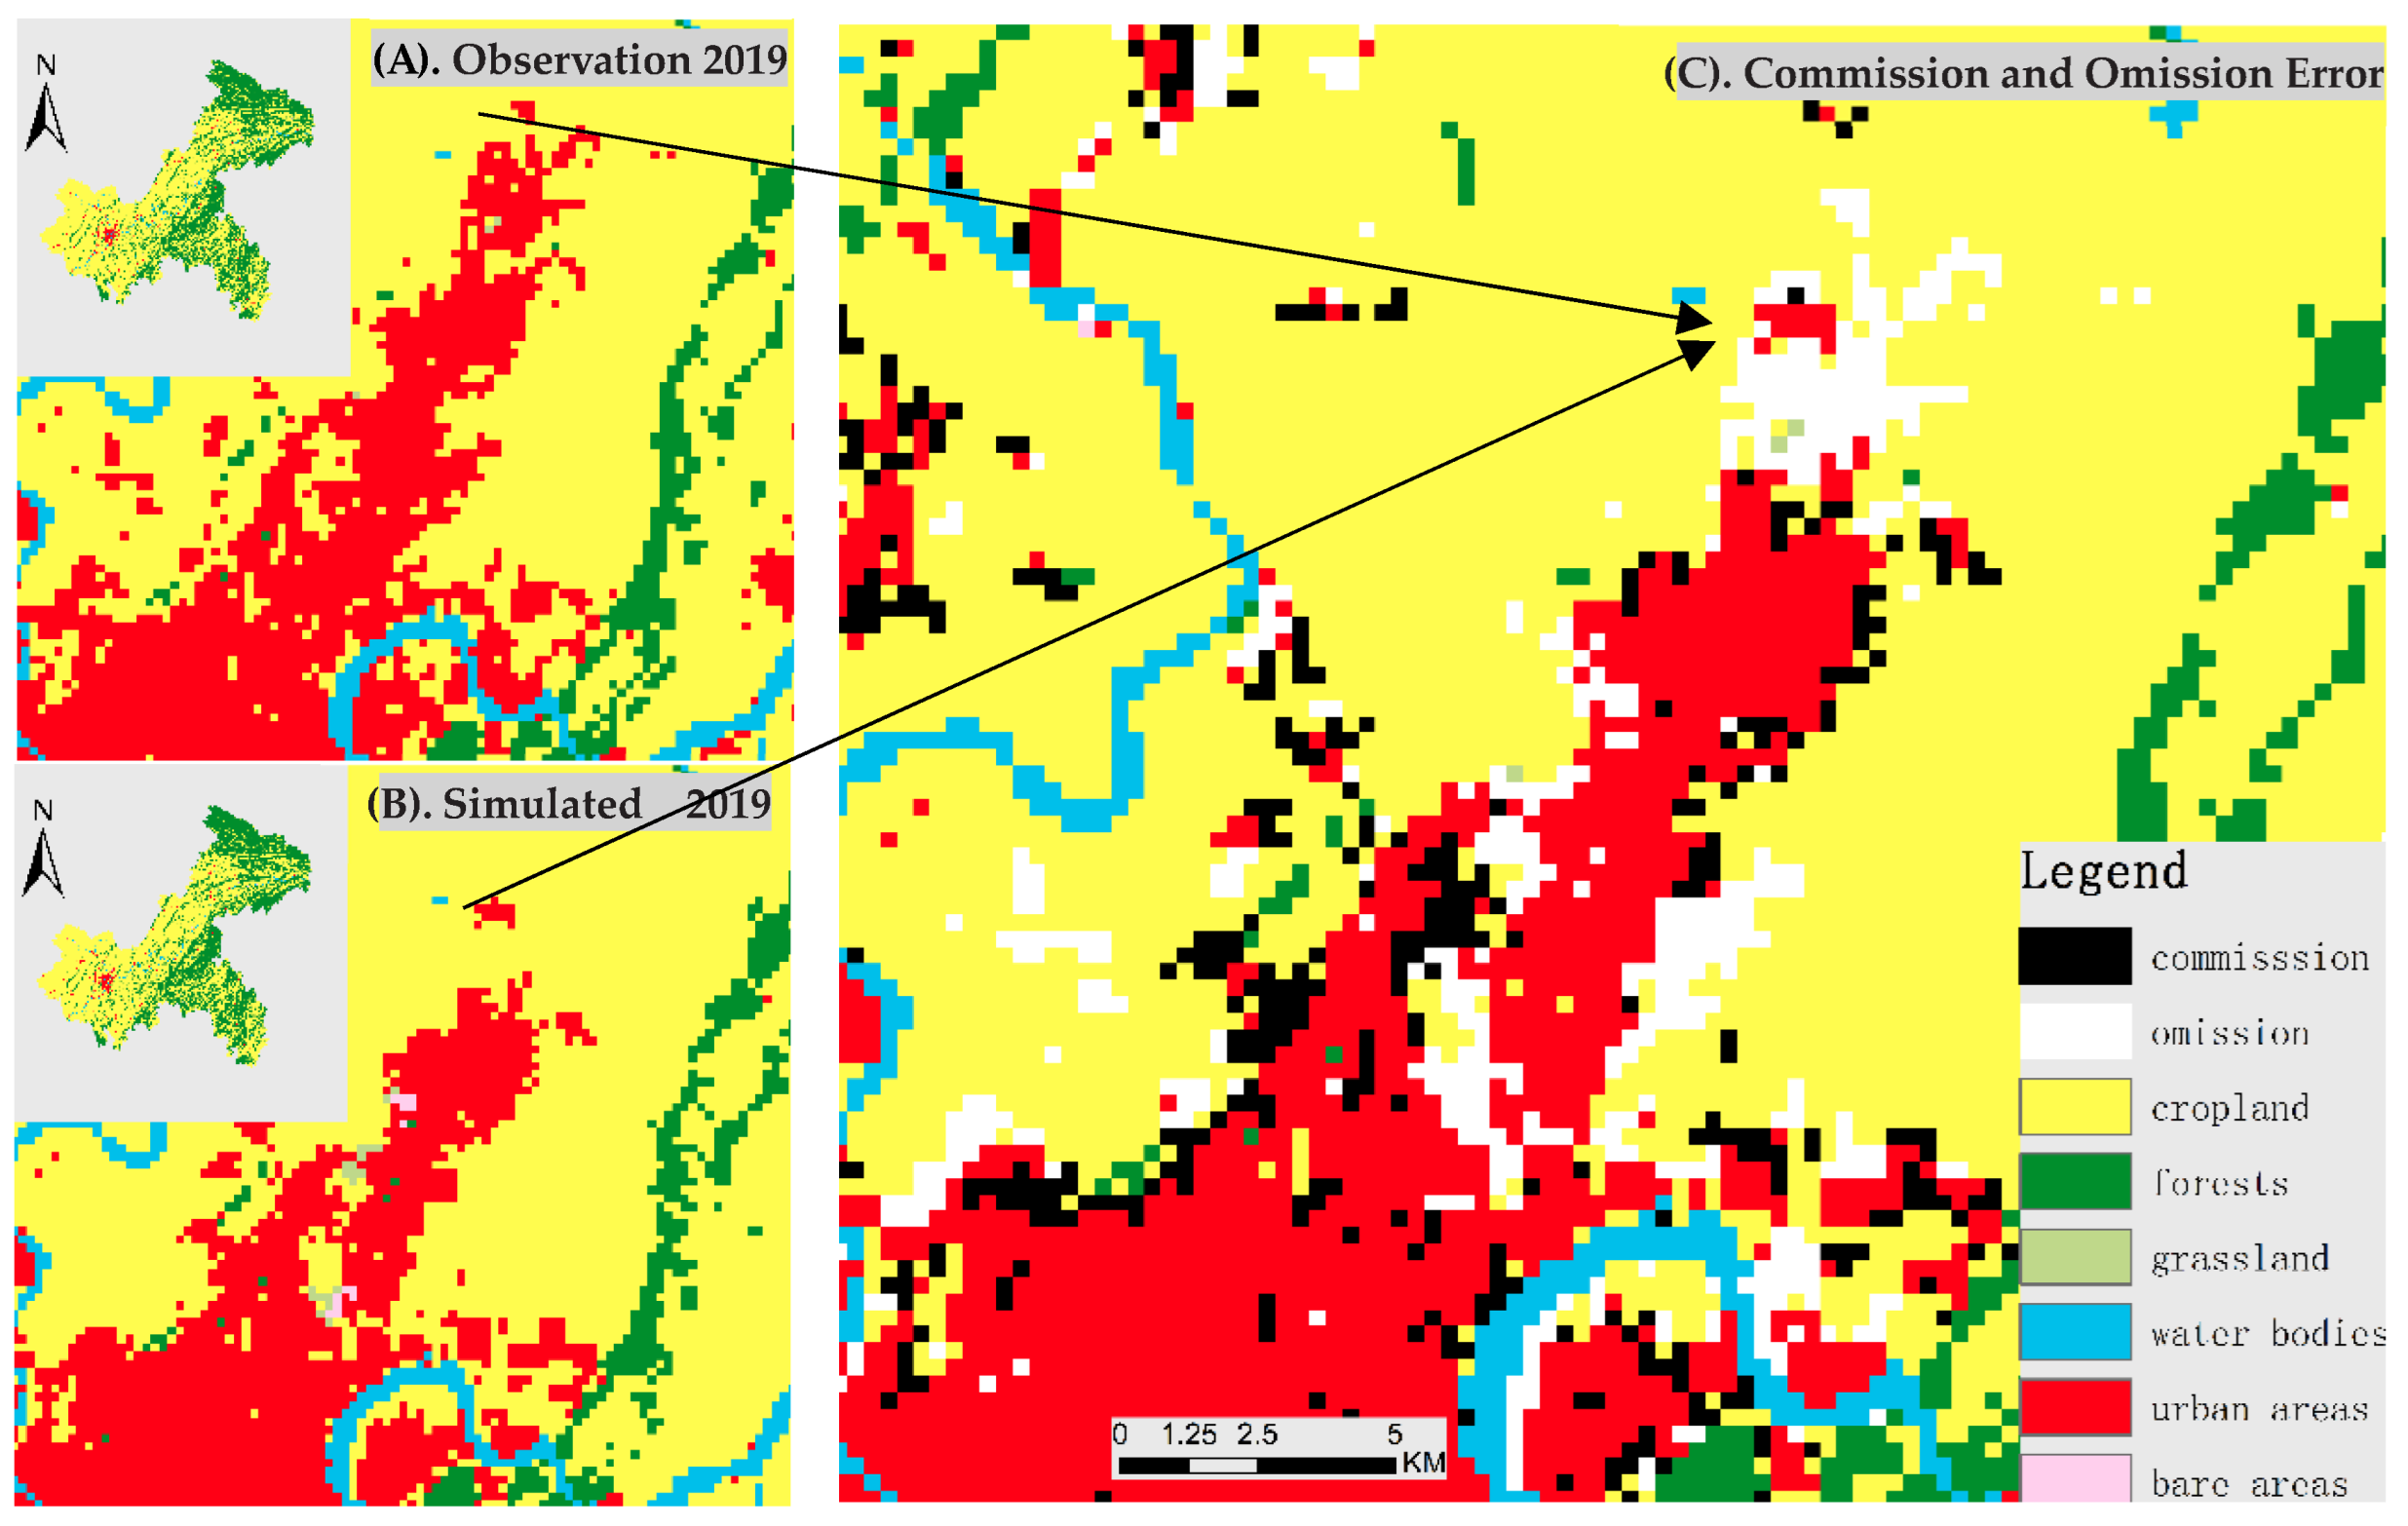
4.2. Simulation of Future LULCC Based on ANN-CA
4.2.1. Model Calibration and Performance
4.2.2. LULCC Predictions for 2029
5. Conclusions
Author Contributions
Funding
Institutional Review Board Statement
Informed Consent Statement
Data Availability Statement
Conflicts of Interest
References
- Makinde, E.O.; Agbor, C.F. Geoinformatic assessment of urban heat island and land use/cover processes: A case study from Akure. Environ. Earth Sci. 2019, 78, 1–12. [Google Scholar] [CrossRef]
- Paudel, B.; Zhang, Y.-l.; Li, S.-C.; Liu, L.-s.; Wu, X.; Khanal, N.R. Review of studies on land use and land cover change in Nepal. J. Mt. Sci. 2016, 13, 643–660. [Google Scholar] [CrossRef]
- Liu, J.; Zhan, J.; Deng, X. Spatio-temporal patterns and driving forces of urban land expansion in China during the economic reform era. Ambio 2005, 34, 450–455. [Google Scholar] [CrossRef] [PubMed]
- Chen, J. Rapid urbanization in China: A real challenge to soil protection and food security. Catena 2007, 69, 1–15. [Google Scholar] [CrossRef]
- Salazar, A.; Baldi, G.; Hirota, M.; Syktus, J.; McAlpine, C. Land use and land cover change impacts on the regional climate of non-Amazonian South America: A review. Glob. Planet. Chang. 2015, 128, 103–119. [Google Scholar] [CrossRef]
- McAlpine, C.A.; Syktus, J.; Ryan, J.G.; Deo, R.C.; McKeon, G.M.; McGowan, H.A.; Phinn, S.R. A continent under stress: Interactions, feedbacks and risks associated with impact of modified land cover on Australia’s climate. Glob. Chang. Biol. 2009, 15, 2206–2223. [Google Scholar] [CrossRef]
- Faichia, C.; Tong, Z.; Zhang, J.; Liu, X.; Kazuva, E.; Ullah, K.; Al-Shaibah, B. Using RS Data-Based CA-Markov Model for Dynamic Simulation of Historical and Future LUCC in Vientiane, Laos. Sustainability 2020, 12, 8410. [Google Scholar] [CrossRef]
- Ahsanullah; Khan, S.H.; Ahmed, R.; Luqman, M. Morphological change detection along the shoreline of Karachi, Pakistan using 50 year time series satellite remote sensing data and GIS techniques. Geomat. Nat. Hazards Risk 2022, 13, 249. [Google Scholar] [CrossRef]
- Hu, X.L.; Li, X.; Lu, L. Modeling the Land Use Change in an Arid Oasis Constrained by Water Resources and Environmental Policy Change Using Cellular Automata Models. Sustainability 2018, 10, 2878. [Google Scholar] [CrossRef] [Green Version]
- Long, Y.; Jin, X.; Yang, X.; Zhou, Y. Reconstruction of historical arable land use patterns using constrained cellular automata: A case study of Jiangsu, China. Appl. Geogr. 2014, 52, 67–77. [Google Scholar] [CrossRef]
- Hua, A.K. Spatial-Temporal Analysis of Pattern Changes and Prediction in Penang Island, Malaysia Using Lulc and Ca-Markov Model. Appl. Ecol. Environ. Res. 2018, 16, 4619–4635. [Google Scholar] [CrossRef]
- Huang, Y.; Liao, T.J. An integrating approach of cellular automata and ecological network to predict the impact of land use change on connectivity. Ecol. Indic. 2019, 98, 149–157. [Google Scholar] [CrossRef]
- Gomes, E.; Abrantes, P.; Banos, A.; Rocha, J. Modelling future land use scenarios based on farmers’ intentions and a cellular automata approach. Land Use Policy 2019, 85, 142–154. [Google Scholar] [CrossRef]
- Gong, W.F.; Yuan, L.; Fan, W.Y.; Stott, P. Analysis and simulation of land use spatial pattern in Harbin prefecture based on trajectories and cellular automata-Markov modelling. Int. J. Appl. Earth Obs. Geoinf. 2015, 34, 207–216. [Google Scholar] [CrossRef]
- Arsanjani, J.J.; Helbich, M.; Kainz, W.; Boloorani, A.D. Integration of logistic regression, Markov chain and cellular automata models to simulate urban expansion. Int. J. Appl. Earth Obs. Geoinf. 2013, 21, 265–275. [Google Scholar] [CrossRef]
- Hishe, S.; Bewket, W.; Nyssen, J.; Lyimo, J. Analysing past land use land cover change and CA-Markov-based future modelling in the Middle Suluh Valley, Northern Ethiopia. Geocarto Int. 2020, 35, 225–255. [Google Scholar] [CrossRef]
- Khawaldah, H.A.; Farhan, I.; Alzboun, N.M. Simulation and prediction of land use and land cover change using GIS, remote sensing and CA-Markov model. Glob. J. Environ. Sci. Manag. 2020, 6, 215–232. [Google Scholar]
- Abdo, Z.A.; Satyaprakash. Modeling urban dynamics and carbon sequestration in Addis Ababa, Ethiopia, using satellite images. Arab. J. Geosci. 2021, 14, 1–8. [Google Scholar] [CrossRef]
- Paul, S.S.; Li, J.; Wheate, R.; Li, Y. Application of Object Oriented Image Classification and Markov Chain Modeling for Land Use and Land Cover Change Analysis. J. Environ. Inform. 2018, 31, 30–40. [Google Scholar] [CrossRef]
- Mustafa, A.; Saadi, I.; Cools, M.; Teller, J. A Time Monte Carlo method for addressing uncertainty in land-use change models. Int. J. Geogr. Inf. Sci. 2018, 32, 2317–2333. [Google Scholar] [CrossRef] [Green Version]
- Salap-Ayca, S.; Jankowski, P.; Clarke, K.C.; Kyriakidis, P.C.; Nara, A. A meta-modeling approach for spatio-temporal uncertainty and sensitivity analysis: An application for a cellular automata-based Urban growth and land-use change model. Int. J. Geogr. Inf. Sci. 2018, 32, 637–662. [Google Scholar] [CrossRef]
- Feng, Y.J.; Liu, Y.; Tong, X.H.; Liu, M.L.; Deng, S.S. Modeling dynamic urban growth using cellular automata and particle swarm optimization rules. Landsc. Urban Plan. 2011, 102, 188–196. [Google Scholar] [CrossRef]
- Kamusoko, C.; Gamba, J. Simulating Urban Growth Using a Random Forest-Cellular Automata (RF-CA) Model. Isprs Int. J. Geo-Inf. 2015, 4, 447–470. [Google Scholar] [CrossRef]
- Mustafa, A.; Rienow, A.; Saadi, I.; Cools, M.; Teller, J. Comparing support vector machines with logistic regression for calibrating cellular automata land use change models. Eur. J. Remote Sens. 2018, 51, 391–401. [Google Scholar] [CrossRef]
- Feng, Y.J.; Tong, X.H. Dynamic land use change simulation using cellular automata with spatially nonstationary transition rules. Giscience Remote Sens. 2018, 55, 678–698. [Google Scholar] [CrossRef]
- Khwarahm, N.R. Spatial modeling of land use and land cover change in Sulaimani, Iraq, using multitemporal satellite data. Environ. Monit. Assess. 2021, 193, 148. [Google Scholar] [CrossRef] [PubMed]
- Liang, X.; Liu, X.P.; Li, D.; Zhao, H.; Chen, G.Z. Urban growth simulation by incorporating planning policies into a CA-based future land-use simulation model. Int. J. Geogr. Inf. Sci. 2018, 32, 2294–2316. [Google Scholar] [CrossRef]
- Qiang, Y.; Lam, N.S.N. Modeling land use and land cover changes in a vulnerable coastal region using artificial neural networks and cellular automata. Environ. Monit. Assess. 2015, 187, 57. [Google Scholar] [CrossRef]
- Gao, J.; Tang, X.; Lin, S.; Bian, H. The Influence of Land Use Change on Key Ecosystem Services and Their Relationships in a Mountain Region from Past to Future (1995–2050). Forests 2021, 12, 616. [Google Scholar] [CrossRef]
- Gounaridis, D.; Chorianopoulos, I.; Symeonakis, E.; Koukoulas, S. A Random Forest-Cellular Automata modelling approach to explore future land use/cover change in Attica (Greece), under different socio-economic realities and scales. Sci. Total Environ. 2019, 646, 320–335. [Google Scholar] [CrossRef]
- Zhou, X.Z.; Wen, H.J.; Zhang, Y.L.; Xu, J.H.; Zhang, W.G. Landslide susceptibility mapping using hybrid random forest with GeoDetector and RFE for factor optimization. Geosci. Front. 2021, 12. [Google Scholar] [CrossRef]
- Wang, J.F.; Li, X.H.; Christakos, G.; Liao, Y.L.; Zhang, T.; Gu, X.; Zheng, X.Y. Geographical Detectors-Based Health Risk Assessment and its Application in the Neural Tube Defects Study of the Heshun Region, China. Int. J. Geogr. Inf. Sci. 2010, 24, 107–127. [Google Scholar] [CrossRef]
- Wang, J.-F.; Hu, Y. Environmental health risk detection with GeogDetector. Environ. Model. Softw. 2012, 33, 114–115. [Google Scholar] [CrossRef]
- Marin, S.L.; Nahuelhual, L.; Echeverria, C.; Grant, W.E. Projecting landscape changes in southern Chile: Simulation of human and natural processes driving land transformation. Ecol. Model. 2011, 222, 2841–2855. [Google Scholar] [CrossRef]
- Mendoza-Ponce, A.; Corona-Nunez, R.O.; Galicia, L.; Kraxner, F. Identifying hotspots of land use cover change under socioeconomic and climate change scenarios in Mexico. Ambio 2019, 48, 336–349. [Google Scholar] [CrossRef] [PubMed] [Green Version]
- Hu, Y.; Batunacun. An Analysis of Land-Use and Land-Cover Change in the Zhujiang-Xijiang Economic Belt, China, from 1990 to 2017. Appl. Sci. 2018, 8, 1524. [Google Scholar] [CrossRef] [Green Version]
- Shi, G.; Ye, P.; Ding, L.; Quinones, A.; Li, Y.; Jiang, N. Spatio-Temporal Patterns of Land Use and Cover Change from 1990 to 2010: A Case Study of Jiangsu Province, China. Int. J. Environ. Res. Public Health 2019, 16, 907. [Google Scholar] [CrossRef] [Green Version]
- Guo, L.; Xi, X.; Yang, W.; Liang, L. Monitoring Land Use/Cover Change Using Remotely Sensed Data in Guangzhou of China. Sustainability 2021, 13, 2944. [Google Scholar] [CrossRef]
- Wang, H.; Gao, J.; Hou, W. Quantitative attribution analysis of soil erosion in different geomorphological types in karst areas: Based on the geodetector method. J. Geogr. Sci. 2019, 29, 271–286. [Google Scholar] [CrossRef] [Green Version]
- Wang, X.F.; Zhang, Y.W.; Ma, J.J. Factors influencing the incidence of bacterial dysentery in parts of southwest China, using data from the geodetector. Chin. J. Epidemiol. 2019, 40, 953–959. [Google Scholar] [CrossRef]
- Yang, X.; Chen, R.; Zheng, X.Q. Simulating land use change by integrating ANN-CA model and landscape pattern indices. Geomat. Nat. Hazards Risk 2016, 7, 918–932. [Google Scholar] [CrossRef] [Green Version]
- Li, X.; Chen, Y.; Liu, X.; Li, D.; He, J. Concepts, methodologies, and tools of an integrated geographical simulation and optimization system. Int. J. Geogr. Inf. Sci. 2011, 25, 633–655. [Google Scholar] [CrossRef] [Green Version]
- Liu, X.; Liang, X.; Li, X.; Xu, X.; Ou, J.; Chen, Y.; Li, S.; Wang, S.; Pei, F. A future land use simulation model (FLUS) for simulating multiple land use scenarios by coupling human and natural effects. Landsc. Urban Plan. 2017, 168, 94–116. [Google Scholar] [CrossRef]
- De Feudis, M.; Falsone, G.; Gherardi, M.; Speranza, M.; Vianello, G.; Antisari, L.V. GIS-based soil maps as tools to evaluate land capability and suitability in a coastal reclaimed area (Ravenna, northern Italy). Int. Soil Water Conserv. Res. 2021, 9, 167–179. [Google Scholar] [CrossRef]
- Saygin, S.D.; Yuksel, M. Determination and Mapping of Land Suitability Classes for Agricultural Utilization in Ankara Imrahor Valley and Its Vicinity. J. Agric. Sci.-Tarim Bilimleri Derg. 2008, 14, 108–115. [Google Scholar] [CrossRef] [Green Version]
- Sultan, K.A.; Ziadat, F.M. Comparing Two Methods of Soil Data Interpretation to Improve the Reliability of Land Suitability Evaluation. J. Agric. Sci. Technol. 2012, 14, 1425–1438. [Google Scholar]
- Matisziw, T.C.; Nilon, C.H.; Stanis, S.A.W.; LeMaster, J.W.; McElroy, J.A.; Sayers, S.P. The right space at the right time: The relationship between children’s physical activity and land use/land cover. Landsc. Urban Plan. 2016, 151, 21–32. [Google Scholar] [CrossRef] [Green Version]
- Tong, S.; Bao, G.; Rong, A.; Huang, X.; Bao, Y.; Bao, Y. Comparison of the Spatiotemporal Dynamics of Land Use Changes in Four Municipalities of China Based on Intensity Analysis. Sustainability 2020, 12, 3687. [Google Scholar] [CrossRef]
- Qian, Y.; Xing, W.; Guan, X.; Yang, T.; Wu, H. Coupling cellular automata with area partitioning and spatiotemporal convolution for dynamic land use change simulation. Sci. Total Environ. 2020, 722, 137738. [Google Scholar] [CrossRef]
- Deng, Z.; Zhang, X.; Li, D.; Pan, G. Simulation of land use/land cover change and its effects on the hydrological characteristics of the upper reaches of the Hanjiang Basin. Environ. Earth Sci. 2015, 73, 1119–1132. [Google Scholar] [CrossRef]
- Wang, S.Q.; Zheng, X.Q.; Zang, X.B. Accuracy assessments of land use change simulation based on Markov-cellular automata model. Procedia Environ. Sci. 2012, 13, 1238–1245. [Google Scholar] [CrossRef] [Green Version]
- Maithani, S. Calibration of a Multi-criteria Evaluation Based Cellular Automata Model for Indian Cities Having Varied Growth Patterns. J. Indian Soc. Remote Sens. 2018, 46, 199–210. [Google Scholar] [CrossRef]
- Jones, C.; Song, C.; Moody, A. Where’s woolly? An integrative use of remote sensing to improve predictions of the spatial distribution of an invasive forest pest the Hemlock Woolly Adelgid. For. Ecol. Manag. 2015, 358, 222–229. [Google Scholar] [CrossRef]
- Kang, J.; Fang, L.; Li, S.; Wang, X. Parallel Cellular Automata Markov Model for Land Use Change Prediction over MapReduce Framework. Isprs Int. J. Geo-Inf. 2019, 8, 454. [Google Scholar] [CrossRef] [Green Version]
- Mukhopadhyay, A.; Mondal, P.; Barik, J.; Chowdhury, S.M.; Ghosh, T.; Hazra, S. Changes in mangrove species assemblages and future prediction of the Bangladesh Sundarbans using Markov chain model and cellular automata (vol 17, pg 1111, 2015). Environ. Sci. Process. Impacts 2015, 17, 1990–1991. [Google Scholar] [CrossRef] [Green Version]
- Wu, W.; Zhang, W.; Jin, F.; Deng, Y. Spatio-temporal Analysis of Urban Spatial Interaction in Globalizing China-A Case Study of Beijing-Shanghai Corridor. Chin. Geogr. Sci. 2009, 19, 126–134. [Google Scholar] [CrossRef] [Green Version]
- Amiri, M.A.; Conoscenti, C.; Mesgari, M.S. Improving the accuracy of rainfall prediction using a regionalization approach and neural networks. Kuwait J. Sci. 2018, 45, 66–75. [Google Scholar]
- Gharaibeh, A.; Shaamala, A.; Obeidat, R.; Al-Kofahi, S. Improving land-use change modeling by integrating ANN with Cellular Automata-Markov Chain model. Heliyon 2020, 6, e05092. [Google Scholar] [CrossRef]


| Acronym | Variable | Description | Source | Time Interval |
|---|---|---|---|---|
| Land use | ||||
| LULC | land use/land cover | Land cover maps at 300 m spatial resolution. | CRDP (The Land Cover CCI Climate Research Data Package. https://cds.climate.copernicus.eu (accessed on 13 November 2020)) | 1999; 2009; 2019 |
| Environmental variables | ||||
| DEM | Elevation | Elevation in m | GLSDEM (Global Land Survey Digital Elevation Model www.gscloud.cn/ (accessed on 13 November 2020)) | (-) |
| SL | Slope | Slope in degrees | GLSDEM | (-) |
| TE | Temperature | Temperature Spatial Distribution | NMICC (National Meteorological Information left of China http://data.cma.cn/ (accessed on 15 November 2020)) | 2015 |
| DRR | Distance from the river | Euclidean distance from river network in m | OSM (Open Street Map. https://www.openstreetmap.org (accessed on 15 November 2020).) | (-) |
| Socio-economic variables | ||||
| DC | Distance from city left | Euclidean distance from city left in m | OSM | (-) |
| DRD | Distance from the road | Euclidean distance from road network in m | OSM | (-) |
| DRW | Distance from the railway | Euclidean distance from railway in m | OSM | (-) |
| GDP | Gross domestic product | Spatial distribution of GDP at a resolution of 1 km2. The units are numbered by 10,000 RMB per pixel. | RESD (Resource and Environment Science and Data left www.resdc.cn (accessed on 18 November 2020)) | 2005; 2015 |
| POP | Population | Spatial distribution of population at a resolution of 3 arc. The units are numbered by people per pixel. | Worldpop (www.worldpop.org (accessed on 4 March 2021)) | 2005; 2015 |
| SC | School | School Distribution Density | Baidu Map Open Platform (www.baidu.com (accessed on 4 March 2021)) | (-) |
| Variable | Level 1 | Level 2 | Level 3 | Level 4 | Level 5 |
|---|---|---|---|---|---|
| GDP (RMB/km2) | <50 million | 50–150 million | 150–300 million | >300 million | (-) |
| DC (km) | <20 | 20–100 | 100–200 | 200–300 | >300 |
| DEM (m) | <50 | 50–250 | 250–500 | 500–1000 | >1000 |
| TE (°C) | <25 | 25–33 | >33 | (-) | (-) |
| POP (/km2) | <50 | 50–150 | 150–250 | >250 | (-) |
| DRW (km) | <10 | 10–25 | 25–45 | 45–70 | >70 |
| DRR (km) | <1 | 1–3 | 3–5 | 5–10 | >10 |
| DRD (km) | <1 | 1–3 | 3–5 | 5–10 | >10 |
| SL (°) | <5 | 5–15 | 15–25 | >25 | (-) |
| SC(/km2) | <1 | 1–5 | 5–10 | >10 | (-) |
| Land Use Type | Commission Error | Omission Error | Producer’s Accuracy |
|---|---|---|---|
| cropland | 0.05 | 0.05 | 0.95 |
| forests | 0.07 | 0.06 | 0.94 |
| grassland | 0.43 | 0.13 | 0.87 |
| water bodies | 0.01 | 0.02 | 0.98 |
| urban areas | 0.31 | 0.25 | 0.75 |
| bare areas | 0.16 | 0.32 | 0.68 |
| Land Use Type | Observed 2019 | Simulated 2019 | Simulated 2029 |
|---|---|---|---|
| cropland | 49,556 | 49,548 | 48,992 |
| forests | 30,642 | 30,544 | 30,435 |
| grassland | 35 | 37 | 26 |
| water bodies | 813 | 792 | 786 |
| urban areas | 1182 | 1286 | 1949 |
| bare areas | 99 | 119 | 138 |
Publisher’s Note: MDPI stays neutral with regard to jurisdictional claims in published maps and institutional affiliations. |
© 2022 by the authors. Licensee MDPI, Basel, Switzerland. This article is an open access article distributed under the terms and conditions of the Creative Commons Attribution (CC BY) license (https://creativecommons.org/licenses/by/4.0/).
Share and Cite
Wu, F.; Mo, C.; Dai, X. Analysis of the Driving Force of Land Use Change Based on Geographic Detection and Simulation of Future Land Use Scenarios. Sustainability 2022, 14, 5254. https://doi.org/10.3390/su14095254
Wu F, Mo C, Dai X. Analysis of the Driving Force of Land Use Change Based on Geographic Detection and Simulation of Future Land Use Scenarios. Sustainability. 2022; 14(9):5254. https://doi.org/10.3390/su14095254
Chicago/Turabian StyleWu, Fengqiang, Caijian Mo, and Xiaojun Dai. 2022. "Analysis of the Driving Force of Land Use Change Based on Geographic Detection and Simulation of Future Land Use Scenarios" Sustainability 14, no. 9: 5254. https://doi.org/10.3390/su14095254