Article

The Potential of the Co-Recycling of Secondary Biodegradable Household Resources Including Wild Plants to Close Nutrient and Carbon Cycles in Agriculture in Germany

Institute of Sanitary Engineering, Water Quality and Solid Waste Management, University of Stuttgart, Bandtäle 2, 70569 Stuttgart, Germany
*
Author to whom correspondence should be addressed.
Sustainability 2022, 14(9), 5277; https://doi.org/10.3390/su14095277
Submission received: 22 February 2022 / Revised: 29 March 2022 / Accepted: 11 April 2022 / Published: 27 April 2022

Abstract

:
The aim of this study is to evaluate the potential for conserving natural resources (fossil resources, mineral fertilizer, fertile soil and biodiversity) with alternative circular concepts in order to contribute to the achievement of global sustainability goals. This study examines the potential contribution of substituting conventional products for three alternative circular economy concepts. This includes the household resources black water, kitchen and green waste for the production of design fertilizer, plant charcoal, biopolymers (concept 1) and biogas (concept 2), as well as the combination of household kitchen waste with wild plants for the production of biogas (concept 3). For evaluation, literature values were combined with analyzed parameters of input streams and biogas tests. The production and consumption values determined all relate to the functional unit of a person and year in Germany. Concept 1 has the highest potential for substitution in terms of the amount of recycled products. Co-recycling of organic household waste can account for 20% of NPK (nitrogen, phosphorus, potassium) mineral fertilizer, 19% of plastic consumption and 11% as a soil improving measure in soils in agriculture that are at risk of degradation. Concept 2 has the potential to contribute 12% of the final energy consumption in private households, which is an alternative solution regarding energy recovery due to the extensive practical experience. The joint recycling generates 141 kWh without, and 174 kWh with, fermentable green waste. If 75%, by weight, of fresh wild plants are added to the kitchen waste in concept 3, a wild plant area of 5 m2 is required, which could replace 41% of the biogas corn area, which is concept 3. This mix generates 193 kWh with the potential to reach 78% of corn energy production. The share of wild plants in kitchen waste of 50 or 25% by weight has the potential to achieve 115 or 104% of the corn energy yield, which is a promising concept for rural areas regarding energy recovery from an ecological point of view. The results show a considerable contribution potential of household resources in alternative cycle concepts to increase resource efficiency, and indirectly to diversify the agricultural landscape.

1. Introduction

1.1. Problem Status and Relevance

The consumption of resources associated with global economic performance has been increasing for years and has already exceeded the natural growth limits, which has a significant negative impact on people and the environment. To take an example, mineral fertilizer causes high energy demand, which is one of the main environment impacts of crop cultivation [1]. In addition, the substitution of phosphorus as a finite resource is also an important issue due to global demand, growing world population, geopolitical dependency and security of food supply [2,3,4]. In this context, the United Nations have formulated goals for sustainable resource management as part of several Sustainable Development Goals, which aim at resource efficiency as measured by the indicator of domestic material consumption per person [5].

1.2. The Potential of Alternative Circular Concepts

Closing cycles and increasing resource efficiency are of central importance for the sustainable use of natural resources. This includes concepts of ecosystem-based circular economy, which essentially aim to ensure that products, materials and components are reused and recycled and that in the end there is hardly any waste or waste is avoided [6]. Regional circular economy concepts between urban and rural areas show a possible solution to enhance sustainability and resource efficiency and reduce domestic net material consumption per person. Alternative short circular concepts that take water reduction into account and consider co-recycling of different biodegradable waste streams, can lead noteworthy to a decline of impacts, concerning resources (metal and fossil depletion), cumulative energy input and emissions [7,8,9]. The scheme of these closed-loops concepts can be seen in Figure 1 (which shows investigation concept 1).

1.3. Objectives

The primary aim of this study is to evaluate the theoretical potential to conserve natural resources by using alternative circular concepts in order to contribute to the achievement of global sustainability goals. To this end, the following research question is being investigated: Can alternative concepts close material cycles through the joint use of secondary biodegradable household resources in agriculture or have significant effects on resource efficiency?
There is a lack of investigation of the joint exploitation of household resources for recovering nutrients and carbon [7,11]. In addition, basic research on closing loops is an important aspect to strengthen the focus away from the linear towards the circular economy, among other things to leapfrog outdated concepts with new solutions [3,7,9]. This shows the need to evaluate the theoretical potentials of these waste streams in alternative concepts in order to create a better basis for a further step towards alternative circular concepts.

2. Materials and Methods

2.1. Scope and Functional Unit

The resources black water, kitchen and green waste and wild plants, and the products potential for biogas, magnesium-ammonium-phosphate (MAP) and complete (NPK) fertilizer, polyhydroxyalkanoates (PHA) for biopolymers and plant charcoal were taken into account for this investigation. All values were transferred to a functional unit of production and consumption per inhabitant and year in Germany (visible as p·a), with these values relating to selected areas of resource consumption, in accordance with the planned scope of the RUN project (representative in concept 1) from Figure 1 (Table 1), which relates to the use in the surrounding agriculture. The potential use of plant charcoal is related to the improvement of soil fertility in arable land in Germany that is at risk of degradation [12]. This reference was chosen because there is no classic substitution product. For concepts 2 and 3, the final energy consumption of private households was used as a parameter in order to fit into the framework of the functional unit of this study.

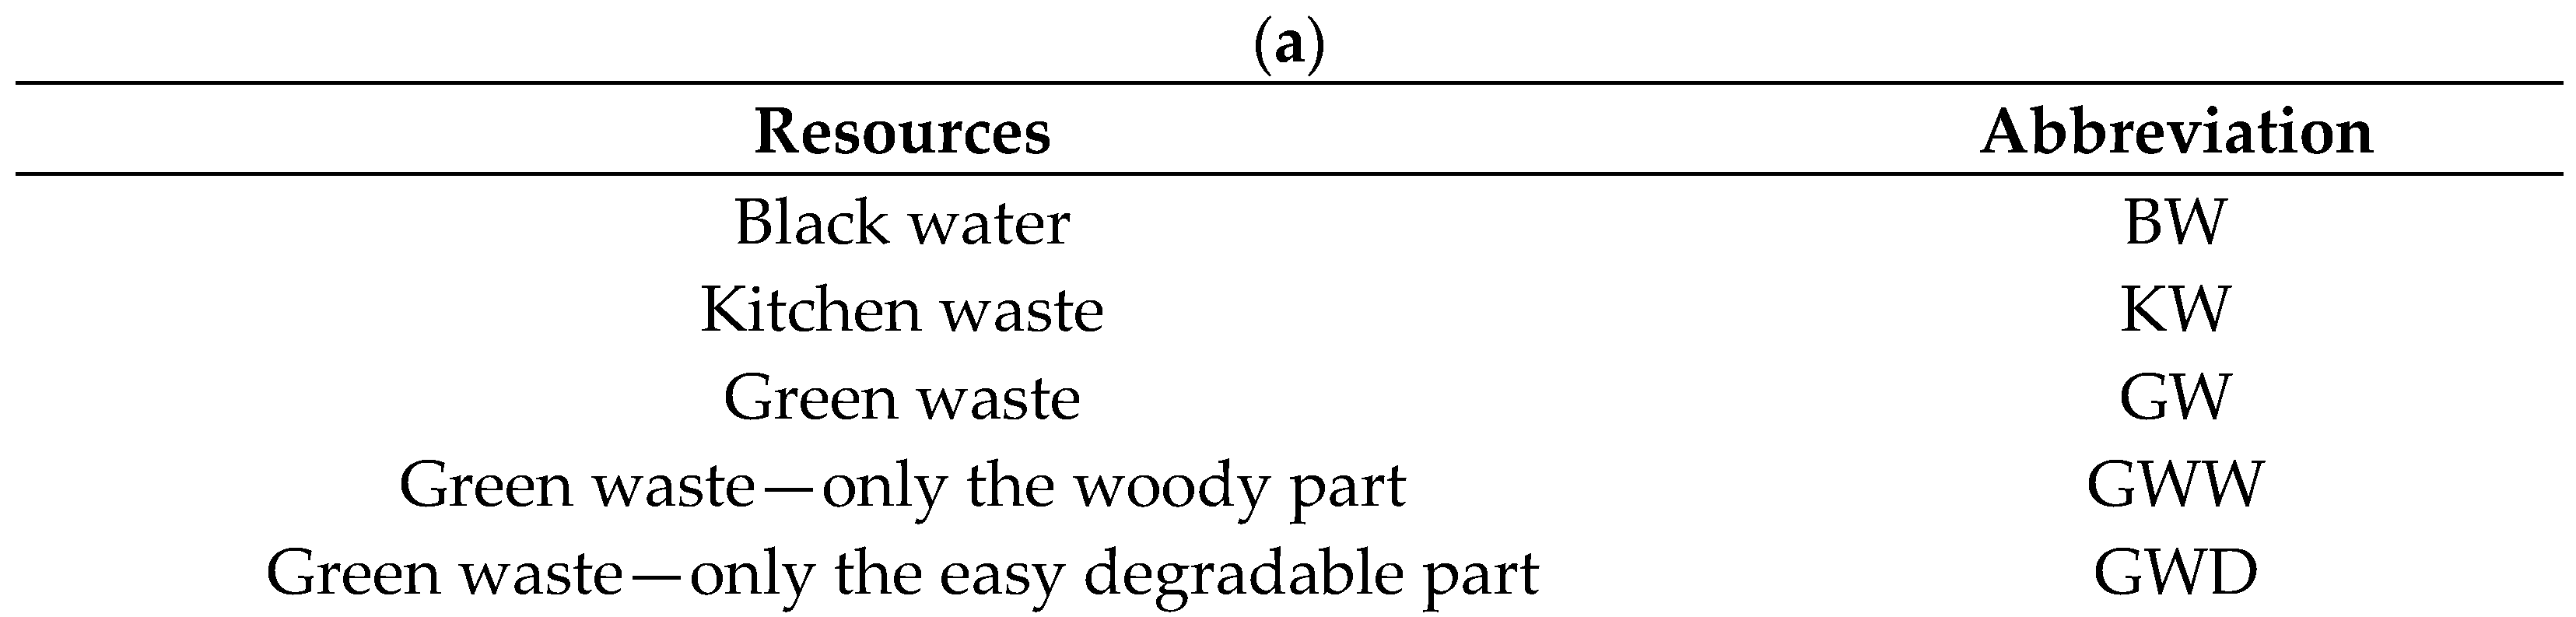
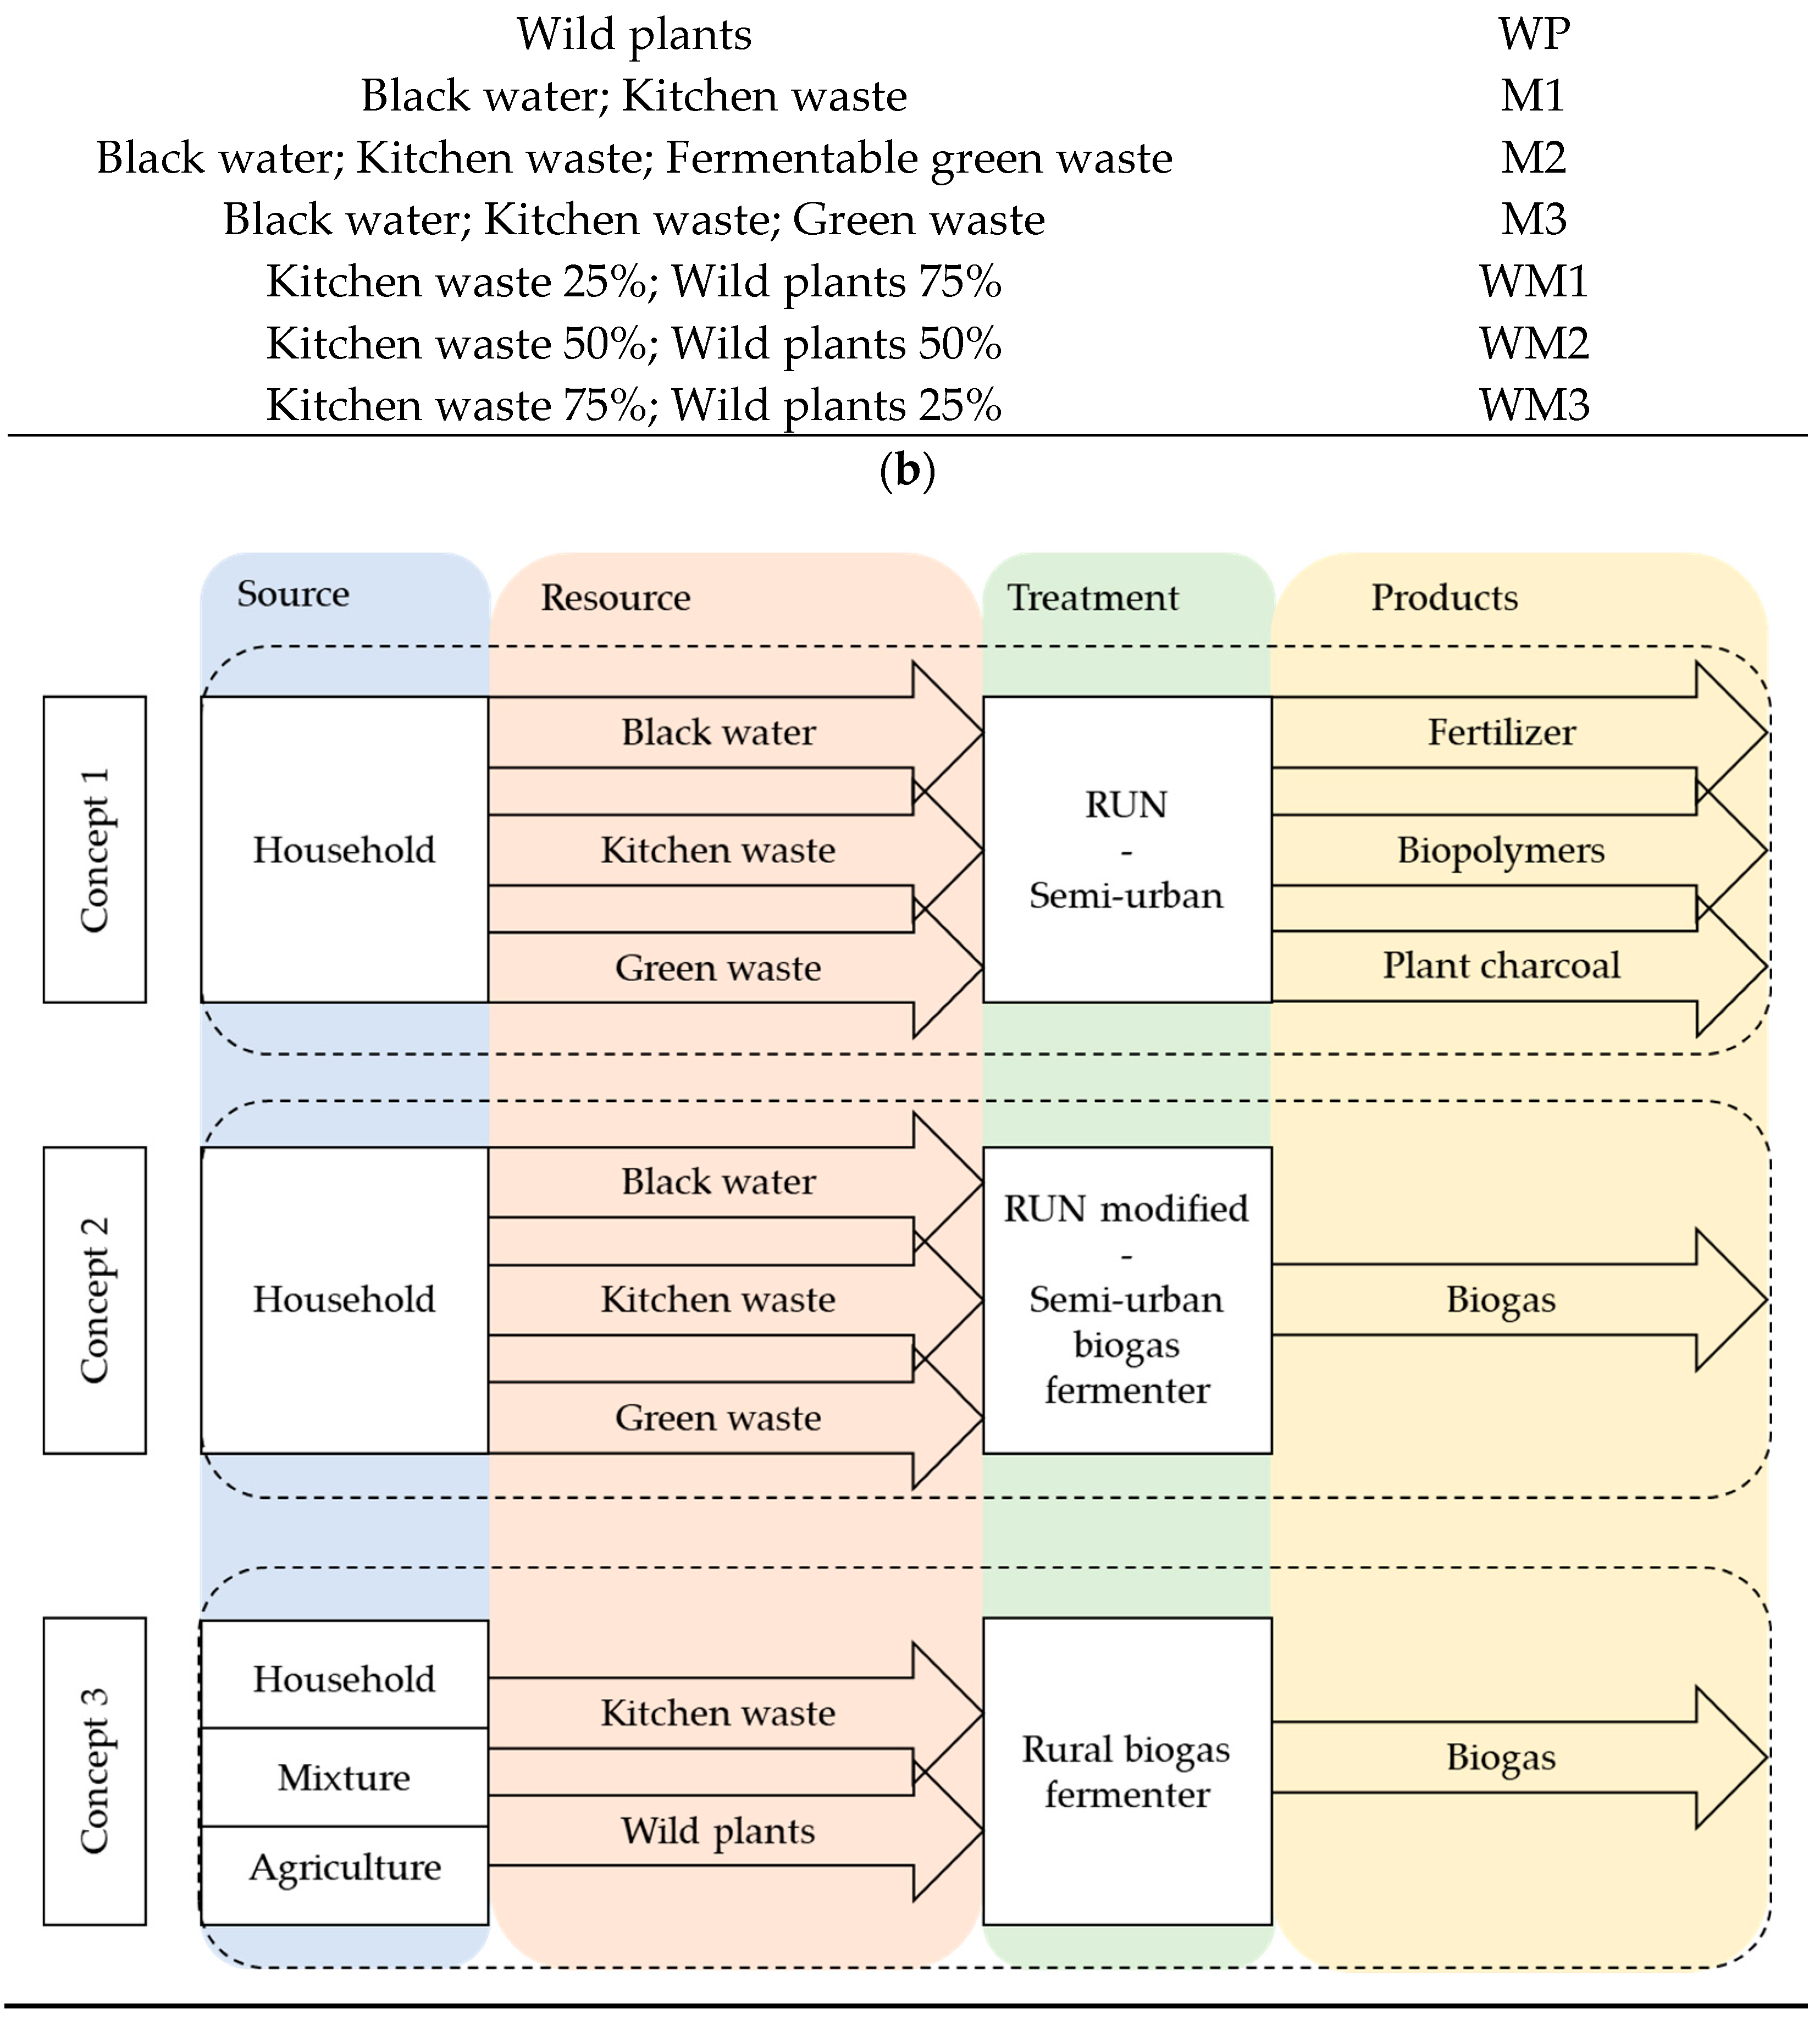
2.2. Scenarios and System Boundaries

The system was modeled from the provision of resources to the potential product gate. For an overview, a flow chart with system boundaries of the different concepts of consideration is illustrated in Figure 2. It shows the used resources of separated and joint exploitation with the abbreviations and resulting products in closed systems. Concept 1 showed the approach of RUN, and concept 2 considered a modified version of it, in order to consider energy generation as an alternative. Concept 3 was integrated to further strengthen ecosystem-based circularity and the direct use in rural areas.

2.3. Feedstock Characterization

Kitchen waste can vary widely in its composition, which is why a design kitchen waste was created based on the literature [17,18,19]. The composition is shown in Figure 3, which was collected, created and shredded for all investigations. The shredded green waste was made available by the nearby Wilhelma Zoo, which is responsible for maintaining the landscape. The green waste was sorted manually in woody and easy fermentable parts. Kitchen and green waste were stored until use in the freezer at −18 °C. Black water was taken from vacuum toilets of the Institute of Sanitary Engineering, Water Quality and Solid Waste Management at the University of Stuttgart, which require 1 liter per flush. It was homogenized with the collection and stored in the refrigerator at 4 °C until it was used. Combinations of black water, kitchen and green waste were mixed in quantities that arise on average in households in Germany, with 38:1:0.5 by weight. Wild plants were provided by a farmer from Kißlegg in the Ravensburg district, who cultivates wild plants with the mixture BG70 from Saatenzeller for the production of biogas. For mixtures with kitchen waste, fresh wild plants with wt-% of 75%, 50% and 25% were taken into account.

2.4. Input Parameters and Fermentation Tests

The data were generated and analyzed from September 2019 to December 2020. To calculate the substitution potentials, various parameters were analyzed at the laboratory level. Measured input parameters of the considered resources included the following: dry matter (DM), water content (WC) at 105 °C, volatile solids (VS) at 550 °C, potential of hydrogen (pH) measured with the pH meter, total phosphorus (TP) [20], total nitrogen (TN) [21], potassium (K) and magnesium (Mg) [22] and chemical oxygen demand (COD) [23]. Furthermore, heavy metal contents were analyzed [23]. The analyzes follow the DIN (German standard) which corresponds to the ISO (international standard). Parameters of four different substrates were analyzed, obtaining up to 3 replicates each. The arithmetic mean and the standard deviation were determined.
The biogas potentials of co-fermentation were identified experimentally with the help of fermentation tests. For the fermentation tests, measurements of biogas volume, carbon dioxide (CO2), methane (CH4), temperature and pressure were conducted continuously. The experimental procedure (including the preparatory steps) of the fermentation tests followed the guidelines of the Association of German Engineers (VDI 4630) [24]. The biogas and -methane potential were measured with the yieldmaster system (from the BlueSens gas sensor GmbH; Herten; Germany), which records the biogas volume, temperature, pressure and CH4- and CO2-gas formation potential. These data were documented with the BACVis (from the BlueSens gas sensor GmbH) program. In addition, these measurements were reviewed with MilliGascounters (from the Dr.-Ing. RITTER Apparatebau GmbH & Co. KG; Bochum; Germany), which record the gas yield volume mechanically. These values were read five times a week for the same period for at least twenty-five days at an average temperature of 35 °C and recorded manually. For comparability, the time-limited gas yield from day 21 (GB21) was used for all illustrations, which also forms the basis for calculating the substitution potentials [25]. A total of four different substrates and five mixtures were examined in fermentation tests, obtaining up to three replicates each. The arithmetic mean, and the minimum and maximum values were determined.

2.5. Substitution Potential

The substitution potentials were calculated by combining literature values and our own analyses by transferring consumption and production to the functional unit calculated with 83.1 Mio inhabitants in Germany [13,14,15,16]. The biogas potential estimation was based on the fermentation tests; meanwhile, the biogas yield for green waste was determined through using the carbon oxygen demand (COD) [26]. The methane yield was used to calculate the energy potential in kWh·(p·a)−1. The potential for recycling phosphorus as magnesium-ammonium-phosphate (MAP) was derived from total phosphorus (TP) and the mass potential in combination with the estimate of 50% recovery potential [27]. The potential for nitrogen and magnesium was calculated stoichiometrically from the amount of phosphorus recovered [28]. The estimation for biopolymers orientated on literature calculations and our own investigated COD values. Black water was calculated with 11% acidification and 0.63 g PHA from COD with a usability of 50% [29,30]. The PHA for kitchen and green waste was calculated to be 0.05 g polyhydroxyalkanoates (PHA) per g COD [31]. For mixtures, the values of the substrates were added up. Waste streams vary in their components resulting in different ratios of COD, BOD (biolog-ical oxygen demand) and also VFA (volatile fatty acids), which is important as the COD can only be partially utilized for PHA production. The COD was used for the calculations because the values used take this aspect into account and are based on the same input substrates [29,30,31,32,33]. In concept 1, after acidification, a solid filter cake was created that was separated from the liquid permeate. A separation of the filter cake with a dry matter (DM) content of 50% was presumed, which needed to be dried to a DM content of 85% [34]. From this, 30% plant charcoal from the DM of the filter cake was estimated [35,36]. The value of 10 tones (t) per hectare was used for the application of plant charcoal as a soil improver [37]. For the substitution potential of corn acreage, the energy potential of corn was replaced by that of wild plants and mixtures, which in turn was projected onto the current biogas corn area in Germany of 0.99 Mio hectares [38] For scaling the values on the functional unit, kitchen waste was accounted from the full amount accruing per person and year. From this amount (as 75%, 50% and 25%), wild plants were added on with 25%, 50% and 75%. The substitution of corn was calculated with a cultivation area rounded to 100,000 ha which resulted in 12 m2·(p·a)−1 [39].

3. Results and Discussion

3.1. Dry Matter Content

The quantity and quality amount of waste accruing per person and year in Germany is listed in Table 2, including combinations with Table 1. Dry matter, water content and volatile solids (Table 2(a)) are confirmed by other studies within their range [26,40]. The dry matter for green waste in the literature is given in between 38 and 68% [26,40], which corresponds with the results of the total amount of green waste. Woody parts were separated from easy fermentable parts, as our samples contained a lot of fresh grass in combination with woody substrates, which explains the low (16%) and high (85%) dry matter content. Hereby, the low dry matter values are in the range of fresh grass cuttings [41,42].

3.2. Carbon Oxygen Demand and Nutrients

The literature also shows a wide range of values of the carbon oxygen demand (COD) and the contents of nutrients of these various waste streams examined. Nevertheless, the investigated values of Table 2(b) can be found confirmed within or close to these values [18,26,40,43,45,49,50,51,52]. A higher nitrogen content in green waste is very likely to result from the separation of woody parts from the easy degradable substrates [26,45]. The highest potential for nutrient recovery can be seen in black water, while the COD has a comparable value for all three waste streams. This indicates an advantageous yield of different products when used together. The difference through the addition of easy fermentable green waste to black water and kitchen waste is small, due to the low amount of fresh matter per household. Nevertheless, an increase in the total organic carbon is visible, which can be derived from the COD content.

3.3. Heavy Metals

Compared to the heavy metal contents based on our own analyses, there are clear differences for lead (Pb), cadmium (Cd), chromium (Cr), copper (Cu), nickel (Ni) and zinc (Zn) compared to the literature values (Table 2(c)). According to the literature, kitchen waste has much higher heavy metal contents, whereby it is noticeable that only zinc and copper have comparable values [26,53]. It can be assumed that this is due to the fact that kitchen waste was designed and not collected in the classic way via waste bins, which excludes, for example, contamination such as foreign matter (such as batteries and metal cutlery) [54]. There could be similar reasons for the differences in the values in green waste, which are also higher in the literature for Pb, Cr and Ni than in these investigations; meanwhile, comparable values were identified for Cd, Cu and Zn [26]. With regard to black water, the values in the literature are lower, which can be attributed to the natural inhomogeneity and fluctuation [40,43]. This is also suitable with findings which show higher heavy metal contents for black water per person [51,55]. Mercury (Hg) was not investigated further here because preliminary research has shown that it is not a relevant variable in this case. Overall, the heavy metal contents in the combinations of black water, kitchen and green waste are below the limit values of the Biowaste Ordinance of Germany [25,56].

3.4. Biogas Potential of Household Organic Resources

In order to compare the biogas yield and in orientation to the gas formation rate (GB21), a limited time period of 21 days is shown in Figure 4. The biogas yield for black water is 501, for kitchen waste 600, for mixture one 634 and for mixture two 505 standard liters (lN) per kg volatile solids (VS). The methane accounts are 69, 67, 68 and 63%, respectively (Figure 4a,b). These values were compared with estimates obtained through the methane calculation with carbon oxygen demand (COD) and the values found in the literature for black water and kitchen waste [8,40,57]. In terms of methane content, the results show the highest biogas potential per kg VS in black water that is fermented with kitchen waste in the proportion 38:1 with 430, followed by pure kitchen waste with 403 and pure black water with 347 that is mono-fermented. The lowest potential of lN methane per kg VS lies in the co-fermentation of black water with kitchen and green waste with 317 (Figure 4b). In order to stick to the functional unit, the results were converted to standard biogas yield per person and year. This shows that black water, which is fermented together with kitchen and green waste, has the highest potential due to the substrate quantities with 27,854 lN biogas and 17,490 lN methane (CH4) per person and year. This is closely followed by the co-fermentation of black water and kitchen waste with 20,795 lN biogas and 14,112 lN CH4 per person and year. Kitchen waste with 10,129 lN biogas and 6816 lN CH4, and black water with 8764 lN biogas and 6065 lN CH4 per person and year have a comparatively low and similar biogas potential.

3.5. Biogas Potential of Wild Plants and Kitchen Waste

Wild plants were mono- and co-fermented with kitchen waste in three different ratios by weight of fresh matter (FM) (Figure 4c,d). The highest methane (CH4) yield per kg of volatile solids (VS) was observed for the mixture with 25 wt-% wild plants (M3), which had 660 lN biogas·(kg VS) −1 and 418 lN CH4·(kg VS)−1. This makes 119% of the corn energy yield, accounted with 350 lN CH4·(kg VS)−1 [42]. This was followed by the mixture with 50% wild plants with 544 lN biogas·(kg VS)−1 and 341 lN CH4·(kg VS)−1. The potentials of the mixture with 75% wild plants were 464 lN biogas·(kg VS)−1 and 263 lN CH4·(kg VS) −1. Mono-fermented wild plants had the lowest potential of 320 lN biogas·(kg VS)−1 and 190 lN CH4·(kg oVS)−1. This strengthens the importance of the optimal combination of co-substrates. The results were converted into kilowatt hours (kWh) per kg of fresh matter (FM). These showed the highest yield for the mixture with 50 wt-% wild plants. The biogas yield was 115 lN·(kg FM)−1 and 1,15 kWh·(kg FM)−1. This potential is higher compared to the corn yield [39]. The 25 wt-% wild plant mix had a yield similar to the laboratory kitchen waste and corn yield. The mixture produced 103.77 lN·(kg FM)−1 and 1035 kWh·(kg FM)−1. The lowest yield resulted from the mixture with 75 wt-% of wild plants with a biogas yield of 78.17 lN·(kg FM)−1 and 0.78 kWh·(kg FM)−1. Wild plants had a yield of 60.71 lN·(kg FM)−1 and 0.61 kWh·(kg FM)−1.

3.6. Synergistic Effects on Methane Yield of Black Water, Kitchen Waste and Wild Plants

When considering the methane yield per kg volatile solids (VS), synergistic effects are recognizable based on the mean values. It was 23.3% for black water with kitchen waste, 8.1% for kitchen waste with 75% wild plants, 15% for kitchen waste with 50% wild plants and 19.5% for kitchen waste with 25% wild plants. However, taking into account the maximum and minimum values, this could not be confirmed significantly. According to other studies, the synergistic effect can be greatly enhanced by an optimal combination of proportions [53,58,59,60,61,62,63,64]. Examples of this are that the co-fermentation could increase the amount of biogas per VS between 25 and 29% [58,59].

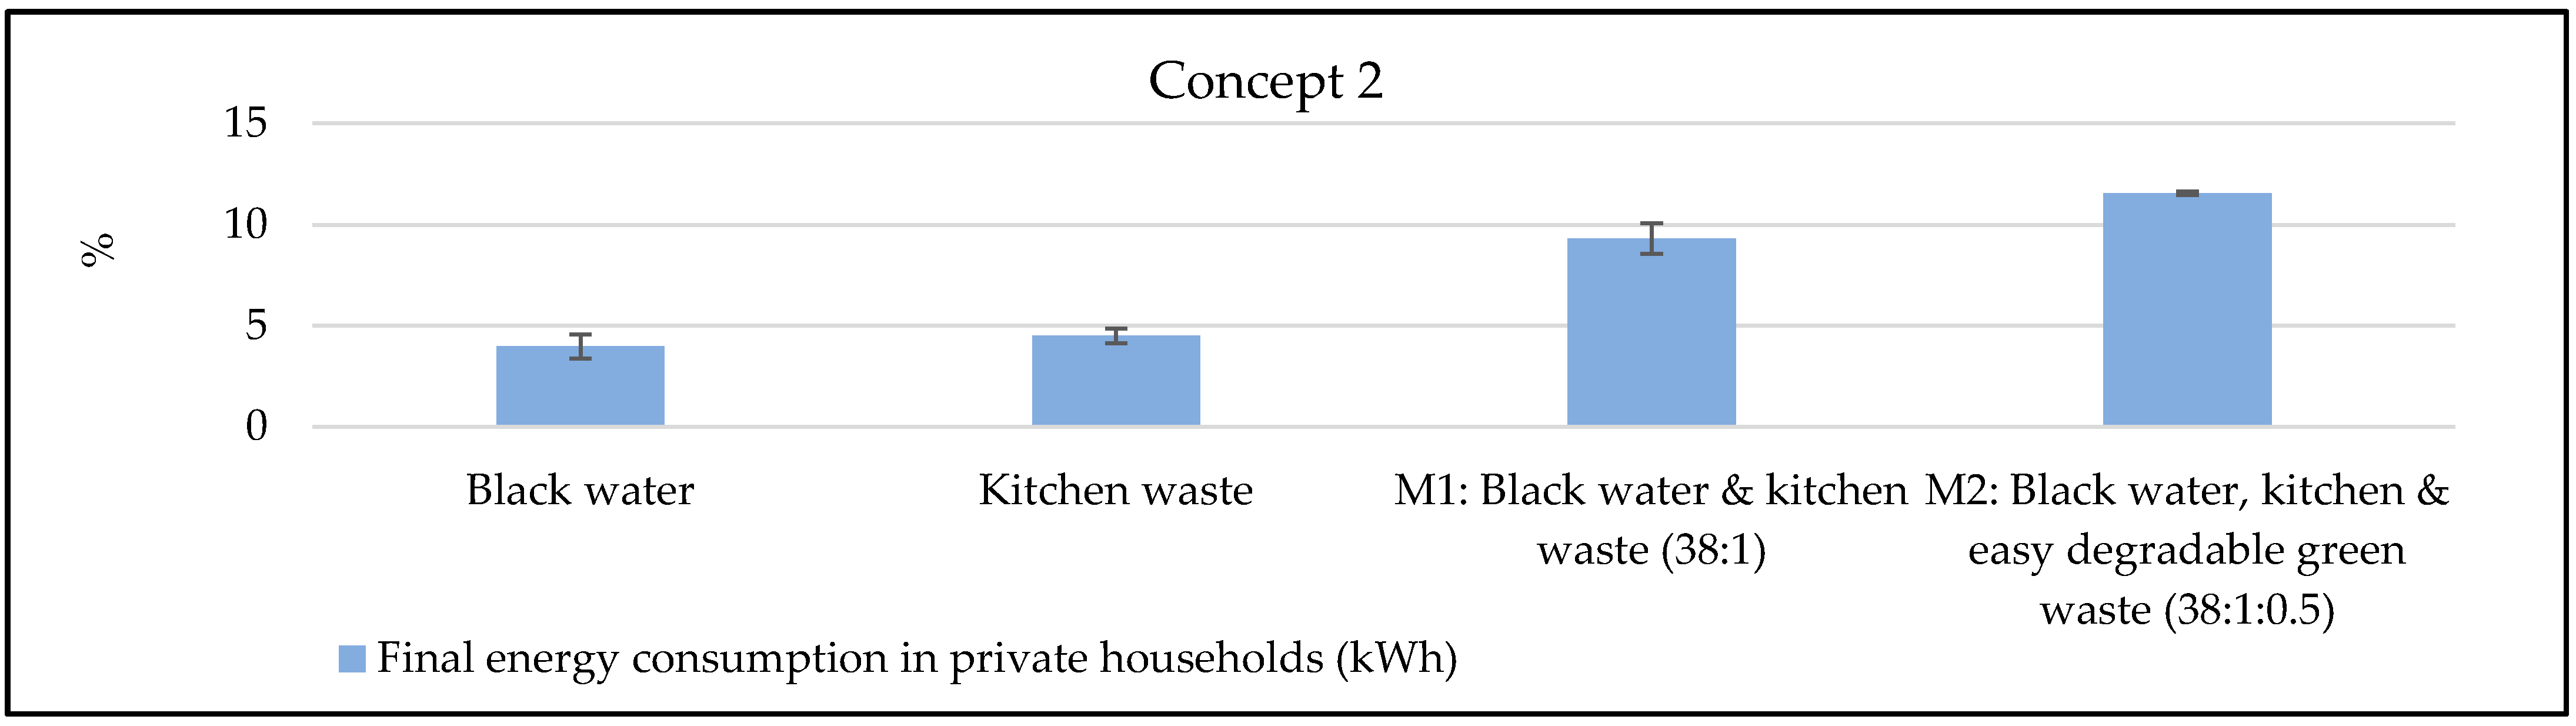
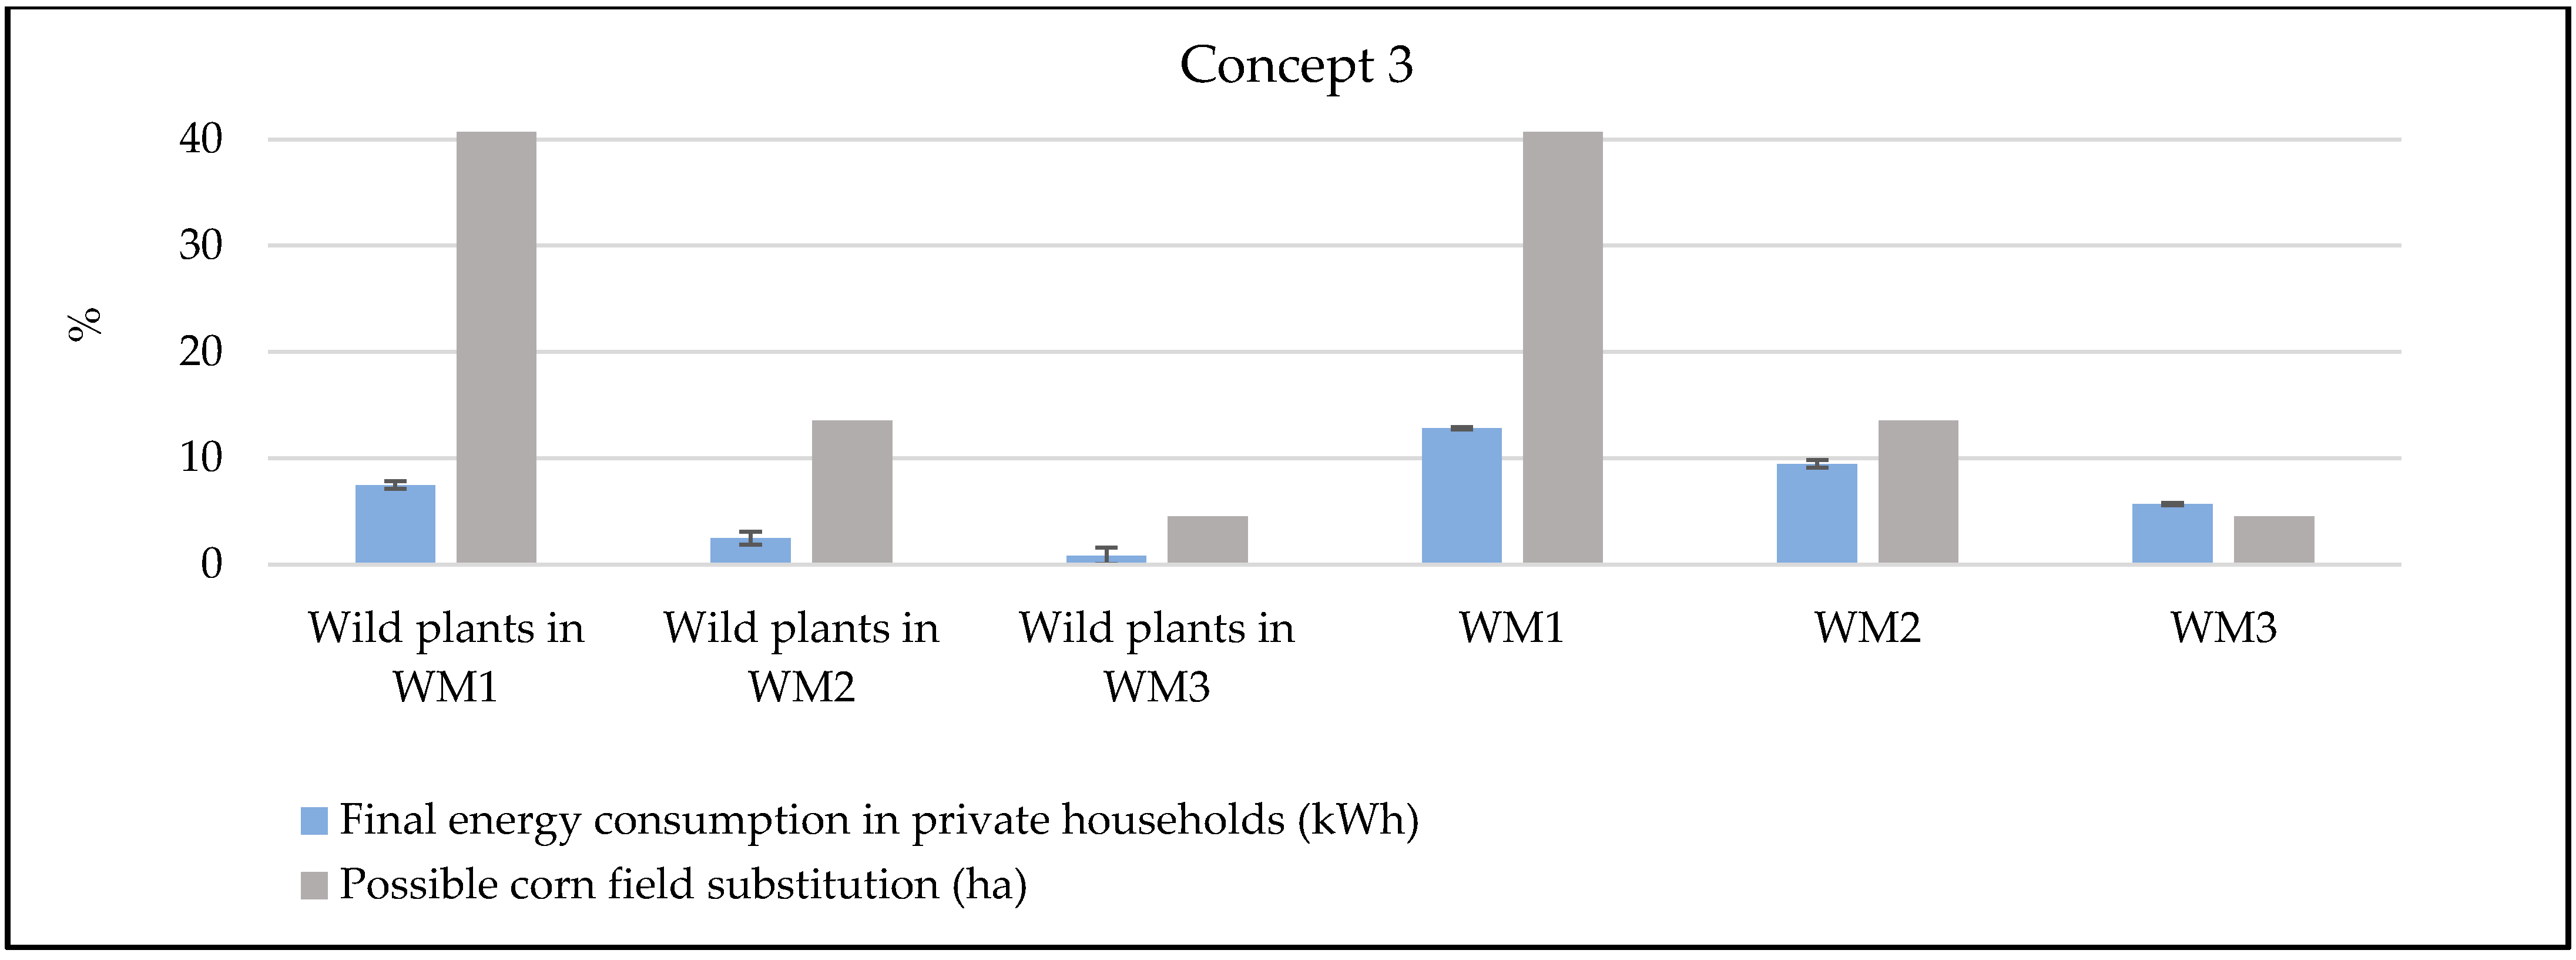
3.7. The Potential for Fossil Energy and Corn Acreage Substitution

The biogas substitution potential (Figure 5) is comparatively low (fermentable green waste: 1%; kitchen waste: 5%; black water: 4%) due to high energy consumption per person and year, but has a higher potential within the mixtures (M1:9%; M2:12%). Mono-fermented green waste has a very low substitution potential of 0.11% (Table 3). Figure 6 shows an area demand for wild plants of 5 m2·(p·a)−1 to cover the energy output of 193 kWh·(p·a)−1 for WM1, 2 m2·(p·a)−1 for 143 kWh·(p·a)−1 for WM2 and 0.5 m2·(p·a)−1 for 86 kWh·(p·a)−1 for MM3 [65]. Also visible is the energy substitution potential of wild plants with the same amounts, such as in the mixtures without kitchen waste. Those are noted as WP-WM1 (113 kWh·(p·a)−1), WP-WM2 (38 kWh·(p·a)−1) and WP-WM3 (13 kWh·(p·a)−1).
By using wild plants with these amounts in WM1, WM2 and WM3, the current biogas corn acreage could be reduced by 41%, 14% and 5%, respectively, in order to achieve the same amount of energy.
Moreover, a joint production of fertilizer and energy is worthwhile as the combination increases the energy yield for black water (57% for M1; 66% for M2) as for kitchen waste (52% for M1; 61% for M2).

3.8. The Potential for Mineral Phosphorus Fertilizer Substitution

The highest potential for nutrient recovery is visible in black water (Table 3). This potential is only marginally higher in the mixtures, but has slightly more magnesium present, mainly due to the kitchen waste, whereby no statement can be made about the availability. This is an important consideration because if there is not enough magnesium, it will need to be added for the correct stoichiometric ratio for magnesium-ammonium-phosphate (MAP) recovery [28]. Black water alone has insufficient magnesium, as 169% of the inflow would be necessary for the recovery of P. Very high concentrations of nitrogen are available in all waste streams, but in particular in black water, which is also confirmed by other studies [40,50]. The amount shows that the waste streams are important for nutrient recycling, in particular because studies proved that MAP is a safe and efficient fertilizer from black water [2]. The fertilizer recovery potential (Figure 7) is mainly provided by the wastewater flow of black water with 13% of the P-recovery and 15% of the total NPK-recovery. This can be increased slightly through combinations (M1: 15% and 18%; M2: 16% and 20%), but the differences are minimal. Kitchen waste is negligible when it comes to the substitution potential of fertilizers with 1% and 3%, as is green waste fermentable with 1% for P-recovery and 2% for total NPK-recovery. With the addition of kitchen waste, the substitution potential for fertilizer increases by 9% with M1 and 14% with M2. This potential increases with regard to the total recovery of NPK fertilizer to 17% for M1 and 25% for M2. The values of the phosphorus recovery potential are at the lower end of the values given in the literature [18,40,43,50,52]. In addition, the high fertilizer consumption leads to a low substitution potential. Phosphorus has a high recovery potential, especially in black water, as it is for the total recovery of NPK.

3.9. The Potential for Plastic Substitution

For the waste steams black water: 8% and kitchen waste: 11%, a relatively high potential for the substitution of plastics consumption in agriculture can be seen, but especially for mixtures with 18% in M1 and 19% in M2 based on consumption and production per person and year in Germany (Figure 7). The potential of the fermentable green waste is negligible with 1%. Table 3 shows that this is also an effect of the amount produced and also proves the negligible difference between the mixtures and the lowest potential of the green waste. The joint production of phosphorus and biopolymers is also worthwhile, as biopolymer production increases for black water (58% for M1 and M2) and for kitchen waste (43% for M1 and M2). The addition of green waste is negligible.

3.10. The Potential for Substitution of Soil Improving Measures

For green waste, plant charcoal came into consideration and its combination with the mechanical separation of the mixture of black water and kitchen waste from the liquid part. It was calculated that the amount of green waste per person and year could cover 5%, and the mixture of all household organic resources (M3) 11%, of the economically used arable land threatened by degradation in Germany in order to regenerate soil fertility, create carbon sinks and to replace other soil improving measures. Due to the small proportion and the wide range of possible uses of plant charcoal, this clearly shows that cascading use, for example, with prior use in livestock farming and end use as a soil improver, could be the most sustainable solution [37].

3.11. The Potential of Alternative Circular Concepts

All three concepts can contribute to increased resource efficiency, with concept 1 having the greatest potential in terms of quantity (Figure 5, Figure 6 and Figure 7). Concept 2 is the most mature and widespread in practice and therefore requires the least amount of effort to apply. These practical experiences could also be positively transferred to the implementation of concept 3. Concept 3 integrates the aspect of biodiversity, which makes it the most promising from an ecological point of view (Figure 6). However, even if this concept improves environmental friendliness, it will not be economical without support and suitable framework conditions. In general, the significant influence of alternative circulatory systems on resource efficiency and environmental friendliness can be confirmed by other studies [7,9]. This is especially true for the receipt of various products [9]. However, the potential is mainly seen in new settlements, growing cities and regions without wastewater and organic waste management, but not in regions that already have existing solutions with a low impact on the environment [7,60,66].

4. Conclusions

4.1. Conclusions and Outlook

In view of the results, the considerable potential for increasing resource efficiency and the share of renewable energies, alternative circular systems with joint use of resources make sense in order to achieve the Sustainable Development Goals. In addition, the results of the substitution potential show that consumption and production are very unbalanced. The focus on the reuse of secondary resources should be increased in order to minimize this gap and move closer to a sustainable model such as organic farming.
With regard to the concepts considered in this study, concept 1 shows the highest quantitative substitution potential for recycling, including the design fertilizer with 4.3 kg per person and year (p·a), biopolymers with 2.5 kg·(p·a)−1 and biochar with 21 kg·(p·a)−1 co-produced from the mixture of organic household resources, taking into account black water 38 kg·(p·a)−1, kitchen 1 kg·(p·a)−1 and green waste 0.5 kg·(p·a)−1. The biogas production of concept 2 has the potential to produce 174 kWh·(p·a)−1 from the same mix of resources. This is an alternative for energy recovery because it is a mature and widely used technology. This practical experience could be used for concept 3, which shows the potential of co-fermentation of kitchen waste (75 wt-%) with wild plants (25 wt-%) with 4 kWh per volatile solids in biogas plants. When using 100% kitchen waste and adding 75 wt-% of wild plants, 193 kWh·(p·a)−1 could be generated. Due to the same amount of energy, 41% of the currently 0.99 Mio hectares of biogas maize cultivation area could be replaced by wild plants. Concept 3 is a promising concept for rural areas regarding energy recovery from an ecological point of view due to the primary use of secondary organic resources and the additional diversification of the agricultural landscapes.
Overall, the results showed that waste streams have the potential to subsidize a noteworthy proportion of conventional products, which underlines the importance of promoting alternative, sustainable and environmentally friendly recycling concepts and the need to think in terms of alternative concepts. This applies in particular to new settlements and areas without a sewage and waste treatment system, but also to regions with increased capacity requirements and non-environmentally friendly concepts.

4.2. Further Research

This study is an excerpt and cannot stand on its own. Other aspects must also be taken into account for implementation, such as socio-economic ones. Therefore, this study should be supported by life cycle assessments, for example. Countries of the global south should be integrated, which could skip our outdated concepts for alternative, more ecosystem-friendly circular concepts and address several goals of the UN Sustainable Development Goals. In addition, pilot projects involving stakeholders are very important to scale the results and improve the applicability of the new concepts.

Author Contributions

Conceptualization, V.F.; methodology, V.F.; investigation, V.F. and B.S.; writing—original draft preparation, V.F.; writing—review and editing, V.F., M.K., C.M. and J.H.; visualization, V.F.; supervision, M.K. and C.M. All authors have read and agreed to the published version of the manuscript.

Funding

The present results come from the project “RUN–Rural Urban Nutrient Partnership” funded by the Federal Ministry of Education and Research. The authors thank the promoters for financing the project.

Institutional Review Board Statement

Not applicable.

Informed Consent Statement

Informed consent was obtained from all subjects involved in the study.

Data Availability Statement

The data that support the findings of this study are available on request from the corresponding author. The data are not publicly available due to privacy or ethical restrictions.

Conflicts of Interest

The authors declare no conflict of interest.

References

  1. Lansche, J.; Awiszus, S.; Latif, S.; Müller, J. Potential of Biogas Production from Processing Residues to Reduce Environmental Impacts from Cassava Starch and Crisp Production—A Case Study from Malaysia. Appl. Sci. 2020, 10, 2975. [Google Scholar] [CrossRef]
  2. Gell, K.; de Ruijter, F.J.; Kuntke, P.; de Graaff, M.; Smit, A.L. Safety and effectiveness of struvite from black water and urine as a phosphorus fertilizer. J. Agric. Sci. 2011, 3, 67. [Google Scholar] [CrossRef]
  3. Mihelcic, J.R.; Fry, L.M.; Shaw, R. Global potential of phosphorus recovery from human urine and feces. Chemosphere 2011, 84, 832–839. [Google Scholar] [CrossRef] [PubMed]
  4. Cordell, D.; White, S.; Lindström, T. Peak phosphorus: The crunch time for humanity. Sustain. Rev. 2011, 2, 3. [Google Scholar]
  5. Schroeder, P.; Anggraeni, K.; Weber, U. The Relevance of Circular Economy Practices to the Sustainable Development Goals. J. Ind. Ecol. 2019, 23, 77–95. [Google Scholar] [CrossRef] [Green Version]
  6. Pollert, A.; Kirchner, B.; Polzin, J.M.; Pollert, M.C. Duden Wirtschaft von A bis Z: Grundlagenwissen für Schule und Studium, Beruf und Alltag; Bibliographisches Institut GmbH: Gotha, Germany, 2016; ISBN 3411912154. [Google Scholar]
  7. Friedrich, J.; Poganietz, W.-R.; Lehn, H. Life-cycle assessment of system alternatives for the Water-Energy-Waste Nexus in the urban building stock. Resour. Conserv. Recycl. 2020, 158, 104808. [Google Scholar] [CrossRef]
  8. Remy, C. Life Cycle Assessment of Conventional and Source Separation Systems for Urban Wastewater Management; Papierflieger: Clausthal-Zellerfeld, Germany, 2010. [Google Scholar]
  9. Remy, C.; Ruhland, A. Ecological Assessment of Alternative Sanitation Concepts with Life Cycle Assessment; Technical University Berlin: Berlin, Germany, 2006; p. 55. [Google Scholar]
  10. RUN—Rural Urban Nutrient Partnership. RUN in Images. Available online: https://www.run-projekt.de/erklaergrafiken (accessed on 24 March 2022).
  11. Saratale, R.G.; Cho, S.K.; Saratale, G.D.; Kadam, A.A.; Ghodake, G.S.; Kumar, M.; Bharagava, R.N.; Kumar, G.; Kim, D.S.; Mulla, S.I.; et al. A comprehensive overview and recent advances on polyhydroxyalkanoates (PHA) production using various organic waste streams. Bioresour. Technol. 2021, 325, 124685. [Google Scholar] [CrossRef]
  12. Umweltbundesamt; Bundesanstalt für Geowissenschaften und Rohstoffe; Thünen-Institut für Agrarklimaschutz; Thüneninstitut für Waldökosysteme; Deutscher wetterdienst Abteilung Agrarmeteorologie. Bodenzustand in Deutschland: Zum "internationalen Jahr des Bodens" 2015. Available online: www.umweltbundesamt.de/publikationen/bodenzustand-in-deutschland (accessed on 1 September 2021).
  13. Energiebilanzen, A.G. Auswertungstabellen zur Energiebilanz für die Bundesrepublik Deutschland 1990 bis 2019 (Stand September 2020). Available online: https://www.ag-energiebilanzen.de/10-0-Auswertungstabellen.html (accessed on 1 September 2020).
  14. Statista 2020. Düngemittel: Verbrauch in der Landwirtschaft bis 2019|Statista. Available online: https://de.statista.com/statistik/daten/studie/161842/umfrage/verbrauch-ausgewaehlter-duenger-in-der-landwirtschaft-in-deutschland/ (accessed on 17 December 2020).
  15. Consultic Marketing & Industrieberatung GmbH. Produktion, Verarbeitung und Verwertung von Kunststoffen in Deutschland 2015-Kurzfassung. Available online: https://www.bvse.de/images/pdf/kunststoff/2016/161020_Consultic_Endbericht_2015_19_09_2016_Kurzfassung.pdf (accessed on 24 March 2022).
  16. Bertling, J.; Zimmermann, T.; Rödig, L. Kunststoffe in der Umwelt: Emissionen in landwirtschaftlich genutzte Böden. Tech. Rep. Fraunhofer Ges. 2021. Available online: https://publica.fraunhofer.de/eprints/urn_nbn_de_0011-n-6336116.pdf (accessed on 24 March 2022).
  17. Hübsch, H.; Adlwarth, W. Systematische Erfassung von Lebensmittelabfällen der Privaten Haushalte in Deutschland. In Schlussbericht der GfK Studie, durchgeführt von der GfK für das BMEL; 2017; Available online: https://Www.Bmel.De/Shar./Downloads/Ernaehrung/WvL/Stud._GfK.Pdf (accessed on 24 March 2022).
  18. Kegebein, J. Die Verwendung von Küchenabfallzerkleinerern (KAZ) aus Abwasser-und Abfallwirtschaftlicher Sicht; Verlag Siedlungswasserwirtschaft: Berlin/Heidelberg, Germany, 2006; ISBN 3980938352. [Google Scholar]
  19. Deutsche Gesellschaft für Ernährung. 13. DGE-Ernährungsbericht; Deutsche Ges. f. Ernährung: Bonn, Germany, 2017; ISBN 978-3-88749-256-4. [Google Scholar]
  20. Deutsches Institut für Normung e.V. Deutsche Einheitsverfahren zur Wasser-, Deutsche Einheitsverfahren zur Wasser-, Abwasser- und Schlammuntersuchung; Schlamm und Sedimente; Beuth Verlag GmbH: Berlin, Germany, 2021. [Google Scholar]
  21. Deutsches Institut für Normung e.V. Schlamm, Behandelter Bioabfall und Boden—Bestimmung des Gesamt-Stickstoffgehalts Mittels Trockener Verbrennung; Beuth Verlag GmbH: Berlin, Germany, 2021. [Google Scholar]
  22. Deutsches Institut für Normung e.V. Wasserbeschaffenheit—Anwendung der Induktiv Gekoppelten Plasma-Massenspektrometrie; Beuth Verlag GmbH: Berlin, Germany, 2021. [Google Scholar]
  23. Deutsches Institut für Normung e.V. Deutsche Einheitsverfahren zur Wasser-, Abwasser- und Schlammuntersuchung; Summarische Wirkungs- und Stoffkenngrößen; Beuth Verlag GmbH: Berlin, Germany, 2020. [Google Scholar]
  24. Verein Deutscher Ingenieure. VDI-Richtlinie: Vergärung Organischer Stoffe—Substratcharakterisierung, Probenahme, Stoffdatenerhebung, Gärversuche; Beuth Verlag Berlin: Berlin, Germany, 2014. [Google Scholar]
  25. BioAbfV, L. Verordnung über die Verwertung von Bioabfällen auf Landwirtschaftlich, Forstwirtschaftlich und Gärtnerisch Genutzten Böden (Bioabfallverordnung—BioAbfV). 1998. Available online: https://www.lanuv.nrw.de/fileadmin/lanuv/agrar/duengemittel/gesetzessammlung/2013_BioAbfV_leslicher_.pdf (accessed on 24 March 2022).
  26. Kranert, M. Einführung in die Kreislaufwirtschaft; Springer Fachmedien Wiesbaden: Wiesbaden, Germany, 2017; ISBN 978-3-8348-1837-9. [Google Scholar]
  27. Montag, D.; Gethke, K.; Wibke, E.; Pinnekamp, J. Nährstoff- und Schadstoffgehalte in Sekundärphosphaten. Available online: http://publications.rwth-aachen.de/record/98779?ln=de (accessed on 1 September 2021).
  28. Schulze-Rettmer, R.; Blank, R. Chemische Fällung von Ammonium mit Magnesiumphosphat unter Kreislaufführung des Fällmittels. Korresp. Abwasser 1992, 39, 550–559. [Google Scholar]
  29. Uhrig, T.; Zimmer, J.; Rankenhohn, F.; Steinmetz, H. Biopolymerproduktion aus Abwasser-strömen für eine kreislauforientierte Siedlungswasserwirtschaft. Wasser Und Abfall 2020, 13–18. [Google Scholar] [CrossRef]
  30. Bengtsson, S.; Werker, A.; Visser, C.; Korving, L. PHARIO: Stepping Stone to a Sustainable Value Chain for PHA Bioplastic Using Municipal Activated Sludge; STOWA: Amersfoort, The Netherlands, 2017. [Google Scholar]
  31. Rhu, D.H.; Lee, W.H.; Kim, J.Y.; Choi, E. Polyhydroxyalkanoate (PHA) production from waste. Water Sci. Technol. 2003, 48, 221–228. [Google Scholar] [CrossRef] [PubMed]
  32. Zhang, M.; Wu, H.; Chen, H. Coupling of polyhydroxyalkanoate production with volatile fatty acid from food wastes and excess sludge. Process Saf. Environ. Prot. Trans. Inst. Chem. Eng. Part B 2014, 92, 171–178. [Google Scholar] [CrossRef]
  33. Colombo, B.; Favini, F.; Scaglia, B.; Sciarria, T.P.; D’Imporzano, G.; Pognani, M.; Alekseeva, A.; Eisele, G.; Cosentino, C.; Adani, F. Enhanced polyhydroxyalkanoate (PHA) production from the organic fraction of municipal solid waste by using mixed microbial culture. Biotechnol. Biofuels 2017, 10, 201. [Google Scholar] [CrossRef] [PubMed]
  34. Joseph, B. Technical and Environmental Assessment of Energy and Material Production from Rural and Urban Residual Biomass. Ph.D. Thesis, University of Kassel, Kassel, Germany, 23 March 2020. [Google Scholar]
  35. Novotny, E.H.; Maia, C.M.B.d.F.; Carvalho, M.T.d.M.; Madari, B.E. Biochar: Pyrogenic carbon for agricultural use—A critical review. Rev. Bras. Ciênc. Solo 2015, 39, 321–344. [Google Scholar] [CrossRef] [Green Version]
  36. Antal, M.J.; Croiset, E.; Dai, X.; DeAlmeida, C.; Mok, W.S.-L.; Norberg, N.; Richard, J.-R.; Al Majthoub, M. High-yield biomass charcoal. Energy Fuels 1996, 10, 652–658. [Google Scholar] [CrossRef]
  37. Schmidt, H.-P. 55 Anwendungen von Pflanzenkohle. Ithaka J. 2012, 1, 9–102. [Google Scholar]
  38. Fachagentur Nachwachsende Rohstoffe e.V. Maisanbau in Deutschland. 2020. Available online: mediathek.fnr.de (accessed on 1 September 2021).
  39. Fachagentur Nachwachsende Rohstoffe e.V. Basisdaten Bioenergie Deutschland. 2018. Available online: www.fnr.de (accessed on 1 September 2021).
  40. Wendland, C. Anaerobic Digestion of Blackwater and Kitchen Refuse; Gesellschaft zur Förderung und Entwicklung der Umwelttechnologien an der Technischen Universität Hamburg-Harburg: Hamburg, Germany, 2008; ISBN 9783930400430. [Google Scholar]
  41. KTBL, F.N. Faustzahlen Biogas; Kuratorium für Technik und Bauwesen in der Landwirtschaft e.V: Darmstadt, Germany, 2007; Available online: www.ktbl.de (accessed on 1 September 2021).
  42. Bayrische Landesanstalt für Landwirtschaft. Biogasausbeuten Verschiedener Substrate. Available online: https://www.lfl.bayern.de/iba/energie/049711/?sel_list=1%2Cb&anker0=substratanker#substratanker (accessed on 5 January 2021).
  43. Knerr, H. Untersuchungen zur Zusammensetzung und zum Abbau von Schwarzwasser Mittels des Belebungsverfahrens sowie zur Kinetik des Heterotrophen und Autotrophen Stoffwechsels; Technische Universität Kaiserslautern: Kaiserslautern, Germany, 2012. [Google Scholar]
  44. Kranert, M.; Hafner, G.; Barabosz, J.; Schuller, H.; Leverenz, D.; Kölbig, A.; Schneider, F.; Lebersorger, S.; Scherhaufer, S. Ermittlung der Weggeworfenen Lebensmittelmengen und Vorschläge zur Verminderung der Wegwerfrate bei Lebensmitteln in Deutschland. Stud. Der Univ. Stuttg. (Gefördert Vom BMELV) Stuttgart. 2012. Available online: http://www.Bmelv.De/Shar./Downloads/Ernaehrung/WvL/Stud._Lebensm._Langfassung.Pdf (accessed on 24 March 2022).
  45. Pilsl, P. Vergärung von Grünabfall in Baden-Württemberg—Potenzial und Realistische Einschätzung. Masterarbeit; Universität Stuttgart: Stuttgart, Germany, 2014. [Google Scholar]
  46. Fricke, K.; Heußner, C.; Hüttner, A.; Turk, T.; Bauer, W.; Bidlingmaier, W. Vergärung von Bio-und Grünabfällen, Teil 1: Ausbaupotenzial bei der Vergärung von Bio-und Grünabfällen. Müll Und Abfall 2013, 12, 628–635. [Google Scholar]
  47. Umweltbundesamt. Aufwand und Nutzen einer optimierten Bioabfallverwertung hinsichtlich Energieeffizienz, Klima-und Ressourcenschutz; Umweltbundesamt: Dessau-Roßlau, Germany, 2010.
  48. BW, U.M. Ministerium für Umwelt, Klima und Energiewirtschaft Baden-Württemberg. Phosphor-Rückgewinnungsstrategie Baden-Württemberg; Ministerium für Umwelt, Klima und Energiewirtschaft: Stuttgart, Germany, 2012.
  49. Kumar, M.; Ou, Y.-L.; Lin, J.-G. Co-composting of green waste and food waste at low C/N ratio. Waste Manag. 2010, 30, 602–609. [Google Scholar] [CrossRef]
  50. Otterpohl, R.; Oldenburg, M. Innovative Technologien zur Abwasserbehandlung in urbanen Gebieten. Korresp. Abwasser 2002, 49, 1364–1371. [Google Scholar]
  51. Vinnerås, B.; Palmquist, H.; Balmér, P.; Jönsson, H. The characteristics of household wastewater and biodegradable solid waste—A proposal for new Swedish design values. Urban Water J. 2006, 3, 3–11. [Google Scholar] [CrossRef]
  52. Bolzonella, D.; Pavan, P.; Battistoni, P.; Cecchi, F. The under sink garbage grinder: A friendly technology for the environment. Environ. Technol. 2003, 24, 349–359. [Google Scholar] [CrossRef] [PubMed]
  53. Antony, D.; Murugavelh, S. Anaerobic co-digestion of kitchen waste and wastewater sludge: Biogas-based power generation. Biofuels 2018, 9, 157–162. [Google Scholar] [CrossRef]
  54. LUBW Landesanstalt für Umwelt Baden-Württemberg; Bundesgütegemeinschaft Kompost. Sortenreinheit von Bioabfällen: Datenerhebung am Beispiel Zweier Öffentlich-Rechtlicher Entsorgungsträger Baden-Württemberg; Stand: April, 2018; LUBW Landesanstalt für Umwelt Baden-Württemberg: Karlsruhe, Germany; BGK Bundesgütegemeinschaft Kompost e.V: Köln, Germany, 2018; ISBN 978-3-88251-402-5. [Google Scholar]
  55. Tervahauta, T.; Rani, S.; Hernández Leal, L.; Buisman, C.J.N.; Zeeman, G. Black water sludge reuse in agriculture: Are heavy metals a problem? J. Hazard. Mater. 2014, 274, 229–236. [Google Scholar] [CrossRef] [PubMed]
  56. Bernstad, A.; Davidsson, Å.; Tsai, J.; Persson, E.; Bissmont, M.; La Cour Jansen, J. Tank-connected food waste disposer systems–Current status and potential improvements. Waste Manag. 2013, 33, 193–203. [Google Scholar] [CrossRef]
  57. Fachverband Biogas. Biogas aus Bioabfall. Available online: https://www.biogas.org/edcom/webfvb.nsf/id/DE-biowaste-to-biogas_deu (accessed on 11 September 2020).
  58. Wang, H.; Li, Z.; Zhou, X.; Wang, X.; Zuo, S. Anaerobic Co-Digestion of Kitchen Waste and Blackwater for Different Practical Application Scenarios in Decentralized Scale: From Wastes to Energy Recovery. Water 2020, 12, 2556. [Google Scholar] [CrossRef]
  59. Lebiocka, M.; Piotrowicz, A. Co-digestion of sewage sludge and organic fraction of municipal solid waste. A comparison between laboratory and technical scales. Environ. Prot. Eng. 2012, 38, 157–162. [Google Scholar] [CrossRef]
  60. Minale, M.; Worku, T. Anaerobic co-digestion of sanitary wastewater and kitchen solid waste for biogas and fertilizer production under ambient temperature: Waste generated from condominium house. Int. J. Environ. Sci. Technol. 2014, 11, 509–516. [Google Scholar] [CrossRef] [Green Version]
  61. Mu, L.; Zhang, L.; Zhu, K.; Ma, J.; Ifran, M.; Li, A. Anaerobic co-digestion of sewage sludge, food waste and yard waste: Synergistic enhancement on process stability and biogas production. Sci. Total Environ. 2020, 704, 135429. [Google Scholar] [CrossRef]
  62. Paritosh, K.; Mathur, S.; Pareek, N.; Vivekanand, V. Feasibility study of waste (d) potential: Co-digestion of organic wastes, synergistic effect and kinetics of biogas production. Int. J. Environ. Sci. Technol. 2018, 15, 1009–1018. [Google Scholar] [CrossRef]
  63. Ghosh, P.; Kumar, M.; Kapoor, R.; Kumar, S.S.; Singh, L.; Vijay, V.; Vijay, V.K.; Kumar, V.; Thakur, I.S. Enhanced biogas production from municipal solid waste via co-digestion with sewage sludge and metabolic pathway analysis. Bioresour. Technol. 2020, 296, 122275. [Google Scholar] [CrossRef] [PubMed]
  64. Han, W.; Zhao, Y.; Chen, H. Study on Biogas Production of Joint Anaerobic Digestion with Excess Sludge and Kitchen Waste. Procedia Environ. Sci. 2016, 35, 756–762. [Google Scholar] [CrossRef]
  65. Forstfachverlag GmbH & Co. KG. Energie Aus Pflanzen; Forstfachverlag GmbH & Co. KG: Scheeßel, Germany, 2018. [Google Scholar]
  66. Tasnim, F.; Iqbal, S.A.; Chowdhury, A.R. Biogas production from anaerobic co-digestion of cow manure with kitchen waste and Water Hyacinth. Renew. Energy 2017, 109, 434–439. [Google Scholar] [CrossRef]
Figure 1. Concept 1 of a rural urban nutrient partnership (RUN), as an example for short circular economy. The focus is on the products design fertilizer, plant charcoal and biopolymers [10]. Further-more, biogas is considered (concept 2 and 3) and the resource of wild plants (concept 3) which cannot be found in this figure.
Sustainability 14 05277 g001
Figure 2. Considered concepts with system boundaries (b) and abbreviations for the resources and their mixtures (a).
Sustainability 14 05277 g002aSustainability 14 05277 g002b
Figure 3. Kitchen waste fractions in percent used for investigations.
Sustainability 14 05277 g003
Figure 4. Amount of biogas production in lN per kg volatile solids after 21 days of biogas in (a) and (c) and CH4 in (b,d) all per kg VS. (a,b) show concept 2 and (c,d) concept 3, the combination of wild plants with kitchen waste. BW: black water; KW: kitchen waste; GW: green waste; M2: BW 96%% + KW 3% + GWD 1%; M1: BW 97% + KW 3%; WP: wild plants; WM1: WP 75% + KW 25%; WM2: WP 50% + KW 50%; and WM3: WP 25% + KW 75%. The corn yield is shown for comparison with red cross lines, which shows 350 lN methane/kg VS. “*” stands for multiplication.
Sustainability 14 05277 g004
Figure 5. Substitution potential of concept 2 for conventional energy consumption through degradable household secondary resources per person and year in Germany. The percentage refers to the energy, calculated with kWh.
Sustainability 14 05277 g005
Figure 6. Substitution potential of concept 3 for conventional energy consumption by wild plants and the combination with the total kitchen waste incurred per person and year in three different mixtures with an additional 75% wild plants (WM1), 50% wild plants (WM2) and 25% wild plants (WM3). The biogas corn area, which could be replaced by the cultivation of these wild plants, is also visible. All values relate to production and consumption (in a figurative sense) for one person and one year in Germany. The percentage refers to the energy, calculated with kWh, and to the area, calculated with ha.
Sustainability 14 05277 g006
Figure 7. Substitution potential of concept 1 for conventional products by degradable household secondary resources per person and year in Germany. The percentage refers to the weight, calculated in kg.
Sustainability 14 05277 g007
Table 1. Amounts of selected consumption of plastic, energy (electricity), fertilizer and potential plant charcoal application transferred to the functional unit per person and year (p·a), as the amount of consumption per person and year in Germany (calculated with 83.1 Mio inhabitants).
t·a−1kg·(p·a)−1kWh·(p·a)−1
Final energy consumption in private households [13]--1508
Fertilizer consumption of phosphorus [14]92,0001-
Fertilizer consumption of nitrogen [14]134,40016-
Fertilizer consumption of potassium [14]34,3005-
Estimated application for plant charcoal on soil, threatened by erosion [12]16,366,420197-
Agricultural plastic consumption [15,16]1,100,00013-
Table 2. Quality (analyzed values) and quantity (calculated per functional unit) of the considered waste streams. Shown are mass balances of (a) various parameters for potential product calculations (b) and heavy metal contents to identify possible disruptive properties in comparison to the limits of the Biowaste Ordinance (noted as limit) (c).
(a)
ResourcesFresh MatterDry MatterWater ContentVolatile Solids
kg·(p·a)−1%%%
BW2376.2 [43]0.9 ± 0.199.1 ± 0.181.8 ± 2.1
KW62.1 [44]29.4 ± 3.470.6 ± 3.492.6 ± 3.8
GWD31.0 [26,45,46,47]15.7 ± 0.784.30 ± 0.791.0 ± 0.9
GWW31.0 [26,45,46,47]85.0 ± 0.315.0 ± 0.395.0 ± 0.6
GW62.1 [47,48]50.3 ± 3.549.7 ± 3.594.4 ± 0.3
M12438.2 *1.6 ± 0.198.4 ± 0.182.19 ± 0.2
M22469.2 *1.8 ± 0.198.2 ± 0.282.08 ± 0.2
M32500.6 *2.8 ± 2.297.2 ± 2.290.1 ± 2.1
WP-35.2 ± 0.264.8 ± 0.291.9 ± 0.7
(b)
ResourcesUnitTotal PhosphorusTotal NitrogenPotassiumMagnesiumCarbon Oxygen Demand
BWg·(kg DM)−113.9 ± 1.195 ± 17.141.0 ± 7.83.1 ± 0.31396.0 ± 108.7
g·(p·a)−1297.0 ± 22.82031.6 ± 366.7876.8 ± 166.666.5 ± 5.429,853.9 ± 2324.5
KWg·(kg DM)−11.6 ± 0.421.7 ± 1.711.6 ± 0.41.4 ± 0.21520.0 ± 24.5
g·(p·a)−129.0 ± 7.8395.9 ± 31.8212.3 ± 7.625.2 ± 4.627,728.9 ± 446.9
GWDg·(kg DM)−13.9 ± 1.846.4 ± 0.737.1 ± 2.21.8 ± 0.1111.5 ± 9.0
g·(p·a)−119.1 ± 8.8226.0 ± 3.2180.8 ± 10.99.0 ± 0.5542.9 ± 43.8
GWWg·(kg DM)−10.7 ± 0.311.0 ± 0.12.4 ± 0.11.0 ± 0.21070.0 ± 17.7
g·(p·a)−119.7 ± 8.0290.1 ± 3.364.1 ± 2.226.5 ± 5.728,217.2 ± 1005.2
GWg·(kg DM)−11.5 ± 0.430.7 ± 2.46.3 ± 1.31.7 ± 1.0710.5 ± 32.2
g·(p·a)−147.8 ± 14.0959.1 ± 74.3197.1 ± 40.054.4 ± 30.722,197.3 ± 1005.2
M1 *g·(kg DM)−113.6 ± 1.093.1 ± 16.840.2 ± 7.63.1 ± 0.31366.9 ± 106.2
g·(p·a)−1326.0 ± 30.62427.5 ± 398.51089.1 ± 174.291.7 ± 10.034,606.9 ± 2533.57
M2 *g·(kg DM)−113.5 ± 1.192.5 ± 16.540.2 ± 7.53.1 ± 0.31351.0 ± 105.0
g·(p·a)−1345.1 ± 39.42653.5 ± 401.71270.0 ± 185.1100.7 ± 10.535,149.8 ± 2577.4
M3 *g·(kg DM)−113.3 ± 1.091.6 ± 16.439.4 ± 7.43.0 ± 0.31350.5 ± 104.4
g·(p·a)−1373.8 ± 44.73386.8 ± 472.91286.3 ± 214.2146.5 ± 40.756,804.2 ± 3538.8
WPg·(kg DM)−12.4 ± 0.312.7 ± 0.622.2 ± 0.81.7 ± 0.3151.7 ± 1.2
(c)
ResourcesUnitPlumbCadmiumChromiumCopperNickelZinc
BWmg·(kg DM)−1<0.036<0.00270.04 ± 0.00.2 ± 0.0<0.0270.4 ± 0.1
mg·(p·a)−1<0.8<0.060.9 ± 0.13.2 ± 0.8<0.69.2 ± 1.8
KWmg·(kg DM)−10.5 ± 0.10.04 ± 0.01.3 ± 0.319.8 ± 0.82.9 ± 0.427.0 ± 2.2
mg·(p·a)−19.7 ± 0.90.7 ± 0.323.0 ± 4.8361.2 ± 13.752.7 ± 7.7492.6 ± 39.4
GWDmg·(kg DM)−11.2 ± 0.10.1 ± 0.02.6 ± 0.518.8 ± 1.03.8 ± 0.598.6 ± 3.0
mg·(p·a)−16.0 ± 0.40.6 ± 0.112.6 ± 2.391.6 ± 5.018.4 ± 2.5480.3 ± 14.5
GWWmg·(kg DM)−10.3 ± 0.00.02 ± 0.00.5 ± 0.15.7 ± 0.60.4 ± 0.21.3 ± 0.4
mg·(p·a)−17.2 ± 0.30.6 ± 0.513.8 ± 3.3149.8 ± 15.311.4 ± 4.333.2 ± 10.5
GWmg·(kg DM)−10.4 ± 0.00.3 ± 0.01.3 ± 0.27.7 ± 1.41.1 ± 0.325.2 ± 1.2
mg·(p·a)−112.7 ± 0.38.8 ± 1.140.3 ± 7.2239.9 ± 43.234.1 ± 8.7787.3 ± 38.9
M1 *mg·(kg DM)−10.1 ± 0.00.004 ± 0.00.1 ± 0.00.7 ± 0.10.1 ± 0.01.1 ± 0.1
mg·(p·a)−110.4 ± 0.90.7 ± 0.323.9 ± 4.9364.4 ± 14.553.3 ± 7.7501.8 ± 41.2
M2 *mg·(kg DM)−10.1 ± 0.00.005 ± 0.00.1 ± 0.00.9 ± 0.10.2 ± 0.02.4 ± 0.2
mg·(p·a)−116.4 ± 1.41.3 ± 0.436.4 ± 7.1456.0 ± 19.571.7 ± 10.2982.0 ± 55.7
M3 *g·(kg DM)−10.1 ± 0.00.01 ± 0.00.1 ± 0.00.8 ± 0.10.1 ± 0.01.7 ± 0.2
g·(p·a)−123.1 ± 1.29.5 ± 1.464.2 ± 12.0604.4 ± 57.687.4 ± 16.41289.1 ± 80.1
WPg·(kg DM)−10.7 ± 0.10.3 ± 0.03.2 ± 0.28.5 ± 0.323.0 ± 1.238.6 ± 2.0
Limitmg·(kg DM)−1150.01.5100.0100.050.0400.0
The functional unit per person and year is visible as “p·a” and dry matter as “DM”. Black water (BW); kitchen waste (KW); green waste—easy degradable (GWD); green waste—woody (GWW); total amount of green waste (GW); mixture of BW (97%) and KW (3%) (M1); mixture of BW (96%), KW (3%) and GWD (1%) (M2); mixture of BW (95%), KW (2,5%) and GW (2.5%) (M3); and wild plants (WP). Own analysis and literature values are shown and, if noted with “*”, a calculation of these two. Values with less than signs “<” are below the limit of determination. All analyzed values are scaled to the functional unit per person and year in kg or g·(p·a)−1. Standard deviation of the mean values n = 3 is noted for all analyzed values.
Table 3. Potential of waste streams for reuse as biogas, PHA polymers, MAP fertilizer and plant charcoal.
BWKWGWDGWM1M2M3
BiogaskWh·(p·a)−161681.89-141174-
MAP recyclingg P·(p·a)−1 [27]1491410-163173-
g Mg·(p·a)−1113117-128135-
% Mg from inflow1174586-140135-
g N·(p·a)−16774-7478-
% N from inflow322-33-
Plant charcoalkg·(p·a)−1---9.37- 21
Polymerskg PHA·(p·a)−11.03 [29]1.40 [31]0.03 [31]-2.432.46-
The functional unit per person and year is visible as “p·a”. Black water (BW); kitchen waste (KW); green waste—easy degradable (GWD); total amount of green waste (GW); mixture of BW (97%) and KW (3%) (M1); mixture of BW (96%), KW (3%) and GWD (1%) (M2); mixture of BW (95%), KW (2.5%) and GW (2.5%) (M3). All the values are derived from Table 1 and Table 2, combined with calculations mentioned in the text.
Publisher’s Note: MDPI stays neutral with regard to jurisdictional claims in published maps and institutional affiliations.

