Article

Decoupling of Water Production and Electricity Generation from GDP and Population in the Gulf Cooperation Council (GCC) Countries

Department of Urban Engineering, Graduate School of Engineering, The University of Tokyo, 7-3-1 Hongo, Bunkyo-Ku, Tokyo 113-8654, Japan
*
Author to whom correspondence should be addressed.
Sustainability 2022, 14(9), 5386; https://doi.org/10.3390/su14095386
Submission received: 11 March 2022 / Revised: 16 April 2022 / Accepted: 26 April 2022 / Published: 29 April 2022

Abstract

:
Although the Gulf Cooperation Council (GCC) countries are in an arid region with limited water resources, the per capita water and electricity consumptions are high, at 560 L/capita/day and 7000–18,000 kWh/year, respectively. Although macroscale parameters (e.g., GDP and population) have been assumed to be correlated with water and electricity demand, this study aims to verify whether this assumption still holds true. As opposed to the previous literature, this study reveals that, although water production and electricity generation had been correlated with GDP and population for years, they have been decoupled from these macroscale parameters since 2015. Such decoupling can be explained by the three phases of economic development. In the initial stage, GDP and population growth promoted rapid increases in water and electricity demands, which came down in the second stage as the consumers became satisfied with water and electricity supplies. In the third stage, the water and electricity demands were decoupled from GDP and population due to demand-management policies for environmental protection and cost saving, combined with consumers’ efforts, such as water-saving faucets and energy efficiency in homes, which indicates that microscale parameters have become more influential on water and electricity demands than macroscale parameters.

1. Introduction

One of the main challenges that humankind is facing is the scarcity of water, energy resources, and food due to the rapid population and economic growth and urbanization, as well as climate change [1,2,3,4]. The world population is expected to reach 9.7 billion by 2050 [1]; it was estimated that the global population facing severe water scarcity will increase from 40% today to 60% by 2025 [5]. Additionally, 66% of the global population (4 billion) currently lives in conditions of severe water scarcity for at least 1 month per year [6]. Many arid regions and water-stressed countries depend mainly on nonconventional water resources, such as desalination plants, to meet their growing water demand [7,8,9]. In February 2020, the total number of new desalination plants contracted and installed worldwide was 155, providing an additional installed capacity of 5.2 million m3/d, the cumulative total accumulative capacity being 114.9 million m3/d [10]. In April 2020, the total net electricity production globally was 747.2 TWh [11], of which only 48.7% was generated by renewable energy, including mainly nuclear energy and hydropower [11].
The Gulf Cooperation Council (GCC) countries include Bahrain, Kuwait, Qatar, Oman, the Kingdom of Saudi Arabia (KSA), and the United Arab Emirates (UAE) [12]. All these countries share very similar values, cultures, and economies, which rely on weighty revenue from fossil fuel [12]. Across the GCC countries, foreign nationals represent 51% of the total population, with particularly high expatriate rates in the UAE (89%), Qatar (86%), and Kuwait (70%) [12]. The GCC countries are in an arid region with limited natural water resources and thus are highly dependent on desalination plants to cater to their growing water demand [1,13,14]. The annual per capita water consumption in the GCC countries was reported to be high at 560 L/capita/day (LPCD), compared with the world average of 180 LPCD [1]. The annual electricity consumption per capita in the GCC countries is between 7000 and 18,000 kWh, whereas the global average was approximately 3000 kWh in 2018 [12]. The average growth rate of electricity consumption per capita for the GCC countries in the period of 1971–2012 was 6.2% [15]. The electricity consumption in residential buildings is now 43% of the total electricity consumption in the GCC countries, and air-conditioning systems are the largest electricity consumer [12].
The production of water and power is commonly undertaken by independent water and power projects (IWPPs) [16]. The collective desalination production capacity of the GCC countries is more than 60% of the world’s total capacity, with the majority of this capacity installed in the KSA (36.4%) and UAE (34.4%) [1]. Desalination is a capital-intensive industry. The total investment in the desalination sector in the GCC countries was estimated to be USD 16–20 billion in the last 2 decades, which is expected to reach USD 60 billion by 2050 [1]. The GCC countries produce around 40% of global oil and 20% of natural gas reserves [1,13,17]. Hence, they depend on fossil fuels to produce fresh water and electricity (cogeneration) through desalination plants [18,19,20]. This reliance is economically unsustainable and may lead to destabilization of the economy [18,19].
Globally in 2019, approximately 80% of the consumed energy was from conventional fuels, which is the primary cause of environmental problems, including global warming [12]. The environmental impact of water and electricity production in the GCC is huge, especially CO2 emission and influence on the marine ecosystems, and the financial burden has been increasing. The energy consumption for desalination in the UAE is about 20% of their total energy production, followed by 13% in Qatar; 8% in Kuwait, Oman, and Bahrain; and 7% in Saudi Arabia [1]. Global warming gas emissions from desalination systems powered by fossil fuels are expected to exceed an annual rate of 400 million tons of carbon equivalent by 2050 [21]. The GCC countries rank among the top 25 nations for the largest CO2 emissions per capita in the world [13,22]. Three of the GCC countries, Saudi Arabia, the UAE, and Qatar, have already been identified as the largest per capita CO2 emitters in the world [17,18].
A recent study investigated the impact of oil price, economic growth, and urbanization on CO2 emissions in GCC countries in 1980–2019 using a nonlinear autoregressive distributive lag cointegration approach; however, the influence of economic growth and urbanization on water and electricity demand was not reported [23]. It has been known that both macroscale parameters, such as gross domestic product (GDP) and population, and microscale parameters, such as housing heat insulation, water-saving showerheads, and energy-efficient electric devices, influence water and electricity consumptions [24]. The preceding studies in the following literature review section suggest that there is a need for re-examining the relationship between these macroscale parameters and water and electricity demands for a more accurate prediction of the future demands. Additionally, the previous studies have not clearly explained the influence of these macroscale parameters on water and electricity demand in the GCC countries. Therefore, this study aimed to reveal the relationship between macroscale parameters, such as population and GDP, and water and electricity demand in the GCC countries based on GDP, population, electricity generation, and water production in the last 2 decades. The effects of oil price and the numbers of electricity and water supply connections and the demands of the national and the expat are also analyzed.

2. Literature Review

Although it has been considered to be a policy priority to meet the increasing demand for power and water, it is necessary for all the GCC countries to turn around from supply-side management (SSM: optimizing the supply to meet the required demand) to demand-side management (DSM: managing energy use, including energy efficiency and demand response) [25]. A study on the energy challenges in the GCC proposed the need for reforms, such as regulation and policies for energy efficiency, electrical energy price reform, demand-side management, renewable energy, smart grid, and raising awareness of energy consumption and efficiency [26]. Any reduction in water and electricity consumptions not only reduces CO2 emission, but also saves fossil fuel that can be exported to generate revenue to the GCC countries [27].
However, in the GCC countries, demand-side management has not yet been successfully implemented to reduce the water and electricity demands [14]. Tariffs in the GCC countries are significantly different from the actual production costs of water and electricity, as both are highly subsidized [28,29]. In addition, the cultural barriers and low awareness among the residents are one of the major causes of the GCC nations’ significant increase in water and energy demand [13,30,31]. Removal of high subsidies requires social and political considerations [28] because the GCC countries’ wealth has created a culture in which citizens regard free energy and water to be a birthright [14,29]. However, high subsidies lead to elevated resource consumption [28,29]. Although increases in water and electricity tariffs may decrease usage by a considerable amount [27], it should be confirmed with GCC countries because the tariff reform in 2015 in UAE/Abu Dhabi was reported to have had no discernible effect on per capita water consumption [32].
In 1993, the first classification of energy system models distinguishing between top–down and bottom–up approaches was proposed [33]. Demand forecast models generally follow one of these two approaches [34]. Bottom–up models (ESOMs: energy system optimization models) are often better suited to identify technical options and the associated investments and fuel costs, but do not incorporate the impacts on the overall (macro) economy [35]. On the other hand, top–down (CGE: computable general equilibrium) models are generally better suited to investigate overall economic impacts, such as GDP growth rates and structural change [35]. A typical top–down approach (the macroeconomic tradition) focuses on market interactions within the whole economy and has little technological detail in the energy sector [36]. A typical bottom–up approach (the engineering tradition) focuses on the substitutability of individual energy technologies and their relative costs [36].
The two modelling approaches may generate diverging estimates of the economic impacts of climate policy and of emission reduction potentials due to their differences [35]. In 2006, a classification of energy models with a focus on the difference between bottom–up and top–down models was recommended, and the need for hybrid integrated models was highlighted [37]. The combined approaches are typically referred to as hybrid models [35]. An increasing number of hybrid models have emerged, which aim at combining the advantages of both perspectives by linking macroeconomic and technological model components [36]. As it is important to develop a suitable model to forecast water and electricity demands to help decision makers [38], understanding the drivers of water and electricity demand has become increasingly important [38].
In general, the GCC region has high-energy consumption influenced by a number of factors, such as population and GDP [24]. However, there are only a few published studies attempting to model residential electricity demand for the GCC countries [39]. A study to forecast the electrical long-term peak load demand for the GCC countries reported that the adaptive neuro-fuzzy inference system (ANFIS) and multiple linear regression (MLR) methods were useful for developing models using population and GDP [24]. A review paper analyzed different electricity demand and supply issues in GCC countries using seven quantitative analytical tools [39]. A long short-term memory model forecasting the water demand in the UAE, using data on population, temperature, rainfall, humidity, the consumer price index (CPI), and GDP [40], showed a decreasing trend from 1821 million m3 in 2018 to 1809.9 million m3 in 2027 [40]. These results might be because the water demand had been increasing from 2007 till 2015, but started to decrease the following 2 years, although CPI, GDP, and population were increasing [40].
Another study used the vector error correction model (VECM) to understand the key factors affecting Jordan electricity consumption, and the results showed that GDP, urbanization, structure of economy, and aggregate water consumption are significantly and positively related to electricity consumption [41]. However, the population showed a significant positive effect on electricity consumption in the short run [41]. A study on the main driving factors for water and energy consumption showed that the growth of population and GDP per capita were dominant factors driving water and energy consumption [42]. In Qatar, a study analyzed the nexus between electricity consumption, population growth, and GDP growth, and the observation showed that a coupling between the variables will continue for decades and will have consequences on the growth and development paths of the country [43]. Demographic drivers comprise changes in the overall characteristics of the urban population that affect resource consumption patterns [44]. Population size was the only factor found to represent such a driver [44]. The utmost frequent finding is increasing total consumption of both water and energy with increasing population size [44,45,46,47,48,49,50,51]. However, a study showed that this is not always the case, and the findings of the study suggested that with increasing population size, consumption of natural gas and electricity per capita actually decreases [52].
Economic drivers include changes in the economic domain of a city, namely, in its system of production and exchange of goods and services, that influence resource consumption patterns [44]. There are studies showing that water and energy consumption increase when GDP increases [44,46,51,53]. However, another study showed opposite findings [44,54]. Stockholm fuel consumption decreased to 63% of the 1996 fuel consumption level in 2011, despite a population increase of 20% and GDP growth [44,54], hence concluding that decoupling of resource consumption and economic growth took place [44,54].

3. Materials and Methods

3.1. Study Areas: GCC, KSA, UAE, and the Emirate of Abu Dhabi

The GCC countries have a total area of 2,672,700 km2 [12], with a total population of around 57,100,000 in 2019 [55]. The KSA was founded on 23 September 1932, with a total area of 2,000,000 km2, and the population in 2019 was 34,200,000 [55]. The UAE was established on 2 December 1971, with a total area of 83,600 km2, and the population in 2019 was 9,500,000 [55,56]. The KSA and the UAE are the economic powerhouses of the GCC countries, and together account for around 70% of its gross domestic product (GDP) and 80% of its population [38]; hence this study will focus on these two countries. The emirate of Abu Dhabi (hereafter called Abu Dhabi) is the capital of the UAE and the largest emirate with an area of 67,340 km2 [57]. Water and power production is undertaken by independent water and power project (IWPP) companies [16]. Abu Dhabi has five IWPP plants with a total water production capacity of 4.14 million m3/day (910 million imperial gallons per day (MIGD)), and the total capacity of electricity generation was 16,701 gross MW in 2020 [58]. The water production and electricity generation are driven by the water and electricity consumptions. Hence, to have a better understanding of the macroscale parameters, the water and electricity consumptions will be analyzed; however, due to a lack of accessibility to GCC detailed consumption data, water production and electricity generation are analyzed in this study for the GCC countries KSA, UAE, and Abu Dhabi. Additionally, the water and electricity consumptions for Abu Dhabi are analyzed.

3.2. Influencing Factors of Water Production and Electricity Generation—Abu Dhabi

The water production and electricity generation data in 1999–2020 were obtained from the 2019 EWEC statistical report and the 2020 leaflet [58,59]. The demographic data for 2010–2016 and 2017–2020 were supplied by Statistics Centre Abu Dhabi (SCAD) and the Emirates Water and Electricity Company (EWEC), respectively [60,61]. The gross domestic product (GDP) data in 2001–2019 were obtained from SCAD [62]. The crude oil price data from 1999 to 2021 were obtained from the Statista website [63]. The relationships between GDP, oil price, water production, and electricity generation are analyzed in this study. The natural gas price data on natural gas spot prices in 1999–2021 were supplied by Henry Hub [64]. Abu Dhabi IWPPs are using natural gas as the main fuel to produce water and electricity. The fuel consumption data for the production in 1999–2020 were obtained from the EWEC statistical report [55]. Hence, the yearly total fuel cost in US dollars for the water and electricity production is calculated by multiplying the fuel consumption (MMBTu) by the natural gas price (USD/MMBTu).

3.3. Trend Analysis of Water and Electricity Consumptions—Abu Dhabi

The Abu Dhabi Distribution Company (ADDC) provided data on water and electricity consumptions and the number of connections for each water user category (residential, commercial, government, agriculture, and industrial) and each electricity user category (residential, commercial/government/agriculture, industrial, Emirates Steel Industry (ESI), and Abu Dhabi National Oil Company (ADNOC)) from 2010 to 2020 [65,66]. The demographic data for 2010–2020 were provided by SCAD and EWEC [60,61]. Water and electricity consumptions in each category were examined to determine their comparative ratios. Since the residential water consumption category was found to be the highest among all categories, at ~47%, and the second highest category in electricity consumption, at ~22%, it was further analyzed in this study.
There are three types of residential categories: (1) nationals, who are the local people (Emiratis); (2) expats, who are nonlocal residents working in Abu Dhabi; and (3) the exempt, who are individuals spared from paying the water and electricity tariff. They can be either nationals or expats. Abu Dhabi used to comprise around 90% expats and only 10% nationals [30]. Nationals usually live in villas with their entire extended families; thus, the number of individuals per home was high, at around 14–20 persons [32]. However, over the last decade, young national families have increasingly preferred to live by themselves in their own smaller villas; hence, the number of persons per home has decreased [32]. On the other hand, expats usually live alone—or in a group, to share the cost of an apartment/flat that is smaller than a villa [32]. However, since the population of the exempt was not disclosed, per capita water consumption for this category was not calculated.

3.4. GDP, Water Production, and Electricity Generation—Comparison between UAE and KSA

The electricity generation data between 2003 and 2017 for the KSA and UAE were obtained from different sources: the GCC energy statistical data, the Organization of Arab Petroleum Exporting Countries (OAPEC) annual statistical report, and the EIA database [67,68,69]. The water production data for these countries during the aforementioned period were obtained from the GCC water statistical data [70]. The GDP data for the KSA and UAE in 2003–2017 were supplied from two sources: the GCC national account and the World Bank database [71,72]. The petroleum and other liquid productions for each country were obtained from the EIA database [73]. The population data for each country were used from the GCC population statistic [55]. The relationship between the GDPs of the UAE and KSA and the water production and electricity generation was also analyzed. GDP per capita, water consumption per capita, and electricity consumption per capita for each country were calculated by dividing GDP, water production, and electricity generation by population.

4. Results

4.1. Influencing Factors on Water and Electricity Demand in Abu Dhabi

Figure 1a,b shows how GDP relates to the water production and the electricity generation, respectively, in Abu Dhabi between 2001 and 2019. As shown in this figure, the water production and electricity generation increased linearly with GDP in three distinct phases, namely, rapid increase in water production and slow increase in electricity generation in 2001–2006, slow increase in water production and rapid increase in electricity generation in 2007–2014, and then a very slow or no-increase phase after 2015. Thus, it is clear that the water production and electricity generation have been decoupled from GDP since 2015. Therefore, in order to predict future power and water demands, it is important to find the causes of the decoupling that took place in Abu Dhabi in 2015.
Figure 2 shows the relationship between population and the water production and electricity generation in Abu Dhabi (1999–2020). The water production showed three phases in the last 2 decades (Figure 2a). In the first phase (1999–2006), water consumption increased rapidly in correlation with the population growth. In the second phase (2007–2014), the increasing rate of water production decreased; in the third phase (2015–2020), the water production decreased for the first time, which indicated the decoupling of water production from the population since 2015. Figure 2b shows that the electricity generation is linearly correlated with the population throughout the entire period of 1999–2020, which was different from GDP (Figure 1b). However, the growth rates were significantly smaller after 2015 than those between 2007 and 2014.
Figure 3 shows the relationship between oil price and GDP in Abu Dhabi since 2001; the GDP in Abu Dhabi increased linearly with the oil price increase until 2011. Although the oil production has increased only by 60% in UAE, most of which was produced in Abu Dhabi, GDP increased fourfold during the same period (Appendix B, Figure A1); therefore, oil price had more influence on GDP rather than oil production. Hence, when the oil price dropped in 2009 and 2015, GDP also plummeted. Then, both GDP and oil price increased from 2009 to 2011, getting back to the linear increasing trend. However, between 2011 and 2014, although oil price decreased by 11.0% from 111.26 USD/barrel to 98.97 USD/barrel in 2014, and the production increased by 10.2% from 3214 Mb/d in 2011 to 3542 Mb/d, GDP increased during the same period, which indicates a decoupling between oil price and GDP, possibly due to the Abu Dhabi government’s policy to transform the economy to be less dependent on oil sales [74,75].
In Abu Dhabi, natural gas is used as the main fuel for electricity generation and water production. Figure 4 shows the natural gas price, the fuel cost, and the total fuel consumption for electricity and water production. The fuel cost increased until 2008 due to increasing fuel consumption and the natural gas price. However, the natural gas price plunged significantly in 2009, and the following years, the fuel cost dropped only in 2009 but has not decreased much because fuel consumption continued to increase until 2015. Based on the average natural gas price of 3.81 USD/MMBTu in January 2021 [76] and the fuel consumption of 782,755,804 MMBTu in December 2020, fuel cost is expected to increase again to USD 2.98 billion, which is 1.87 times higher than USD 1.59 billion in December 2020 when the natural gas price was 2.03 USD/MMBTu [63]. The high volatility of the natural gas price undermines the sustainable management of the water and electricity supply, which could also lead to an economic crisis in Abu Dhabi if the natural gas price will further increase.

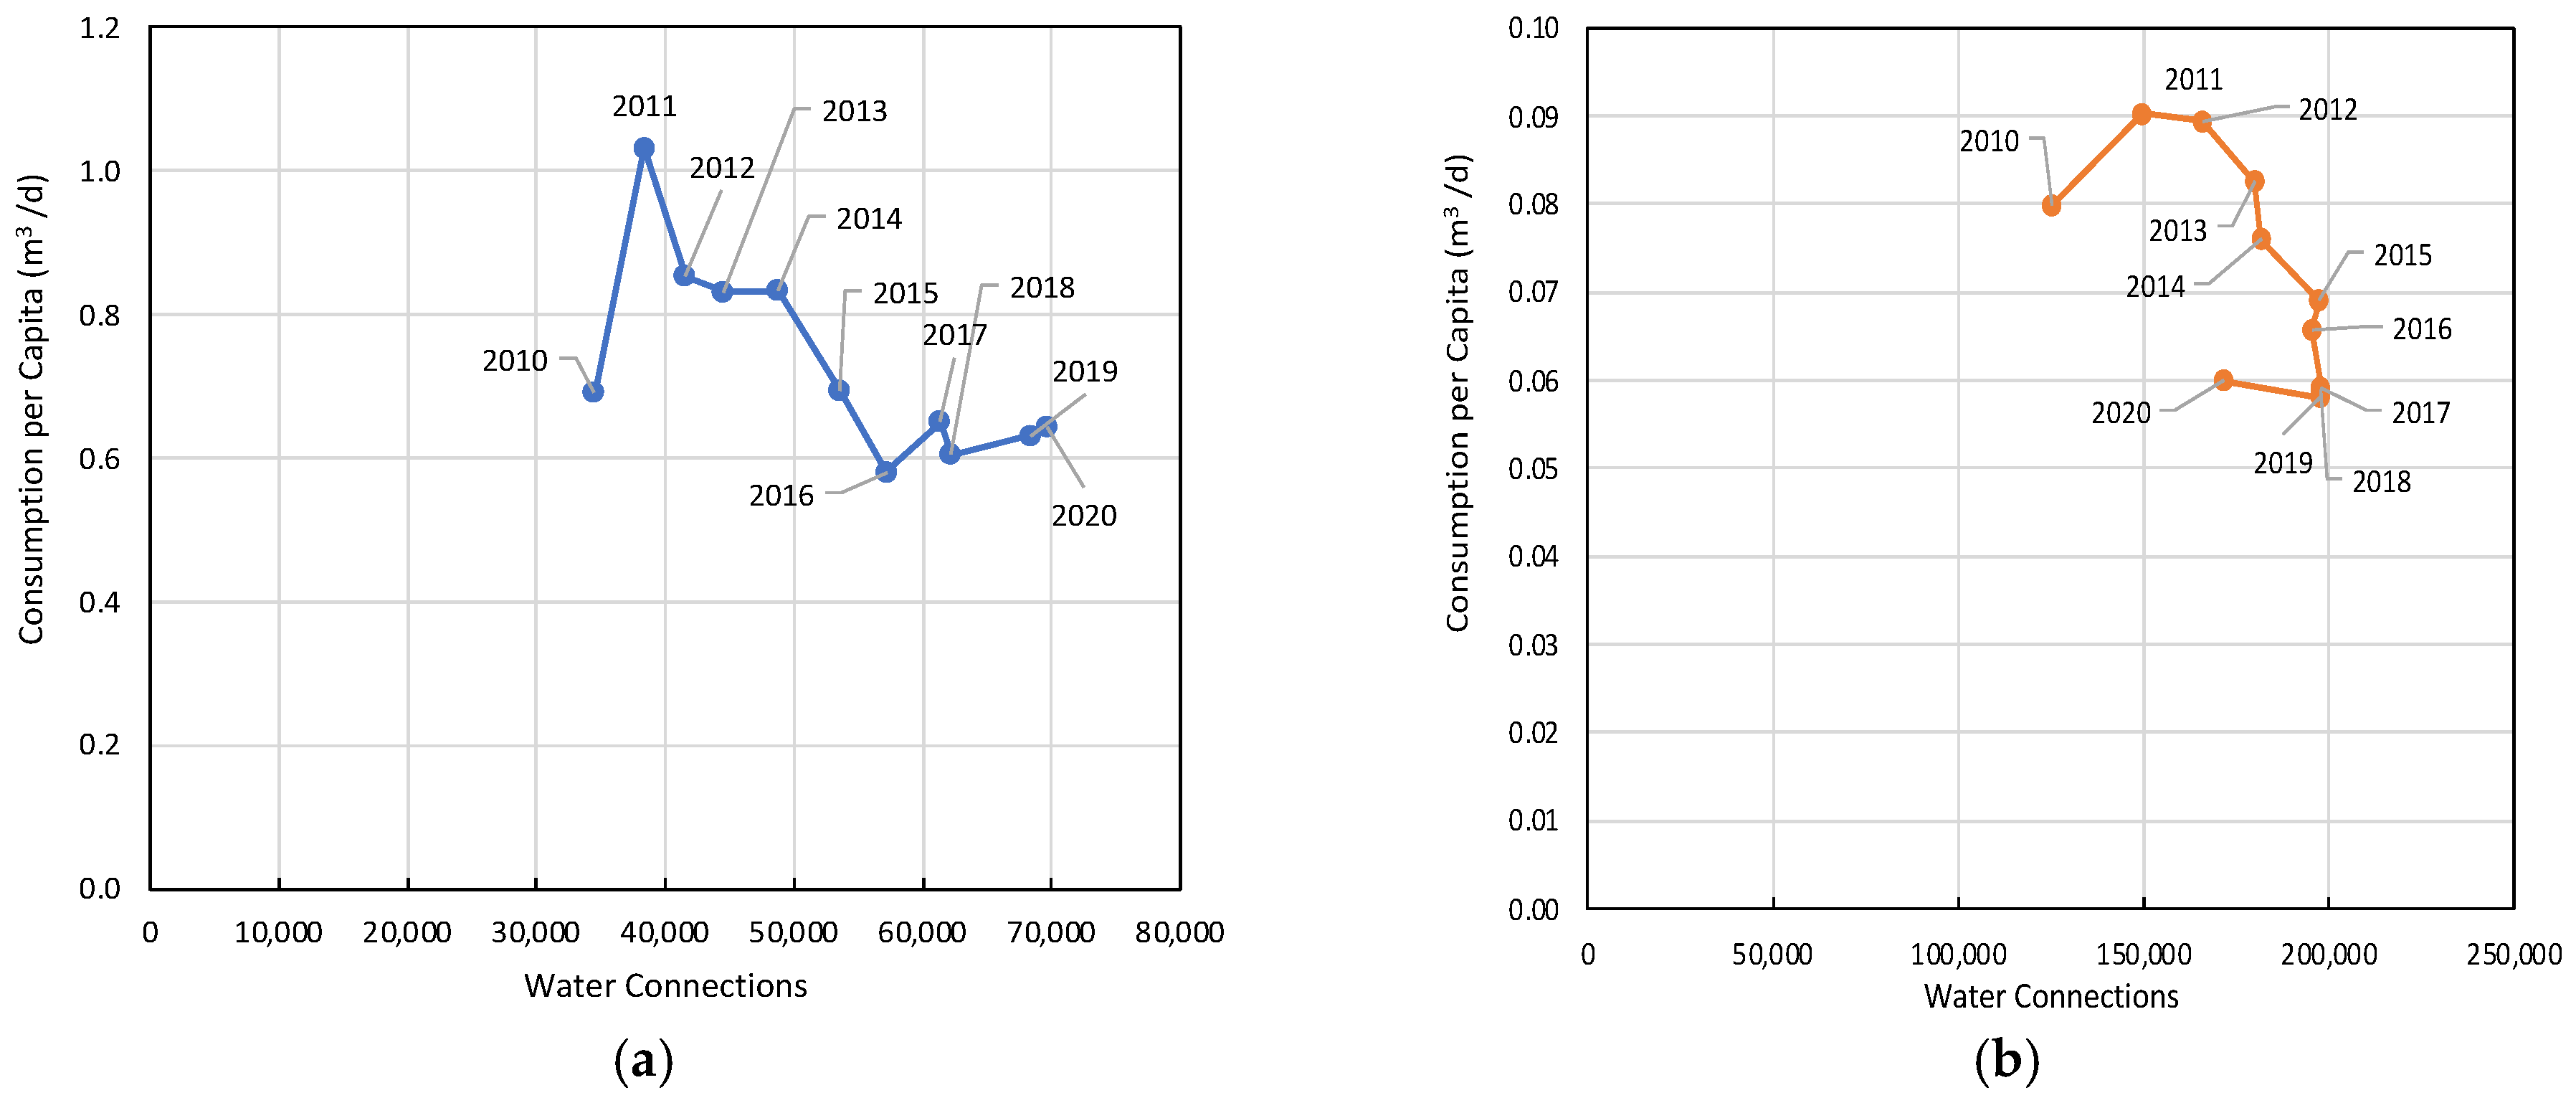
4.2. Trend Analysis of Water and Electricity Consumption in Abu Dhabi

Figure 5 shows water consumption by the consumer categories. The highest water consumption category is the residential category, followed by the commercial, agriculture, and government categories. Hence, this study focuses on the residential category analysis for water and electricity. The industrial water consumption is very small compared with other consumer categories. The sudden decrease in water consumption in the government category and increases in the commercial and agricultural categories in 2015 were due to the revision of the components of these categories.
Figure 6 shows the electricity consumption by the consumer categories. In contrast to the water consumption categories, the highest consumption is found in the commercial/government/agriculture categories, and the second highest category is residential, followed by ADNOC, which is an oil company. The residential electricity consumption has ceased increasing since 2014, but electricity consumption in other sectors continued to increase until 2019. The slight increase in electricity consumption in the residential category and decreases in other categories in 2020 were due to the COVID-19 pandemic.
Figure 7a,b shows the water consumption per capita vs. the number of connections (2010–2020) for the residential water consumption for nationals and expats, respectively. The per capita water consumption for the nationals reached the maximum in 2011 and then decreased. Nonetheless, the national water consumption was still as high as 631 LPCD in 2019 compared with the world average consumption of 180 LPCD [1]. Expat water consumption per capita has been only 1/10 of the per capita water consumption of the nationals and has been decreasing since 2013, although the number of connections is increasing. In 2020, the number of expat connections decreased significantly due to COVID-19. However, it is interesting to note that the numbers of connection increased for the nationals but decreased for the expats from 2019 to 2020.
Figure 8a,b shows the electricity consumption per capita vs. the number of connections (2010–2020) for the residential electricity consumption by the nationals and expats, respectively. The per capita electricity consumption is linearly correlated with the number of connections for the nationals, but the par capita electricity consumption of the expats shows a falling trend in relation to the number of connections, especially since 2013, which was similar to the per capita water consumption for the expats.

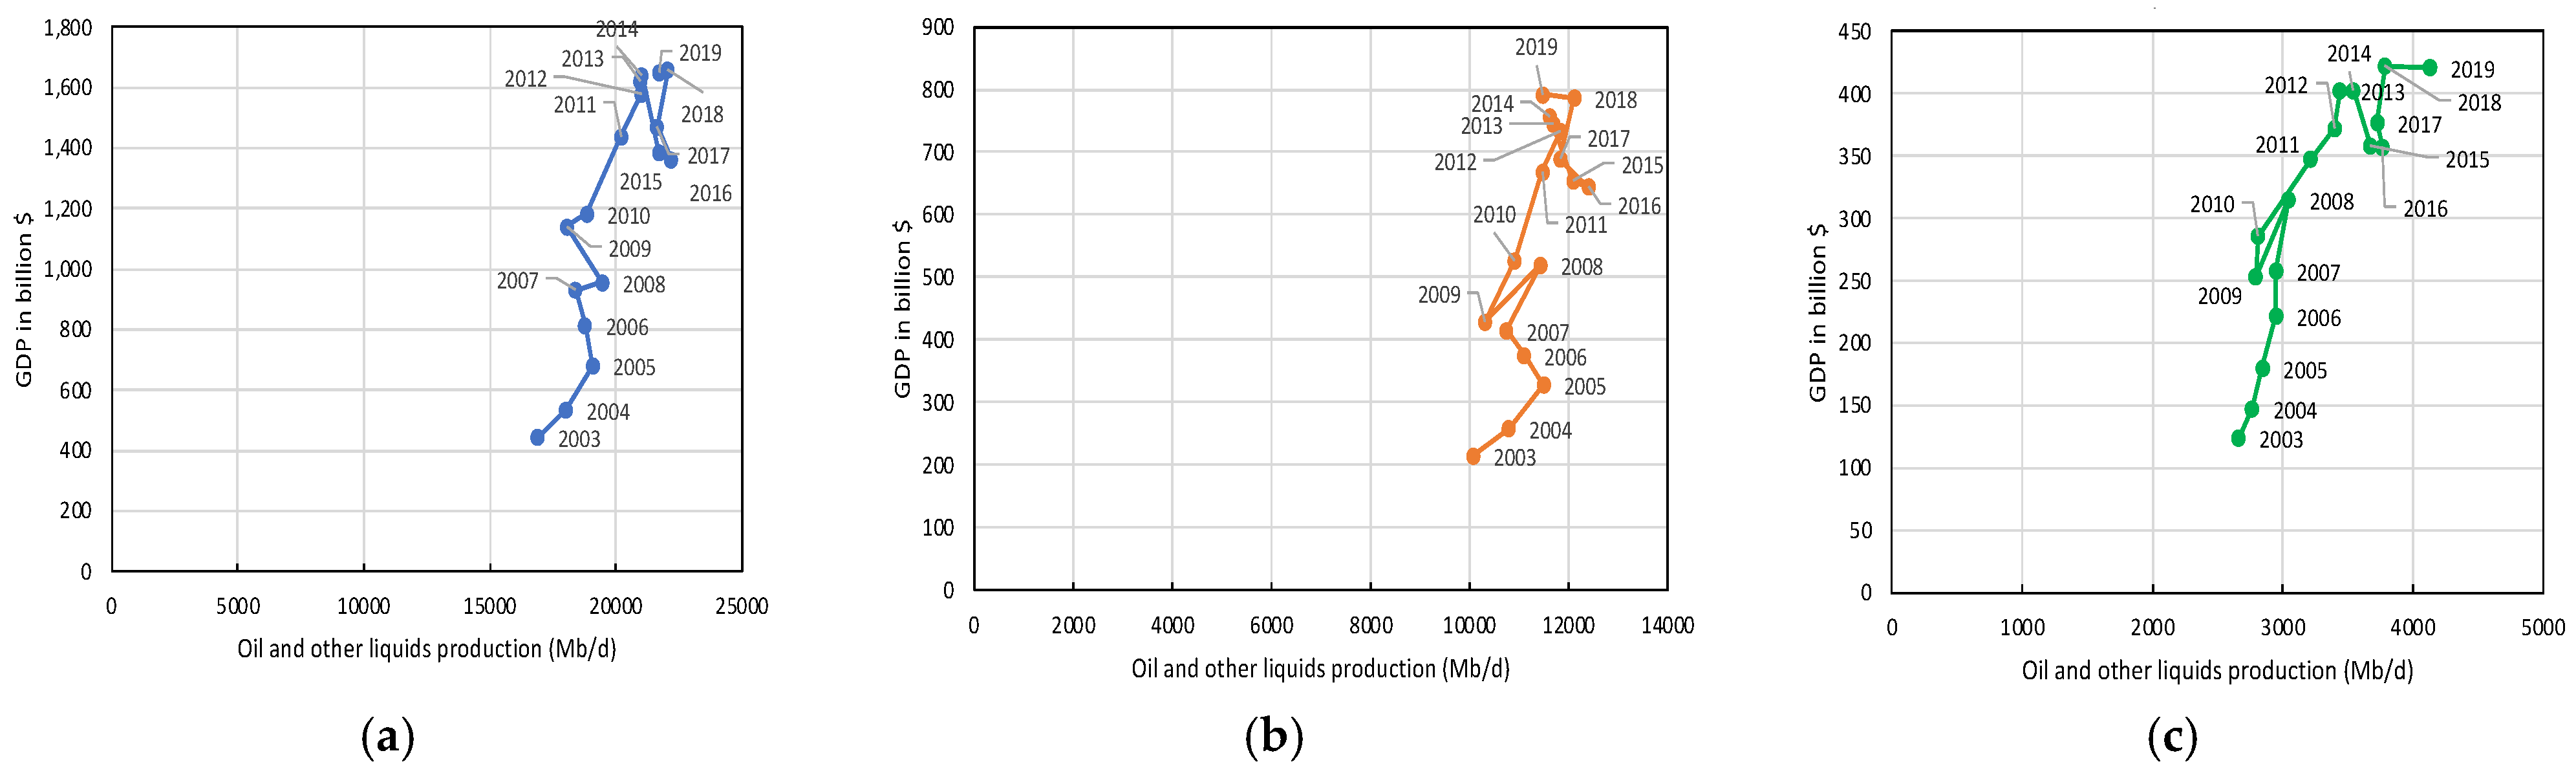
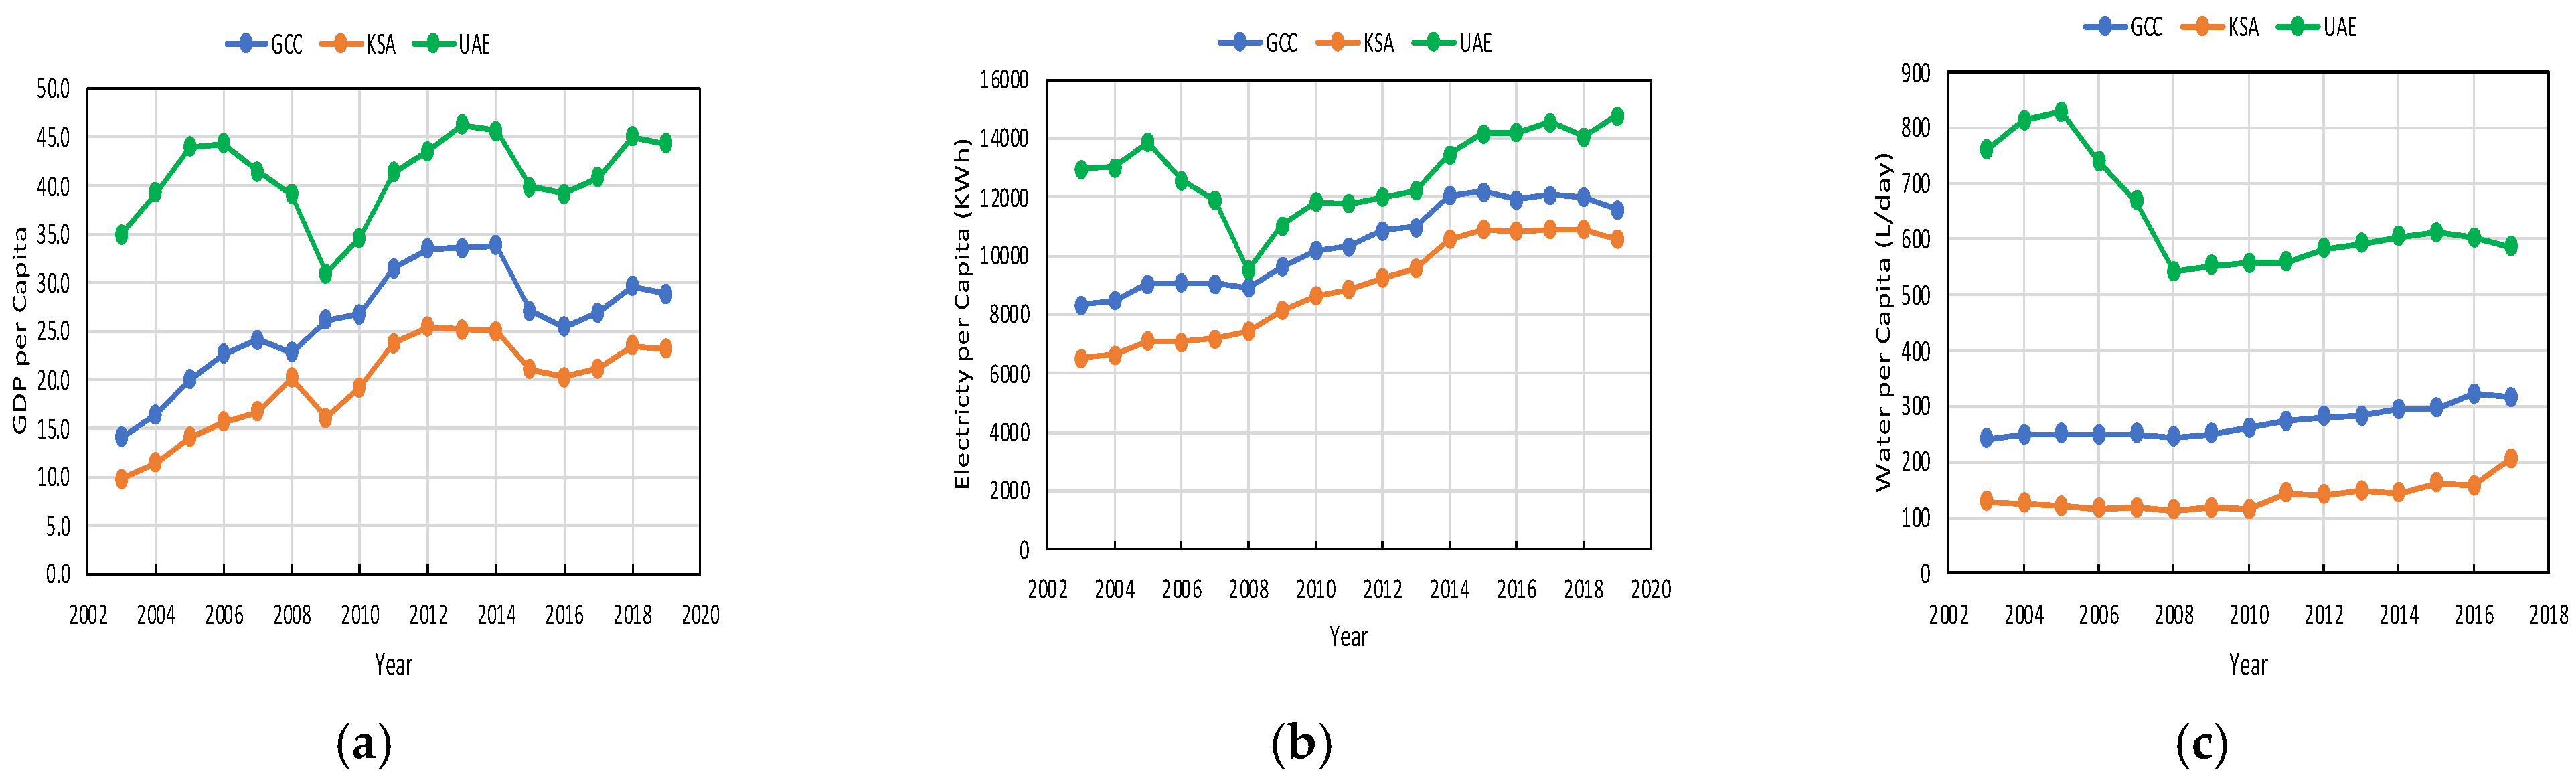
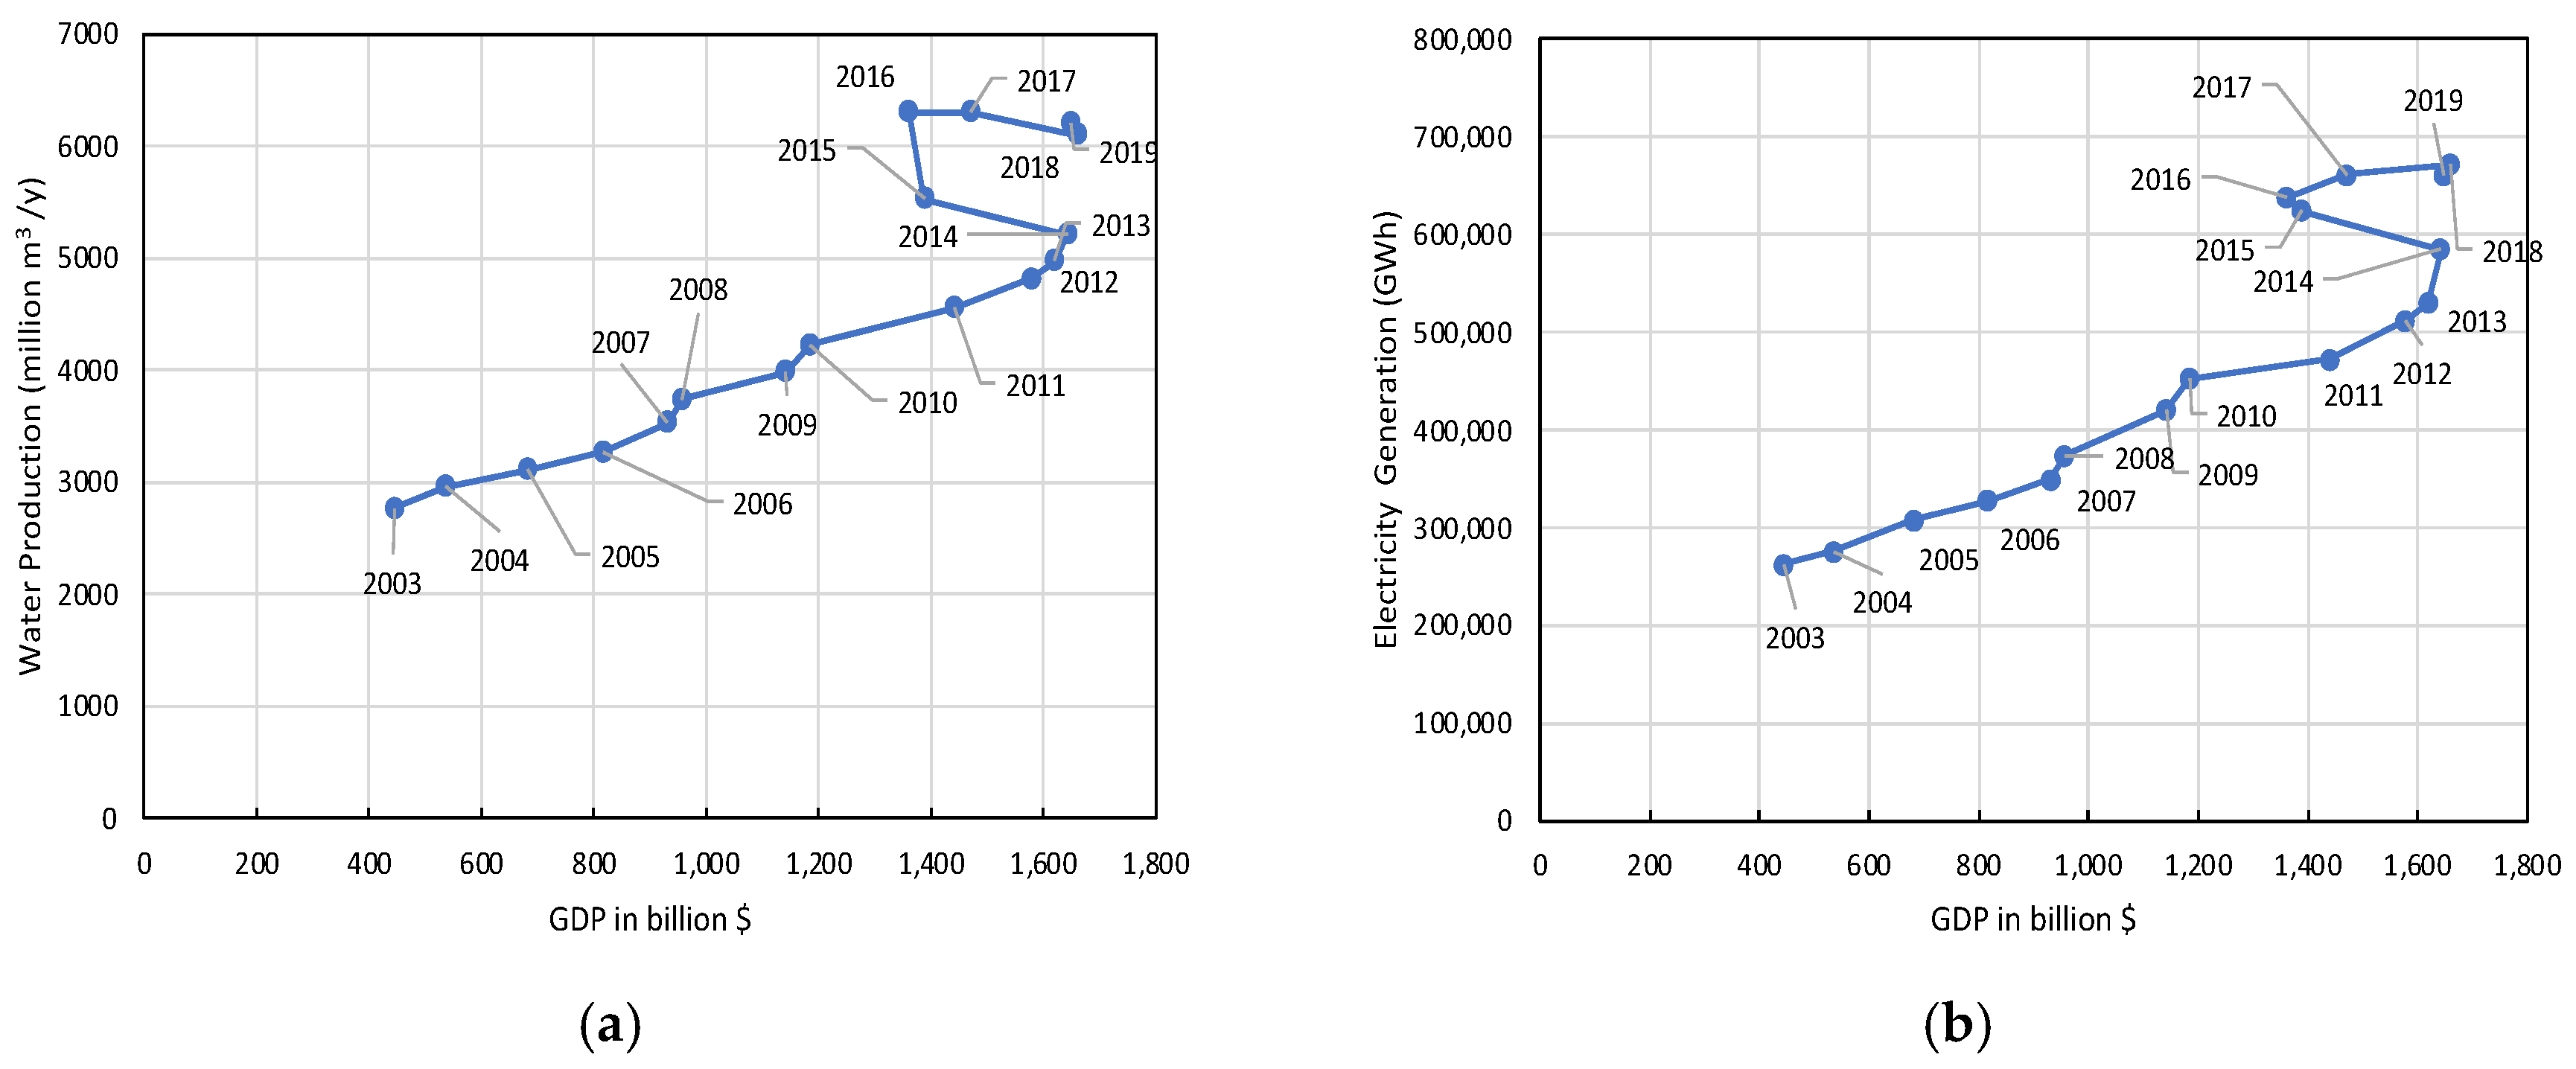
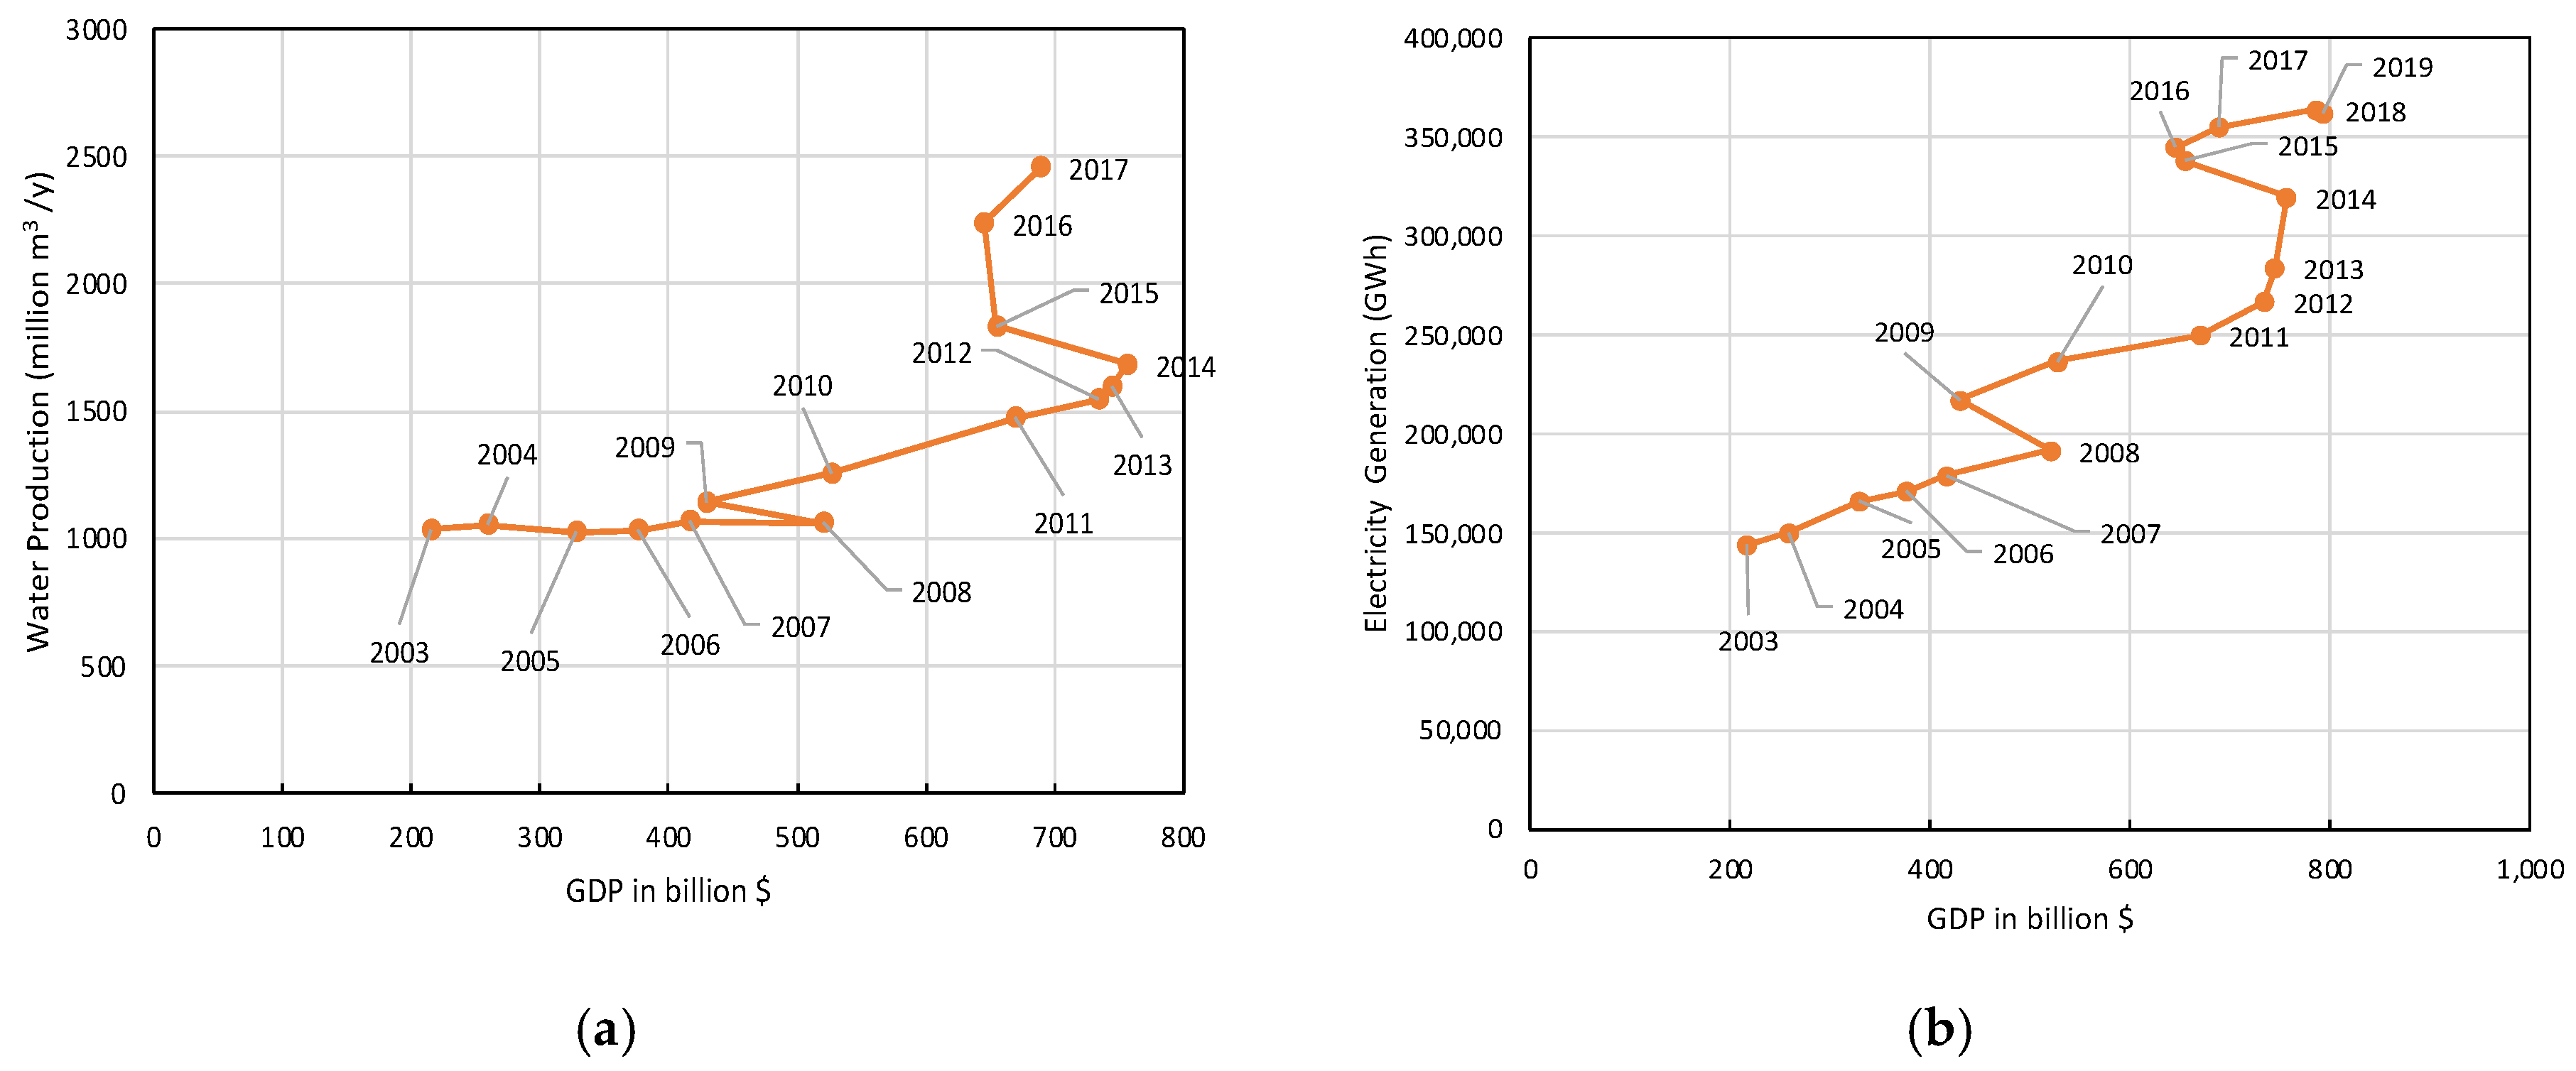
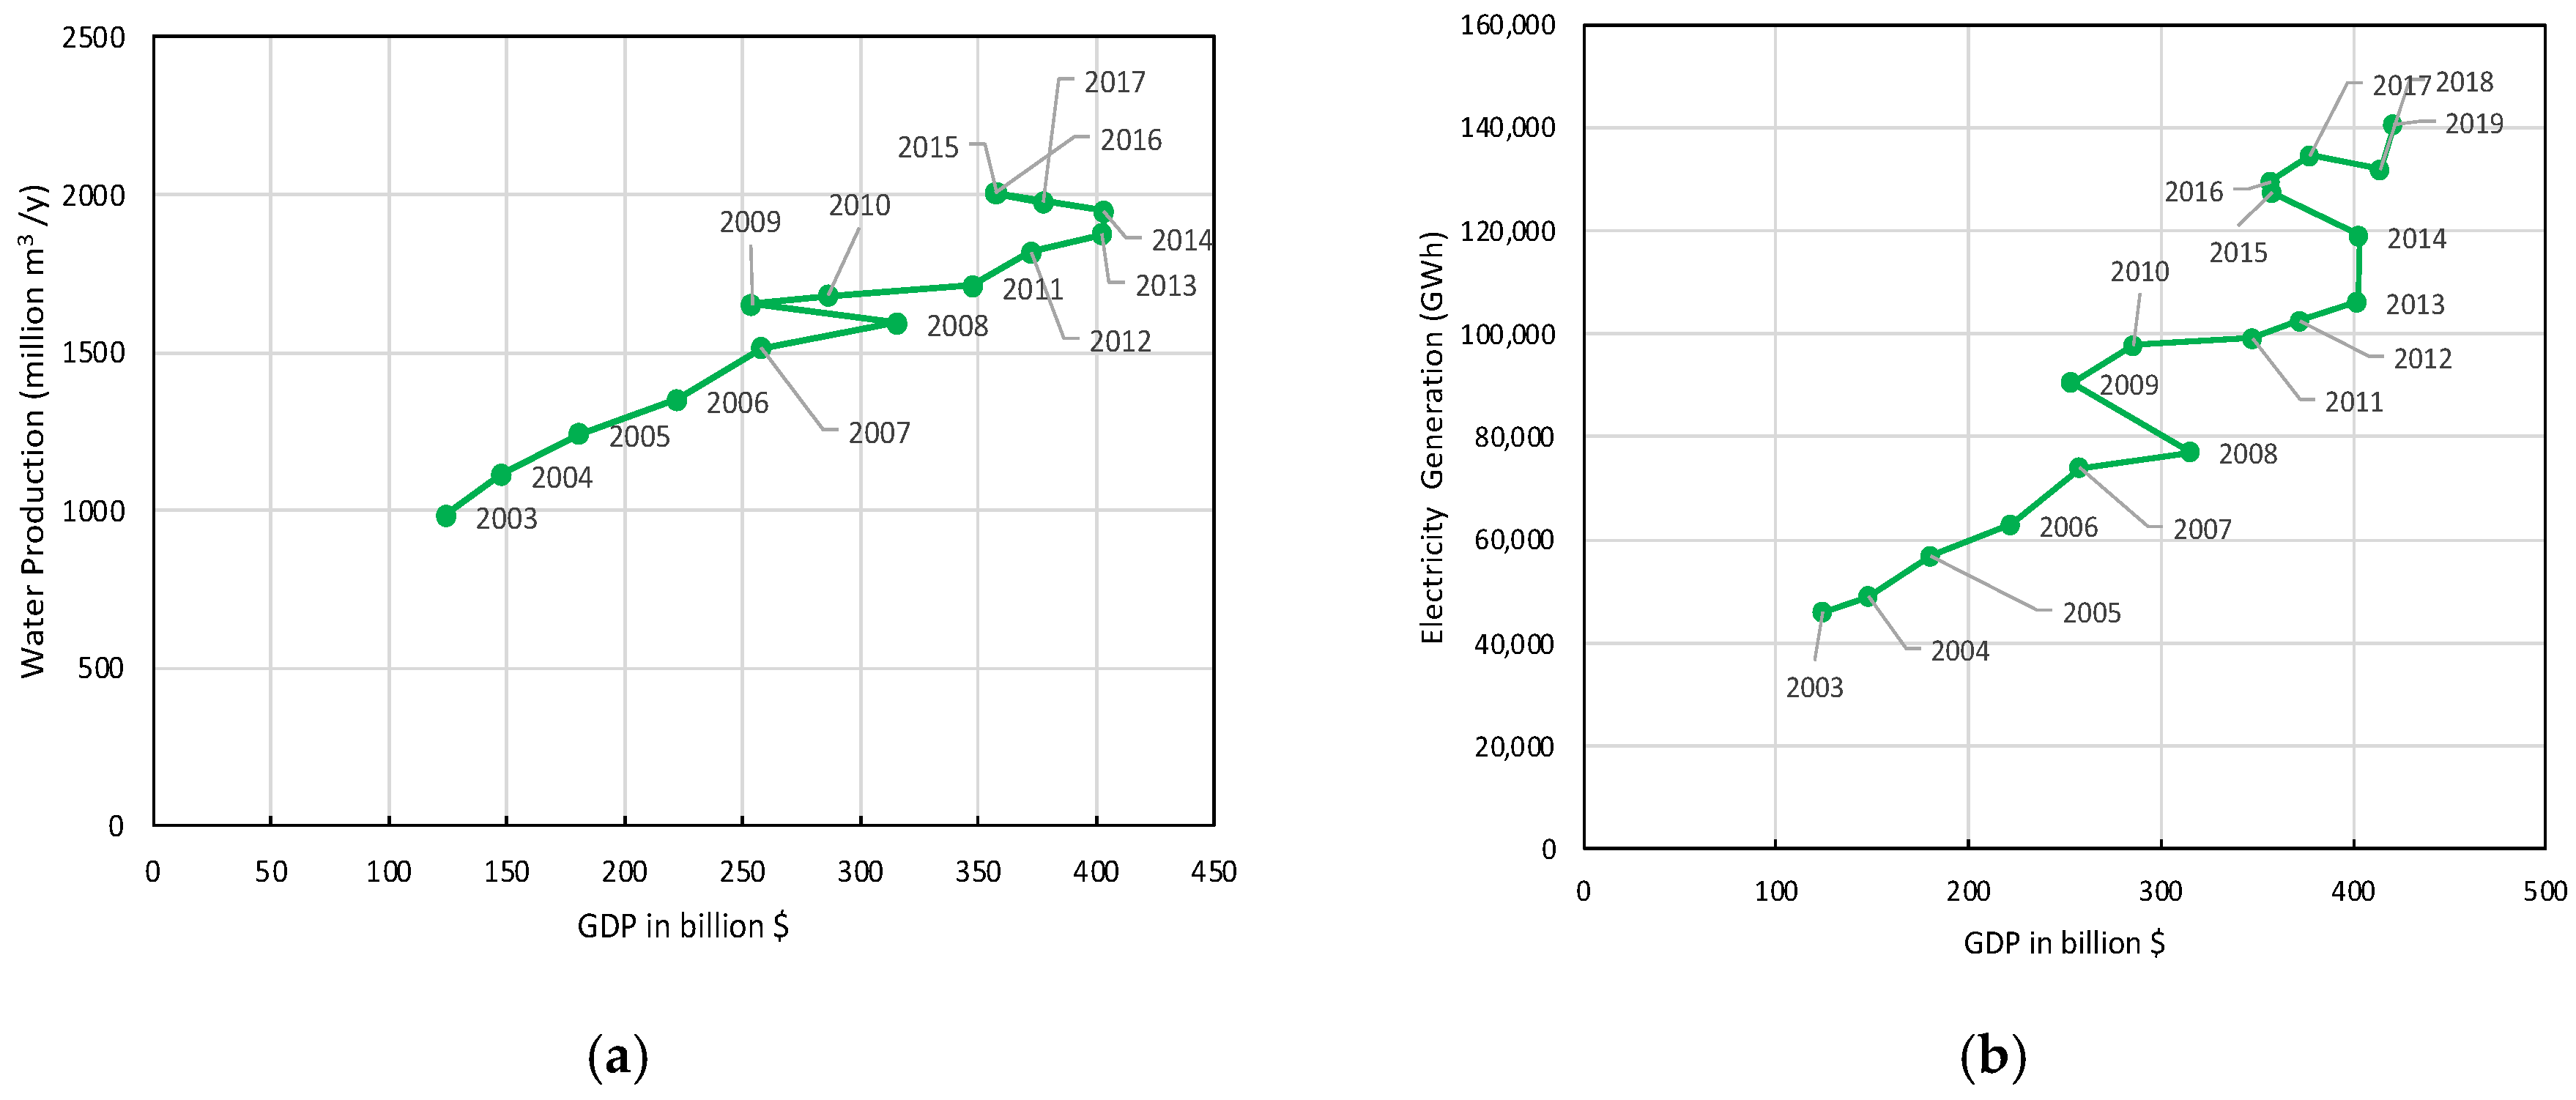
4.3. Effects of GDP on Water Production and Electricity Generation—GCC, UAE, and KSA

Figure 9a,b shows the relationship between GDP and water production and electricity generation, respectively, for the GCC countries from 2003 to 2019. Water production and electricity generation were mostly linearly correlated with GDP until 2014; however, since 2015, GDP was decoupled from water production and electricity generation; namely, water production increased from 2014 to 2016 despite a decrease in GDP, but then slightly decreased, although GDP increased from 2016 to 2019. Electricity consumption increased even after 2015, although the increasing rate was smaller than that before 2014. After 2016, GDP recovered to the level of 2014, but water production and electricity generation were higher than the levels of 2014. These results show that water and electricity demands decoupled from GDP in 2015, not only in Abu Dhabi but in all GCC countries.
Figure 10a,b shows the relationship between GDP and water production and electricity generation, respectively, in the KSA in 2003–2019. Figure 11a,b presents the relationship between GDP and water production and electricity generation, respectively, in the UAE in the same period. For both countries, the GDPs increased steadily until 2012 or 2013, except for 2009, after which the rate of GDP increase then decreased. The decreases in GDP due to the collapse of oil price in 2009 and 2015 did not influence the increasing rates of electricity production. Thus, GDP has been decoupled from electricity generation in both countries since 2015.

5. Discussion

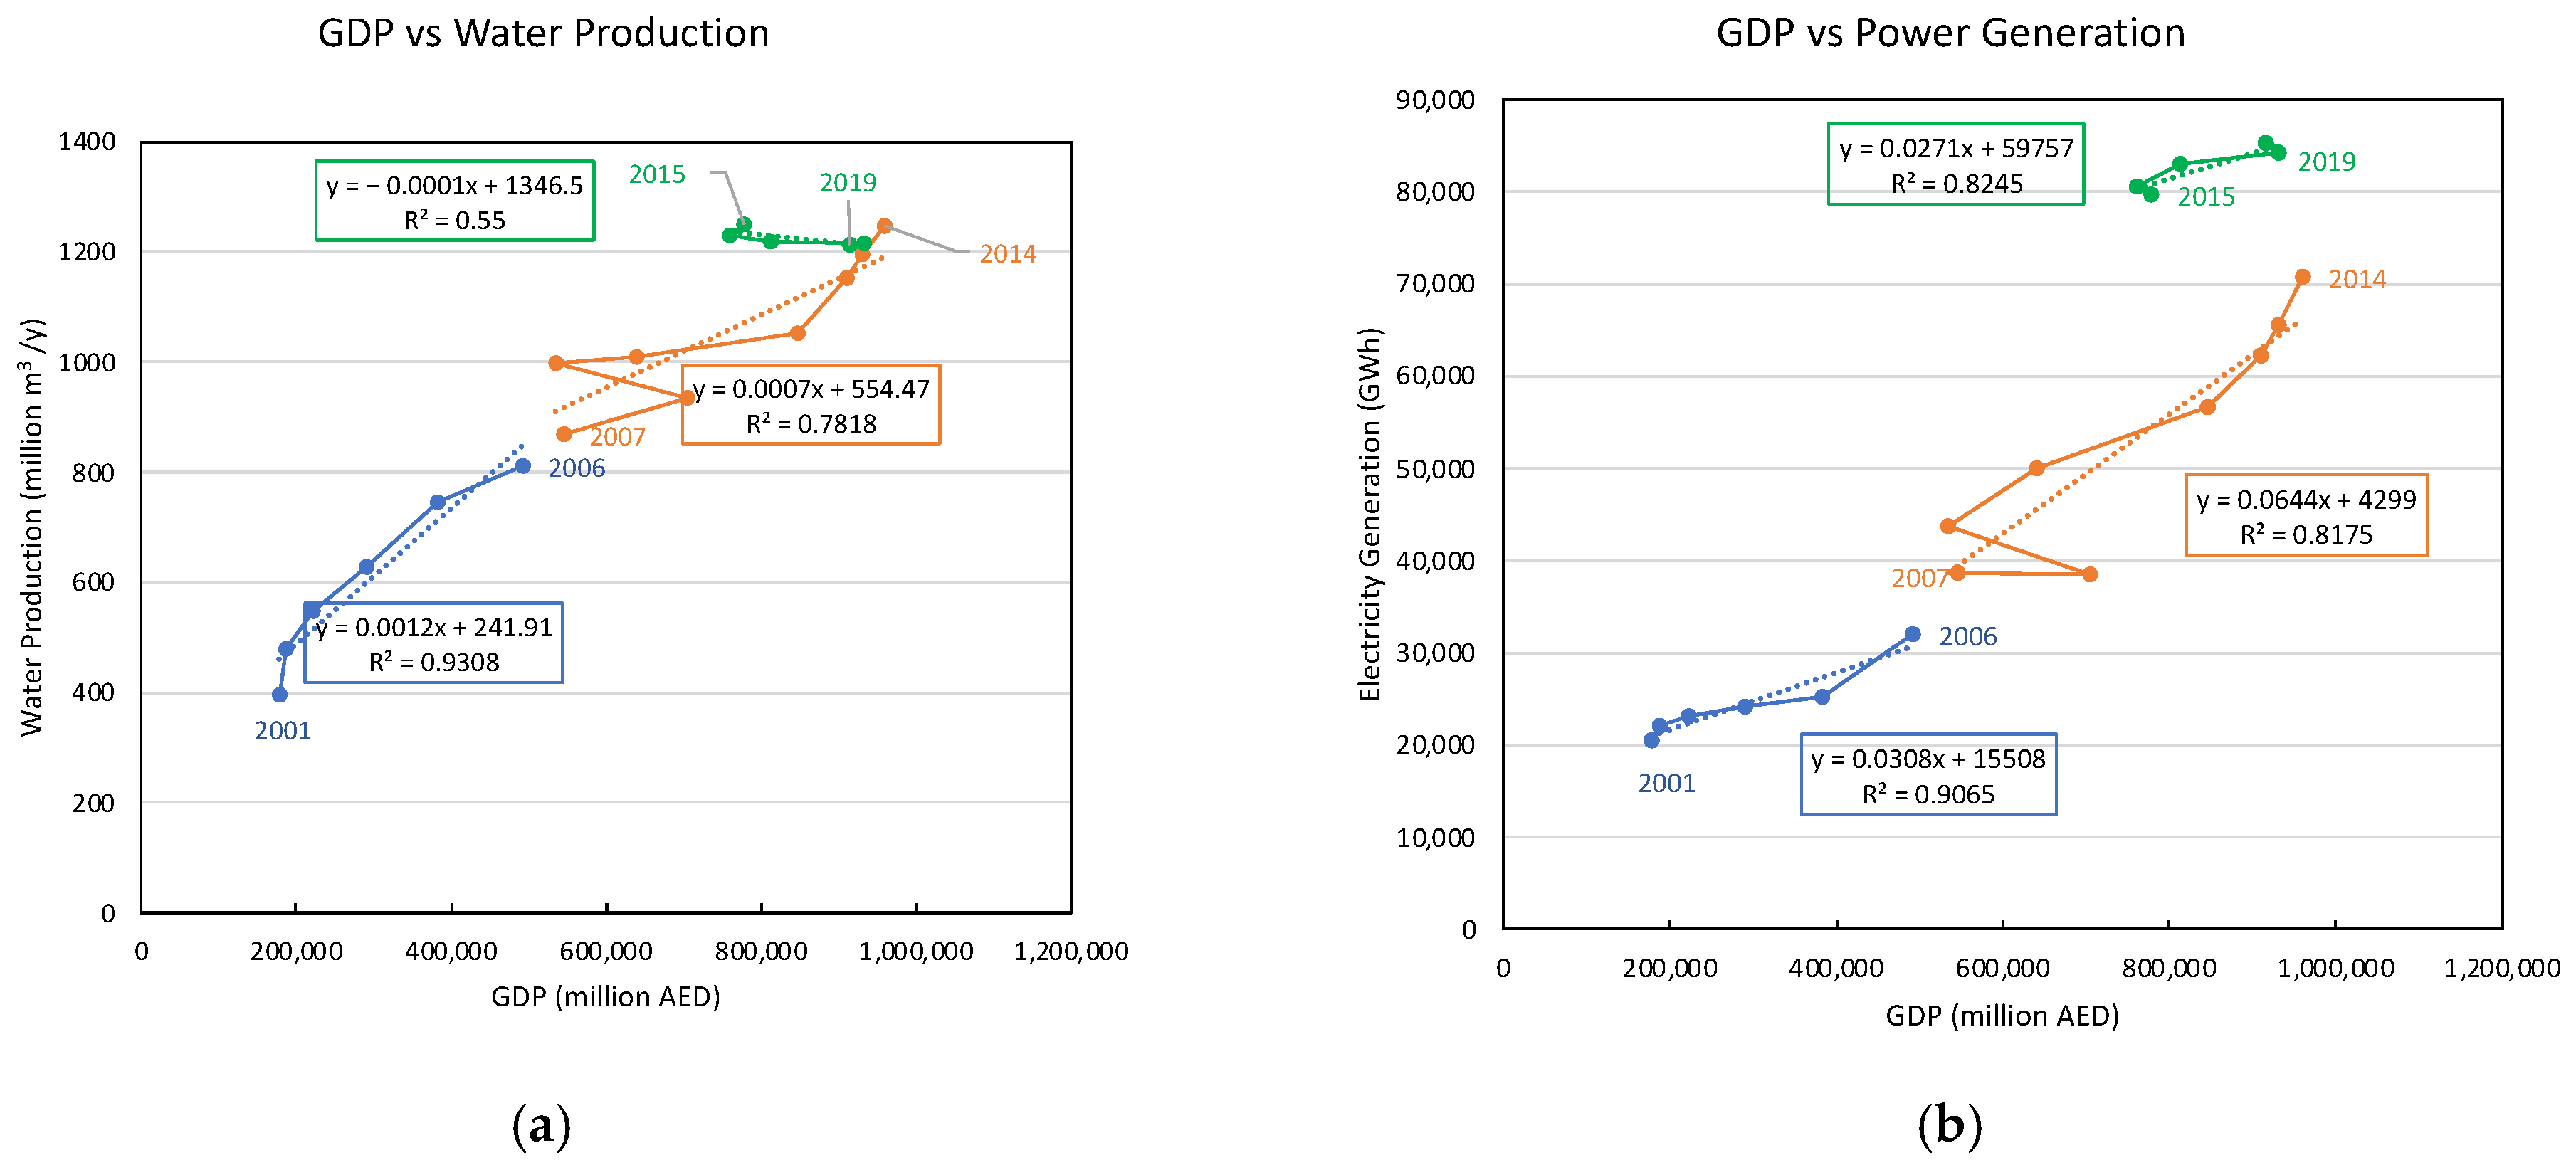
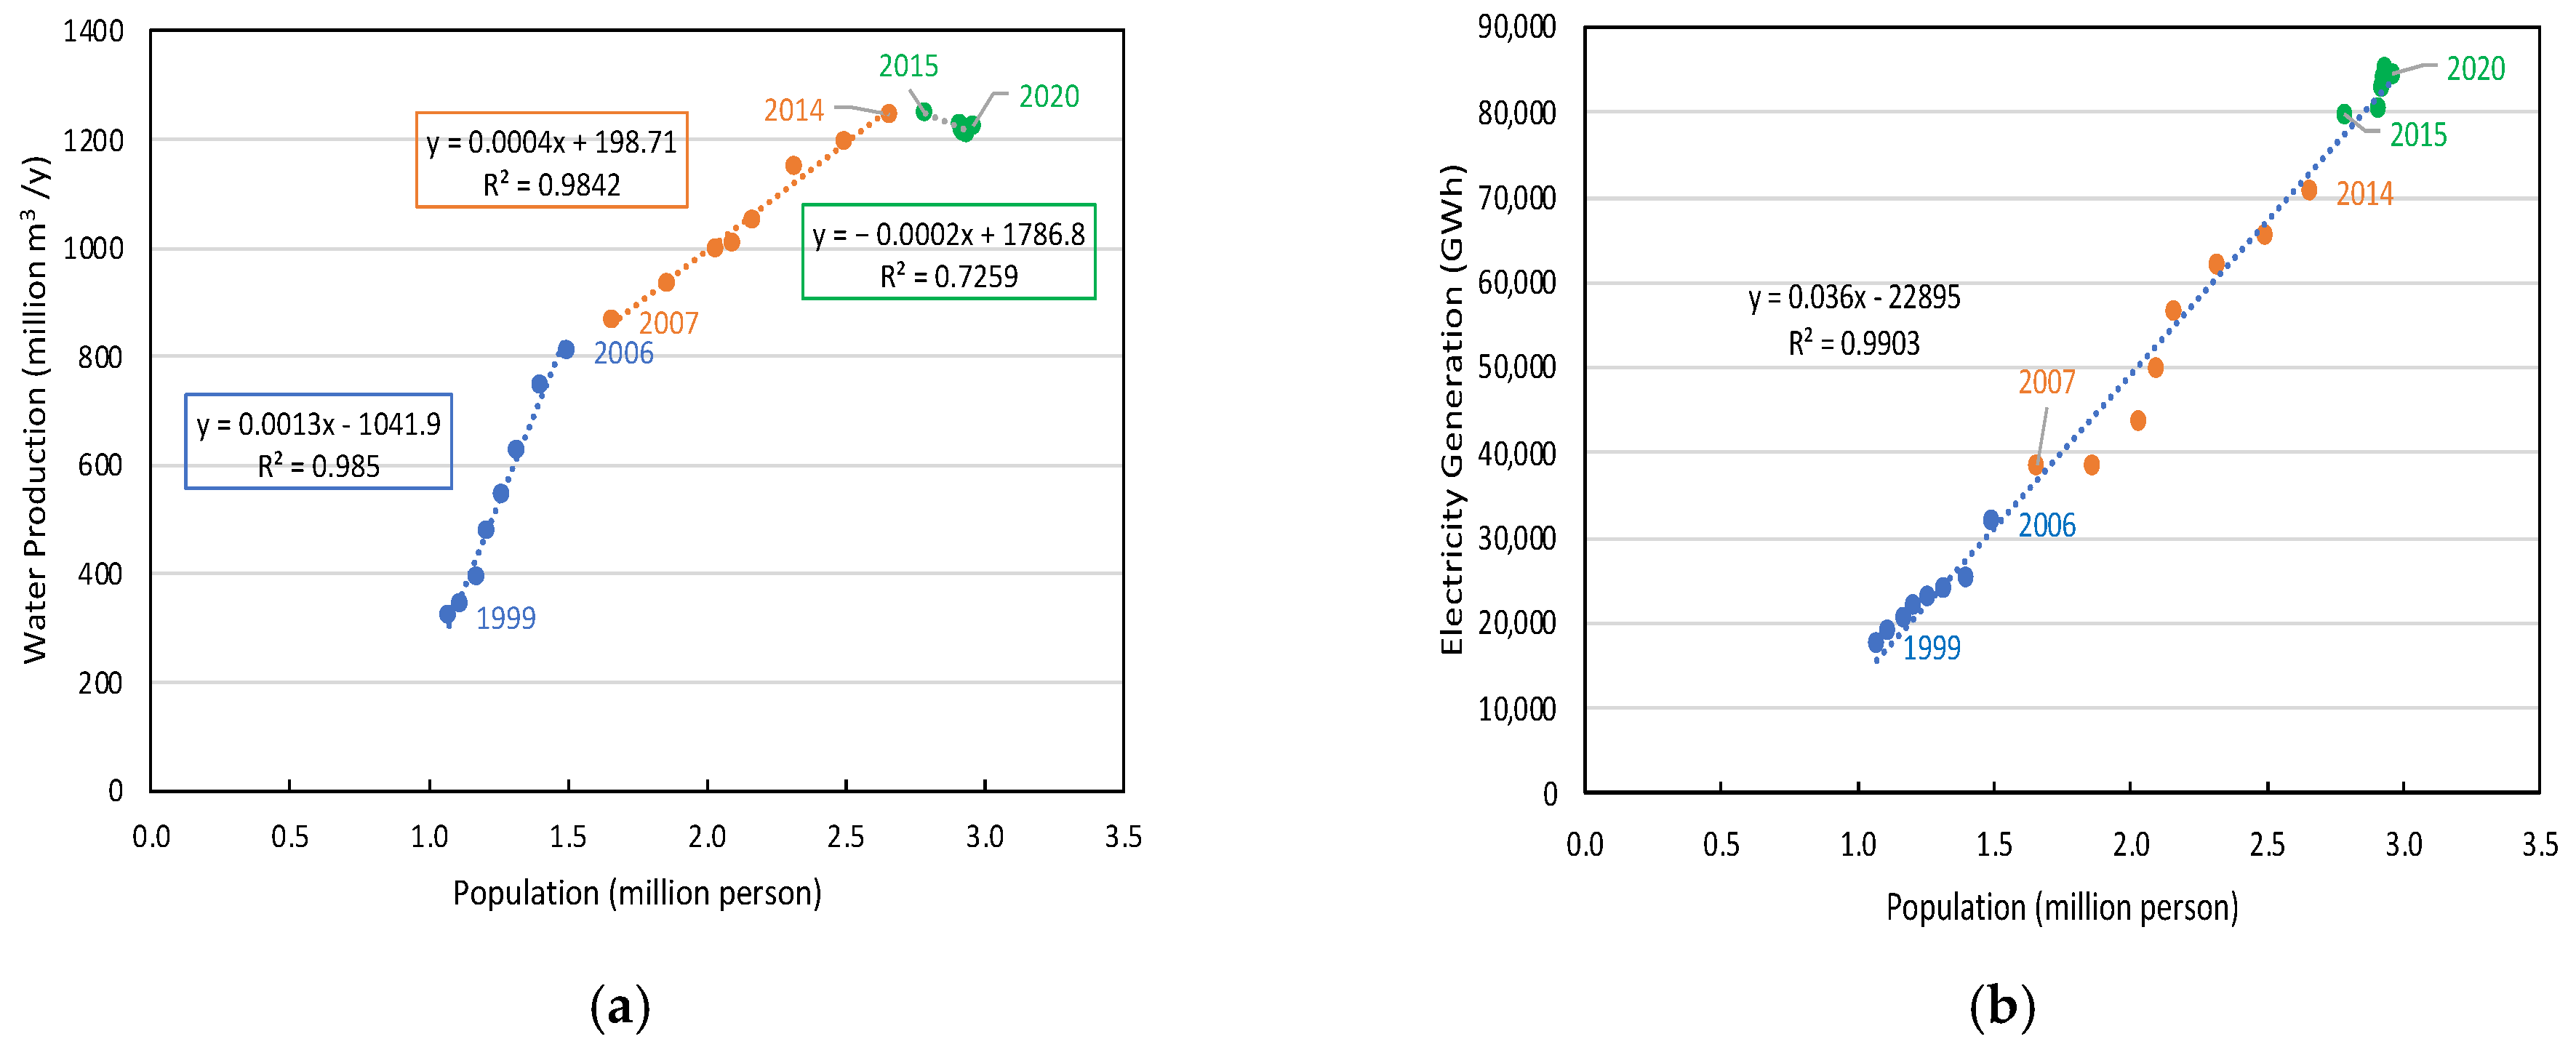
5.1. Decoupling of Water Production and Electricity Generation from GDP and Population—Abu Dhabi

Two macroscale parameters, namely, GDP and population, have been commonly used for the prediction of water and electricity demand [38,39]. However, the results of this study clearly show that there has been a decoupling of water production and electricity generation from GDP since 2015, and water production has also been decoupled from population since 2015. There were three phases of GDP and population growth in correlation with water production and electricity generation (Figure 1 and Figure 2). In the first phase, at the beginning of the economic development, many people enjoyed their affluence and bought electric devices, such as televisions, refrigerators, air conditioning, and washing machines, and they then connected them to the piped water supply; thus, electricity and water consumption increased rapidly (increase phase). However, once all households owned these electric appliances and were able to use as much piped water as they needed, there was no more increase in electricity and water consumption (saturation phase). The government, as well as the population, became aware of the environmental protection and cost of electricity and water; hence, they started using more efficient devices and living in electricity- and water-saving houses (decrease phase) [23,32]. In the increase phase, macroscale parameters, such as GDP and population, influenced electricity and water consumption more than other parameters, but in the decrease phase, microscale parameters, such as house type and the energy efficiency of devices, had a greater influence than macroscale parameters, which caused a decoupling of water and electricity consumption from GDP and population [77]. Hence, there has been no correlation between GDP and water and electricity production since 2015.
Different increasing rates of electricity generation and water production were observed in the first and second phases; namely, the increasing rate of water was greater in the first phase than in the second phase, but the rate of electricity generation was greater in the second phase than in the first phase. This might be because people could use as much water as they needed once their homes were connected to a piped water supply, while they purchased more electronic appliances in the second phase. The different shares of the major consumers of water and electricity might also have influenced the different rates of increasing; namely, the government, commercial, and agriculture sectors are the highest consumers of electricity, while the residential category was the largest water consumer (Figure 5 and Figure 6). The residential consumption of both water and power has been almost stable since 2015 (reached the saturation phase); however, the electricity consumption by government, commercial, and agriculture users is still growing. Thus, the Abu Dhabi government and the UAE should focus on the government, commercial, and agriculture categories to reduce their electricity consumption by implementing policies, reducing energy/water subsidies, improving energy efficiency, and increasing the share of renewable energy in the energy mixed building [26].
Although electricity generation is linearly correlated with population, the increasing rate of electricity generation has decreased significantly since 2015 (Figure 2a). This is because the electricity consumption by the residential users has been almost constant since 2015, and the total electricity consumption has been increased by the increased consumption of other users. In Figure 2b, the relationship between water production and population can be explained by looking more into the population groups that compose the total population, namely, nationals and expats. In the first phase, the water demand increased rapidly due to the increasing water consumption of the nationals; however, in the second phase, the water demand increased slowly due to the increased population of the expats (~80%), who consume less water than the nationals (~20%). In the third phase, the water demand decreased due to the water saving of the nationals, as reported in the previous study [32]. Hence, water production has been decoupled from population since 2015 because of the water-saving strategy of the Abu Dhabi government.

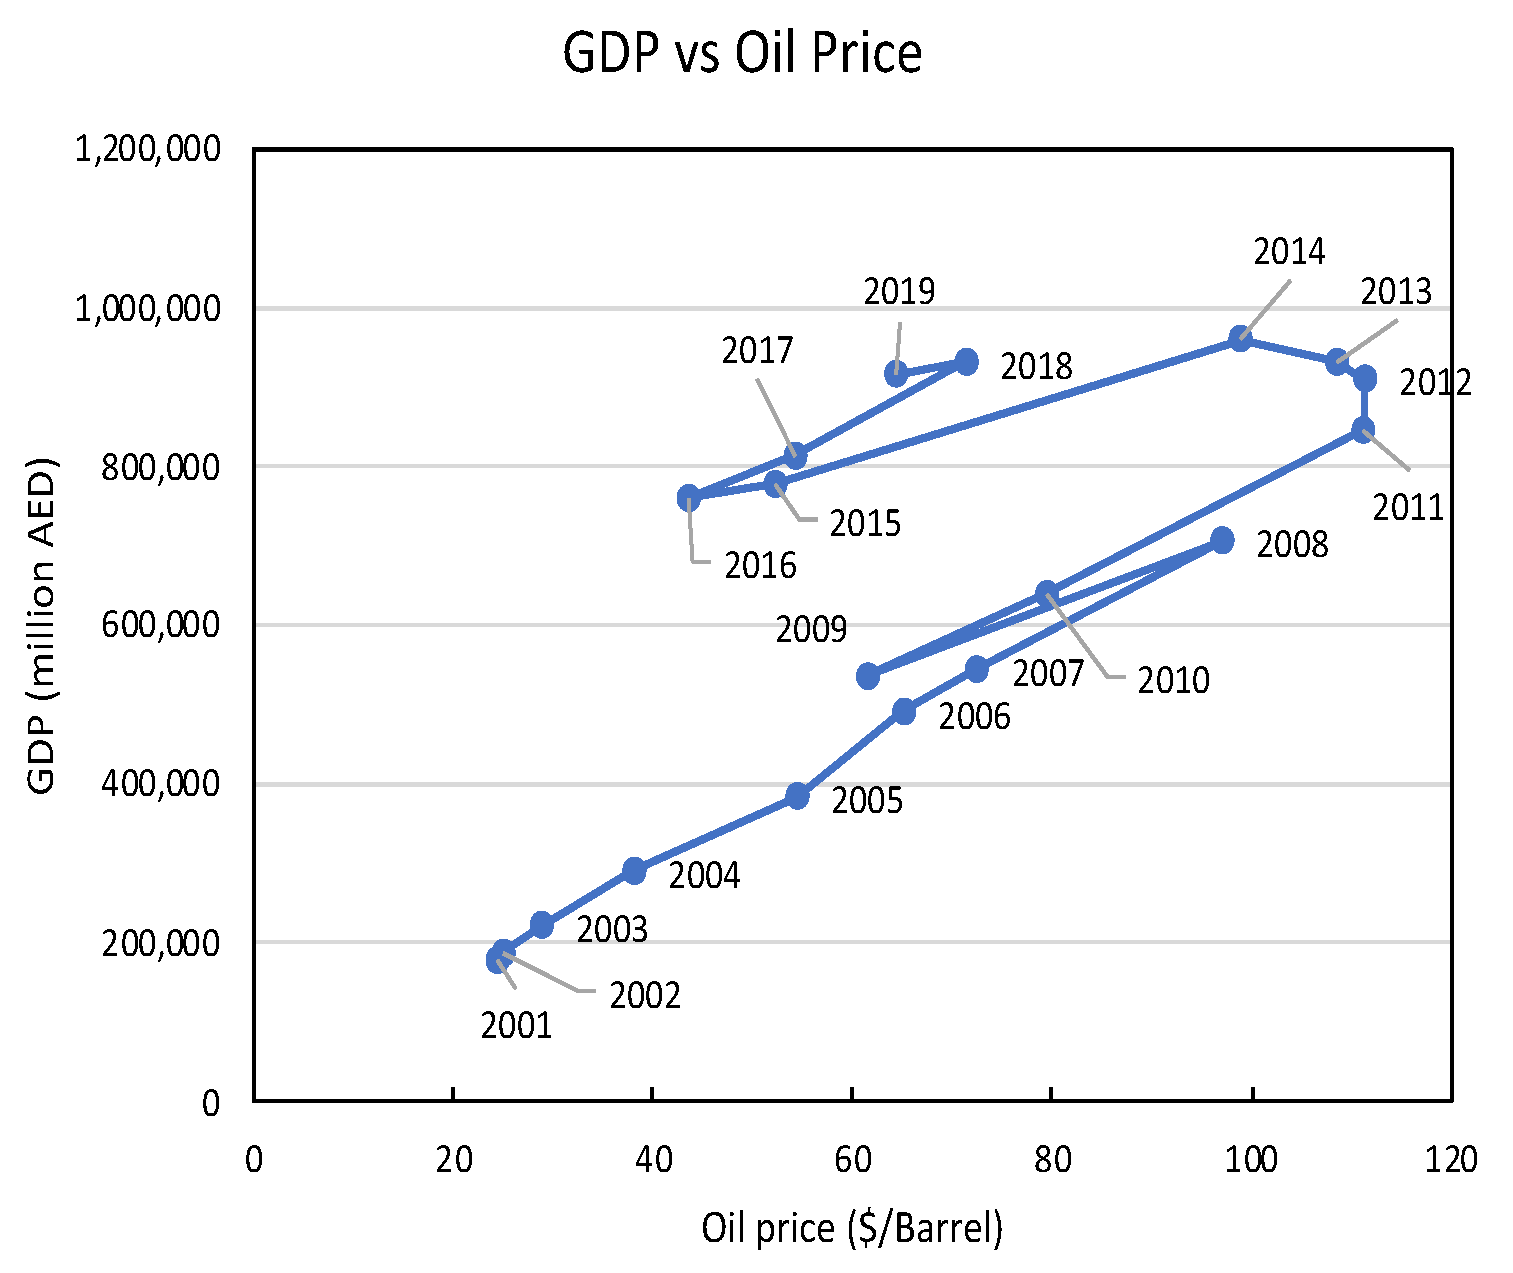
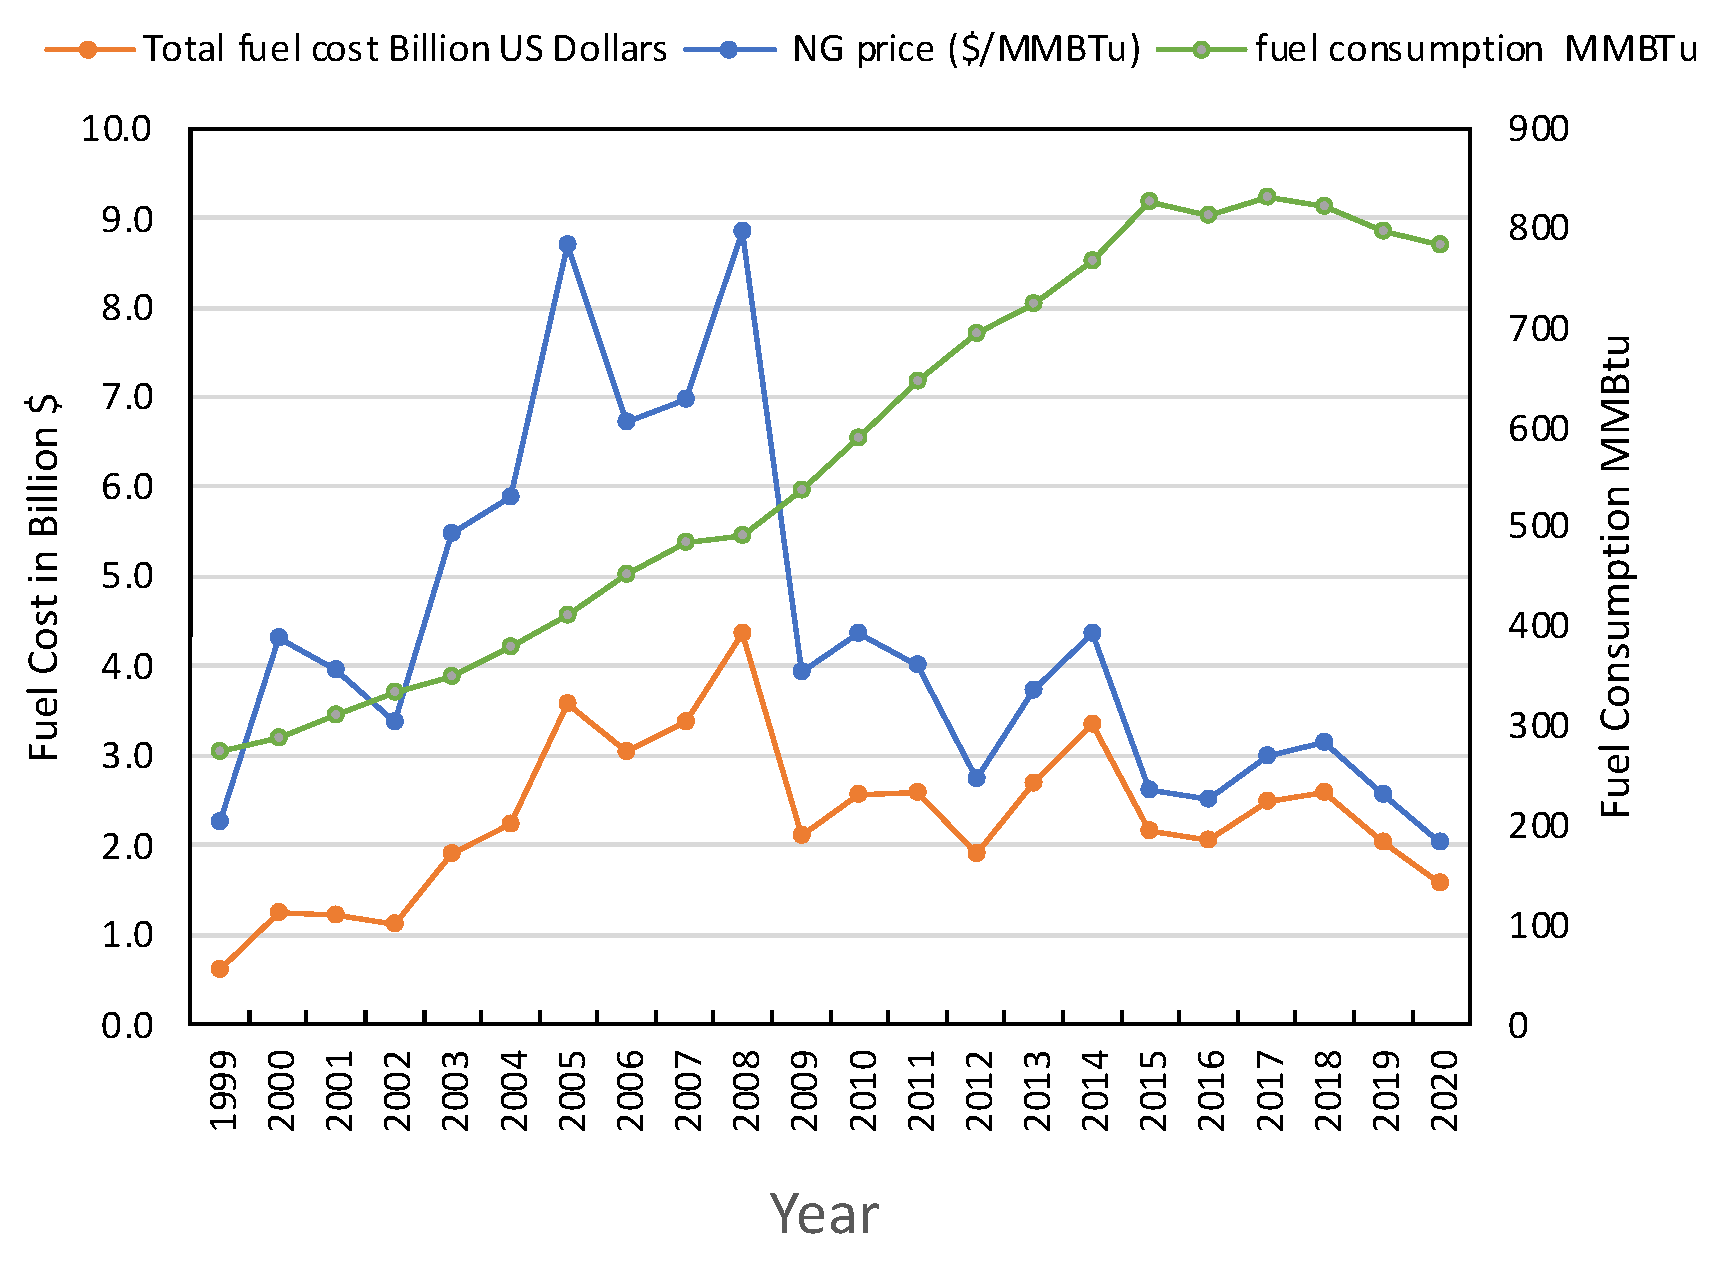
5.2. Oil Price and Fuel Cost

Figure 3 shows that there were two major plunges in oil price in 2009 and 2015, and the Abu Dhabi GDP also fell in the same years. In 2009, the plummeting price was almost entirely due to a collapse in demand due to an international economic crisis [78]. However, in 2015, the oil price dropped because of a combination of multiple factors, including the strong U.S. dollar, large inventories, a weak economy, and a growing production [79].
There are two components of GDP for Abu Dhabi based on the economic activity: (1) oil activity and (2) nonoil activity [74,75]. Oil activity refers to all activities related to the oil industry, and it is affected directly by the oil price. On the other hand, nonoil activity is any activity not related to oil, such as manufacturing, construction, agriculture, transportation, and real estate (Appendix A, Table A1). After 2009, the UAE and Abu Dhabi governments focused on an economic diversification program in order to increase nonoil activities [80]. Measured at constant prices, the GDP for nonoil activities rose by 7.6% in 2015, while oil activities rose by 5.0%. As a result, the contribution of nonoil activities to the total GDP at constant prices has increased since 2011 [74] (Appendix A, Table A2). This explains the results in Figure 3 where, although the oil price collapsed between 2011 and 2014, the GDP increased because of the economic initiative by the Abu Dhabi government to increase nonoil activities.
As shown in Figure 4, the high cost and price volatility of fuels, especially those of natural gas, compromise the sustainable supply of water and electricity in the GCC countries. Although the demands for water and electricity were strongly correlated with GDPs, it was shown that GDP was decoupled from the demands (Figure 1, Figure 10 and Figure 11). Although it is true that the revenues of the GCC countries are high at times of high oil prices, their GDPs are also becoming less dependent on those prices. Therefore, in order to realize a sustainable supply of water and electricity, it is important to reduce the demand and dependence on natural fuels for electricity and water production.

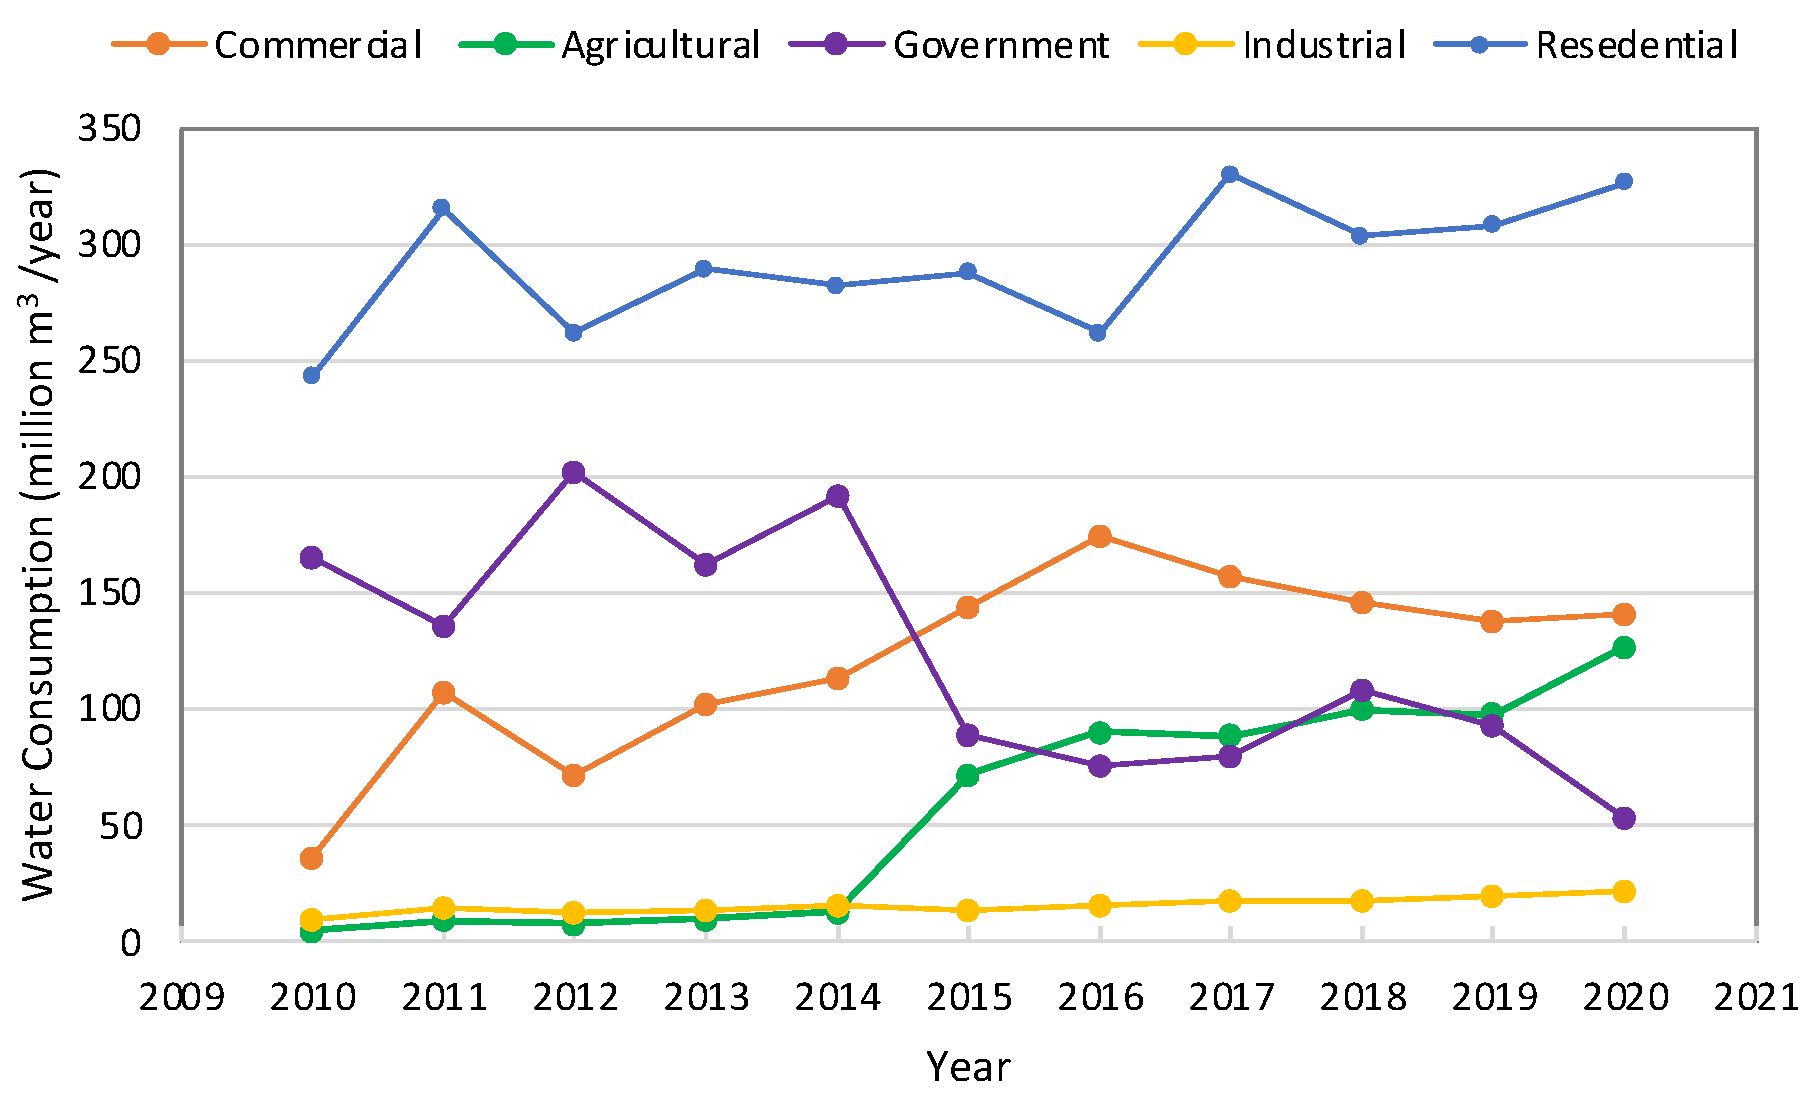
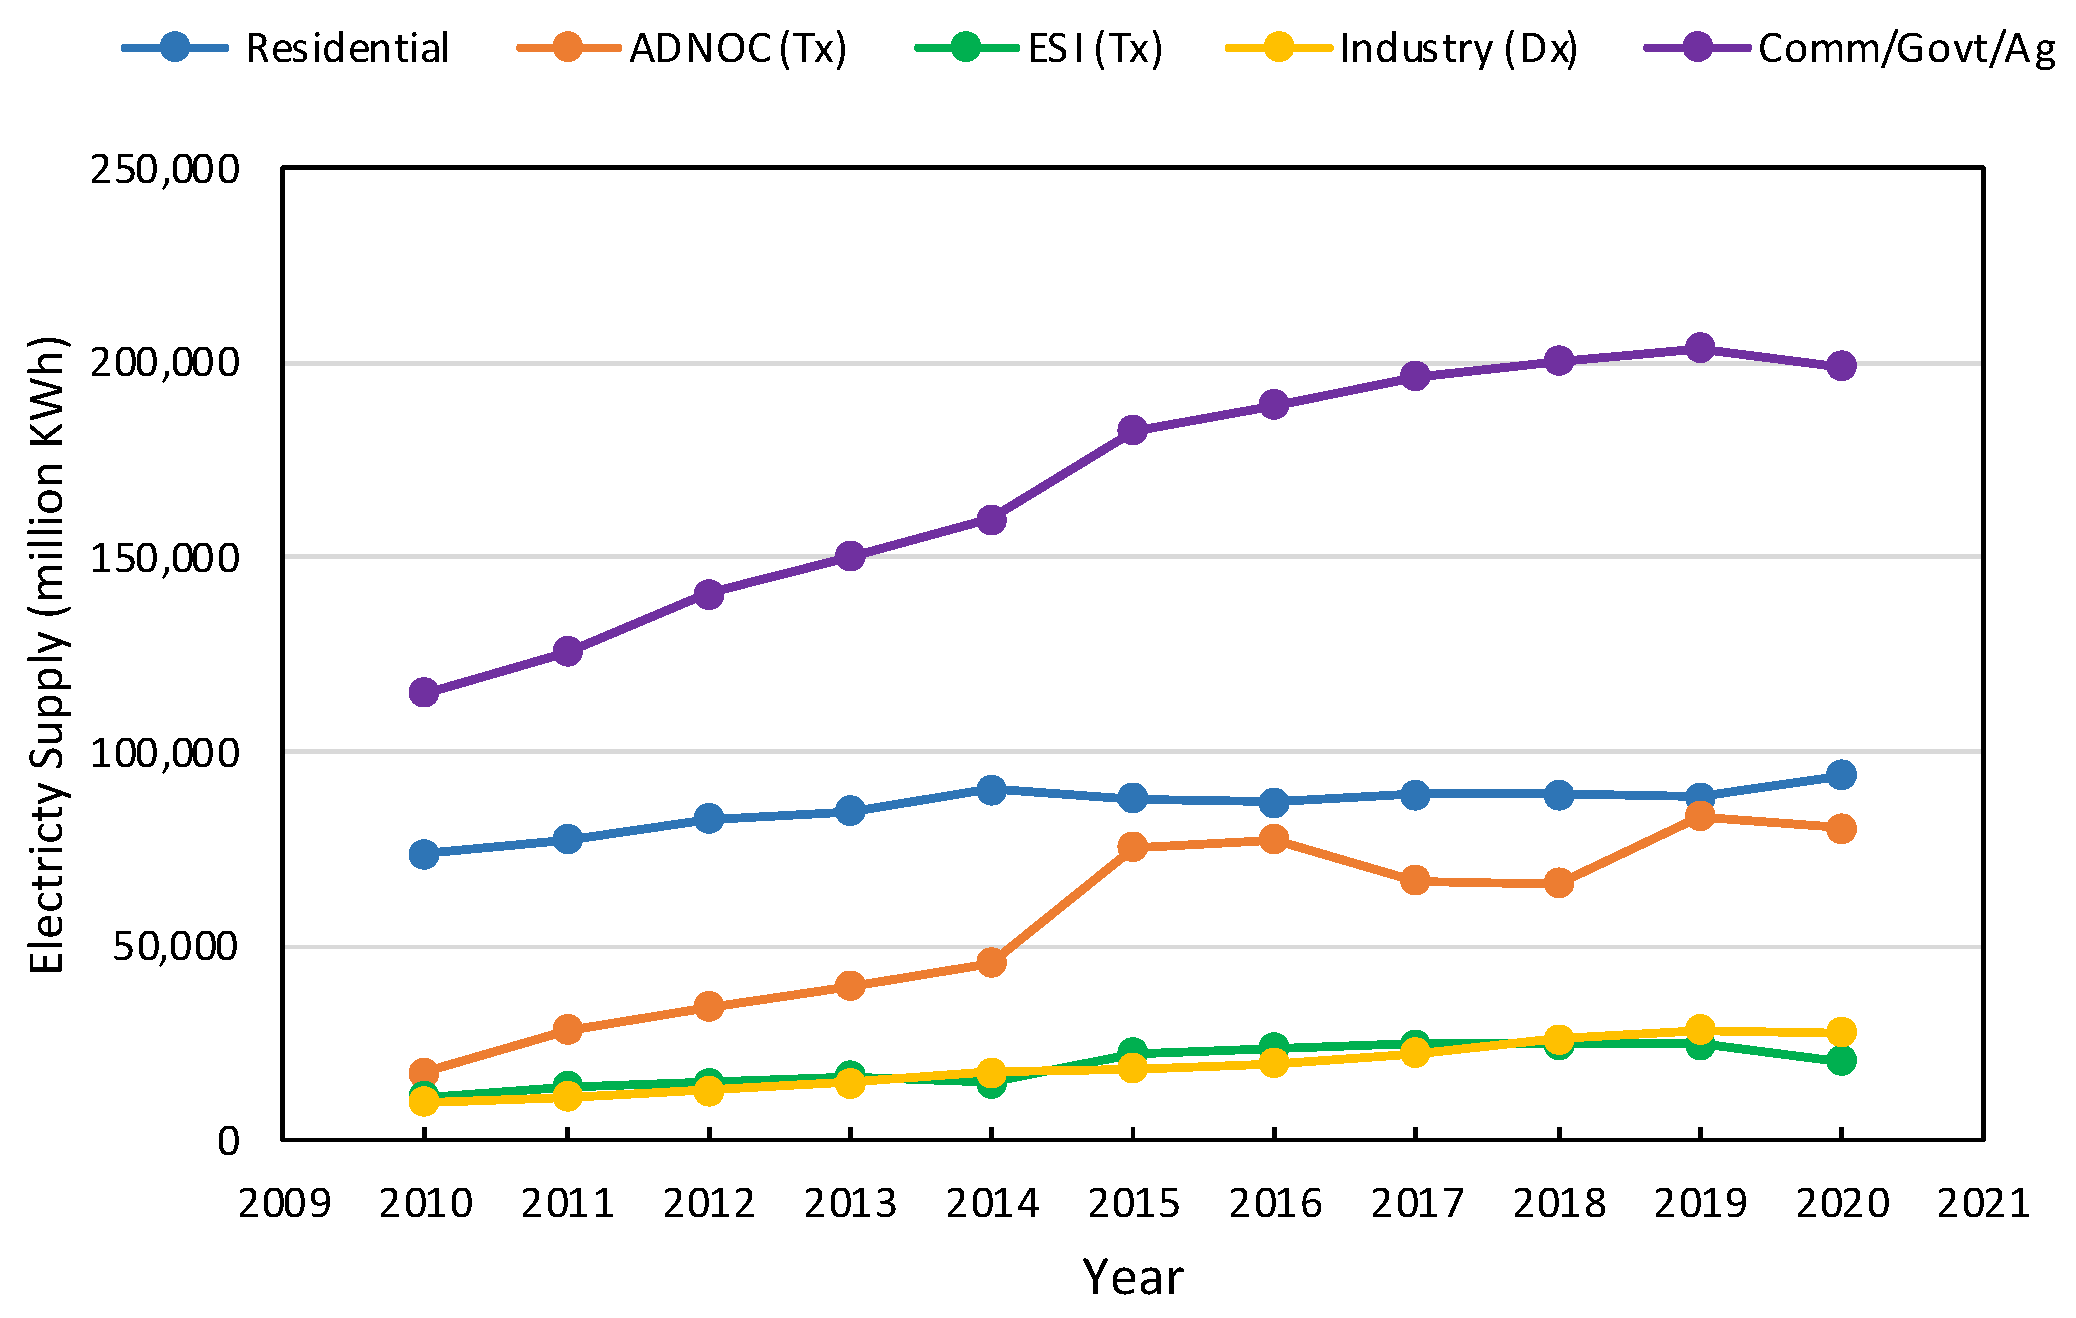
5.3. Electricity Supply and Water Consumption—Abu Dhabi

As shown in Figure 5 and Figure 6, the electricity consumption by the government, commercial, and agriculture sectors in 2020 (19,905,771,009 KWh) was more than twice as high as the residential supply (9,405,635,837 KWh), but their water consumption (320,759,089 m3/year) was nearly the same as that of residential users (326,437,439 m3/year). This is because water consumption depends mainly on personal consumption; however, electricity consumption depends on other factors, such as building characteristics/size, weather conditions, the energy efficiencies of electric devices, and the behavior of home/building occupants [12,81]. Additionally, it depends on the efficiency of the cooling and heating systems [12]. Hence, the government, commercial, and agriculture sectors use more energy for air-conditioning systems, and buildings are larger than residential houses. The demand control for electricity and water should focus on the different categories of consumers, namely, government, commercial, and agriculture, for electricity demand management and residential consumers for water demand management.

5.4. Decoupling of Electricity and Water—Abu Dhabi

It is interesting that electricity and water consumptions have decoupled since 2011 among nationals (Figure 7a and Figure 8a), but they have been synchronized among expats (Figure 7b and Figure 8b). This is due to the influence of persons per connection; namely, for nationals, persons per connection gradually decreased, while this statistic remained almost stable for expats [32]. The persons-per-home value has been decreasing for nationals because young families prefer to live as nuclear families rather than in traditional large families [32]. Thus, the rooms per person might have increased, along with the electricity consumption; however, the water consumption is dependent on persons, not floor area, and the number of rooms per person.
As shown in Figure 8b, the water consumption per capita among expats decreased after 2011 at a slow rate because of the Abu Dhabi government’s strategy to reduce the water consumption by using water-saving faucets [32] and decreased more after 2015 due partly to the increase in tariffs after 2015 (Appendix A, Table A3). This also occurred among nationals (Figure 8a): the water consumption decreased after 2011 and became almost stable after 2016.

5.5. GCC, KSA, and UAE GDP, Water, and Electricity Relations

Figure 8, Figure 9 and Figure 10 show that, similarly to Abu Dhabi, GDP has been decoupled from water production and electricity generation since 2015 in the GCC countries. However, the decoupling of water production and electricity generation from GDP was more obvious in the UAE than in the other GCC countries (Figure 11a,b). These results provide new insights against the results of previous analyses that there has been no decoupling between economic growth and energy demand in the Arab region in the preceding decades before 2013 [82]. Nevertheless, the growth in energy consumption has been faster than the economic growth during the past decade; the average annual GDP growth rate has been around 4%, while the increase in primary energy and electricity demand has been about 8% [82]. Higher growth rates of water and electricity demands pose threats to the future sustainability of water and electricity supply, but the recent decoupling of water and electricity demands from GDP and population indicates that such a risk has been gradually mitigated in the GCC countries. Nevertheless, it is important to reduce or at least stop the increase in fuel consumption for electricity and water supply. Demand management, along with supply management, should be integrated into the management policies of water and electricity supply in all GCC countries, including tariff reform by lowering or demolishing the subsidy.

5.6. Limitation of the Study

Although the decoupling of macroscale parameters (i.e., GDP and population) from water and electricity demands is verified in this study, a more detailed analysis in each sector of water and electricity consumption is necessary to elucidate the causes and effects of decoupling. Improved access to detailed water and electricity consumption data in the GCC countries would make it possible to carry out such studies. Additionally, a detailed analysis of economic activities that constitute GDP is required for understanding the cause of decoupling. In addition to the macroscale parameters (GDP and population), it is advisable to analyze the microscale parameters to predict water and electricity demands because it was shown in this study that the macroscale parameters are not good indicators for predicting water and electricity demands anymore. Although this study employed graphical analysis to verify decoupling of GDP and population from water and electricity demands, there could be other methods and tools to analyze and verify the facts presented in this study. It is also important to understand how the uncovered decoupling will evolve in the future in the GCC countries.

6. Conclusions

The influence of macroscale parameters (i.e., GDP and population) was analyzed using statistical data obtained for the last 2 decades on water production, electricity generation, water and electricity consumption categories and connections, population, GDP, and oil price. The following conclusions can be made.
In Abu Dhabi, water production and electricity generation were correlated with GDP until 2014 but have been decoupled from GDP since 2015. Electricity generation was linearly correlated with population throughout the entire period of 1999–2020; however, water production has been decoupled from population since 2015. These decouplings can be explained by the three phases of economic growth and water and electricity demands in each of those phases. Macroscale parameters, such as GDP and population, influenced water and electricity consumption in the first phase of economic growth, but the growth of water and electricity demands then slowed down in the second phase. In the third phase, the national economy entered into a mature stage, so GDP and population were decoupled from water and electricity demands.
Abu Dhabi’s GDP highly depends on oil price, rather than oil production. The two major plummets in oil price in 2009 and 2015 caused sudden decreases in Abu Dhabi’s GDP. However, between 2011 and 2014, although the oil price plummeted, the GDP increased because of the economic reform implemented by the Abu Dhabi government to increase the nonoil economy. As the economy of Abu Dhabi matured, the water and electricity consumptions by residential consumers reached saturation points, in which all people had access to water and electricity and thereby could use as much as they needed. There were no further increases in water demands by residential consumers, even though the economy continued to grow.
However, in Abu Dhabi, electricity consumption was highest in the commercial/government/agriculture categories and is still increasing. Water consumption mainly depends on personal consumption; however, electricity consumption depends on other factors, such as building characteristics/size, weather conditions, the kinds of equipment being used, occupant behavior, and the efficiency of cooling and heating systems. Therefore, although electricity consumption is decoupled from GDP, it is important to reduce electricity consumption in the commercial, government, and agriculture sectors by building more energy-efficient buildings and air-conditioning systems.
In Abu Dhabi, electricity consumption has been decoupled from water consumption among nationals since 2011, but they have continued to be synchronized for expats. This is due to the influence of the persons-per-connection value; namely, persons per home has been decreasing for nationals, as young families prefer to live as nuclear families rather than in traditional large families. Therefore, the rooms-per-person value has increased, and so has electricity consumption. However, water consumption is dependent on persons, not floor area per person. Water consumption for nationals and expats has been decreasing since 2011 due to the Abu Dhabi government’s strategy to reduce water consumption by using water-saving faucets.
The water production and electricity generation in Abu Dhabi are highly dependent on fossil fuel, especially natural gas. The high volatility of the natural gas price makes it difficult to estimate water production and electricity generation costs. Hence, it is important to have a sustainable supply of water and electricity in Abu Dhabi, nay, in all GCC countries, to reduce the demands for water and electricity.
Similarly to Abu Dhabi, in all GCC countries, including the KSA and UAE, water production and electricity generation have been decoupled from GDP since 2015, which indicates the similarity of the economies in the GCC countries for water and electricity demands. Thus, the detailed analysis results for Abu Dhabi could be adapted to other GCC countries.
Although the growth in electricity consumption has been faster than the economic growth over the past decades, the faster growth of consumption compared with GDP undermines the future sustainability of the electricity and power supply due to the increasing and variable costs. However, it was found in this study that both water production and electricity generation, which reflects consumption, have been decoupled from macroscale parameters, such as GDP and population. The results of this study, therefore, indicate a reduction in future risks in the sustainability of water and electricity supplies in the GCC countries. As a next step, it is important to look into microscale parameters that have a greater influence on water and electricity consumptions than macroscale parameters to make the water and electricity supplies in GCC countries more sustainable.

Author Contributions

Conceptualization, S.T. and S.A.B.; methodology, S.T.; validation, S.T. and S.A.B.; formal analysis, S.A.B.; investigation, S.A.B.; resources, S.A.B.; data curation, S.A.B.; writing—original draft preparation, S.A.B.; writing—review and editing, S.T.; supervision, S.T.; project administration, S.T.; funding acquisition, S.A.B. All authors have read and agreed to the published version of the manuscript.

Funding

This research was funded by the Scholarship Office (SCO), the President of the UAE’s Distinguished Student Scholarship Program (DSS).

Institutional Review Board Statement

Not applicable.

Informed Consent Statement

Not applicable.

Data Availability Statement

Not applicable.

Acknowledgments

The authors extend their thanks to the Abu Dhabi Distribution Company (ADDC) for providing the data used in this paper.

Conflicts of Interest

The authors declare no conflict of interest.

Appendix A

Table A1. Abu Dhabi GDP by total and nonoil economic activity [74].
Activities20112012201320142015
Total641,831672,668702,941733,825779,984
Total Nonoil302,256320,052339,120368,060395,997
Agriculture, forestry, and fishing 50065264538354685755
Mining and quarrying (includes crude oil and natural gas)339,575352,615363,821365,765383,987
Manufacturing37,83038,31940,09042,84347,655
Electricity, gas, and water supply; waste management activities16,79818,07618,58920,51423,386
Construction83,75985,07785,54589,73893,807
Wholesale and retail trade; repair of motor vehicles and motorcycles23,31524,71926,70529,50232,476
Transportation and storage18,73920,59822,04223,82025,452
Accommodation and food services73147428792184298979
Information and communication18,80818,40918,46920,69221,779
Financial and insurance activities27,46233,04344,88653,04257,953
Real estate activities27,38431,81031,75737,16741,245
Professional, scientific, and technical 15,76114,93015,13715,50215,745
Administration and support services79327952803785889216
Public administration and defense 20,73823,99128,32729,74830,090
Education72877385774881038440
Human health and social work36125114680075058047
Art, recreation, and other services21462295194019552024
Activities of households as employers14701695258331533664
Imputed bank services −23,102−26,053−32,842−37,705−39,716
Table A2. Abu Dhabi national account by statistics [74].
Activities20112012201320142015
GDP at constant 2007 prices (million AED) 641,831672,668702,941733,825779,984
GDP at constant 2007 prices (annual % change)9.34.84.54.46.3
Oil value added at constant 2007 prices (million AED)339,575352,615363,821365,765383,987
Oil value added at constant 2007 prices (annual % change)11.73.83.20.55.0
Oil value added at constant 2007 prices (% contribution to total)52.952.451.849.849.2
Nonoil vale added at constant 2007 prices (million AED)302,256320,052339,120368,060395,997
Nonoil vale added at constant 2007 prices (annual % change)6.75.96.08.57.6
Nonoil value added at constant 2007 prices (% contribution to total)47.147.648.250.250.8
Table A3. Water tariff per month for the residential category before and after 2015 [32].
CategoryNationalExpat
Before 2015After 2015Before 2015After 2015
VillaFree0.57 USD/m3
up to 7 m3
0.6
$/m3
2.13 USD/m3 up to 5 m3
0.71 USD/m3 over 7 m32.83 USD/m3 over 5 m3
ApartmentFree0.57 USD/m3 up to 0.7 m30.6
$/m3
2.13 USD/m3 up to 0.7 m3
0.71 USD/m3 over 0.7 m32.83 USD/m3 over 0.7 m3

Appendix B

Figure A1. Relationship between oil and other liquid production (2003–2019). (a) GCC, (b) KSA, (c) UAE.
Sustainability 14 05386 g0a1
Figure A2. Time course of GDP, electricity, and water per capita for GCC, KSA, and UAE. (a) GDP, (b) electricity, (c) water.
Sustainability 14 05386 g0a2

References

  1. Qureshi, A. Challenges and prospects of using treated wastewater to manage water scarcity crises in the Gulf Cooperation Council (GCC) countries. Water 2020, 12, 1971. [Google Scholar] [CrossRef]
  2. Ruddell, D.M.; Dixon, P.G. The energy–water nexus: Are there tradeoffs between residential energy and water consumption in arid cities? Int. J. Biometeorol. 2014, 58, 1421–1431. [Google Scholar] [CrossRef] [PubMed]
  3. Mannan, M.; Al-Ansari, T.; Mackey, H.R.; Al-Ghamdi, S.G. Review Quantifying the energy, water, and food nexus: A review of the latest developments based on life-cycle assessment. J. Clean. Prod. 2018, 193, 300–314. [Google Scholar] [CrossRef]
  4. Stavenhagen, M.; Buurman, J.; Tortajada, C. Saving water in cities: Assessing policies for residential water demand management in four cities in Europe. Cities 2018, 79, 187–195. [Google Scholar] [CrossRef]
  5. Schewe, J.; Heinke, J.; Gerten, D.; Haddeland, I.; Arnell, N.W.; Clark, D.B.; Dankers, R.; Eisner, S.; Fekete, B.M.; Colon-Gonzalez, F.J.; et al. Multimodel assessment of water scarcity under climate change. Proc. Natl. Acad. Sci. USA 2014, 9, 3245–3250. [Google Scholar] [CrossRef] [Green Version]
  6. Jones, E.; Qadir, M.; Vliet, M.; Smakhtin, V.; Kang, S. The state of desalination and brine production: A global outlook. Sci. Total Environ. 2019, 657, 1343–1356. [Google Scholar] [CrossRef]
  7. Eltawil, M.A.; Zhengming, Z.; Yuan, L. A review of renewable energy technologies integrated with desalination systems. Renew. Sustain. Energy Rev. 2009, 13, 2245–2262. [Google Scholar] [CrossRef]
  8. Al-Karaghouli, A.; Kazmerski, L.L. Energy consumption and water production cost of conventional and renewable-energy-powered desalination processes. Renew. Sustain. Energy Rev. 2013, 24, 343–356. [Google Scholar] [CrossRef]
  9. Ghaffour, N.; Missimer, T.M.; Amy, G.L. Technical review and evaluation of the economics of water desalination: Current and future challenges for better water supply sustainability. Desalination 2013, 309, 197–207. [Google Scholar] [CrossRef] [Green Version]
  10. Eke, J.; Yusuf, A.; Giwa, A.; Sodiqc, A. The global status of desalination: An assessment of current desalination technologies, plants and capacity. Desalination 2020, 495, 114633. [Google Scholar] [CrossRef]
  11. International Energy Agency (IEA). Key Electricity Trends 2020. 2021. Available online: https://www.iea.org/articles/key-electricity-trends-2020 (accessed on 6 February 2022).
  12. Almasri, R.A.; Alshitawi, M.S. Electricity consumption indicators and energy efficiency in residential buildings in GCC countries: Extensive review. Energy Build. 2022, 255, 111664. [Google Scholar] [CrossRef]
  13. Al-Saidi, M.; Saliba, S. Water, Energy and Food Supply Security in the Gulf Cooperation Council (GCC) Countries—A Risk Perspective. Water 2019, 11, 445. [Google Scholar] [CrossRef] [Green Version]
  14. Al-Zubari, W.; Al-Turbak, A.; Zahid, W.; Al-Ruwis, K.; Al-Tkhais, A.; Al-Muataz, I.; Abdelwahab, A.; Murad, A.; Al-Harbi, M.; Al-Sulaymani, Z. An Overview of the GCC Unified Water Strategy (2016–2035). Desalination Water Treat. 2017, 81, 1–18. [Google Scholar] [CrossRef] [Green Version]
  15. Aldossary, N.; Rezgui, Y.; Kwan, A. An investigation into factors influencing domestic energy consumption in an energy subsidized developing economy. J. Habitat Int. 2015, 47, 41–51. [Google Scholar] [CrossRef]
  16. McDonnell, R.A. Circulations and Transformations of Energy and Water in Abu Dhabi’s Hydrosocial Cycle. J. Geoforum 2014, 57, 225–233. [Google Scholar] [CrossRef]
  17. Salahuddin, M.; Gow, J. Economic growth, Energy Consumption and CO2 emissions in Gulf Cooperation Council Countries. Energy 2014, 73, 44–58. [Google Scholar] [CrossRef]
  18. Chandrasekharam, D.; Lashin, A.; Al Arifi, N.; Al Bassam, A.; El Alfy, M.; Ranjith, P.G.; Varun, C.; Singh, H.K. The potential of high heat generating granites as EGS source to generate power and reduce CO2 emissions, western Arabian shield, Saudi Arabia. J. Afr. Earth Sci. 2015, 112, 213–233. [Google Scholar] [CrossRef]
  19. Chandrasekharam, D.; Lashin, A.; Al Arifi, N.; Al Bassam, A.; Varun, C. Desalination of Seawater using Geothermal Energy to Meet Future Fresh Water Demand of Saudi Arabia. Water Resour. Manag. 2017, 31, 781–792. [Google Scholar] [CrossRef]
  20. Saeed, M.; Ershath, M.; Al-Tisan, I. Perspective on desalination discharges and coastal environments of the Arabian Peninsula. Mar. Environ. Res. 2019, 145, 1–10. [Google Scholar] [CrossRef]
  21. Panagopoulos, A. Water-energy nexus: Desalination technologies and renewable energy sources. Environ. Sci. Pollut. Res. 2021, 28, 21009–21022. [Google Scholar] [CrossRef]
  22. Hameed, M.; Moradkhani, H.; Ahmadalipour, A.; Moftakhari, H.; Abbaszadeh, P.; Alipour, A. A review of the 21st century challenges in the food-energy-water security in the Middle East. Water 2019, 11, 682. [Google Scholar] [CrossRef] [Green Version]
  23. Mahmood, H.; Asadov, A.; Tanveer, M.; Furqan, M.; Yu, Z. Impact of Oil Price, Economic Growth and Urbanization on CO2 Emissions in GCC Countries: Asymmetry Analysis. Sustainability 2022, 14, 4562. [Google Scholar] [CrossRef]
  24. AL-Hamad, M.; Qamber, I. GCC electrical long-term peak load forecasting modeling using ANFIS and MLR methods. Arab. J. Basic Appl. Sci. 2019, 26, 269–282. [Google Scholar] [CrossRef] [Green Version]
  25. Department of Energy (DOE). Abu Dhabi Demand Side Management and Energy Rationalization Strategy 2030. 2019. Available online: https://www.doe.gov.ae/-/media/Project/DOE/Department-Of-Energy/Media-Center-Publications/English-Files/Abu-Dhabi-DSM-and-Energy-Rationalization-Strategy.pdf (accessed on 13 January 2022).
  26. Al-Badi, A.; Almubarak, I. Growing energy demand in the GCC countries. Arab. J. Basic Appl. Sci. 2019, 26, 488–496. [Google Scholar] [CrossRef] [Green Version]
  27. Alasseria, R.; Tripathia, A.; Raoa, T.J.; Sreekanthb, K.J. A review on implementation strategies for demand side management (DSM) in Kuwait through incentive-based demand response programs. Renew. Sustain. Energy Rev. 2017, 77, 617–635. [Google Scholar] [CrossRef]
  28. Abulibdeh, A.; Zaidan, E.; Al-Saidi, M. Development drivers of the water-energy-food nexus in the Gulf Cooperation Council region. Dev. Pract. 2019, 29, 582–593. [Google Scholar] [CrossRef]
  29. Saif, O.; Mezher, T.; Arafat, H.A. Water security in the GCC countries: Challenges and opportunities. Environ. Study Sci. 2014, 4, 329–346. [Google Scholar] [CrossRef]
  30. Griffiths, S. A review and assessment of energy policy in the Middle East and North Africa region. Energy Policy 2017, 102, 249–269. [Google Scholar] [CrossRef]
  31. Osman, M.; Gachino, G.; Hoque, A. Electricity consumption and economic growth in the GCC countries: Panel data analysis. Energy Policy 2016, 98, 318–327. [Google Scholar] [CrossRef]
  32. Al Bannay, S.; Kazam, S.; Oguma, K.; Takizawa, S.; Hashimoto, T. Water Demand Management Based on Water Consumption Data Analysis in the Emirate of Abu Dhabi. Water 2021, 13, 2827. [Google Scholar] [CrossRef]
  33. Grubb, M.; Edmonds, J.; Brink, P.; Morrison, M. The costs of limiting fossil-fuel CO2 emissions: A survey and analysis. Annu. Rev. Energy Environ. 1993, 18, 397–478. [Google Scholar] [CrossRef]
  34. Ringkjob, H.K.; Haugan, P.M.; Solbrekke, I.M. A review of modelling tools for energy and electricity systems with large shares of variable renewables. Renew. Sustain. Energy Rev. 2018, 96, 440–459. [Google Scholar] [CrossRef]
  35. Krook-Riekkola, A.; Berg, C.; Ahlgren, A.O.; Soderholm, P. Challenges in top-down and bottom-up soft-linking: Lessons from linking a Swedish energy system model with a CGE model. Energy 2017, 141, 803–817. [Google Scholar] [CrossRef]
  36. Vuuren, D.P.; Hoogwijk, M.; Barker, T.; Riahi, K.; Boeters, S.; Chateau, J.; Scrieciu, S.; Vliet, J.; Masui, T.; Blok, K.; et al. Comparison of top-down and bottom-up estimates of sectoral and regional greenhouse gas emission reduction potentials. Energy Policy 2009, 37, 5125–5139. [Google Scholar] [CrossRef]
  37. Hourcade, J.C.; Jaccard, M.; Bataille, C.; Ghersi, F. Hybrid modeling: New answers to old challenges. Energy J. 2006, 27, 1–12. [Google Scholar]
  38. Atalla, T.; Hunt, L. Modelling residential electricity demand in the GCC countries. Energy Econ. 2016, 59, 149–158. [Google Scholar] [CrossRef] [Green Version]
  39. AlKhars, M.A. Survey and analysis of the quantitative methods used in electricity research on GCC countries: 1983–2018. Heliyon 2019, 5, e02634. [Google Scholar] [CrossRef] [Green Version]
  40. Ahmed, V.; Saad, A.; Saleh, H.; Saboor, S.; Kasianov, N.; Alnaqbi, T. Implementation of Water Demand Forecasting Model to Aid Sustainable Water Supply Chain Management in UAE. Preprints 2020, 2020110205. Available online: https://www.preprints.org/manuscript/202011.0205/v1 (accessed on 10 March 2022).
  41. Al-Bajjali, S.K.; Shamayleh, A.Y. Estimating the determinants of electricity consumption in Jordan. Energy 2018, 147, 1311–1320. [Google Scholar] [CrossRef]
  42. Li, Y.; Wang, S.; Chen, B. Driving force analysis of the consumption of water and energy in China based on LMDI method. Energy Procedia 2019, 158, 4318–4322. [Google Scholar] [CrossRef]
  43. Khalifaa, A.; Caporinb, M.; Di Fonzob, T. Scenario-based forecast for the electricity demand in Qatar and the role of energy efficiency improvements. Energy Policy 2019, 127, 155–164. [Google Scholar] [CrossRef] [Green Version]
  44. Voskamp, I.M.; Sutton, N.B.; Stremke, S.; Rijnaarts, H.M. A systematic review of factors influencing spatiotemporal variability in urban water and energy consumption. J. Clean. Prod. 2020, 256, 120310. [Google Scholar] [CrossRef]
  45. Barles, S. Urban metabolism and river systems: An historical perspective e Paris and the Seine, 1790 e 1970. Hydrol. Earth Syst. Sci. 2007, 11, 1757–1769. [Google Scholar] [CrossRef] [Green Version]
  46. Gingrich, S.; Haidvogl, G.; Krausmann, F. The Danube and Vienna: Urban resource use, transport and land use 1800–1910. Reg. Environ. Chang. 2012, 12, 283–294. [Google Scholar] [CrossRef]
  47. Gorostiza, S.; Sauri, D.; March, H.; Saurí, D. Urban Ecology under Fire: Water Supply in Madrid during the Spanish Civil War. Antipode 2015, 47, 360–379. [Google Scholar] [CrossRef]
  48. Kim, E.; Barles, S. The energy consumption of Paris and its supply areas from the eighteenth century to the present. Reg. Environ. Chang. 2012, 12, 295–310. [Google Scholar] [CrossRef]
  49. Stergiouli, M.L.; Hadjibiros, K. The growing water imprint of Athens (Greece) throughout history. Reg. Environ. Chang. 2012, 12, 337–345. [Google Scholar] [CrossRef]
  50. Swaney, D.P.; Santoro, R.L.; Howarth, R.W.; Hong, B.; Donaghy, K.P. Historical changes in the food and water supply systems of the New York city metropolitan area. Reg. Environ. Chang. 2012, 12, 363–380. [Google Scholar] [CrossRef]
  51. Tello, E.; Ostos, J.R. Water consumption in Barcelona and its regional environmental imprint: A long-term history (1717–2008). Reg. Environ. Chang. 2012, 12, 347–361. [Google Scholar] [CrossRef]
  52. Athanassiadis, A.; Bouillard, P.; Crawford, R.H.; Khan, A.Z. Towards a dynamic approach to urban metabolism: Tracing the temporal evolution of Brussels’ urban metabolism from 1970 to 2010. J. Ind. Ecol. 2017, 21, 307–319. [Google Scholar] [CrossRef]
  53. Wang, X.; Wu, S.; Li, S. Urban metabolism of three cities in Jing-Jin-Ji urban agglomeration, China: Using the MuSIASEM approach. Sustainability 2017, 9, 1481. [Google Scholar] [CrossRef] [Green Version]
  54. Kalmykova, Y.; Rosado, L.; Patrício, J. Resource consumption drivers and pathways to reduction: Economy, policy and lifestyle impact on material flows at the national and urban scale. J. Clean. Prod. 2016, 132, 70–80. [Google Scholar] [CrossRef] [Green Version]
  55. GCC Publication. Population Statistics. 2020. Available online: https://gccstat.org/en/statistic/publications/population-statistics-in-gcc-countries (accessed on 7 February 2022).
  56. UAE Book. 2018. Available online: https://u.ae/en/about-the-uae (accessed on 16 January 2022).
  57. UAE Government. Available online: https://u.ae/en/about-the-uae/the-seven-emirates/abu-dhabi (accessed on 16 January 2022).
  58. Emirates Water and Electricity Company (EWEC). Statistical Leaflet 2020. Available online: https://www.ewec.ae/sites/default/files/documents/Statistical%20Leaflet%202020.pdf (accessed on 14 January 2022).
  59. Emirates Water and Electricity Company (EWEC). Statistical Report 2019. Available online: https://www.ewec.ae/sites/default/files/documents/Statistical%20Report%202019_0.pdf (accessed on 14 January 2022).
  60. Emirates Water and Electricity Company (EWEC). Abu Dhabi Population Data, 2017–2020; EWEC: Abu Dhabi, United Arab Emirates, 2021. [Google Scholar]
  61. Statistics Center Abu Dhabi (SCAD). Publication. Yearbook Abu Dhabi Population Data. Available online: https://www.scad.gov.ae/en/pages/GeneralPublications.aspx (accessed on 16 January 2022).
  62. Statistics Center Abu Dhabi (SCAD). GDP at Current Price. Available online: https://www.scad.gov.ae/en/pages/statistics.aspx?topicid=37 (accessed on 6 December 2021).
  63. Crude Oil Price. Available online: https://www.statista.com/statistics/262860/uk-brent-crude-oil-price-changes-since-1976/ (accessed on 17 December 2021).
  64. U.S. Energy Information Administration (EIA). Natural Gas Price. Available online: https://www.eia.gov/dnav/ng/hist/rngwhhdA.htm (accessed on 17 December 2021).
  65. Abu Dhabi Distribution Company (ADDC). Water and Electricity Consumption and Category Data, 2010–2020; ADDC: Abu Dhabi, United Arab Emirates, 2021. [Google Scholar]
  66. Abu Dhabi Distribution Company (ADDC). Water and Electricity Connection Data, 2010–2020; ADDC: Abu Dhabi, United Arab Emirates, 2021. [Google Scholar]
  67. GCC Statistic. Energy Statistics in GCC Countries. Available online: https://gccstat.org/en/statistic/publications/energy-statistics (accessed on 1 February 2022).
  68. Organization of Arab Petroleum Exporting Countries (OAPEC). Annual Statistical Reports. Available online: https://oapecorg.org/Home/Publications/Reports/Annual-Statistical-report (accessed on 3 February 2022).
  69. U.S. Energy Information and Administration (EIA). Electricity Data for UAE and KSA. Available online: https://www.eia.gov/international/data/country/ARE/electricity/electricity-generation?pd=2&p=00000000000000000000000000000fvu&u=0&f=A&v=mapbubble&a=-&i=none&vo=value&t=C&g=none&l=249--5&s=315532800000&e=1577836800000& (accessed on 3 February 2022).
  70. GCC Statistic. Water Statistics in GCC Countries. Available online: https://gccstat.org/en/statistic/publications/water-statistics-bulletin-in-gcc-countries (accessed on 1 February 2022).
  71. GCC Statistic. National Accounts. Available online: https://gccstat.org/en/statistic/publications/national-accounts-in-gcc-countries (accessed on 1 February 2022).
  72. World Bank Database. UAE and KSA GDP. Available online: https://datatopics.worldbank.org/world-development-indicators/themes/economy.html (accessed on 3 February 2022).
  73. U.S. Energy Information and Administration (EIA). Petroleum and Other Liquids Production for GCC, UAE and KSA. Available online: https://www.eia.gov/international/data/country/SAU/petroleum-and-other-liquids/annual-petroleum-and-other-liquids-production?pd=5&p=0000000000000000000000000000000000vg&u=0&f=A&v=mapbubble&a=-&i=none&vo=value&&t=C&g=none&l=249--199&s=94694400000&e=1609459200000 (accessed on 6 February 2022).
  74. Statistics Center Abu Dhabi (SCAD). National Account Abu Dhabi. 2015. Available online: https://www.scad.gov.ae/Release%20Documents/Annual%20National%20Accounts%20EN%20April%20FINAL.pdf (accessed on 25 January 2022).
  75. The Abu Dhabi Economic Vision 2030. 2008. Available online: https://www.actvet.gov.ae/en/Media/Lists/ELibraryLD/economic-vision-2030-full-versionEn.pdf (accessed on 22 February 2022).
  76. U.S. Energy Information and Administration (EIA). Today in Energy, Average Natural Gas Price in 2021. Available online: https://www.eia.gov/todayinenergy/detail.php?id=50778 (accessed on 23 January 2022).
  77. Wa, Y.; Zhu, Q.; Zhu, B. Comparisons of decoupling trends of global economic growth and energy T consumption between developed and developing countries. Energy Policy 2018, 116, 30–38. [Google Scholar]
  78. Rogoff, K. What’s behind the Drop in Oil Prices, World Economic Forum. Available online: https://www.weforum.org/agenda/2016/03/what-s-behind-the-drop-in-oil-prices/ (accessed on 17 January 2022).
  79. Tarver, E. Why the Price of Crude Oil Dropped in 2015, Investopedia. Available online: https://www.investopedia.com/articles/investing/102215/4-reasons-why-price-crude-oil-dropped.asp (accessed on 17 January 2022).
  80. Central Bank of the UAE. Annual Report 2014. Available online: https://www.centralbank.ae/en/publications (accessed on 2 February 2022).
  81. Friess, W.A.; Rakhshan, K. A review of passive envelope measures for improved building energy efficiency in the UAE. Renew. Sustain. Energy Rev. 2017, 72, 485–496. [Google Scholar] [CrossRef]
  82. Arab Forum for Environment and Development (AFER Report), Sustainable Energy. 2013. Available online: http://www.afedonline.org/en/reports/details/sustainable-energy (accessed on 3 February 2022).
Figure 1. Relationship of GDP with water production and electricity generation in Abu Dhabi (2001–2019). (a) GDP vs. water production; (b) GDP vs. electricity generation.
Sustainability 14 05386 g001
Figure 2. Relationship of population with water production and electricity generation for Abu Dhabi (1999–2020). (a) Population vs. water production; (b) population vs. electricity generation.
Sustainability 14 05386 g002
Figure 3. Oil price vs. Abu Dhabi’s GDP (2001–2019).
Sustainability 14 05386 g003
Figure 4. Fuel cost, consumption, and natural gas price in Abu Dhabi (1999–2020).
Sustainability 14 05386 g004
Figure 5. Water consumption by the consumer categories (2010–2020).
Sustainability 14 05386 g005
Figure 6. Electricity consumption by the consumer categories (2010–2020).
Sustainability 14 05386 g006
Figure 7. Water consumption per capita vs. number of connections. (a) Nationals; (b) expats.
Sustainability 14 05386 g007
Figure 8. Electricity consumption per capita vs. number of connections. (a) Nationals; (b) expats.
Sustainability 14 05386 g008
Figure 9. Water production and electricity generation vs. GDP in the GCC countries (2003–2019). (a) GDP vs. water production; (b) GDP vs. electricity generation.
Sustainability 14 05386 g009
Figure 10. Water production and electricity generation vs. GDP in the KSA (2003–2019). (a) Water production vs. GDP; (b) electricity generation vs. GDP.
Sustainability 14 05386 g010
Figure 11. Water production and electricity generation vs. GDP in UAE (2003–2019). (a) GDP vs. water production; (b) GDP vs. electricity generation.
Sustainability 14 05386 g011
Publisher’s Note: MDPI stays neutral with regard to jurisdictional claims in published maps and institutional affiliations.

