Abstract
Transaction-specific investment and organizational performance are two core concepts in studies of transactions between firms. The existing literature has explored the effect of transaction-specific investment on organizational performance from three different theoretical perspectives: transaction cost economics (TCE), the resource-based view (RBV), and social exchange theory (SET). However, considerable ambiguities and inconsistencies exist among the hypotheses and relevant empirical study results, which have brought confusion to academic research and practice. This study adopted a meta-analysis method to conduct a quantitative review of 58 existing empirical studies, and obtained a total sample size of 16,092. These results suggest more TSIs in buyer–seller relationships, which can improve both economic and social performance, especially regarding technological performance and relationship performance. Moreover, tangible TSIs are more efficient, although they are considered vulnerable to opportunistic behavior in previous research, and contextual factors are also considered as moderators. These findings enrich the existing inter-firm relationship literature and provide clear suggestions for companies’ TSI decisions.
1. Introduction
With a changing market environment, increasing uncertainty, and fierce competition, an effective and stable channel relationship has become the cornerstone of companies’ steady development. In order to ensure the smooth progression of a transaction, the supplier or buyer usually invests in special assets, i.e., a transaction-specific investment (TSI), which is very popular and important in business-to-business relationships [1,2,3,4,5]. For example, Foxconn invested special production lines for Apple, P&G assigned special personnel to the Wal-Mart headquarters to coordinate the sales of P&G products, and suppliers invested in special logistics systems for buyers. Transaction-specific investment refers to a highly specialized and durable investment made by a company for a specific transaction partner or transaction relationship. If the relationship breaks down, the investor will face large sunk costs.
Based on transaction cost theory, some scholars believe that TSIs are similar to “pledges”, and that the party receiving the investment will take advantage of the investor and exhibit opportunistic behavior, which will increase transaction costs and negatively affect organizational performance [2,4,5]. For example, buyers may provide suppliers with personnel training and investments in production equipment, assets that increase production efficiency but also increase costs [6]. Due to their low residual value, these assets make it expensive for buyers to switch suppliers. The supplier knows that the buyer is somehow “locked” into the relationship and thereby has incentive to act opportunistically. For example, after the buyer makes a commitment to the transaction relationship, the supplier may ask for a price increase, etc. On the contrary, based on the theory of social exchange, some scholars believe that it is precisely because the TSI is difficult to reset that it promotes trust between the two parties and enables the two parties to maintain a good relationship, which, in turn, has a positive impact on the performance of the investor. As the transaction becomes rationalized, the trading partners see the relationship as an ongoing interdependence, the parties become more cooperative, and each party acts to enhance the performance of the other. In an environment where transactional relationships continue to be stable, transaction costs may decrease, delivery performance may improve, and partner satisfaction with the existing relationship may increase, all of which improve organizational performance [7].
These two completely different views have been tested by empirical research, which has brought confusion to academic research and management practice. TSI and organizational performance are two core concepts in studies on transactions between firms. The existing literature has explored the effect of transaction-specific investments on organizational performance, respectively, from three different theoretical perspectives: transaction cost economics (TCE), the resource-based view (RBV), and social exchange theory (SET). However, considerable ambiguities and inconsistencies exist among the hypotheses and relevant empirical study results, which have brought confusion to academic research and practice; thus, more objective and comprehensive research is urgently needed. The purpose of this paper is to combine the existing empirical research literature on the relationship between TSIs and organizational performance through a meta-analysis, by conducting a quantitative literature review, and by drawing relatively comprehensive, objective, and true conclusions. The meta-analysis method minimizes various biases in the results of a single study, and the data sources are comprehensive and reliable. By sorting out 58 published empirical research works and by adopting a meta-analysis method, the authors draw conclusions that enrich the existing inter-firm relationship literature and provide clear suggestions for companies’ TSI decisions.
2. Literature Review
2.1. Definition and Clustering of Transaction-Specific Investment
The concept of transaction-specific investment originated from transaction cost theory (TCE), which specifically refers to the resources dedicated to a specific relationship in order to support transactions. These resources are difficult to use in other relationships, and most of the resources are lost when the specific relationship is terminated. TSI has two attributes, specificity and persistence. TSI is highly specialized and difficult to reallocate in relationships with other transaction partners, thereby increasing the cost of exiting a specific transaction. Dedicated investments are ongoing investments that coordinate the collaborative efforts of both parties to make transactions more effective, thereby creating superior relationship value.
By reviewing the previous research on transaction-specific investments, the author found that transaction-specific investment mainly has the following classification methods, shown in Table 1.

Table 1.
Types of TSI.
Although scholars have classified different types of TSI according to their own research purposes, this paper believes that other classification methods can be incorporated into the two types of tangible assets and intangible assets. Among them, tangible assets refer to visible physical assets, such as plants, equipment, products, location-specific assets, etc. Intangible assets refer to intangible resources, including manpower, processes, and time.
In addition to distinguishing between tangible and intangible TSIs, the author also divides TSIs into joint TSIs and one-sided TSIs, according to the difference in the behavior of the subjects. Joint TSIs refer to the total amount of TSIs made by both parties in the channel, or the total amount of investments made by both parties for the same project. One-sided TSIs refer to the TSI of one party in the other; in this article, it refers to the central enterprise (performance measurer) investments in its upstream or downstream partners.
2.2. Definition and Clustering of Organizational Performance
Organizational performance is the core of strategic management. Enterprise performance includes not only financial performance (such as ROA, ROS, gross profit margin and other financial indicators), but also many non-financial performance indicators (such as operational efficiency, market competitiveness, technological innovation capabilities, etc.). Economic/financial performance refers to performance related to sales, sales profitability, sales growth, etc. (Corsten and Kumar, 2005) [11]. Operational performance refers to the performance related to the operational efficiency, customer performance, and the competitive performance of the enterprise. Relationship performance refers to the mutual economic benefits of a transaction relationship between both parties due to the existence and continuation of the relationship [12]. Jap (1999) [13] pointed out that relationship performance has two characteristics: (1) it is not the performance of one party, but the performance of both parties; (2) relationship performance is the performance increment brought by the relationship. Technology/innovation performance refers to the performance related to the company’s scientific and technological capabilities, new product development, etc. Specifically, Table 2 summarizes the existing common types of enterprise performance:
Table 2.
Types of Organizational Performance.
2.3. The Relationship between TSI and Organizational Performance
According to transaction cost theory (TCE), TSI may induce opportunistic behavior, thereby strengthening the demand for customized contracts between transaction parties and increasing transaction costs (Williamson, 1981) [8]. Crosno and Dahlstrom et al. [30] found that TSI will lead to opportunistic behavior. Lui et al. (2008) [31] and Katsikeas et al. (2009) [23] found that opportunistic behavior will have a negative impact on organizational performance. As a result, the value created by the dedicated investment will be offset by the increased transaction costs and will ultimately lead to a decline in organizational performance.
According to the resource-based view (RBV), many enterprises establish more stable cooperative relationships with a small number of partners, which are difficult to be imitated and replaced, creating value and competitive advantages for both parties (Dyer and Singh, 1998) [32]. Both Jap and Dyer’s findings suggest that dedicated investments can improve organizational performance.
According to social exchange theory (SET), due to the high replacement cost of a TSI, it can send a signal of willingness to develop a long-term cooperative relationship, enhance the degree of trust between the two parties, and promote the cooperation performance between enterprises. Long-term and stable cooperative relations can create extraordinary value. The empirical research results of Liu, Luo, and Liu (2009) [12], Aulakh and Masaaki (1997) [33], and Qian, Gao, and Ren (2014) [14] all show that TSI has a positive impact on organizational performance. Table 3 lists the main measures of TSI and organizational performance in the existing literature.
Table 3.
Main measures of dedicated investment and organizational performance.
Based on the above-mentioned theory and research review, the author finds that there are differences among the academic views on the relationship between TSI and organizational performance, mainly for the following reasons. First of all, the theoretical basis of the research is different, and the research method is also different. Due to different theoretical bases, different research perspectives, and different selections of variables, the research results will inevitably be inconsistent. Some studies use regression analysis, and some studies use case analysis. Even if regression analysis is used, the regression models are not the same. Secondly, due to the different research purposes, the classification and measurement dimensions of TSI and enterprise performance are also different in different studies, which makes the research results vary widely. Finally, limited by research resources, there are differences in the sample countries, sample industries, and sample sizes selected for each study, resulting in the incompatibility of the research results.
As a further synthesis and improvement of the existing research, the meta-analysis conducted in this paper can make up for the limitation of the limited source of a single research sample to a certain extent, and by synthesizing the data of a large number of existing research results, it can reduce the complexity of research methods, research purposes, and other deviations caused by differences, so as to obtain relatively more universal conclusions.
3. Hypotheses
3.1. Conceptual Model
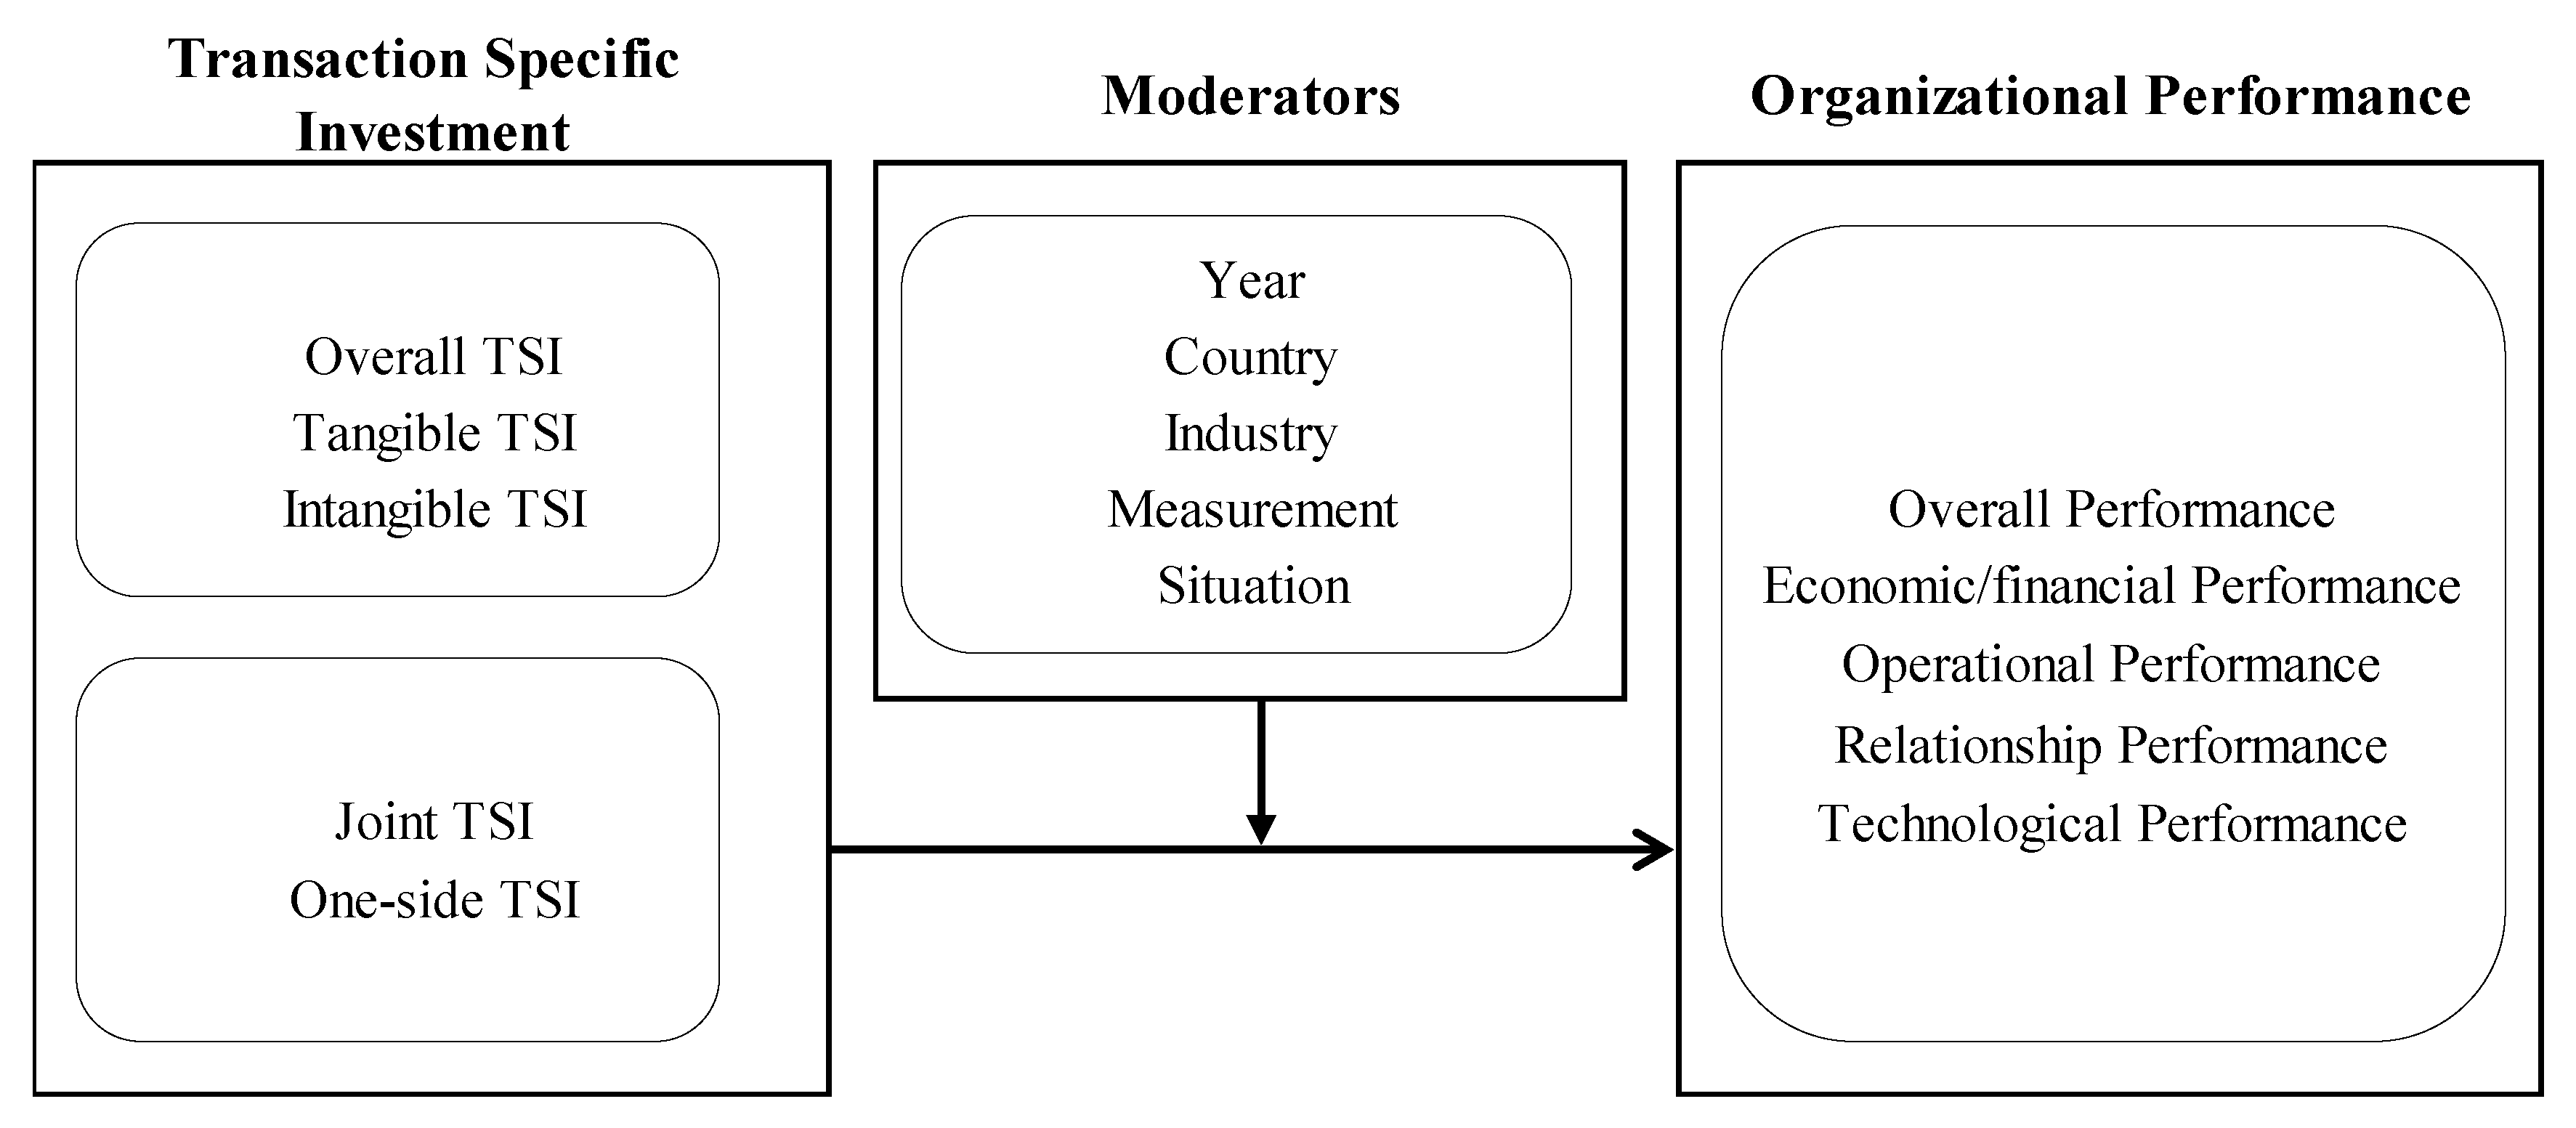
The main effect studied in this paper is the relationship between TSI and organizational performance. In addition, this paper will also explore the moderating effect of the characteristics of the empirical literature on the main effect. One of the advantages of meta-analyses is that they can explore the potential moderating effect of the characteristics of the original literature (such as publication year, measurement method, sample source, etc.) on the main effect. The research model proposed in this paper is shown in Figure 1, and each hypothesis will be discussed in detail below.

Figure 1.
Conceptual Model.
3.2. The Relationship between TSI and Organizational Performance
Although TSI performance and organizational performance are still inconclusive, the author found that the correlation coefficient r between the two is mostly positive by browsing the collected literature. Transaction cost economics (TCE) holds that asset specificity will strengthen the demand for customized contracts by both parties, thereby increasing contract costs, and customized contracts can inhibit opportunistic behavior, thereby objectively improving the relationship performance of both parties. As far as the reality is concerned, more and more enterprises pay attention to the investment in and protection of TSIs, perhaps because of the necessity and promotion of TSIs. Therefore, this paper proposes the first hypothesis:
Hypothesis 1 (H1):
TSI has a positive impact on organizational performance.
TSI can be divided into intangible and tangible categories. Intangible TSIs mainly involve time, processes, personnel, etc., and tangible TSIs mainly include plants and equipment. Intangible assets are highly liquid and transferable, while tangible assets have higher replacement costs. Therefore, this paper speculates that tangible TSIs can better convey the signal of long-term cooperation, so as to establish long-term and stable cooperative relationships and create extraordinary value. Based on this, this paper proposes the following assumptions:
Hypothesis 2 (H2):
Compared with intangible TSI, tangible TSI has a greater positive impact on organizational performance.
In this paper, TSI is also divided into two types: one-way and two-way TSIs. One-sided TSIs easily place the investor in a passive position, and the recipient of the investment takes advantage of the investor, while joint TSIs are equivalent to the exchange of “pledges” between the two parties, tying the two parties together and causing either party to exhibit opportunistic behavior. Such TSIs are less likely because opportunistic behaviors by one party may be met with the same retaliation by the other party (Artz, Kendall W, 1999) [41]. Therefore, this paper assumes:
Hypothesis 3 (H3):
Compared with one-sided TSI, joint TSI has a greater positive impact on organizational performance.
When faced with different types of organizational performance, the effect of TSI may also be different. Regarding technological performance and relationship performance, the role of TSI may be the most obvious. As far as technological performance is concerned, TSIs by suppliers, such as participating in new product development, can shorten the product development cycle, reduce development costs, and improve product quality, which can directly improve manufacturers’ technical capabilities and knowledge acquisition capabilities, thus becoming an important strategy for companies to improve their technological performance. As far as relationship performance is concerned, much of the existing literature also shows the direct improvement of specific investments on relationship performance and regard them as important factors that affect relationship performance. However, for operational performance and relationship performance, the effect of a TSI will be reduced to a certain extent. This is because TSIs will also bring certain financial costs when they play a role. This financial cost has an impact on financial performance and overall performance. The “discount” is most pronounced, while operational performance is similarly impaired, albeit to a lesser extent, as it is more closely related to financial costs. In summary, this paper proposes the following assumptions:
Hypothesis 4 (H4):
The promotional effect of TSI on the performance of different types of enterprises is not the same. Specifically, the promotion of scientific and technological performance and relational performance has the greatest effect, followed by the promotion of operational performance, with the promotion of financial performance and overall performance having the least effect.
3.3. The Influence of Literature Characteristics on the Relationship between TSI and Organizational Performance
With the development of science and technology and the increasingly fierce market competition, there are more and more uncertain factors inside and outside the enterprise. Therefore, a stable cooperative relationship is increasingly important for enterprise performance. Among the 58 documents collected in this paper, the number of documents from 1988 to 2004 is 16, and the number of documents from 2005 to 2015 is 42. It can be seen that the academic circles have paid high attention to TSI in the past ten years, which reflects that enterprises are paying more attention to TSI as well. The attention on TSI is also increasing. In addition, previous studies have identified a variety of mechanisms to inhibit opportunistic behavior and protect dedicated investments, including formal contracts, mortgages, information sharing, supplier auditing (Heide and John, 1990) [42], joint planning (Heide and John, 1990) [42], monitoring, quasi-integration, and reciprocity contracts (Williamson, 1981) [8]. After the protection mechanism is adopted for a TSI, the TSI can play its role better and bring benefits to enterprises. In summary, this paper proposes the following assumptions:
Hypothesis 5 (H5):
Compared with the literature published ten years ago, the average effect size between TSI and organizational performance in the literature of the past ten years is larger.
Different empirical studies use different methods to measure organizational performance. Some studies use Likert scales for measurement. Relationship performance, operational performance, technology/innovation performance, and overall performance are generally measured subjectively. Economic/financial performance is often measured by objective data. According to social exchange theory, TSI plays a social role in the channel relationship, which facilitates the influence on social norms, trust, and knowledge sharing, and improves objective measurements of organizational performance directly. Since the impact of TSI on economic/financial performance is relatively indirect, and as there are many other factors that also affect the financial performance of enterprises, the author assumes that the impact of a TSI on economic/financial performance is less than that of relational performance, and puts forward the following assumptions:
Hypothesis 6 (H6):
Compared with the subjective measurement of organizational performance, the positive impact of TSI on organizational performance is smaller in studies that use objective measurements of organizational performance.
Different sample sources of empirical research may lead to different conclusions. Compared with developed countries, emerging countries have relatively immature market systems and rules, weak foundations of trust, and more uncertainties. At the same time, detailed contracts clarify the responsibilities and obligations of transaction parties. Liu et al. (2009) [12] found that, in emerging markets with high uncertainty, customized contracts will promote suppliers. Regarding relationship performance with buyers, in emerging countries (such as China), due to the immaturity of the system, the role of relationships is more important, and TSI appears to maintain transactional relationships; thus, the author assumes that the role of TSI in emerging countries is more obvious than in developed countries:
Hypothesis 7 (H7):
Compared with studies from developed countries, the positive impact of TSI on organizational performance is greater in studies from emerging countries.
TSI is used in both the manufacturing and service industries, and the replacement cost of TSI in manufacturing (such as the input of production lines by suppliers for buyers, etc.) is generally higher than that of TSI in the service industry (such as the headquarters, specialized personnel, training, etc., provided by the franchisee). According to social exchange theory, the replacement cost of TSI is high, and it is easier for both parties to establish interdependence, thereby improving performance indirectly. The switch cost of TSI is higher in the manufacturing than in the service industry, which enhances the role of “pledges” and encourages both parties to leverage these TSIs more efficiently. Thus, TSI will have a higher performance level in the manufacturing industry (Liu et al., 2009) [12]. Therefore, this paper assumes:
Hypothesis 8 (H8):
Compared with studies whose samples are from the service industry, the positive impact of TSI on organizational performance is greater in studies on manufacturing.
The context of dedicated investment may also affect its effectiveness. Compared with buyers, suppliers know more about products and are more professional. The TSIs made by suppliers are often directly related to products (such as plants, equipment, production lines, etc.), which have obvious effects on product innovation and quality improvement. The buyers’ investment in the supplier (such as personnel training, time, logistics systems, etc.) is mainly for the purpose of maintaining the cooperative relationship, and rarely has a direct impact on the product performance. Due to the difference of the TSI’s specific form and function, buyers’ TSIs will have lower levels of organizational performance than suppliers’ TSIs. Therefore, this paper proposes the following assumptions:
Hypothesis 9 (H9):
Compared with the TSI in the supplier made by the buyer, the TSI in the buyer made by the supplier has a greater positive impact on the organizational performance.
4. Research Methods
4.1. Literature Search and Sample Characteristics
This study employs a variety of search techniques to retrieve appropriate empirical research literature (Crosno and Robert, 2008; Luo, Huang, and Wang, 2011) [30,43]. First, the authors used keywords such as “transaction-specific investment”, “asset specificity”, “idiosyncratic investments”, “relation-specific investment”, “specific asset”, “relationship performance”, “performance”, “ROA”, “ROS”, and “sales” in 6 electronic databases (JSTOR, EBSCO, Elsevier Science Direct, Springer, ProQuest, CNKI) for literature retrieval. Secondly, the authors searched for works not included in the above databases through Google Scholar. UTD 24 and FT50 journals, such as the Journal of Marketing, the Journal of Marketing Research, the Strategic Management Journal, the Journal of International Business Studies, etc., were manually searched. Since the number of empirical studies on the relationship between TSI and organizational performance is not too large, we have not set excluded keywords. We mainly judged these works by reading them. Through the above methods, the authors retrieved a total of 82 relevant empirical research works.
Since this paper aims to study the relationship between TSI and organizational performance through meta-analysis, the collected empirical research literature must meet the following conditions: (1) at least one variable representing organizational performance; (2) at least one variable reflecting TSI; and (3) the sample size N and the correlation coefficient r between TSI and organizational performance must be disclosed. According to the above conditions, this paper finally screened 58 empirical works (including 6 Chinese and 52 English works) that could be used for meta-research, with a total sample size of 16,092; the publication years of the works were distributed from 1988 to 2015—please refer to Table 4.
Table 4.
List of 58 works used for the meta-analysis.
4.2. Coding and Measurement
In order to record various data of the existing research, the author used Excel software to establish a database, and the publication year, journal name, author, variable definition, variable type, variable measurement dimension, variable measurement method, sample characteristics, and the r-values of investment and organizational performance were well documented and coded. The r value was chosen as the effect size in this paper because the correlation coefficient r is not affected by scale. In order to eliminate the errors that may be caused by manual coding, the author checked and improved the code on a one-by-one bases after it was completed, so it can be considered that the database truly and reliably reflects the characteristics and data of the original literature.
The final database consisted of 58 independent empirical research papers, with a total of 127 correlation coefficient r values and a sample size of 16,092. The number of correlation coefficients was larger than the number of documents because some documents contained multiple effect sizes. Some works subdivided the TSI, and, respectively, gave the correlation coefficient between the subdivided TSI and enterprise performance. In addition, some works used a variety of independent measurement dimensions for a certain type of TSI, and, respectively, gave the correlation coefficients. Correspondingly, there were also some works that subdivided organizational performance into three categories (economic performance, customer performance, and competitive performance), and gave the corresponding r values. Some works measured a certain category of organizational performance in different dimensions. The relationship performance was measured from the three dimensions of transaction cost, delivery performance, and satisfaction. In addition, some works not only classified or made multi-dimensional measurements of TSI (X category), but also classified or made multi-dimensional enterprise performance measurements (Y category), so the X*Y effective r values could be obtained. The TSIs were divided into two categories (physical assets and intellectual assets), and were measured from the two dimensions of operational performance and customer performance. The dimension of organizational performance yielded four corresponding correlation coefficient values. Therefore, although the total number of effect sizes is greater than the total number of articles, each effect size is independent.
4.3. Mean Effect Size Estimation and Heterogeneity Test
As the core content of the meta-analysis, the average effect size is used to determine the overall relationship of a pair of variables, and the heterogeneity test is used to determine whether the above relationship is consistent among different valid samples. Due to the existence of sample and measurement errors, this paper uses the average correlation coefficient after sample weighting and reliability correction as the average effect size of the estimated population. The specific operation includes the following steps: first, use Fisher’s Z to convert each r value into a Zr value, and calculate the standard deviation of the Zr value. Then, according to the sample size of each empirical study, calculate the effect before calculating and weighting the weight of the quantity. Finally, calculate the mean and standard error of the overall effect size.
In addition, we performed a Q-test for overall heterogeneity. The Q-test is a chi-square test that obeys a chi-square distribution with K-1 degrees of freedom (K is the sample size—that is, the number of effect sizes). If the results are statistically significant, then the effect sizes satisfy a heterogeneous distribution. That is, the relationship under study has significant differences between different valid samples, and the study is meaningful.
4.4. Moderating Effect Analysis
On the basis of the heterogeneity test, the moderating effect analysis can further explore the systematic factors that cause the differences in the existing research results. According to the classification of TSI, the classification of enterprise performance, the publication time of the work, the performance measurement method, the sample country, the sample industry, and the sample situation, this paper splits the sample to form multiple sub-samples, and analyzes the impact of these factors on the relationship between TSI and organizational performance.
5. Research Results
Table 5 lists the correlation coefficients and descriptive statistics among all variables in the model. According to the above research methods, this paper obtained the meta-analysis results and calculated the number of effect sizes (K), the sample-weighted correlation coefficient (r), the sample-weighted and reliability-corrected correlation coefficient (rc) and its standard error (SE), the confidence interval (CI) with a confidence level of 95%, and the Q value of the heterogeneity test, which are reported in Table 6.
Table 5.
The correlation coefficients and descriptive statistics.
Table 6.
Results of the meta-analysis.
It can be seen from Table 5 that, whether it is the total sample or each sub-sample, the Q value has passed the heterogeneity test. The average effect size of all TSIs on the performance of all enterprises is 0.120, and the Q value is equal to 3491.592. Through the heterogeneity test, this result supports H1. The average effect size of intangible TSIs on the performance of all enterprises is 0.068, while the average effect size of tangible TSIs on the performance of all enterprises is 0.314, which is 4.6 times that of the former; thus, H2 is verified. The average effect size of the one-sided TSI on the performance of all enterprises is 0.111, and the average effect size of the joint TSI on the performance of all enterprises is 0.266. The latter is greater than the former, so H3 is supported. By comparing the average effect sizes of all TSIs on the five types of organizational performance, the author found that the average effect size of all TSIs on overall performance was negative (−0.069), while the average effect sizes on the other four types of organizational performance were all positive values. The average effect size, in descending order, is: technology/innovation performance; relational performance; operational performance; economic/financial performance. The average effect size of the TSI on the five types of performance is not equal, verifying H4. The average effect size of the empirical research literature in the past ten years (2005–2015) is 0.158, which is much larger than the average effect size of 0.044 from 1988 to 2004, and H5 is verified. The average effect size using subjective measures (Likert-style questionnaires) was 0.125, which was about 1.5 times the average effect size of 0.083 using objective measures (financial data, etc.); thus, H6 is supported. The average effect size of samples from emerging countries is 0.431, while the average effect size of samples from developed countries is only 0.084. There is a significant difference between the two, and the former is about 5.1 times that of the latter, so H7 is verified. The sample industries are different, and the average effect sizes are also quite different. The average effect size of the manufacturing sample of 0.199 is almost 5 times the average effect size of the service sample of 0.041, so H8 is supported. The sample scenarios are divided into two categories. Among them, when the buyer makes a TSI in the supplier, the average effect value of the TSI on enterprise performance is 0.112, while when the supplier makes a TSI in the buyer, its value is 0.189. The latter is slightly larger than the former, which verifies H9 to a certain extent. In summary, the results of the meta-analysis basically support the research hypotheses.
6. Discussion
According to the meta-analysis results of this paper, TSI has a positive effect on organizational performance, which supports the social transaction theory and the resource-based view. However, the effect of all TSIs on overall performance is negative (−0.069). This paper attempts to explain thus from the following aspects: first, there are many factors affecting overall performance, such as economic and legal environment, corporate strategy, competition factors, etc. Investment is only a small part of this, and even if a specific investment has a positive impact, it is difficult to ensure that its impact on the overall performance will be positive [69,70]. Secondly, TSIs are not immediately effective at the time of investment, often requiring a period of time to produce benefits. If the time interval between the period of measuring performance and the period of investment in a TSI is not enough to make it work, its true effect value is difficult to measure.
The effect sizes of dedicated investments and various types of organizational performance are not equal. Among them, the effect value of TSI on technology/innovation performance is 0.305, which is much larger than its effect value on other performance types. There may be the following reasons for this situation: first, the high-tech industry is changing rapidly and faces increasingly greater challenges and external uncertainties, so high-tech enterprises need TSIs to establish stable cooperative relations. Second, the replacement cost of production equipment in high-tech industries is high; that is, its TSIs often have high replacement costs. The new product development process itself requires TSI, and the quality of a TSI directly affects the performance of new product development. In addition, the effect value of TSIs on relationship performance is 0.159, second only to technology/innovation performance. This is not difficult to explain, because the TSI itself is an investment based on the relationship between the two parties, and its impact on the performance of the relationship is the most direct. In contrast, the effect size of a dedicated investment on economic/financial performance is relatively small, at 0.121. First of all, TSIs will cost a certain amount of money and increase the expenses of the enterprise. If the benefits brought by them cannot cover their costs, they may cause damage to the financial performance of the enterprise. Secondly, the payback period of a TSI varies, and assets with large investments and long payback periods may have a low positive effect in the short term. Finally, in general, the effect of a TSI on the economic/financial performance of enterprises is positive, indicating that TSIs have created extraordinary value for both parties by improving the transaction relationship.
7. Theoretical and Management Implications
7.1. Theoretical Significance
There are different opinions in the academic field about the relationship between TSI and enterprise performance. Through a comprehensive analysis of empirical research in recent decades, this paper draws the conclusion that TSI is positively related to enterprise performance, which is a useful supplement to existing research. In addition, because the meta-analysis method can explore the moderating effect of the characteristics of the literature on the main effect, this paper verifies the moderating effect of the publication time, performance measurement method, sample country, sample industry, and sample context on the main effect. At the same time, this paper classifies TSI and enterprise performance, and verifies that different types of TSI have different effects on enterprise performance, and that the impact of TSI on different types of enterprise performance is also different, thus expanding the academic circle on the relationship between the two. This improved understanding can help later generations carry out more research in related fields.
7.2. Management Implications
This paper verifies the positive relationship between TSI and organizational performance, but this does not mean that TSI will always improve organizational performance. The conclusions of this paper have certain guiding significance for enterprises to use TSIs effectively. First of all, when enterprises use TSIs, they should consider what kind of TSI to use. The role of tangible assets is greater than that of intangible assets, but at the same time, the risks of tangible assets are also greater, and enterprises should make trade-offs when investing. Secondly, when measuring the effect of a TSI, companies should try to use relationship performance indicators, rather than simply using financial data, because TSIs have a more direct impact on relationship performance than do financial data. Of course, a business can measure performance from multiple dimensions at the same time. In emerging countries, TSI has a greater impact on organizational performance, but at the same time, due to the immature systems and institutions in emerging countries, there are also more uncertain factors. Therefore, when using professional investment in emerging countries, enterprises must establish sound TSI protection and control mechanisms, such as contracts, channel powers, etc. Finally, the TSIs made by manufacturing enterprises are more effective than those of the service industry. Therefore, manufacturing enterprises should be good at using TSIs to manage channel relationships, especially as suppliers, in order to obtain greater benefits from TSIs.
8. Limitations and Future Research
As this study only includes several databases that accept works written in English and Chinese, this paper examines 58 existing empirical research works, which do not cover all empirical research related to specific investments and organizational performance; thus, the scope of this research is still limited. Due to time constraints, academic database permissions, and other reasons, some documents could not be retrieved, or were retrieved but could not be downloaded, resulting in a limited research scope. In addition, due to the consideration of the small number of works and other factors, this paper only adopts the meta-analysis method of calculating the average effect size, heterogeneity tests, and moderating effect analyses by sub-samples, and does not adopt the method of comparing the number of works.
On the basis of this work, future research has the following directions. First, it will further expand the research scope and incorporate more empirical research into the scope of meta-research to make the sample size larger and the sample source more abundant, so as to obtain more representative, scientific, objective, and diverse research results. Second, adding moderator variables or intermediary variables, especially those related to main effects, such as uncertainty, opportunistic behavior, trust, commitment, company size, etc., will enable meta-research to draw more theoretical and managerial implications in the conclusion. Third, using the meta-regression method, multiple regression models were established to analyze the moderating effect of each variable, and more scientific research results were obtained.
Author Contributions
Conceptualization, L.Z.; Data curation, L.Z., S.Z., S.L. and L.W.; Formal analysis, Q.Z.; Funding acquisition, L.Z.; Investigation, Q.Z.; Methodology, L.Z., S.L. and L.W.; Supervision, L.Z.; Writing—original draft, L.Z. and S.L.; Writing—review & editing, L.Z., Q.Z. and S.Z. All authors have read and agreed to the published version of the manuscript.
Funding
This research was funded by the Social Science Program of Beijing (18GLB040), Huiyuan Excellent Young Scholars Program of University of international business and Economics (20YQ04), National Natural Science Foundation of China (No. 72171051), and the Fundamental Research Funds for the Central Universities in UIBE (No. CXTD11-04).
Institutional Review Board Statement
Not applicable.
Informed Consent Statement
Not applicable.
Data Availability Statement
Not applicable.
Conflicts of Interest
The authors declare no conflict of interest.
References
- Huang, M.C.; Kang, M.P.; Chiang, J.K. Can a supplier benefit from investing in transaction-specific investments? A multilevel model of the value co-creation ecosystem perspective. Supply Chain. Manag. Int. J. 2020, 25, 773–787. [Google Scholar] [CrossRef]
- Liu, Y.; Xue, J.; Li, Y. Transaction-specific investments in a supplier-distributor-supplier triad in China: Opportunism and cooperation. J. Bus. Ind. Mark. 2019, 34, 1297–1312. [Google Scholar] [CrossRef]
- Mo, C.; Yu, T.; de Ruyter, K.; Chen, C.-F. Unfolding the impacts of transaction-specific investments: Moderation by out-of-the-channel-loop perceptions and achievement orientations. Ind. Mark. Manag. 2019, 78, 17–26. [Google Scholar] [CrossRef]
- Wang, L.; Zhang, C.; Jiang, F. Matching governance mechanisms with transaction-specific investment types and supplier roles: An empirical study of cross-border outsourcing relationships. Int. Bus. Rev. 2019, 28, 316–327. [Google Scholar] [CrossRef]
- Yang, Q.; Wang, Q.; Zhao, X. A taxonomy of transaction-specific investments and its effects on cooperation in logistics outsourcing relationships. Int. J. Logist. Res. Appl. 2019, 22, 557–575. [Google Scholar] [CrossRef]
- Dyer, J.H. Specialized supplier networks as a source of competitive advantage: Evidence from the auto industry. Strateg. Manag. J. 1996, 17, 271–291. [Google Scholar] [CrossRef]
- Moslehpour, M.; Shalehah, A.; Rahman, F.F.; Lin, K.-H. The Effect of Physician Communication on Inpatient Satisfaction. Healthcare 2022, 10, 463. [Google Scholar] [CrossRef]
- Williamson, O.E. The economics of organization: The transaction cost approach. Am. J. Sociol. 1981, 87, 548–577. [Google Scholar] [CrossRef]
- Heide, J.B.; John, G. The role of dependence balancing in safeguarding transaction-specific assets in conventional channels. J. Mark. 1988, 52, 20–35. [Google Scholar] [CrossRef]
- Subramani, M.R.; Venkatraman, N. Safeguarding investments in asymmetric interorganizational relationships: Theory and evidence. Acad. Manag. J. 2003, 46, 46–62. [Google Scholar]
- Corsten, D.; Kumar, N. Do suppliers benefit from collaborative relationships with large retailers? An empirical investigation of efficient consumer response adoption. J. Mark. 2005, 69, 80–94. [Google Scholar] [CrossRef]
- Liu, Y.; Luo, Y.; Liu, T. Governing buyer-supplier relationships through transactional and relational mechanisms: Evidence from China. J. Oper. Manag. 2009, 27, 294–309. [Google Scholar] [CrossRef]
- Jap, S.D. Pie-expansion efforts: Collaboration processes in buyer-supplier relationships. J. Mark. Res. 1999, 36, 461–475. [Google Scholar]
- Hoetker, G.; Mellewigt, T. Choice and performance of governance mechanisms: Matching alliance governance to asset type. Strateg. Manag. J. 2009, 30, 1025–1044. [Google Scholar] [CrossRef]
- Shervani, T.A.; Frazier, G.; Challagalla, G. The moderating influence of firm market power on the transaction cost economics model: An empirical test in a forward channel integration context. Strateg. Manag. J. 2007, 28, 635–652. [Google Scholar] [CrossRef]
- Combs, J.G.; Ketchen, D.J., Jr. Explaining interfirm cooperation and performance: Toward a reconciliation of predictions from the resource-based view and organizational economics. Strateg. Manag. J. 1999, 20, 867–888. [Google Scholar] [CrossRef]
- Wagner, S.M.; Bode, C. Supplier relationship-specific investments and the role of safeguards for supplier innovation sharing. J. Oper. Manag. 2014, 32, 65–78. [Google Scholar] [CrossRef]
- Liping, Q.; Wei, G.; Xingyao, R. Impact of special investment of suppliers on long-term orientation of dealers. Manag. Rev. 2014, 26, 165–178. [Google Scholar]
- Claro, D.P.; Claro, P.B.O. The effects of trust, transaction specific investment and the moderating effect of information network on joint efforts in the Dutch Flower Industry. In Anais do IV Congresso Internacional de Economia e Gestão Agroalimentares—EGNA; Forum: Belo Horizonte, Brazil, 2003. [Google Scholar]
- Jap, S.D.; Anderson, E. Safeguarding interorganizational performance and continuity under ex post opportunism. Manag. Sci. 2003, 49, 1684–1701. [Google Scholar] [CrossRef] [Green Version]
- Jap, S.D. Perspectives on joint competitive advantages in buyer–supplier relationships. Int. J. Res. Mark. 2001, 18, 19–35. [Google Scholar] [CrossRef]
- Narasimhan, R.; Mahapatra, S.; Arlbjørn, J.S. Impact of relational norms, supplier development and trust on supplier performance. Oper. Manag. Res. 2008, 1, 24–30. [Google Scholar] [CrossRef]
- Katsikeas, C.S.; Skarmeas, D.; Bello, D.C. Developing successful trust-based international exchange relationships. J. Int. Bus. Stud. 2009, 40, 132–155. [Google Scholar] [CrossRef]
- Huang, L.Y.; Hsieh, Y.J.; Hsiao, P.L. Examining the antecedents to inter-partner credible threat in the international joint ventures. Int. Bus. Res. 2012, 5, 49. [Google Scholar] [CrossRef]
- Wang, G.; Wang, X.; Zheng, Y. Investing in guanxi: An analysis of interpersonal relation-specific investment (RSI) in China. Ind. Mark. Manag. 2014, 43, 659–670. [Google Scholar] [CrossRef]
- Skarmeas, D.; Robson, M.J. Determinants of relationship quality in importer–exporter relationships. Br. J. Manag. 2008, 19, 171–184. [Google Scholar] [CrossRef]
- Zaheer, A.; McEvily, B.; Perrone, V. Does trust matter? Exploring the effects of interorganizational and interpersonal trust on performance. Organ. Sci. 1998, 9, 141–159. [Google Scholar] [CrossRef]
- De Vita, G.; Tekaya, A.; Wang, C.L. Asset specificity’s impact on outsourcing relationship performance: A disaggregated analysis by buyer-supplier asset specificity dimensions. J. Bus. Res. 2010, 63, 657–666. [Google Scholar] [CrossRef]
- Xuehong, J.; Zhixiang, C.; Daoyin, S. Research on the relationship between supplier participation, specific investment and new product development performance. Manag. Rev. 2015, 27, 98–106. [Google Scholar]
- Crosno, J.L.; Dahlstrom, R. A meta-analytic review of opportunism in exchange relationships. J. Acad. Mark. Sci. 2008, 36, 191–201. [Google Scholar] [CrossRef]
- Lui, S.S.; Wong, Y.; Liu, W. Asset specificity roles in interfirm cooperation: Reducing opportunistic behavior or increasing cooperative behavior? J. Bus. Res. 2009, 62, 1214–1219. [Google Scholar] [CrossRef]
- Dyer, J.H.; Singh, H. The relational view: Cooperative strategy and sources of interorganizational competitive advantage. Acad. Manag. Rev. 1998, 23, 660–679. [Google Scholar] [CrossRef] [Green Version]
- Aulakh, P.S.; Kotabe, M. Antecedents and performance implications of channel integration in foreign markets. J. Int. Bus. Stud. 1997, 28, 145–175. [Google Scholar] [CrossRef]
- Jap, S.D.; Ganesan, S. Control mechanisms and the relationship life cycle: Implications for safeguarding specific investments and developing commitment. J. Mark. Res. 2000, 37, 227–245. [Google Scholar] [CrossRef]
- Gulati, R.; Nickerson, J.A. Interorganizational trust, governance choice, and exchange performance. Organ. Sci. 2008, 19, 688–708. [Google Scholar] [CrossRef] [Green Version]
- Jap, S.D. “Pie Sharing” in Complex Collaboration. J. Mark. Res. 2001, 38, 86–99. [Google Scholar] [CrossRef] [Green Version]
- Fadairo, M.; Lanchimba, C.; Windsperger, J. Network Form and Performance. The Case of Multi-Unit Franchising. The Case of Multi-Unit Franchising (March 2015); HAL Open Science: Lyon, France, 2015. [Google Scholar]
- Brown, J.R.; Crosno, J.L.; Dev, C.S. The effects of transaction-specific investments in marketing channels: The moderating role of relational norms. J. Mark. Theory Pract. 2009, 17, 317–334. [Google Scholar] [CrossRef]
- Skarmeas, D.; Katsikeas, S.; Schlegelmilch, B. Drivers of Commitment and Its Impact on Performance in Cross-cultural Buyer-seller Relationships: The Importer’s Perspective. J. Int. Bus. Stud. 2002, 33, 757–783. [Google Scholar] [CrossRef]
- Carson, S.J. When to give up control of outsourced new product development. J. Mark. 2007, 71, 49–66. [Google Scholar] [CrossRef]
- Artz, K.W. Buyer-supplier performance: The role of asset specificity, reciprocal investments and relational exchange. Br. J. Manag. 1999, 10, 113–126. [Google Scholar] [CrossRef]
- Heide, J.B.; John, G. Alliances in industrial purchasing: The determinants of joint action in buyer-supplier relationships. J. Mark. Res. 1990, 27, 24–36. [Google Scholar] [CrossRef]
- Luo, Y.; Huang, Y.; Wang, S.L. Guanxi and organizational performance: A meta-analysis. Manag. Organ. Rev. 2012, 8, 139–172. [Google Scholar] [CrossRef] [Green Version]
- Tungjitjarurn, W.; Suthiwartnarueput, K.; Pornchaiwiseskul, P. The Impact of supplier development on supplier performance: The role of buyer-supplier commitment, Thailand. Eur. J. Bus. Manag. 2012, 4, 183–193. [Google Scholar]
- Ecel, A.; Ntayi, J.; Ngoma, M. Supplier development and export performance of oil-seed agro-processing firms in Uganda. Eur. Sci. J. 2013, 9, 469–491. [Google Scholar]
- Ng, I.C.L.; Ding, D.X.; Yip, N. Outcome-based contracts as new business model: The role of partnership and value-driven relational assets. Ind. Mark. Manag. 2013, 42, 730–743. [Google Scholar] [CrossRef] [Green Version]
- Kohtamäki, M.; Vesalainen, J.; Henneberg, S.; Naudé, P.; Ventresca, M.J. Enabling relationship structures and relationship performance improvement: The moderating role of relational capital. Ind. Mark. Manag. 2012, 41, 1298–1309. [Google Scholar] [CrossRef]
- Sambasivan, M.; Siew-Phaik, L.; Mohamed, Z.A.; Leong, Y.C. Factors influencing strategic alliance outcomes in a manufacturing supply chain: Role of alliance motives, interdependence, asset specificity and relational capital. Int. J. Prod. Econ. 2013, 141, 339–351. [Google Scholar] [CrossRef]
- Li, W.; Humphreys, P.K.; Yeung, A.C.L.; Cheng, T.C.E. The impact of supplier development on buyer competitive advantage: A path analytic model. Int. J. Prod. Econ. 2012, 135, 353–366. [Google Scholar] [CrossRef]
- Abdul Rahman, A.; Bennett, D.; Sohal, A. Transaction attributes and buyer-supplier relationships in AMT acquisition and implementation: The case of Malaysia. Int. J. Prod. Res. 2009, 47, 2257–2278. [Google Scholar] [CrossRef]
- Bianchi, C.; Saleh, A. On importer trust and commitment: A comparative study of two developing countries. Int. Mark. Rev. 2010, 27, 55–86. [Google Scholar] [CrossRef] [Green Version]
- Griffith, D.A.; Lee, H.S.; Yeo, C.S.; Calantone, R. Marketing process adaptation: Antecedent factors and new product performance implications in export markets. Int. Mark. Rev. 2014, 31, 308–334. [Google Scholar] [CrossRef]
- Yen, Y.X.; Hung, S.W. How does supplier’s asset specificity affect product development performance? A relational exchange perspective. J. Bus. Ind. Mark. 2013, 8, 276–287. [Google Scholar] [CrossRef]
- Styles, C.; Patterson, P.G.; Ahmed, F. A relational model of export performance. J. Int. Bus. Stud. 2008, 39, 880–900. [Google Scholar] [CrossRef]
- Aulakh, P.S.; Kotabe, M.; Sahay, A. Trust and performance in cross-border marketing partnerships: A behavioral approach. J. Int. Bus. Stud. 1996, 27, 1005–1032. [Google Scholar] [CrossRef]
- Lui, S.S.; Ngo, H. The role of trust and contractual safeguards on cooperation in non-equity alliances. J. Manag. 2004, 30, 471–485. [Google Scholar] [CrossRef]
- Poppo, L.; Zhou, K.Z.; Zenger, T.R. Examining the conditional limits of relational governance: Specialized assets, performance ambiguity, and long-standing ties. J. Manag. Stud. 2008, 45, 1195–1216. [Google Scholar] [CrossRef]
- Krafft, M. An empirical investigation of the antecedents of sales force control systems. J. Mark. 1999, 63, 120–134. [Google Scholar] [CrossRef]
- Murtha, B.R.; Challagalla, G.; Kohli, A.K. The threat from within: Account managers’ concern about opportunism by their own team members. Manag. Sci. 2011, 57, 1580–1593. [Google Scholar] [CrossRef] [Green Version]
- Jap, S.D.; Anderson, E. Testing a life-cycle theory of cooperative interorganizational relationships: Movement across stages and performance. Manag. Sci. 2007, 53, 260–275. [Google Scholar] [CrossRef] [Green Version]
- Weiss, A.M.; Kurland, N. Holding distribution channel relationships together: The role of transaction-specific assets and length of prior relationship. Organ. Sci. 1997, 8, 612–623. [Google Scholar] [CrossRef] [Green Version]
- Bercovitz, J.; Jap, S.D.; Nickerson, J.A. The antecedents and performance implications of cooperative exchange norms. Organ. Sci. 2006, 17, 724–740. [Google Scholar] [CrossRef] [Green Version]
- Gurcaylilar-Yenidogan, T.; Windsperger, J. Inter-organizational performance in the automotive supply networks: The role of environmental uncertainty, specific investments and formal contracts. Procedia Soc. Behav. Sci. 2014, 150, 813–822. [Google Scholar] [CrossRef] [Green Version]
- Gurcaylilar-Yenidogan, T.; Duden, S.; Sarvan, F. The role of relationship-specific investments in improving performance: Multiple mediating effects of opportunism and cooperation. Procedia Soc. Behav. Sci. 2013, 99, 976–985. [Google Scholar] [CrossRef] [Green Version]
- Poppo, L.; Zenger, T. Testing alternative theories of the firm: Transaction cost, knowledge-based, and measurement explanations for make-or-buy decisions in information services. Strateg. Manag. J. 1998, 19, 853–877. [Google Scholar] [CrossRef]
- Lado, A.A.; Dant, R.R.; Tekleab, A.G. Trust-opportunism paradox, relationalism, and performance in interfirm relationships: Evidence from the retail industry. Strateg. Manag. J. 2008, 29, 401–423. [Google Scholar] [CrossRef]
- Mol, M.J.; Gedajlovic, E.R. The Effects of External Sourcing on Performance: A Longitudinal Study of the Dutch Manufacturing Industry; Working Paper; Erasmus University Rotterdam: Rotterdam, The Netherlands, 2015. [Google Scholar]
- Zheng, S.; Liu, Y.; Shun, B. How to improve the ability of contractors in innovative outsourcing projects—Path Analysis Based on special investment. Sci. Technol. Manag. Res. 2015, 21, 209–216. [Google Scholar]
- Camilleri, M.A. Strategic Attributions of Corporate social Responsibility and Environmental Management: The Business Case for Doing Well by Doing Good! In Sustainable Development; Wiley: Hoboken, NJ, USA, 2021. [Google Scholar]
- Camilleri, M.A. The employees’ state of mind during COVID-19: A self-determination theory perspective. Sustainability 2021, 13, 3634. [Google Scholar] [CrossRef]
Publisher’s Note: MDPI stays neutral with regard to jurisdictional claims in published maps and institutional affiliations. |
© 2022 by the authors. Licensee MDPI, Basel, Switzerland. This article is an open access article distributed under the terms and conditions of the Creative Commons Attribution (CC BY) license (https://creativecommons.org/licenses/by/4.0/).