Article

Flood Risk and Exposure: The Case of the Tajuña Valley (Madrid, Spain)

by
María Eugenia Pérez-González
1,
José María García-Alvarado
1,*,
María del Pilar García-Rodríguez
1,* and
Marta Blanco-González
2,*
1
Department of Geography, Universidad Complutense of Madrid, 28040 Madrid, Spain
2
Consultores en Biología de la Conservación S.L. C/Manuela Malasaña, 24, 28004 Madrid, Spain
*
Authors to whom correspondence should be addressed.
Sustainability 2022, 14(9), 5406; https://doi.org/10.3390/su14095406
Submission received: 21 March 2022 / Revised: 20 April 2022 / Accepted: 27 April 2022 / Published: 30 April 2022

Abstract

:
This paper aims to update the exposure to flood risk in a catchment area of the Community of Madrid (Spain) linked to primary sector activities, albeit affected by the urban expansion of the capital. This research starts with the updating of the flood inventory, encompassing episodes documented between 1629 and 2020. The inadequate occupation of the territory means that floods continue to cause significant damage nowadays. It is worth highlighting the two recent floods (2019) that occurred just 15 days apart and caused serious damage to several towns in the basin. The areas at risk of flooding are obtained from the National Floodplain Mapping System, and the maximum and minimum floodable volume in the sector of the Tajuña River basin with the highest exposure to flooding has been calculated. The Sentinel 2 image in false colour (RGB bands 11-2-3, 11-8-3 and 12-11-8) and its transformation to colour properties (Intensity, Hue and Saturation) has made it possible to determine the extension of the riparian vegetation and the irrigated crops located in the alluvial plain. The SPOT 6 image with higher spatial resolution has allowed us to update the mapping of buildings located in areas at risk of flooding. Finally, based on cadastral data, a detailed cartography of built-up areas in areas at risk of flooding is provided. They affect buildings built mainly between the 1960s and 1990s, although the most recent buildings are built on agricultural land in the alluvial plain, even though current regulations prevent the occupation of these lands.

1. Introduction

Floods are one of the most frequent and recurrent natural hazards in our society, and they also have a high socio-economic cost in terms of human lives. In Spain, floods have their greatest incidence and consequences on the Mediterranean coasts and basins [1,2], but they also occur on the other coasts and in the interior of the peninsula, although historically there have been fewer catastrophic events linked to this natural risk. The causes of floods include meteorological factors—causal agents—and the natural environment, as the main body responsible for draining these high-intensity phenomena, which are not necessarily anomalous in the climate. This natural environment, which should eventually adapt to possible events, is being gradually altered by the anthropic occupation of the land, leading to its waterproofing or sealing and the replacement of natural by artificial drainage. The negative consequences of soil sealing, which is inherent to urban growth, include an increase in surface runoff in episodes of heavy rainfall and an increase in the risk of flooding [3,4,5]. Globally, in recent decades there has been a notable increase in urban expansion on flood plains, which is of concern in Asia, but also in Europe [6], with the consequent increase in exposure and vulnerability to floods.
Floods in Spain have cost as much as approximately 800 million euros per year, reaching some 5.5 billion euros in the last 40 years. In addition, in the first two decades of the current century they have caused more than 200 deaths [4]. Therefore, it is a priority to direct efforts to reduce the risk and vulnerability of the population, and the consequent economic cost associated with these events, especially in the context of global change [7,8]. In recent years, serious floods have been occurring in connection with high spatial–temporal intensity rainfall events, which suggest changes in the amount or mode of rainfall—which has yet to be demonstrated in many places—although what is really occurring is a notable increase in the exposure of the population to these risks, with urban expansion occupying flood-prone areas [9,10].
With the aim of mitigating risks and catastrophes in Spain, Law 29/1985, of 2 August, on Water is approved. This law has subsequently been modified by means of different Royal Decrees and Action Plans, with the aim of improving the management and prevention of flood risks (Royal Decree 9/2008, of 11 January; RD 903/2010, of 9 July and the most recent: Royal Decree 638/2016, of 9 December). These decrees establish a series of obligations to manage flood risks, focused on the preliminary assessment based on danger and risk maps and on the correct coordination of the competent administrations in terms of citizen participation and the preparation of flood management plans. In the third and last reform, the preferential flow area is also defined, in which only those activities that are not vulnerable to flooding and that do not cause a reduction in drainage capacity may be authorized.
In the Tagus River basin, almost two hundred episodes have been inventoried from the mid-9th century to the present day [10,11]. Of these, more than a hundred have occurred in the Community of Madrid (63%), which, with only 14% of the surface area of the basin, is home to 80% of its population, thus increasing the vulnerability and damage caused [10]. Of the historical floods in the Community of Madrid, most have been inventoried in the most important population centres of the time (Aranjuez, Alcalá de Henares and Madrid), with few references to agricultural and livestock populations [12]. In these three cases, floods were largely caused by the overflowing of the rivers (the Tagus, Henares and Manzanares, respectively), although this cause has almost disappeared today, thanks to the hydraulic regulation carried out by means of an extensive network of reservoirs at the headwaters of the Tagus and its main tributaries. In contrast, floods are nowadays more closely linked to high-intensity local rainfall causing significant damage (also known as in situ rainfall), and to the occupation of alluvial plains [11]. From the Tagus basin, the frequency and magnitude of the floods have been analysed [13], along with the historical episodes [14], the causes of the floods in the Community of Madrid [15] and the danger and associated damage [16]. However, this specific information has not been found for the Tajuña sub-basin, except for that referred to in historical catalogues, such as newspaper archives and digital newspapers [10,11,12].
In the case of Madrid, exposure to flooding increases as urban sprawl extends over a wide region beyond the limits of the Community itself, with the consequent invasion of artificial uses in spaces that are still rustic, as they cannot be called natural [17]. This encroachment of artificial uses is often accompanied by soil sealing, which prevents the soil from fulfilling its function in the hydrological cycle and increases vulnerability to flooding in these areas [18].
An important fact in the territorial dynamics of the Madrid region has been the urban expansion in an environment that maintains a rural physiognomy because of the increase in the resident population [19]. Data on the evolution of the registered population in Madrid from 1985 to 2021 show an exponential growth, which has led to the Community of Madrid adding some two million more inhabitants in these years. In that same period, the southeast of the Community contributed some 65,000 inhabitants to Madrid. So, the southeast of the province has continued to grow even in years when the total for Madrid has stagnated or decreased [20].
It is interesting to note that in Spain, during the period of the economic crisis from 2008 to 2013, Madrid’s growth stagnated and even dropped, while in the southeast this effect was delayed and started to appear since 2013 onwards. From 2019 onwards, the number of people registering in the south-east has been taking an upward trend, given the recovery of house prices in Madrid and the new attraction of more open areas or the preference for larger homes due to the pandemic caused by COVID-19. In this sense, population growth has direct consequences on urban transformation and habitat structure. Urban sprawl and its paradoxical counter-urbanisation processes are noted for the transformation of natural land for artificial uses [21]. These changes and their recent evolution are what we intend to verify from the abundant cartographic and cadastral information. The high availability of cartographic information, satellite images and cadastral information, with extensive records in many countries, facilitates the monitoring of land occupation, and its use allows the assessment of risk areas almost in real time.
The first objective of this work is to evaluate how these transformations can affect the exposure to floods in a territory of high agricultural activity, but clearly influenced by the urban expansion of Madrid, as it is still preserved in the southeast of the Community.
As a second objective, we want to update the flood risk areas in the south of the Community of Madrid, in the Tajuña River basin, and to determine their exposure in a sample municipality with recent population growth. Thus, based on the mapping of flood-prone areas, field work and a detailed analysis of the available digital information, a detailed cartography of built-up areas in areas at risk of flooding is provided. The region selected is sufficiently far from the capital (about 40 km) but is influenced by its urban expansion, which has been affected by historical and current episodes of flooding (more than twenty documented floods), although this has not prevented new construction projects in areas at risk.

2. Materials and Methods
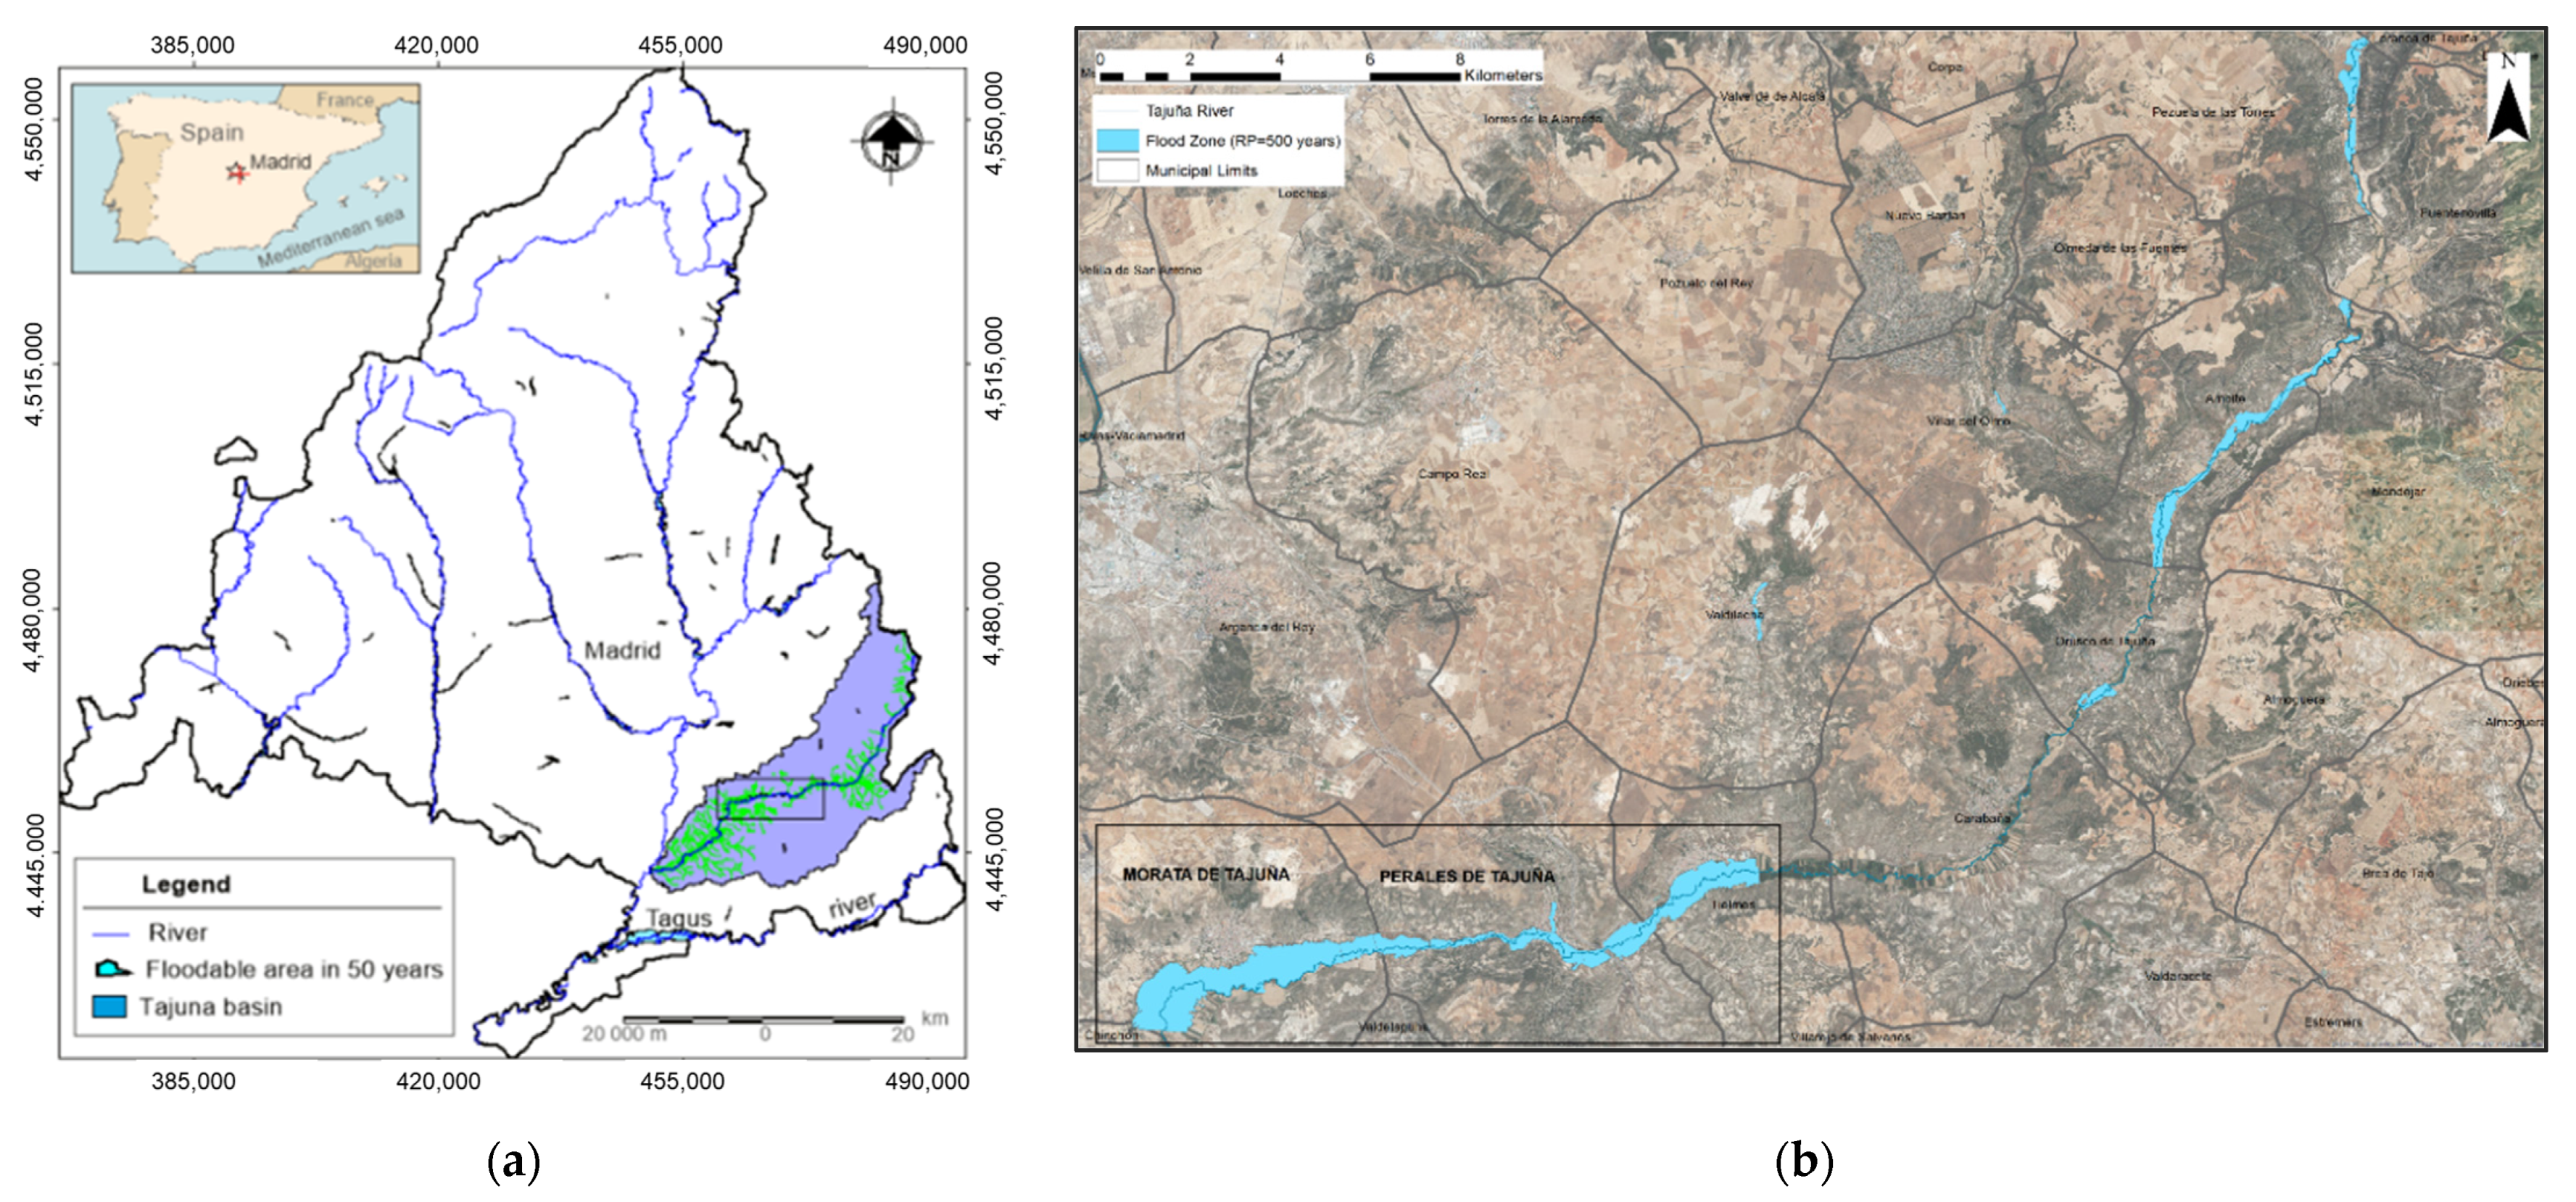
2.1. Study Area

The study area is the Tajuña River basin, about 30–40 km from the centre of Madrid (Spain) (Figure 1a). This river starts in the extreme north-east of Guadalajara and flows into the Jarama river in Titulcia, after 226 km, 58 km of which lie within the Community of Madrid, where it is included in the Southeast Natura Network Protected Area (Plains, Slopes and Plateau). The gradient of the basin ranges from 1130 m to 430 m at the mouth of the Jarama.
The river valley, with a NE–SW direction, has a rigid morpho-structural alignment due to discontinuities in the basin’s basement. The materials that make up this basin correspond to the sedimentary deposits of the central basin of the Tertiary Tagus depression, detrital evaporitic sediments deposited in an endorheic basin in conditions of climatic aridity during the Miocene, crowned by limestone from the end of the Miocene–Pliocene (Plateau Serie), and covered by Quaternary deposits of colluvial, fluvial and eolian origin [22].
The Tajuña valley has a dissymmetrical transverse profile, with a wide right bank with long, straight slopes, structured in glacis and terraces (six levels). In contrast, the left bank is steeper and narrower, with vertical slopes formed mainly by gypsum [23]. They may eventually be karstified, causing subsidence and giving rise to saline springs. The floodplain comprises sands, silts and clays. The dominant texture corresponds to gypsum-clayey silt and loamy-silt with some level of limestone pebbles [18]. The substratum of the whole area is gypsum materials, and so there are important karstification processes (Figure 2).
The Tajuña river in the study area between 1912 and 2018 has registered an average annual contribution of 150 Hm3, with an average annual flow of 4.7 m3/s (maximum of 22.4 and minimum of 1.8 m3/s) and a maximum instantaneous flow that has oscillated between 94.6 m3/s (17 August 1960) to 2.1 m3/s (5 October 1999). However, this maximum flow has barely exceeded 30 m3/s since the 1970s.
In general, the Tajuña river basin is of low hazard, but even so, some catastrophic floods have been recorded [10]. In this basin, the sectors at greatest risk of flooding are located between the towns of Morata and Perales de Tajuña (Figure 1a,b). Both are located on the right bank of the river Tajuña, on fluvial deposits, with some colluvial deposits to the north. Between the two villages and in the village of Perales itself, there are Vindobonian sediments formed by conglomerates, sandstones, clayey sands, and marls.
The climate is continental Mediterranean, with an average annual temperature of 12.6 °C (22.7 in July and 4.3 °C in January), an annual rainfall of 427 mm and a pluviometric regimen of equinoctial maximums and summer minimums, that exceed 10% per year. Rainfall is very irregular, with periods of dry spells (without rain) lasting up to 3.4 months. The maximum rainfall in 24 h frequently reaches values very similar to the monthly ones (average in Tielmes of 43 mm/October; 42 mm/day and 27 mm/hour). Without this being very frequent, there are occasionally strong storms with values between 40–70 mm/day, and maximums of 50–65 mm/2 h, which are the main causes of flooding [24]. It should be noted that in the south of the Madrid Community, flood risk warnings are given with rainfall of 30 mm in 1 h (orange or major weather hazard) and 60 mm/h (red or extreme weather hazard) [25].
The soils correspond [26] on the limestone moors to chromic and calcareous luvisols, calcareous cambisols and lithic, mollic and rendsic leptosols; on the slopes and terraces there are calcaric and gypsic regosols and calcaric gypsisols; and on the floodplain, calcaric fluvisols. The agrological capacity of these soils is very high in the river valley, and intermediate in the calcareous areas. At present, the fertile plains continue to maintain an important agricultural activity, while dry cereals and olive groves predominate in the moorlands.
The natural vegetation is very sparse, consisting mainly of holm oaks and calcicole and gypsum scrubland. In the higher areas there are dry cereal crops and olive trees, and in the flood plain there are irrigated crops with small areas of hygrophilous vegetation. Vineyards are the basis of a wine-growing area of the Madrid designation of origin. According to data from the Tagus Hydrological Plan, 42.88% of the river’s flow is used for irrigation or urban supply. In the Community of Madrid, some 3000 hectares are irrigated with the waters of the Tajuña, with almost 25% going to the municipality of Morata (743.26 ha) and 5.5% to Perales (165.00 ha).
The municipalities of the Tajuña are not among the largest in terms of population size in the Community of Madrid, as it is a region with a high proportion of primary activities. However, as can be seen in Figure 3, some municipalities have experienced the greatest growth. In these cases, they have large housing estates with large plots of land.

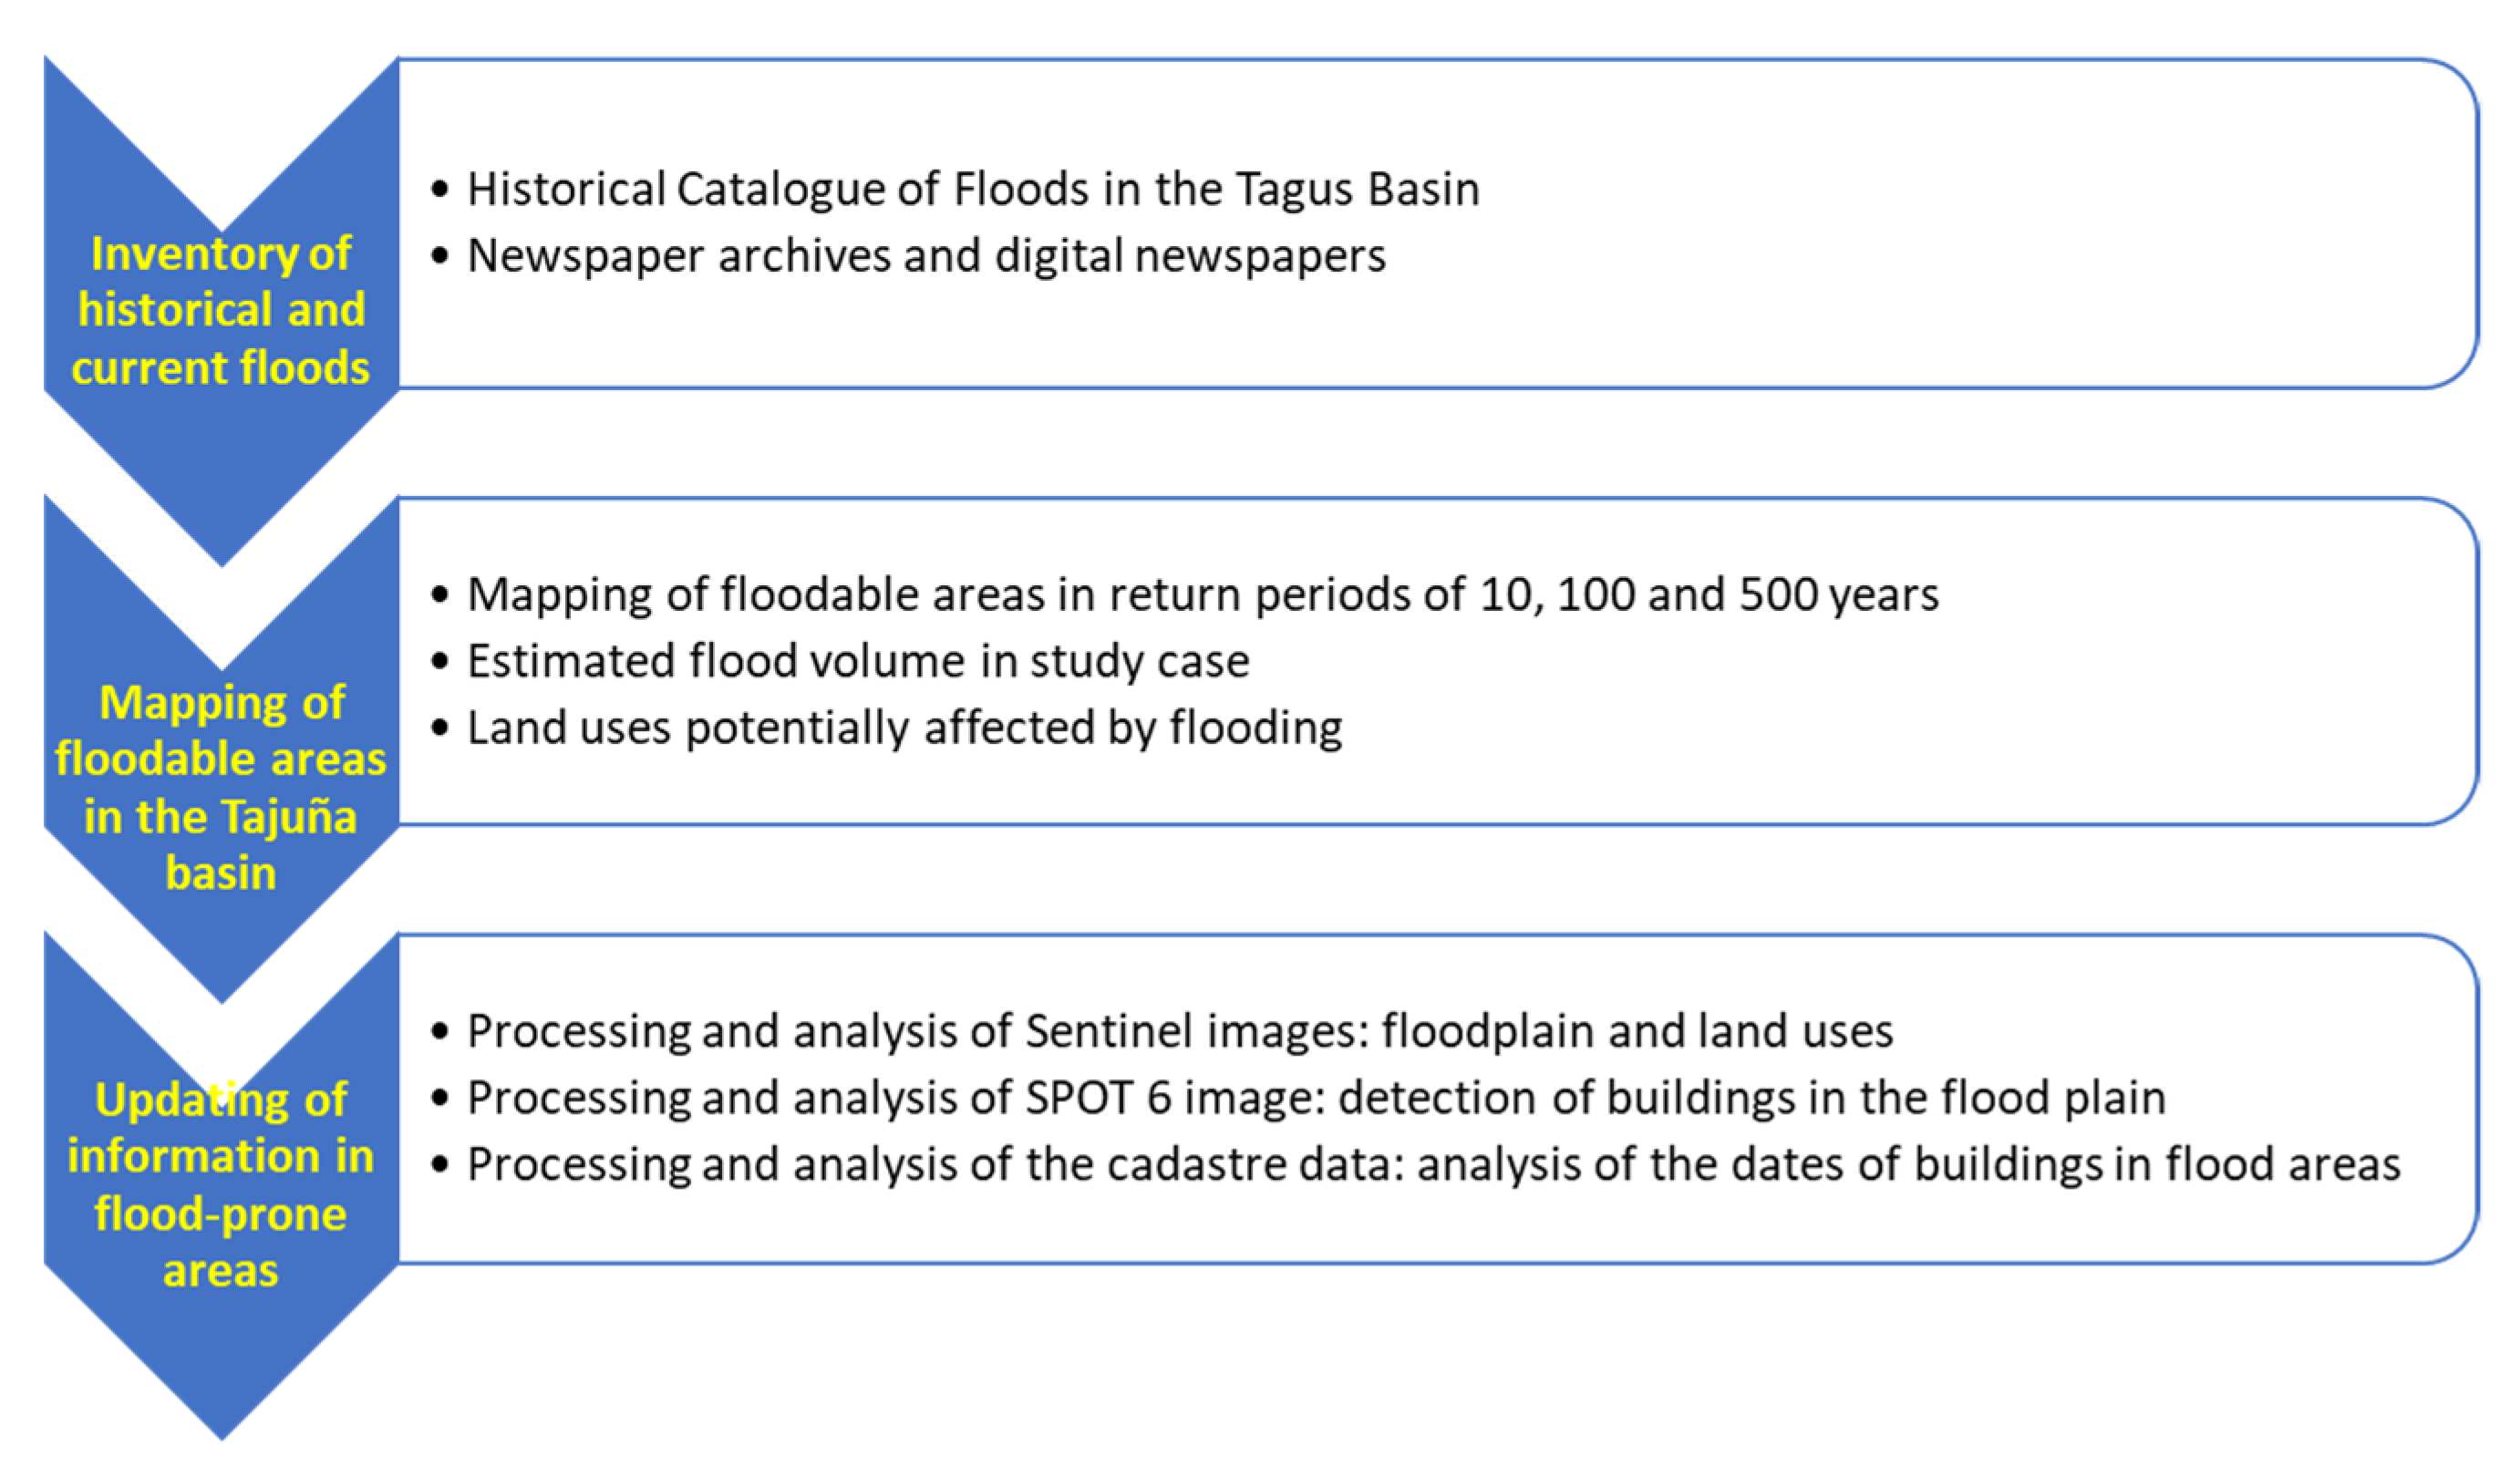
2.2. Methodology and Data Pre-Processing Sources Used

The main phases of the work methodology are summarized in the flow chart (Figure 4).

2.2.1. Historical and Current Floods in the Tajuña River Basin

The first phase of the work includes the inventory of historical and current floods in the Tajuña basin. For this purpose, the Historical Catalogue of Floods in the Tagus Basin [10,11] has been accessed and those that have occurred in the Community of Madrid in the Tajuña river sub-basin have been selected. This inventory has been completed with a selective search in newspaper archives and digital newspapers, among which the following stand out: ABC, in existence since 1903 [27], El País, since 1976 [28] and El Mundo, since 1989 [29]. The keywords used in the searches were: “Tajuña”, “flood”, “overflow” and “damage & flood”.

2.2.2. Mapping of Floodable Areas in the Tajuña Basin

The second phase consisted of obtaining the 10-, 50- and 500-year flood risk layers in the Tajuña basin, available in the National Floodplain Mapping System [30]. With these data, the sector with the greatest extension and exposure to flooding was determined, and the next step was to redefine the floodable area with the greatest risk (at 10 years) and calculate the estimated volume of water. For this purpose, Lidar (light detection and ranging) images in .laz format, obtained from the National Centre for Geographic Information [31], were used. These files are transformed to .la format in ESRI’s ArcMap software. This software was also used for calculating the statistics and for processing the properties of the layer to obtain the digital surface model configured to the UTM-zone 30 N projection and ETRS 1989 spheroid. The digital surface model (DSM) has a z-axis resolution of 20 cm.
Once the geometric information layer was generated, the calculation of the floodable area in the 10-year return period was carried out in the HEC-RAS software. In this programme, the information corresponding to the minor and major river channel and the control sections were digitised in accordance with the water flow direction. For the definition of the two lines of the minor riverbed (riverbanks), the viewer of the National Floodplain Mapping System [30] has been used as support information. This viewer will serve as a reference for the digitisation of the maximum flood area for the aforementioned recurrence period. The roughness values of the riverbed and riverbanks have been selected based on the method proposed by Cowan (1956) [32], recently used by Mosquera Flores and Rojas Ulco in 2019 [33]. In this method, the value of the roughness coefficient is estimated by the following formula:
n = m5 (n0 + n1 + n2 + n3 + n4),
where:
-
n0 is the base roughness for a straight, uniform, prismatic channel with homogeneous roughness
-
n1: additional roughness due to surface irregularities of the wetted perimeter along the length of the section being studied
-
n2: equivalent additional roughness due to variation in shape and dimensions of the sections along the section under study
-
n3: equivalent roughness due to existing obstructions in the watercourse
-
n4: equivalent additional roughness due to the presence of vegetation.
-
m5: correction factor for incorporating the effect of channel sinuosity or the presence of meanders.
The values that these variables can acquire correspond to the report generated by Felices (2007) [34]. The flow (m3/s) and channel boundary conditions were determined for the 10-year return period from data provided by the National Floodplain Mapping System.
The water flow of the river Tajuña as it passes through different rural nuclei varies, depending on the slope, from slow (<2% in Morata de Tajuña) to mixed (between 2–10% in Perales del Río). Finally, the calculation model is run according to these flows to obtain the image of areas at risk of flooding for the return period. This flood risk layer was then used for the evaluation on different dates of the buildings, uses and soil types that could be affected in the event of flooding.

2.2.3. Image Processing and Updating of Information on Flood-Prone Areas

The third phase deals with obtaining qualitative information on land use in the basin of the Tajuña River in the Community of Madrid, the extent of the rural nuclei of interest and their relationship with the areas at risk of flooding. For this purpose, images from the European satellites Sentinel 2 A and SPOT 6/7 have been used (Table 1). The former was downloaded from the open access server of the European Space Agency’s Copernicus programme [35], referenced to ground level reflectance values, i.e., atmospherically corrected and labelled S2-MSI-2A.
The Sentinel 2a image has been subset according to the area of the Tajuña basin from the corresponding vector layer, obtained from the Hydrographic confederation of the Tagus (Confederación Hidrográfica del Tajo) [36].
In the visual and digital analysis, the spectral bands of the blue, green, red, near infrared and two mid-infrared channels (Sentinel 2 bands 2, 3, 4, 8, 11 and 12, respectively) were used and all of them were processed at 10 m spatial resolution. Subsequently, the R-G-B band combinations that best identify the floodplain, rural settlements and isolated buildings were selected. These are the ones that combine mid-infrared (b11 and b12) and near-infrared (b8) with a visible channel: b11-b8-b4, b12-b8-b4, b8-b4-b3, or false colour infrared, or the combination called false colour urban (b11-b12-b8).
The Sentinel 2 image is also spectrally enhanced by the so-called RGB to IHS transformation. That is, the primary colours in RGB (red, green and blue) are transformed to colour properties: intensity, hue and saturation (IHS). This enhancement has proven to be suitable for geological applications, for combining images from different sensors [37] and for the detection of flood areas [38,39] due to the high spectral response of hygrophilous vegetation.
In SPOT 6, the multispectral bands have been fused with the panchromatic band to obtain a final image with 1.5 m spatial resolution. These allow a better visual identification of the isolated buildings located on the floodplain. To do this, the layer of the area affected by flooding is superimposed on the image and a subsequent photointerpretation of the different existing buildings is carried out. Finally, through field work, the typology of the buildings is identified (residential, for storage, for farm implements, etc.), and possible errors are corrected.
The processing of the two multispectral images was carried out with the ERDAS Imagine 2020 software.
Finally, the evolution of the land parcels at risk of flooding in a sample municipality (Perales de Tajuña) was analysed, based on the urban and rustic cadastre files obtained by downloading from Cadastre’s Electronic Headquarters [40] and aerial orthophotography [41]. The data for each plot includes information on the dates of the buildings (oldest, middle and most recent). As in this work we are interested in current processes, the most recent value of each plot was selected. They were finally grouped into four periods: <1939, from 1040-60, 1961–2000 and 2001–2021.

3. Results

3.1. Historical and Current Floods in the Tajuña River Basin

Floods have been recorded in the river Tajuña from the 17th century to the present day. Among the historical floods, those that have occurred in the years 1629, 1643, 1855, 1877, 1892, 1906, 1941, 1947, 1948, 1960 and 1978 stand out [10], because these are the floods that have affected urban centres and have caused great agricultural losses. Since 1985, the most important floods have occurred in 1987, 1989, 1990, 1995, 1996, 1998, 2007, 2019 and 2020 [11,27,28,29]. Obviously, the number of floods has been much higher, but not all of them are documented since they mainly caused damage to agriculture and did not affect population centres. However, changes in land use and legal and illegal urban and industrial development in recent decades have meant that these floods continue to cause significant damage. Of particular note are the two recent floods (2019) that occurred only 15 days apart, causing severe damage to several villages in the basin [29].
Since the 1980s, almost all floods have occurred in summer, a period characterised by summer drought, but which is also affected by the eventual passage of cold air at high altitude, in the form of a trough or DANA (Isolated Depression at High Levels, from its Spanish initials), which sometimes leads to stormy rainfall of high hourly or minute intensity. The amount recorded in Madrid does not usually reach outstanding daily figures (between 60–90 mm/day, often less than 20–40 mm/h), if compared to those recorded on the Spanish coasts. However, they do occur frequently in very short time intervals (10–30 min), which ends up causing flooding in the flatter areas [24,25] with sealed soils or in areas where artificial drainage infrastructures are blocked or insufficient. Among the highest hourly rainfall records that caused flooding in the study area, 35 mm/h (Carabaña, 24 July 1987) and 64.6 mm/12 h (Tielmes, 24 May 1998) stand out.
Regarding the causes of flooding, at present, a large part of the floods are caused in this basin by in situ rainfall. On the other hand, those produced in the past by the overflowing of the main rivers (which could be affected by the rainfall of the entire upper and middle basin) have been drastically minimised, thanks to the construction of reservoirs, which in the case of the Tajuña, is regulated by the Tajera reservoir, inaugurated in 1993 and reaching its maximum volume in 2003.

3.2. Risk and Exposure to Flooding

The Tajuña basin in the Community of Madrid has several stretches at risk of flooding, although in general this is low, as it probably has an impact within a 500-year return period (Figure 1). However, when descending to high risk (10-year return period), one municipality, Perales de Tajuña (Figure 5), stands out, with part of the urban centre affected. In addition, another part of this village is also affected by the return period of 100 and 500 years, with overlapping areas. In another three (Villar del Olmo, Orusco and Valdilecha) this risk is small or does not affect built-up areas for the moment [30].
From the calculation of the surface area and volume of the sheet of water with a 10-year flood risk, it has been possible to obtain a detailed cartography that allows us to evaluate this risk and the exposure of the most affected land uses. The data on volume are only relative, as they refer to maximum and minimum values, without expressing a specific quantity. Figure 6a shows the extent and intensity of the flood plain in Perales de Tajuña, which extends across the wide flood plain of the Tajuña, but also along the Arroyo de la Vega, which crosses the town from north to south. Furthermore, the maximum volume of the floodplain (dark blue in Figure 6a) is logically confined to the areas closest to the Tajuña riverbed, but also extends through part of the urban centre. As for the uses located in areas at risk, they not only affect the traditional agricultural uses most compatible with this risk (irrigated crops and pastures dedicated to sheep farming), but also numerous buildings within the urban area (continuous sealing) and others located on the flood plain itself (Figure 6b).

3.3. Image Information

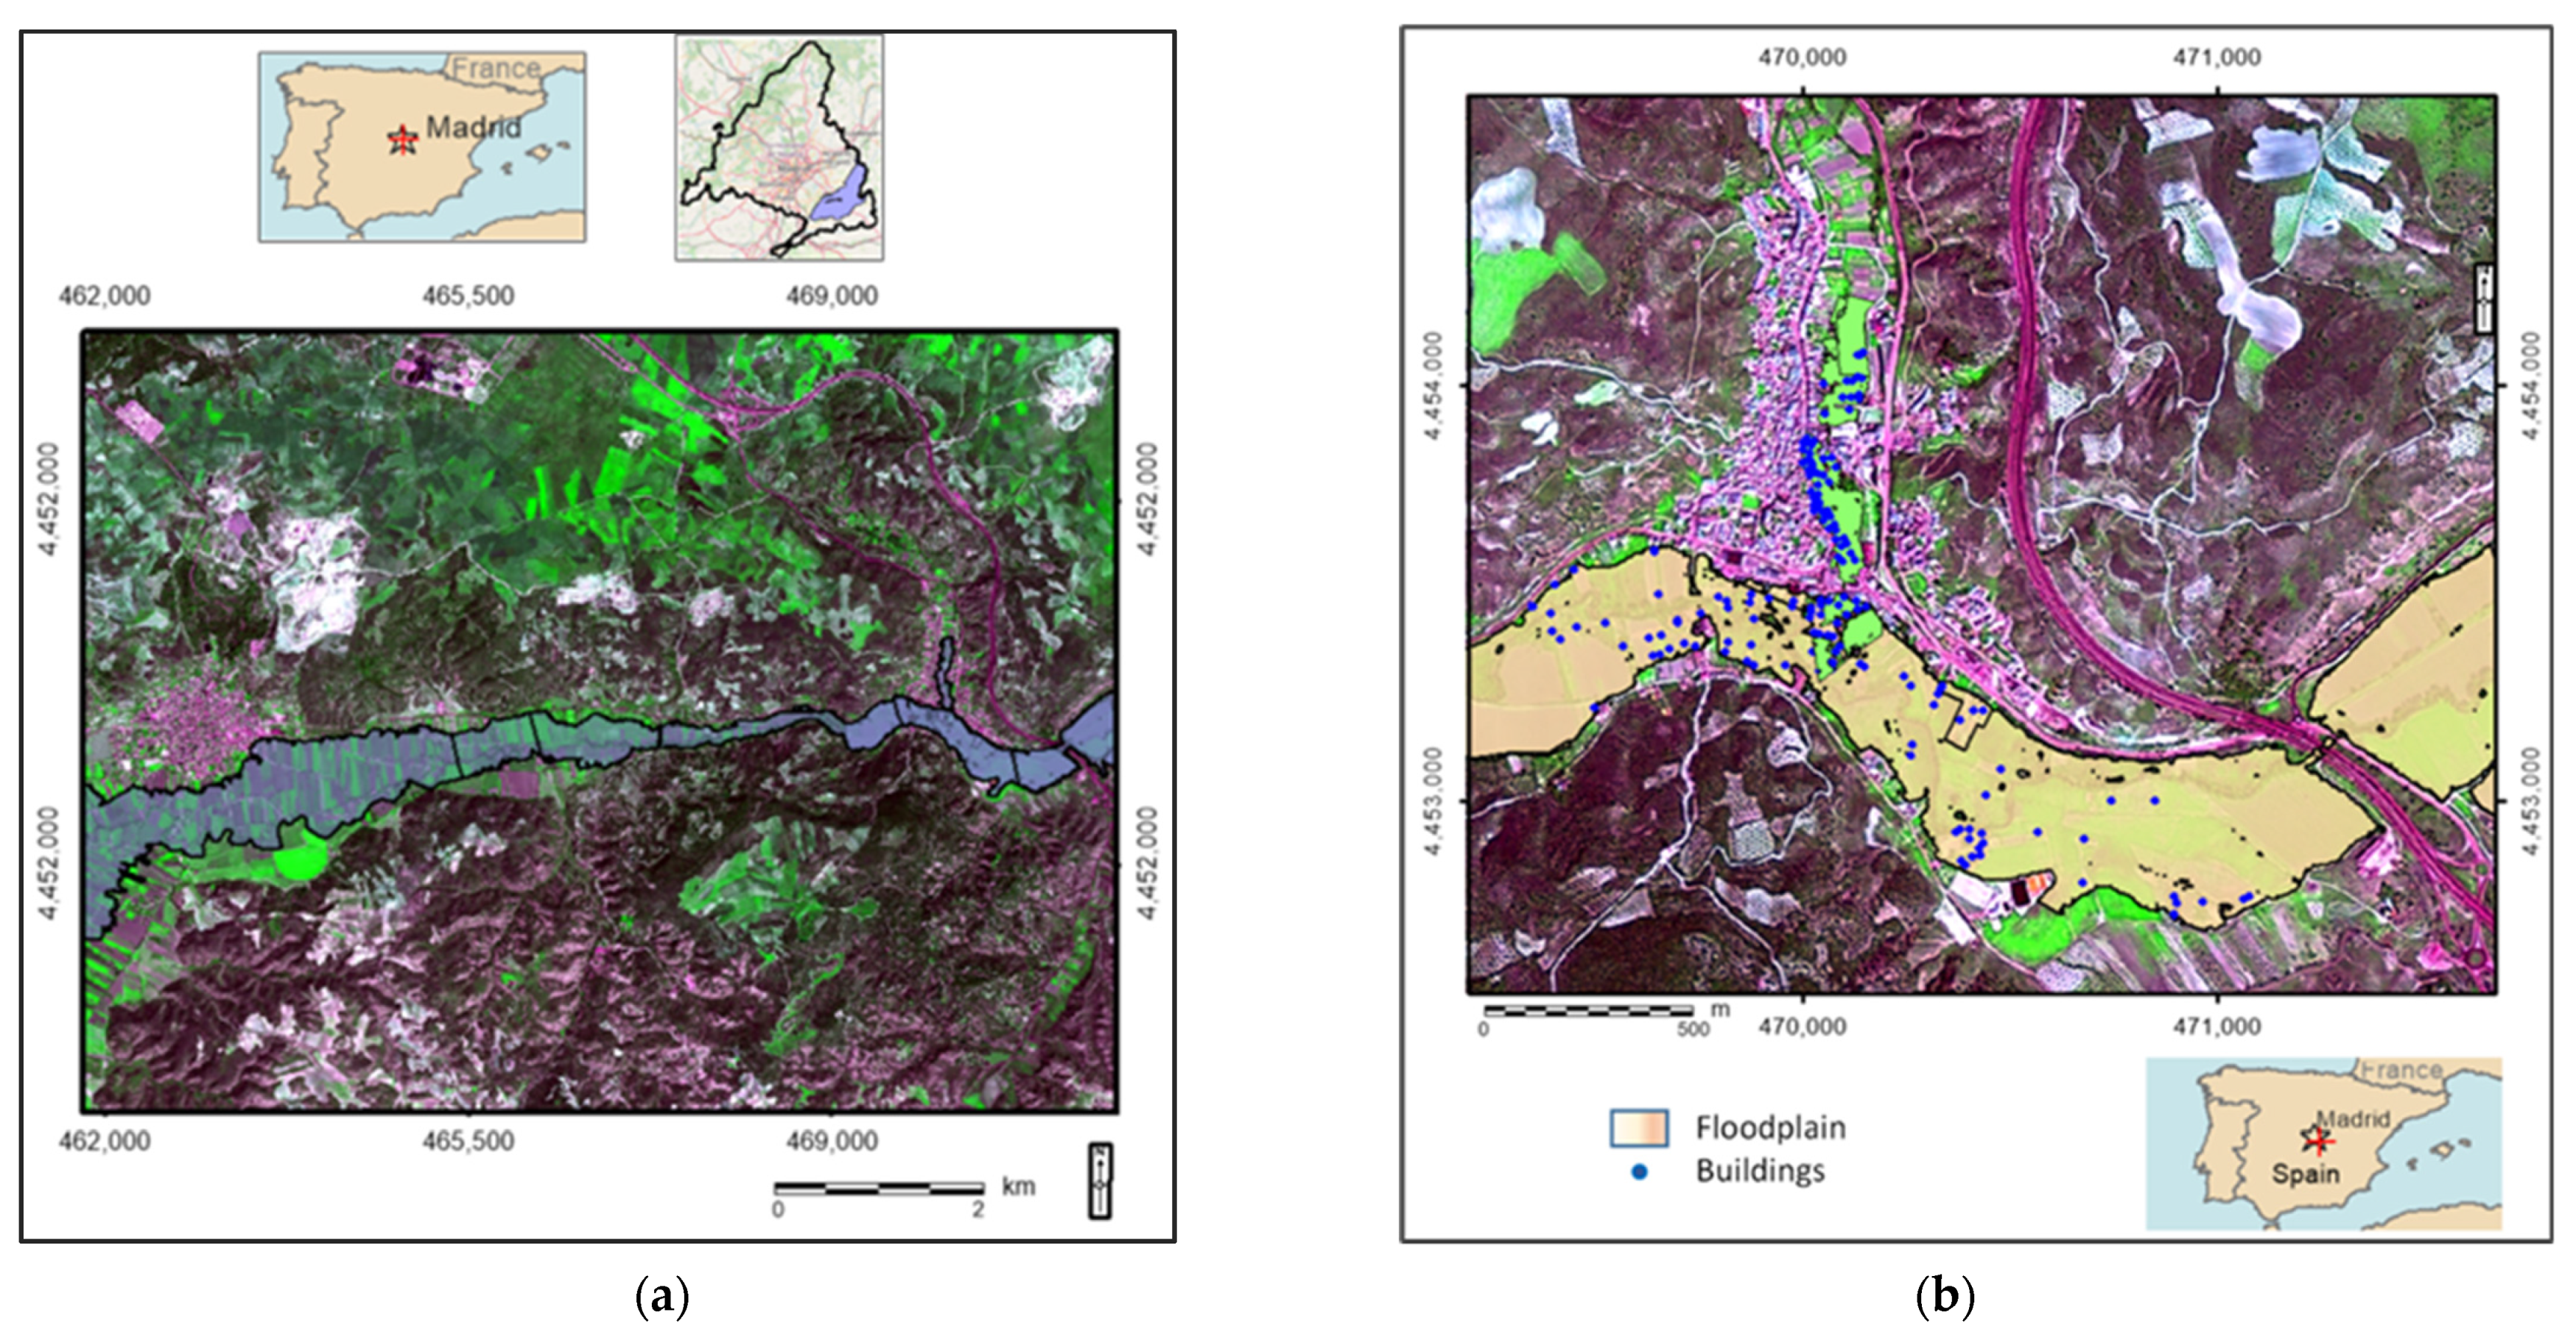
3.3.1. Sentinel 2 Image of the Basin and SPOT 6 Image for the Study Case

The Sentinel 2 satellite image provides a first assessment of the extent and location of the sealed areas, although its spatial resolution at 10 m does not allow the identification of isolated buildings. In contrast to this limitation, its high spectral resolution is very suitable for viewing land uses. Knowing this distribution is important, as flooding processes are influenced not only by urbanisation and the construction of infrastructures on land near the riverbed, but also by upstream deforestation, poor agricultural practices and aggregate extraction. Thus, the combination of infrared channels together with visible spectrum channels discriminates well between built-up areas and plots with irrigated crops located in the floodplain. This is best distinguished in combinations with independent components, especially with the mixture of the mid-infrared channel with visible channels (11-2-3), mid- and near-infrared ones with a visible channel (11-8-3) and the mixture of mid- and near-infrared channels (bands 12-11-8, RGB).
In the false-colour Sentinel 2 image (Figure 7a), the scarcity of riparian vegetation (red tones in the 8-4-3 combination and a linear pattern following the riverbed) can be observed, being reduced to a narrow discontinuous strip, with the consequent loss of biodiversity on the riverbanks. It is also possible to distinguish the exploitation of terrace materials in gravel pits and the Pontian limestone quarries in the vicinity of Morata (in shades of white in this combination), exploited for the manufacture of cement.
The location of the floodplain and riparian vegetation of the entire hydrographic network of the Tajuña is well represented in light green tones in the image obtained by transforming primary colours (RGB) to their colour properties (IHS) (Figure 7b). Here, the near infrared (b8) bands with high response to hygrophilous vegetation and the visible bands (b4 and b3) have been transformed. It is thus that Figure 7b shows the village of Perales de Tajuña, located at the confluence of the Tajuña river with the Arroyo de la Vega, which is a clear example of flood risk.
The possibility of having free and continuous Sentinel images makes it possible to monitor these changes and analyse the consequences of anthropogenic activity in so sensitive an area.
For a more detailed analysis, the SPOT 6 image with high spatial resolution—1.5 m—has allowed us to update the mapping of buildings located in areas at risk of flooding. On the one hand, the most extensive floodable sector of the basin has been represented, located between the municipalities of Morata and Perales de Tajuña, which are identified in the SPOT 6 image in false colour in pink tones (Figure 8a). In the former, the urban centre remains practically outside the flood area, although numerous properties with recent buildings constructed on the flood plain can be identified. In the case of Perales de Tajuña (Figure 8b), the affected area does extend to the urban nucleus and there are buildings on the flood plain, a fact already highlighted in point 3.2. This image has made it possible to identify some thirty dwellings located on the river plain itself and although some are currently abandoned, many others are of recent construction, being built for uses not compatible with those of a usual dwelling or second home.

3.3.2. Information Obtained from the Cadastre

The Cadastre is a source of information with numerous possibilities for geographical exploitation. The most basic, but not least important, one is to offer a very faithful vision of the territorial structure and habitat, (Figure 9a,b), enriched with the visualisation of the parcel network, its morphology and even the discrimination of uses. With the freely accessible databases, it is possible to go down to very detailed levels of a multitude of aspects of the plots and the buildings located on them (Figure 9c,d). From the download files in binary format, and with .CAT extension, once debugging has been done, a large number of attributes per parcel can be obtained and, if they are redrawn, the mapping of a large number of attributes per building unit would be possible. In this case, the reference entity selected is the cadastral parcel, both rustic and urban. This mapping shows that the municipality of Perales de Tajuña is composed of a main nucleus, an industrial estate, a macro-urbanisation with a large plot and a small population (167 inhabitants in 2021) as well as scattered buildings of various functions (Figure 9c,d).
An initial fact that allows the analysis of both maps is the inequality of the possible effects of flood episodes in the two areas identified: Arroyo de la Vega and the flood plain of the Tajuña. In the first case, practically everything included in the flood area is of an urban nature, with extensive road and green spaces, not free of buildings from the turn of the 20th century, with a predominance of buildings constructed between the 1970s and 2000, and with significant renovation in the last twenty years. This chronology seems to be in line with the territorial processes of the Madrid region over the last century [42].
Among the factors that minimise the risk of flooding, mention should be made of the frequency of plots of land with large extensions free of buildings destined for orchards, gardens or land lots. This facilitates drainage by presenting a significant portion of unsealed soil. On the other hand, the fragmentation of the plots due to property enclosures (fences, walls, or hedges) can act as significant barriers. All these aspects can be studied in detail by exploiting the abundant cadastral information that accompanies each registered property.
In the flood plain of the Tajuña River itself, the mosaic of plots is neither uniformly urban nor rustic. There are plots and buildings of an urban nature that seem to be a continuation of the main nucleus, although they partly invade the flood risk area. The rest of the plots belong to the rustic cadastre, where there are buildings on plots of different sizes and uses. In many of these buildings, the year of construction is not recorded; others, the largest ones, were built between the 1960s and 2000. Perhaps the most striking element is that the most recent buildings are of small dimensions and built on agricultural plots. This aspect seems to indicate a recent occupation of agricultural land for residential use, without ruling out the possibility that a process of occupation of the floodplain for residential use on rural land has begun.
In Figure 9b,c, scattered buildings located on the flood plain have been included, which places them in areas at risk of flooding. The population growth of this municipality from 2000 to the present (close to 30%, Figure 3) is reflected in the recent occupation of the floodplain according to these cadastre data. Therefore, exposure to floods is also increasing.
It should be noted that there is no total correlation between the houses detected by photointerpretation, the field work and those reflected in the cadastre figure. Allowing a margin of error, this is suspicious of the appearance of non-regularised constructions. It should also be noted that some of the newer estates extend their properties into the immediate vicinity of the minor riverbed, in breach of water protection regulations.
Only an exhaustive field inventory and its corresponding comparison with this registry source can confirm or reject a suspected fact, namely that of a possible marginal residential settlement—which does not necessarily have to be precarious—on rural land and in the flood plain of the Tajuña.

4. Discussion

The exposure of the population to flooding is a historical problem, as cities have been built in the vicinity of rivers since ancient times [43]. For several decades, the risk caused by river overflows has been reduced thanks to the complex hydraulic regulation that exists in all river basins (reservoirs, canals, flood control, etc.). Despite this, at present, progressive urban expansion in areas at risk of flooding is leading to a greater exposure of goods and services and greater vulnerability of the population [3,6,44]. Cao et al. highlight the intense growth of urban expansion in floodplains, placing Europe in second place (11.6%), behind Asia (74.1%), with 20% of floodplains occupied [6]. Additionally, in the Mediterranean region, other authors also highlight among the causes of the increase in flood frequency in the last decades the effects of the urban expansion in areas of fluvial pertinence, as in the Ligurian Sea, Tuscany and Sardinia [45] or Seville [46]. If this trend continues, in the context of climate change, there are reasons to forecast an increase in socio-economic impacts, with current costs in Europe estimated at 5.5 trillion €/year and with a very significant increase in the coming decades. Even without considering the potential impacts of climate change, the extent of urban areas exposed to flooding will increase by 2.7 by 2030 [47].
Regarding the causes of rising flood costs in Europe (1970–2006) and Spain (1971–2008), other authors point to a greater weight of social influences among the main drivers of economic and insured losses from natural disasters [48,49].
The case study presented here, located 30–40 km from Madrid, shows that urban occupation of floodplains is still a current problem, despite numerous existing regulations aimed at defending less damaging uses against flooding.
Regarding daily rainfall conditions, the Community of Madrid does not usually record torrential rainfall values (>100 mm/day), this being more frequent in other regions of the Spanish coast. However, high-intensity hourly values (>60 mm/h) are not uncommon, and entail a similar risk, especially in sealed soils and very flat areas. In addition, summer rainfall events are observed with greater variation [50], increasing uncertainty and the risk of flooding.
The choice of a basin that maintains a high level of economic activity in the primary sector and a nucleus with a high urban fabric in areas at risk highlights the need to monitor land occupation, for which satellite images are essential, especially the European SPOT satellites, with high spatial resolution, and Sentinel 2, with high spectral resolution, the latter being free thanks to ESA’s Copernicus programme, together with Lidar technology and aerial orthophotographs.
The good results obtained by using satellite imagery for monitoring and mapping inland water bodies (ponds, lakes, reservoirs, etc.) [38,39] can be extended to the delimitation of floodplains. These can be clearly identified in multispectral images thanks to the significant response of the near-infrared to hygrophilous vegetation and of the mid-infrared channels to humidity. In turn, the image resulting from the RGB to IHS transformation used for the delineation of shallow ponds [38] also provides very good results for mapping the floodplain and identifying its dominant land use.
However, monitoring the occupation of floodplains by remote sensing has the limit of spatial resolution and cannot identify small buildings, nor can it identify their typology [51,52]. For this reason, it is very convenient that this analysis includes urban and rustic cadastral information, which also provides valuable quantitative and qualitative information. The cadastre data has also been used, among other places, to ascertain the exposure to flood risk in the peri-urban area of Valencia [53,54]. In this case, only a minimal part of the many possibilities of the cadastral database has been exploited. The plot composition has been chosen in terms of layout and morphology. For this case, and insofar as the occupation of areas at risk of flooding is sought, the dates of construction are relevant.
The case study focused on Perales de Tajuña (Madrid) is also in line with the greater sensitivity of small catchments to changes in flood magnitude and frequency due to climate variability, with less capacity to buffer response due to the limited extent of convective storms [55].
According to the Soil Strategy Report 2030 [56] it is important to establish a relationship between soil types and flood risk. Soils, sediments and water are closely linked. Soils can filter, absorb and buffer the effect of water and, in turn, water can erode or contaminate them. In addition, the input of organic material from the headwaters of rivers, due to the erosion of the more fertile soils, which are rich in organic carbon, affects the composition of water. When soil is sealed, water circulation changes. The European Commission believes it essential to integrate land use management along riverbanks and flood risk management plans to minimise the risks associated with climate change, such as increased droughts and floods. Thus, in the area studied, the soils affected by flood risk correspond to fluvisols with a high agrological capacity. Floods occasionally cause waterlogging problems in these soils but, in the long term, provide fine sediments that enrich them. However, the construction of buildings implies the loss of part of these rich soils and the waterproofing of large areas, which leads to a degradation of the entire fluvial ecosystem. It is therefore important to monitor changes in this fragile environment, and satellite images and cadastral data are an essential tool for this purpose.

5. Conclusions

This work has shown that in the southeast of the Community of Madrid, the areas at risk, far from being a problem of poor planning in the past, continue to be increasingly occupied, with the consequent increase in exposure and vulnerability to flooding.
As far as land use is concerned, most of them are still occupied by irrigated crops due to their highly fertile soils, but it would be advisable to maintain riparian vegetation in the areas closest to the riverbed, so that it acts as a brake on erosion and increases biological diversity, as the current state of riparian vegetation is quite deteriorated due to encroachment by private estates, scarce natural edging, dumping, etc.
It is important to preserve the health of the soil by techniques that improve its permeability to minimise the effects of flooding. Therefore, soil sealing, which causes permanent waterproofing, is one of the factors that most increases the risk of flooding, making its consequences more catastrophic.
More than twenty floods have been documented in the study area between 1629 and 2020, of which about half have occurred since 1987. Since the 1980s, almost all floods have occurred in summer, a period characterised in Mediterranean climate by summer drought, but which is also affected by the eventual passage of cold air at high altitude, causing high-intensity rainfall. In recent years, the incidence is higher due to inappropriate construction of the floodplain.
The combined use of remote sensing techniques and geographic information systems is fundamental for monitoring land use and the changes that can affect the number and effect of floods in the Tajuña basin. Lidar images and aerial orthophotography were used to measure the extent of the floodable area and the estimated volume of water in different recurrence periods. Land use and the extent of the floodplain have been analysed by means of the Sentinel image. This image in false colour (RGB bands 11-2-3, 11-8-3 and 12-11-8) and its transformation to colour properties (intensity, hue and saturation) has made it possible to determine the extension of the riparian vegetation and the irrigated crops located in the alluvial plain. The SPOT image has made it possible to establish the location of buildings encroaching on the flood plain, with data confirmed by field work. Some thirty dwellings located in the river plain itself have been identified and although some are currently abandoned, many others are of recent construction, being built for uses not compatible with those of a usual dwelling or second home.
Based on cadastral data, a detailed cartography of built-up areas in areas at risk of flooding is provided. With these freely accessible databases, it is possible to analyse at very detailed levels a multitude of aspects of the plots and the buildings located on them. They affect buildings built mainly between the 1960s and 1990s, although the most recent buildings are built on agricultural land in the alluvial plain, even though current regulations prevent the occupation of these lands.
The case study is a paradigmatic example of how urban-residential expansion processes in Madrid continue with the occupation of the floodplain, with the consequent increase in flood risk and associated damage.
All cartographic information on flood risk and exposure will be supplemented in the future by unsealed soil permeability data and hydrogeological data.
The results of this research will be transferred to the Hydrographic confederation of the Tagus, to the Department of Territorial Policy of the CAM and the city council of the municipalities involved. This will allow planning urban growth and expansion more in line with the natural environment and with lower risk to the population.

Author Contributions

Section 1 and Section 2 were written jointly by the four authors. In Section 3, most of the cartography was carried out by M.B.-G., the results relating to the satellite images were obtained by M.E.P.-G. and M.d.P.G.-R. and those relating to the cadastre by J.M.G.-A. The field work was carried out by M.E.P.-G. The discussion and conclusions were written by the four authors, as was the consultation and selection of bibliography. The following software was used for this article: HEC-RAS, Arc Map and Erdas Imagine. All authors have read and agreed to the published version of the manuscript.

Funding

This research has been funded by BANCO SANTANDER-UCM, PR108/20-24: “Update of the susceptibility and risk of flooding in sealed areas of the Community of Madrid and surrounding areas: case studies and proposals for improvement”.

Institutional Review Board Statement

Not applicable.

Informed Consent Statement

Not applicable.

Data Availability Statement

Not applicable.

Conflicts of Interest

The authors declare no conflict of interest.

References

  1. Romero-Díaz, M.A. Floods in Spain’s Mediterranean region: Causes and effect. Geogr. Res. Lett. 2021, 47, 3–12. [Google Scholar] [CrossRef]
  2. Gil-Guirado, S.; Pérez-Morales, A.; Pino, D.; Peña, J.C.; Martínez, F.L. Flood impact on the Spanish Mediterranean coast since 1960 based on the prevailing synoptic patterns. Sci. Total Environ. 2022, 807, 150777. [Google Scholar] [CrossRef] [PubMed]
  3. Pistocchi, A.; Calzolari, C.; Malucelli, F.; Ungaro, F. Soil sealing and flood risks in the plains of Emilia-Romagna, Italy. J. Hydrol. Reg. Stud. 2015, 4, 398–409. [Google Scholar] [CrossRef]
  4. Rodríguez-Rojas, M.I.; Huertas-Fernández, F.; Moreno, B.; Martínez, G.; Grindlay, A.L. A study of the application of permeable pavements as a sustainable technique for the mitigation of soil sealing in cities: A case study in the south of Spain. J. Environ. Manag. 2018, 205, 151–162. [Google Scholar] [CrossRef] [PubMed]
  5. Chapapría, V.E.; Peris, J.S. Vulnerability of coastal areas due to infrastructure: The case of Valencia port (Spain). Land 2021, 10, 1344. [Google Scholar] [CrossRef]
  6. Cao, W.; Zhou, Y.; Güneralp, B.; Li, X.; Zhao, K.; Zhang, H. Increasing Global Urban Exposure to Flooding: An Analysis of Long-Term Annual Dynamics. Sci. Total Environ. 2022, 817, 153012. [Google Scholar] [CrossRef] [PubMed]
  7. Senent-Aparicio, J.; López-Ballesteros, A.; Cabezas, F.; Pérez-Sánchez, J.; Molina-Navarro, E. A Modelling Approach to Forecast the Effect of Climate Change on the Tagus-Segura Interbasin Water Transfer. Water Resour. Manag. 2021, 35, 3791–3808. [Google Scholar] [CrossRef]
  8. Estrela, T.; Pérez-Martin, M.; Vargas, E. Impacts of climate change on water resources in Spain. Hydrol. Sci. J. 2012, 57, 1154–1167. [Google Scholar] [CrossRef]
  9. Olcina Cantos, J.; Díez-Herrero, A. Flood maps in Spain. Estud. Geográficos 2017, 78, 283–315. [Google Scholar] [CrossRef] [Green Version]
  10. Catálogo Nacional de Inundaciones Históricas (CNIH). Cuenca del Tajo—Estudio de Inundaciones Históricas. Mapas de Riesgos Potenciales. 1985. Available online: https://www.proteccioncivil.es/catalogo/naturales/cnih/cnih2014/PDF/B6/Documenta2/CTEI_TAJO.pdf (accessed on 1 June 2021).
  11. Catálogo Nacional de Inundaciones Históricas (CNIH). Actualización de Las Inundaciones Históricas. 2014. Available online: https://www.proteccioncivil.es/catalogo/naturales/cnih/cnih2014/B3_Resumen.html (accessed on 2 June 2021).
  12. López Acosta, A.; Jiménez Sánchez, M. Catálogo de inundaciones históricas de la Cuenca del Tajo. Protección Civ. 2002, 11, 42–45. [Google Scholar]
  13. Benito, G.; Díez-Herrero, A.; Fernández De Villalta, M. Magnitude and frequency of flooding in the Tagus basin (Central Spain) over the last millennium. Clim. Chang. 2003, 58, 171–192. [Google Scholar] [CrossRef]
  14. Pontenciano de las Heras, A. Estudio de las Inundaciones Históricas del Río Amarguillo (Toledo). Ph.D. Thesis, Universidad Complutense de Madrid, Madrid, Spain, 2004. [Google Scholar]
  15. Jiménez Sánchez, M.A. Las inundaciones en la Comunidad de Madrid. In Proceedings of the VI Congreso Internacional sobre Enseñanza y Divulgación de la Meteorología y Oceanografía, Madrid, Spain, 5–24 May; 2003. Available online: https://www.tiempo.com/ram/804/las-inundaciones-en-la-comunidad-de-madrid/ (accessed on 15 December 2021).
  16. López Rodríguez, E.; Leco Berrocal, F.; Mateos Rodríguez, A.B. Peligrosidad de inundaciones en Extremadura y daños asociados. Investig. Geográficas 2021, 75, 121–137. [Google Scholar] [CrossRef]
  17. Alfonso, C.; Estévez, R.; González Cascón, V.; Lozano, B.; Mingarro, M.; Prieto, F.; Santamarta, J. 25 Años Urbanizando España: La Generación que Multiplicó la Superficie Artificial de una forma Insostenible 1987–2011 (URB16). 2016. Available online: https://docplayer.es/73667677-25-anos-urbanizando-espana-la-generacion-que-multiplico-la-superficie-artificial-de-una-forma-insostenible-urb16.html (accessed on 10 January 2022).
  18. Callaba-Iribarren, I.; Fernández-Canteli, P. Protección del Suelo y Desarrollo Sostenible; IGME: Madrid, Spain, 2002. [Google Scholar]
  19. García Palomares, J.C.; Gutiérrez Puebla, J. La ciudad dispersa: Cambios recientes en los espacios residenciales de la Comunidad de Madrid. An. Geogr. Univ. Complut. 2007, 27, 1–45. [Google Scholar]
  20. Instituto Nacional de Estadística. Available online: https://www.ine.es (accessed on 10 January 2022).
  21. Arroyo, M. La contraurbanización: Un debate metodológico y conceptual sobre la dinámica de las áreas metropolitanas. Scripta Nova 2001, 97, 93–129. [Google Scholar]
  22. Instituto Geológico y Minero de España (IGME). Mapa Geológico Nacional (MAGNA). Hoja 583 (Arganda)—Escala 1:50.000; IGME: Madrid, Spain, 1975. [Google Scholar]
  23. Silva, P.; Goy, J.L.; Zazo, C. Evolución geomorfológica de la confluencia de los ríos Jarama y Tajuña durante el Cuaternario (Cuenca de Madrid, España). Cuatern. Geomorfol. 1988, 2, 125–133. [Google Scholar]
  24. Sillero-Medina, J.A.; Hueso-González, P.; Ruiz-Sinoga, J.D. La precipitación geomorfológica como elemento clave en el modelado del paisaje mediterráneo. Bol. Asoc. Esp. Geogr. 2019, 82, 1–40. [Google Scholar] [CrossRef]
  25. Plan Nacional de Predicción y Vigilancia de Fenómenos Meteorológicos Adversos. Meteoalerta. Available online: http://www.aemet.es/documentos/es/eltiempo/prediccion/avisos/plan_meteoalerta/plan_meteoalerta.pdf (accessed on 15 March 2022).
  26. Monturiol, F.; Alcalá, L. Mapa de Asociaciones de Suelos de la Comunidad de Madrid—Escala 1: 200,000; CSIC-CAM: Madrid, Spain, 1990; Volume 71. [Google Scholar]
  27. ABC. Available online: http://www.abc.es (accessed on 10 September 2021).
  28. El País. Available online: http://www.elpais.es (accessed on 21 September 2021).
  29. El Mundo. Available online: http://www.elmundo.es (accessed on 28 September 2021).
  30. Sistema Nacional de Cartografía de Zonas Inundables. Gobierno de España, Ministerio Para la Transición Económica y el Reto Demográfico. Available online: https://sig.mapama.gob.es/snczi/index.html?herramienta=DPHZI (accessed on 10 September 2021).
  31. Centro Nacional de Información Geográfica. Available online: https://centrodedescargas.cnig.es/CentroDescargas/index.jsp (accessed on 10 May 2021).
  32. Cowan, W.L. Estimating Hydraulic Roughness Coefficients. Agric. Eng. 1956, 37, 473–475. [Google Scholar]
  33. Mosquera Flores y Rojas Ulco, J.A. Estudio de Inundabilidad del río Moche Tramo Puente Santa Rosa con el Puente Moche. 2019. Available online: https://hdl.handle.net/20.500.12759/5169 (accessed on 2 February 2022).
  34. Felices, A.R. Hidráulica de Tuberías y Canales. In Lima Consejo Departamental de Lima; Colegio de Ingenieros del Perú: Lima, Perú, 2007. [Google Scholar]
  35. Copernicus Open Access Hub. Available online: https://scihub.copernicus.eu/dhus/#/home (accessed on 6 October 2021).
  36. Confederación Hidrográfica del Tajo. Available online: http://www.chtajo.es/LaCuenca/Paginas/CapasIDEE-Tajo.aspx (accessed on 14 November 2021).
  37. Chuvieco, E. Fundamentos de Teledetección Espacial, 3rd ed.; Ediciones Rialp: Madrid, Spain, 2000; pp. 304–307. [Google Scholar]
  38. Castañeda, C.; Herrero, J.; Casterad, M.A. Landsat monitoring of playa-lakes in the Spanish Monegros desert. J. Arid Environ. 2005, 63, 497–516. [Google Scholar] [CrossRef] [Green Version]
  39. Verpoorter, C.; Kutser, T.; Tranvik, L. Automated mapping of water bodies using Landsat multispectral data. Limnol. Oceanogr. Methods 2012, 10, 1037–1050. [Google Scholar] [CrossRef]
  40. Sede Electrónica del Catastro. Available online: https://www.sedecatastro.gob.es (accessed on 18 January 2022).
  41. Plan Nacional de Ortofotografía Aérea (PNOA). Available online: https://pnoa.ign.es (accessed on 10 October 2021).
  42. Solís-Trapero, E.; Plaza-Tabasco, J.; Martínez Sánchez-Mateo, H.S. Evolución Reciente de los Patrones Espaciales de la Actividad Logística en Contextos Metropolitanos: El Caso de la Región Urbana de Madrid. Rev. Estud. Andal. 2019, 37, 94–124. [Google Scholar]
  43. Ureña, J.M.; Ollero, A. Fluvial landscapes, catchment administration and land-use planning: Experience based on two rivers in Spain. Landsc. Res. 2001, 26, 225–243. [Google Scholar] [CrossRef]
  44. Bescós, A.; Camarasa, A.M. La creciente ocupación antrópica del espacio inundable y el aumento de la vulnerabilidad en las poblaciones del Bajo Arga (Navarra). Bol. Asoc. Esp. Geogr. 2004, 37, 101–118. [Google Scholar]
  45. Faccini, F.; Luino, F.; Paliaga, G.; Roccati, A.; Turconi, L. Flash flood events along the west mediterranean coasts: Inundations of urbanized areas conditioned by anthropic impacts. Land 2021, 10, 620. [Google Scholar] [CrossRef]
  46. Escudero, R.B.; Amador, I.G.; Martínez, B.G.; Simeón, J.C.P. Anthropogenic occupation and risks of flood in the plains of the Guadalquivir River (palm sector of the river-Seville, Spain). Bol. Asoc. Geógr. Esp. 2016, 72, 149–167. [Google Scholar] [CrossRef] [Green Version]
  47. Güneralp, B.; Güneralp, I.; Liu, Y. Changing global patterns of urban exposure to flood and drought hazards. Glob. Environ. Chang. 2015, 31, 217–225. [Google Scholar] [CrossRef]
  48. Barredo, J.I. Normalised flood losses in Europe: 1970–2006. Nat. Hazards Earth Syst. Sci. 2009, 9, 97–104. [Google Scholar] [CrossRef]
  49. Barredo, J.I.; Saurí, D.; Llasat, M.C. Assessing trends in insured losses from floods in Spain 1971–2008. Nat. Hazards Earth Syst. Sci. 2012, 12, 1723–1729. [Google Scholar] [CrossRef] [Green Version]
  50. Lastra, A.; González, P.; Russo, B.; Rodriguez, R.; Ribalaygua, J. Escenarios de Cambio Climático para Eventos Pluviométricos Severos en la Comunidad de Madrid; Canal de Isabel II: Madrid, Spain, 2018; pp. 40–50. [Google Scholar]
  51. Kuang, W.; Du, G.; Lu, D.; Dou, Y.; Li, X.; Zhang, S.; Chi, W.; Dong, J.; Chen, G.; Yin, Z.; et al. Global observation of urban expansion and land-cover dynamics using satellite big-data. Sci. Bull. 2021, 66, 297–300. [Google Scholar] [CrossRef]
  52. Notti, D.; Giordan, D.; Caló, F.; Pepe, A.; Zucca, F.; Galve, J.P. Potential and limitations of open satellite data for flood mapping. Remote Sens. 2018, 10, 1673. [Google Scholar] [CrossRef] [Green Version]
  53. Camarasa Belmonte, A.M.; López-García, M.J.; Soriano-García, J. Mapping temporally-variable exposure to flooding in small Mediterranean basins using land-use indicators. Appl. Geogr. 2011, 31, 136–145. [Google Scholar] [CrossRef] [Green Version]
  54. Camarasa-Belmonte, A.M.; Soriano-García, J. Flood risk assessment and mapping in peri-urban Mediterranean environments using hydrogeomorphology. application to ephemeral streams in the Valencia region (eastern Spain). Landsc. Urban Plan. 2012, 104, 189–200. [Google Scholar] [CrossRef] [Green Version]
  55. Benito, G.; Sanchez-Moya, Y.; Medialdea, A.; Barriendos, M.; Calle, M.; Rico, M.; Sopeña, A.; Machado, M.J. Extreme floods in small mediterranean catchments: Long-term response to climate variability and change. Water 2020, 12, 1008. [Google Scholar] [CrossRef] [Green Version]
  56. European Commission. Communication from the Commission to the European Parliament, the Council, the European Economic and Social Committee and the Committee of the Regions. EU Soil Strategy for 2030—Reaping the Benefits of Healthy Soils for People, Food, Nature and Climate {SWD (2021) 323 Final}. 2021. Available online: https://ec.europa.eu/environment/publications/eu-soil-strategy-2030 (accessed on 15 January 2022).
Figure 1. Study area (a) Location of the Tajuña basin in the Community of Madrid and flood-prone areas (b) Detail of the flooding area in the Tajuña river basin.
Sustainability 14 05406 g001
Figure 2. Study area lithology. Source: ArcMap software, data from the National Geographic Institute and own elaboration.
Sustainability 14 05406 g002
Figure 3. Evolution of the population in the municipalities of the Tajuña basin.
Sustainability 14 05406 g003
Figure 4. Workflow diagram.
Sustainability 14 05406 g004
Figure 5. Areas at risk of flooding in the Tajuña river basin, Community of Madrid.
Sustainability 14 05406 g005
Figure 6. Flood-prone areas in Perales de Tajuña (Madrid): (a) Estimated flood volume; (b) Land uses potentially affected by flooding.
Sustainability 14 05406 g006
Figure 7. Tajuña river basin in the Community of Madrid: (a) Sentinel 2 image, B12-B8-B4 (R-G-B); (b) S2 image, in IHS, B4-B8-B2 (RGB).
Sustainability 14 05406 g007
Figure 8. SPOT 6 images: (a) flood area between Morata and Perales de Tajuña and (b) mapping of buildings on the flood plain.
Sustainability 14 05406 g008
Figure 9. Basic territorial structure of the case study (Perales de Tajuña) (a) Municipal boundary and its hydrographic network; (b) Detail of the urban core and floodplain; (c) Buildings in rural plots according to date of construction; (d) Buildings in urban plots according to date of construction.
Sustainability 14 05406 g009
Table 1. Characteristics of the satellite images and other raster layers used.
Satellite/SensorData Spatial Resolution (m)Bands Used
Sentinel 2A27 June 202110blue, green, red, NIR
20SWR1, SWR2
SPOT 6/74 April 20216blue, green, red, NIR
1.5panchromatic
Aerial orthophotography 26 May 20211RGB
Lidar2016x, y: 1
z: 0.2
panchromatic
Source: Sentinel 2 image has been obtained from Copernicus [35] and SPOT 6 from commercial acquisition from Airbus Intelligence Company. Lidar images and aerial photography from CNIG [27].
Publisher’s Note: MDPI stays neutral with regard to jurisdictional claims in published maps and institutional affiliations.

