
A Comprehensive Study of a Winter Haze Episode over the Area around Bohai Bay in Northeast China: Insights from Meteorological Elements Observations of Boundary Layer

 and
and
Abstract
:1. Introduction
2. Data and Methods
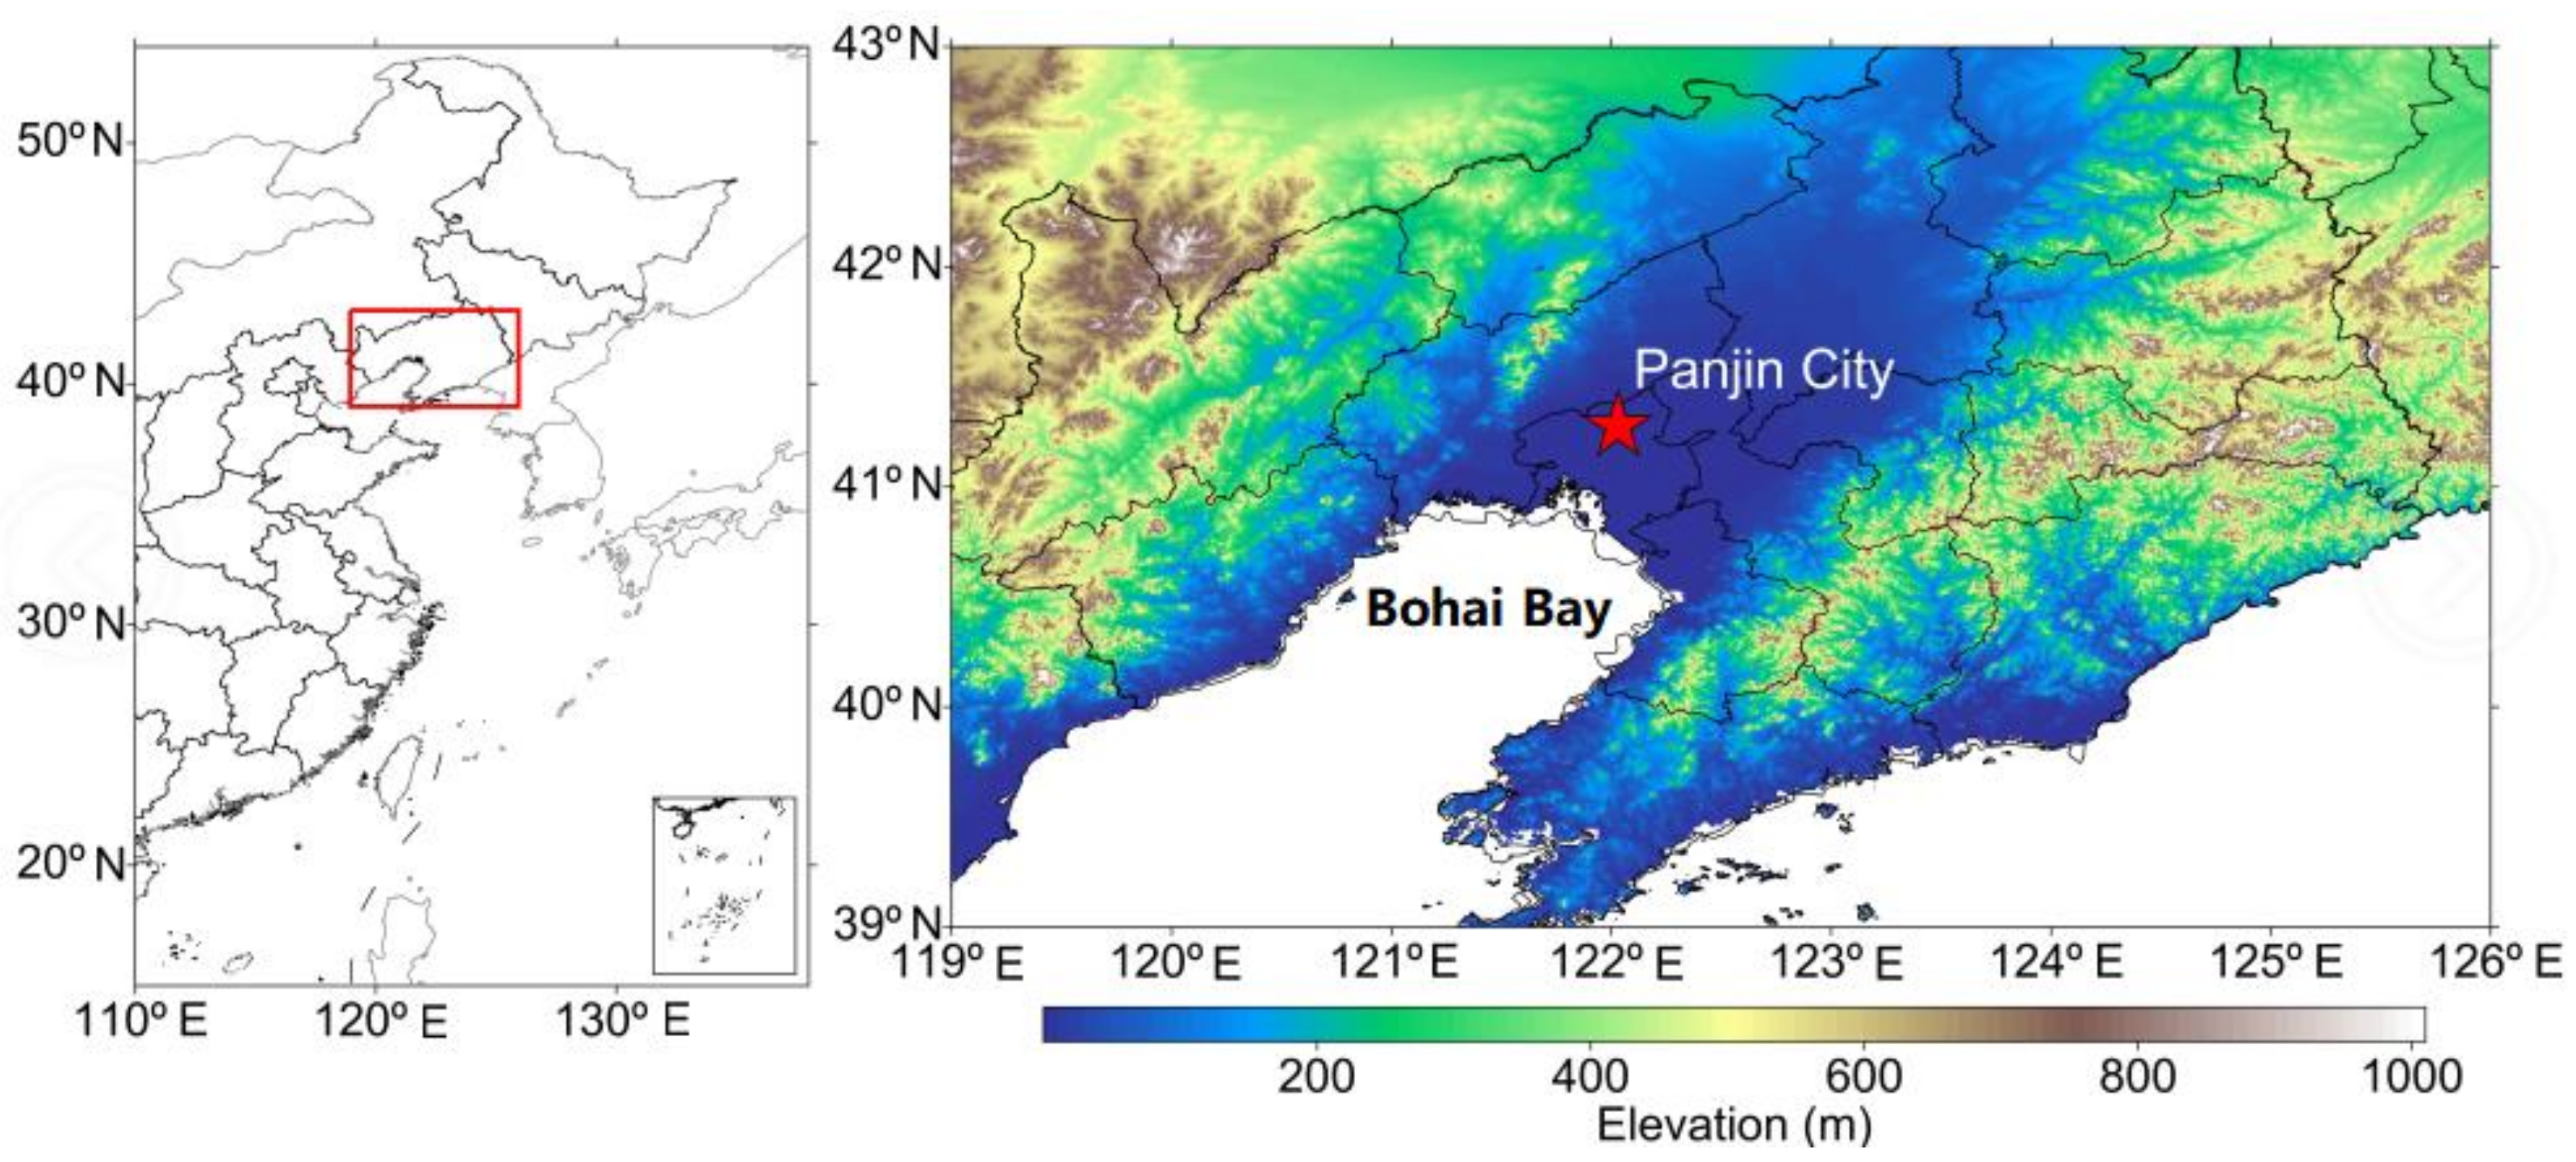
2.1. Site Description
2.2. Wind Profile Radar
2.3. High-Frequency Ground Wave Radar
2.4. WRF-FLEXPART Model
2.5. Determination of Haze-Top Height and Intensity
3. Results and Discussion
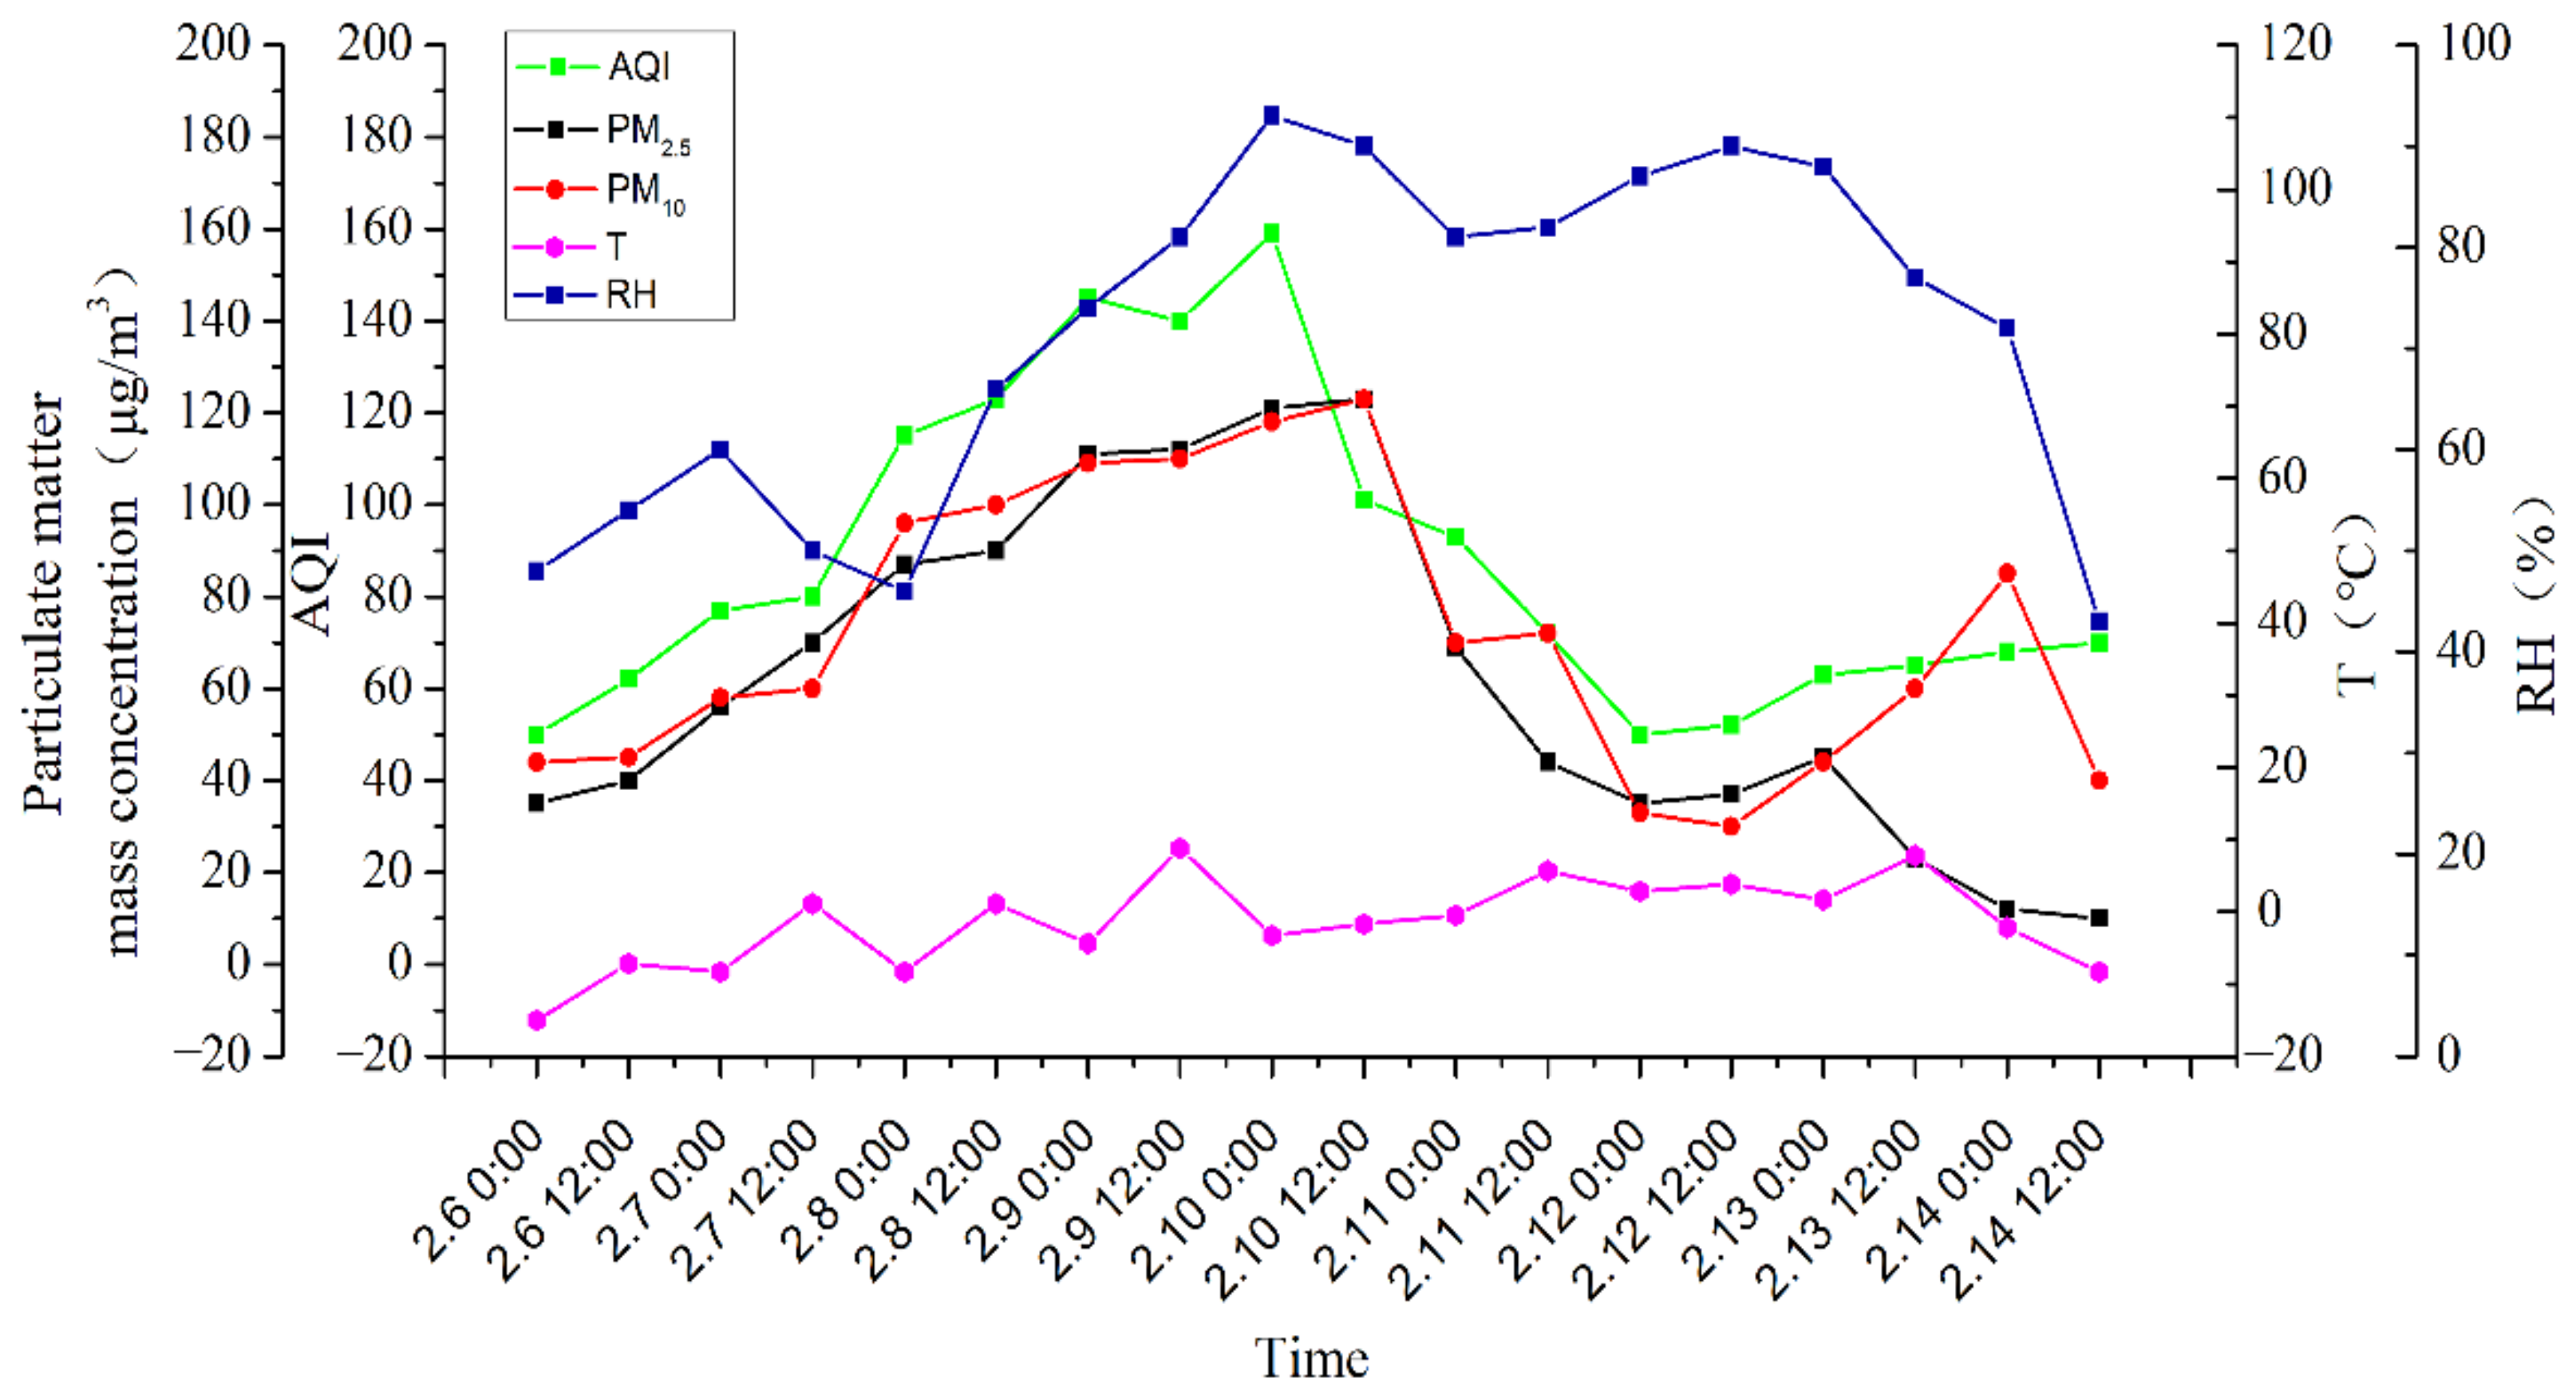
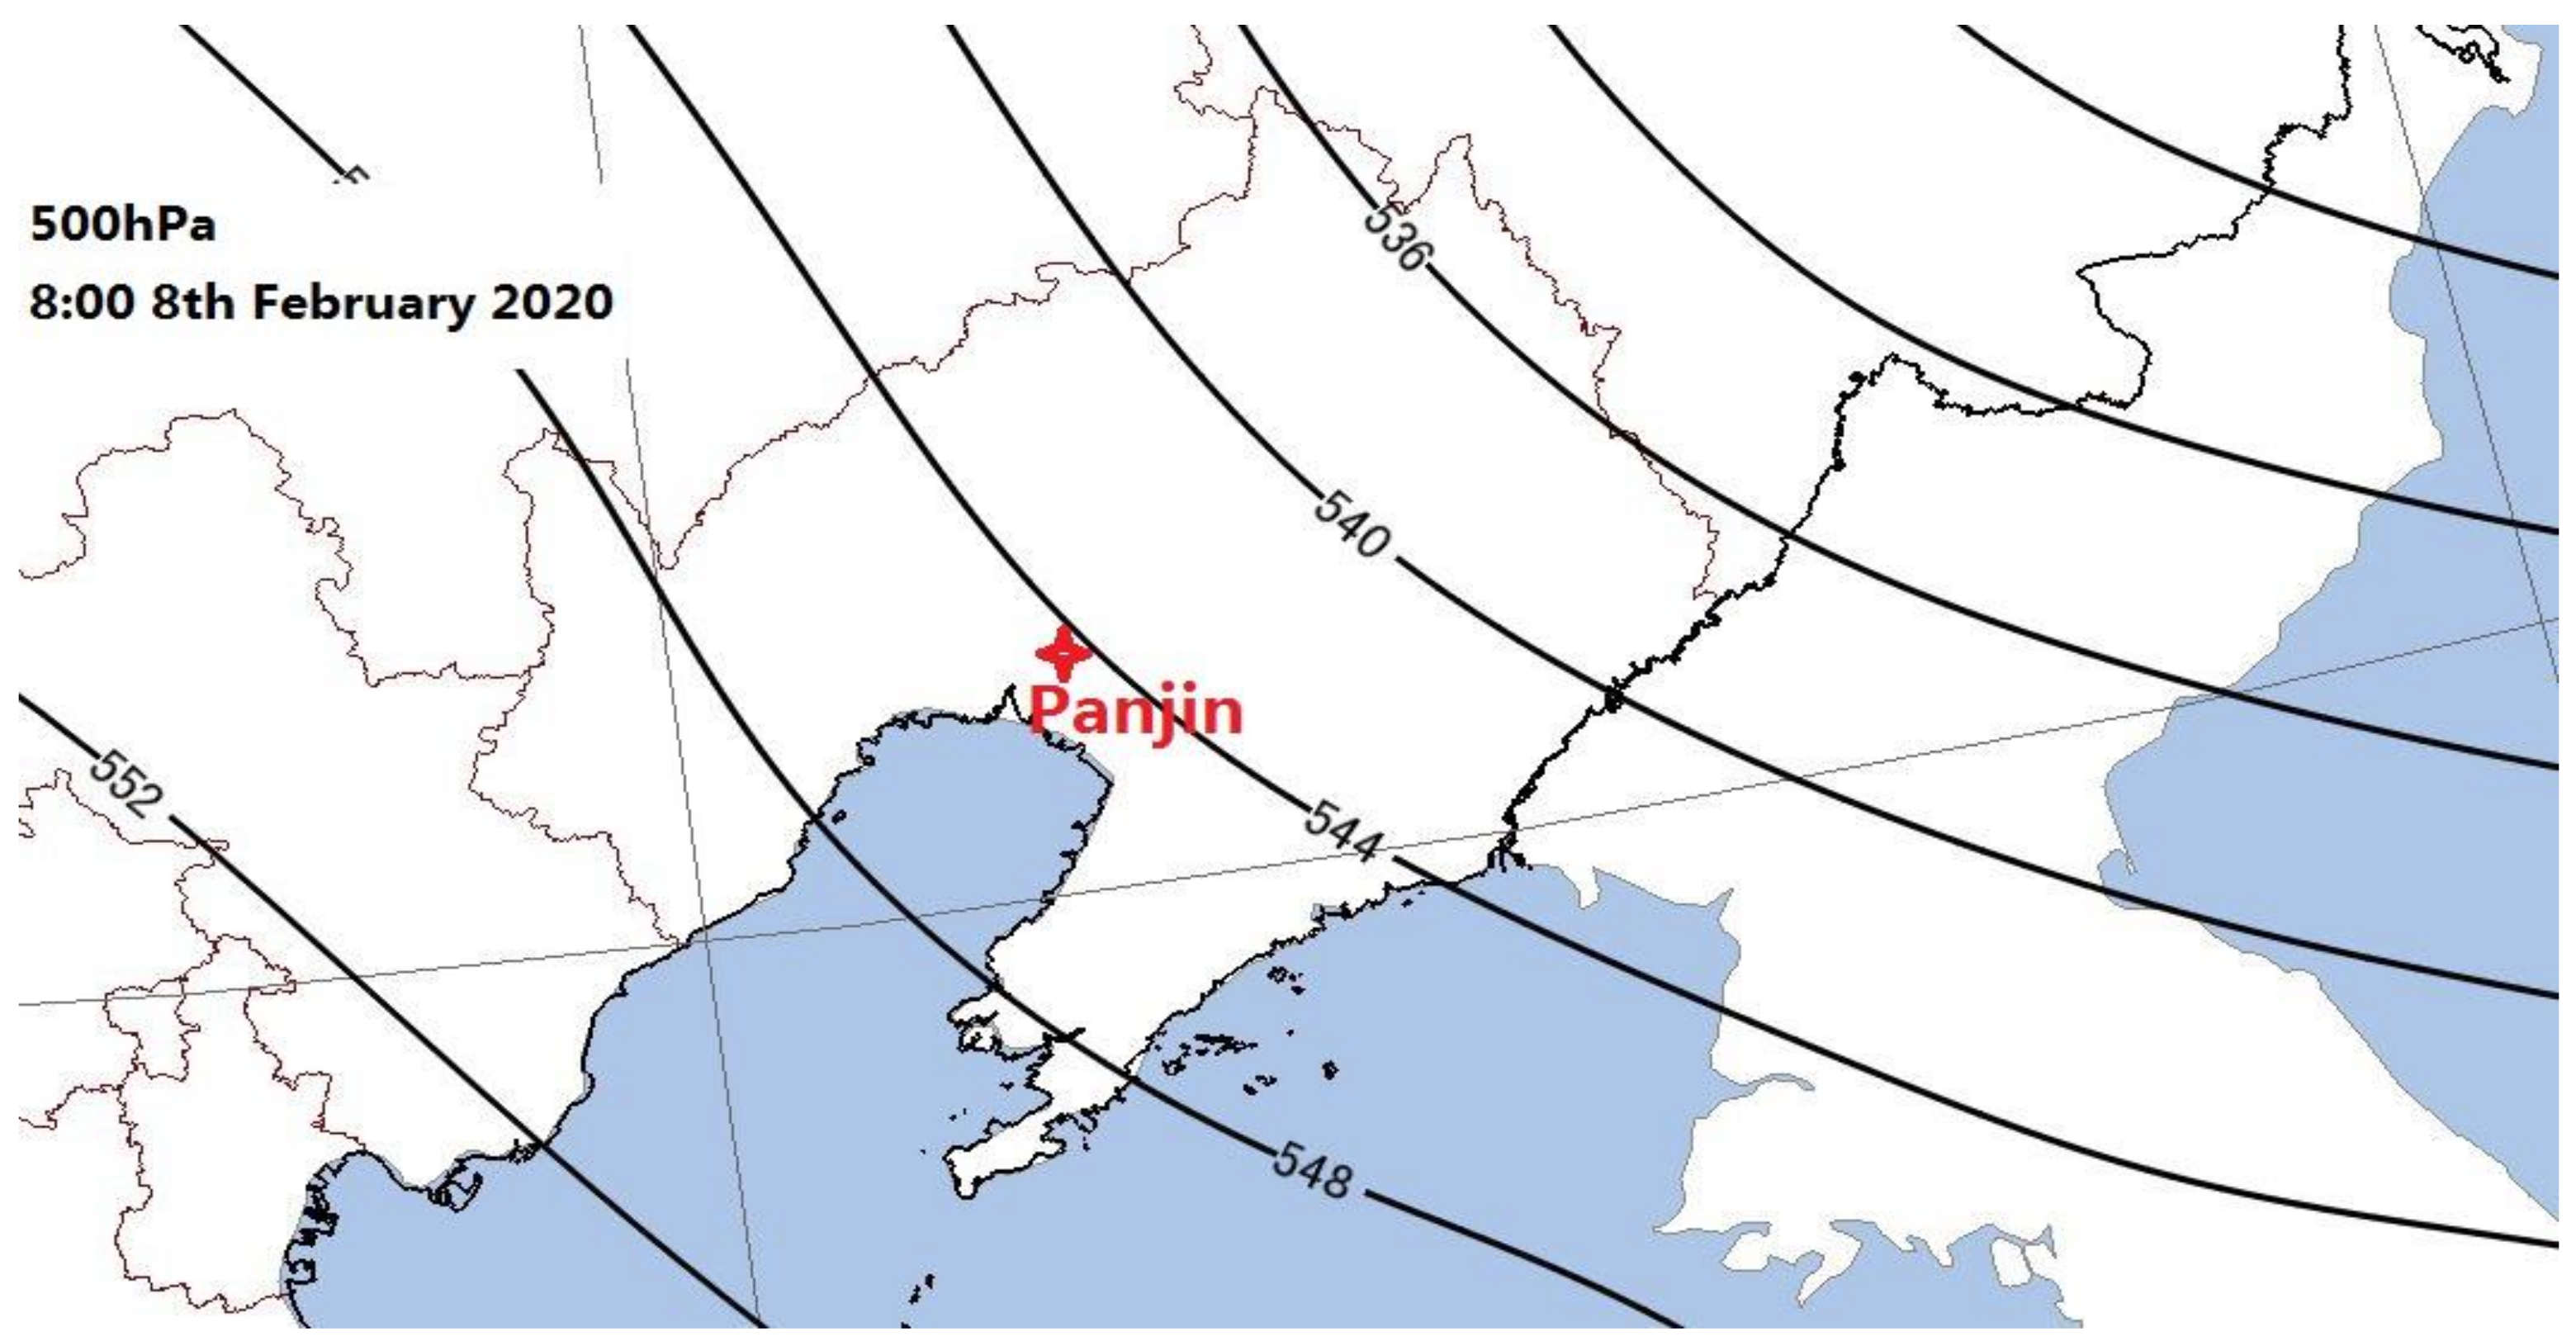
3.1. Haze Episode
3.2. Horizontal Wind Field
3.3. Vertical Wind Field
3.4. Structural Variation Characteristics of the Pollution Layer
3.5. Structural Variation Characteristics of the Boundary Layer
3.6. Source Identification
4. Conclusions
Author Contributions
Funding
Institutional Review Board Statement
Informed Consent Statement
Data Availability Statement
Conflicts of Interest
References
- Huang, X.; Wang, Z.; Ding, A. Impact of Aerosol-PBL Interaction on Haze Pollution: Multiyear Observational Evidences in North China. Geophys. Res. Lett. 2018, 45, 8596–8603. [Google Scholar] [CrossRef] [Green Version]
- Che, H.; Gui, K.; Xia, X.; Wang, Y.; Holben, B.N.; Goloub, P.; Cuevas-Agulló, E.; Wang, H.; Zheng, Y.; Zhao, H.; et al. Large contribution of meteorological factors to inter-decadal changes in regional aerosol optical depth. Atmos. Chem. Phys. 2019, 19, 10497–10523. [Google Scholar] [CrossRef] [Green Version]
- Zhang, X.; Sun, J.; Wang, Y.; Li, W.; Zhang, Q.; Wang, W.; Quan, J.; Cao, G.; Wang, J.; Yang, Y.; et al. Factors contributing to haze and fog in China. Chin. Sci. Bull. 2013, 58, 1178–1187. [Google Scholar] [CrossRef]
- Tie, X.; Huang, R.-J.; Dai, W.; Cao, J.; Long, X.; Su, X.; Zhao, S.; Wang, Q.; Li, G. Effect of heavy haze and aerosol pollution on rice and wheat productions in China. Sci. Rep. 2016, 6, 1–6. [Google Scholar] [CrossRef] [Green Version]
- Xing, C.; Liu, C.; Wang, S.; Lok Chan, K.; Gao, Y.; Huang, X.; Su, W.; Zhang, C.; Dong, Y.; Fan, G.; et al. Observations of the vertical distributions of summertime atmospheric pollutants and the corresponding ozone production in Shanghai, China. Atmos. Chem. Phys. 2017, 17, 14275–14289. [Google Scholar] [CrossRef] [Green Version]
- Zheng, Y.; Che, H.; Xia, X.; Wang, Y.; Wang, H.; Wu, Y.; Tao, J.; Zhao, H.; An, L.; Li, L.; et al. Five-year observation of aerosol optical properties and its radiative effects to planetary boundary layer during air pollution episodes in North China: Intercomparison of a plain site and a mountainous site in Beijing. Sci. Total Environ. 2019, 674, 140–158. [Google Scholar] [CrossRef]
- Che, H.; Xia, X.; Zhu, J.; Li, Z.; Dubovik, O.; Holben, B.; Goloub, P.; Chen, H.; Estelles, V.; Cuevas-Agulló, E.; et al. Column aerosol optical properties and aerosol radiative forcing during a serious haze-fog month over North China Plain in 2013 based on ground-based sunphotometer measurements. Atmos. Chem. Phys. 2014, 14, 2125–2138. [Google Scholar] [CrossRef] [Green Version]
- Zhang, L.; Zhao, T.; Gong, S.; Kong, S.; Tang, L.; Liu, D.; Wang, Y.; Jin, L.; Shan, Y.; Tan, C.; et al. Updated emission inventories of power plants in simulating air quality during haze periods over East China. Atmos. Chem. Phys. 2018, 18, 2065–2079. [Google Scholar] [CrossRef] [Green Version]
- Zhang, X.; Wang, H.; Che, H.Z.; Tan, S.C.; Shi, G.Y.; Yao, X.P.; Zhao, H.J. Improvement of snow/haze confusion data gaps in MODIS Dark Target aerosol retrievals in East China. Atmos. Res. 2020, 245, 105063. [Google Scholar] [CrossRef]
- Zhang, X.Y.; Wang, Y.Q.; Niu, T.; Zhang, X.C.; Gong, S.L.; Zhang, Y.M.; Sun, J.Y. Atmospheric aerosol compositions in China: Spatial/temporal variability, chemical signature, regional haze distribution and comparisons with global aerosols. Atmos. Chem. Phys. 2012, 12, 779–799. [Google Scholar] [CrossRef] [Green Version]
- Sun, Y.; Jiang, Q.; Xu, Y.; Ma, Y.; Zhang, Y.; Liu, X.; Li, W.; Wang, F.; Li, J.; Wang, P.; et al. Aerosol characterization over the North China Plain: Haze life cycle and biomass burning impacts in summer. J. Geophys. Res. Atmos. 2016, 121, 2508–2521. [Google Scholar] [CrossRef] [Green Version]
- Xing, C.; Liu, C.; Hu, Q.; Fu, Q.; Lin, H.; Wang, S.; Su, W.; Wang, W.; Javed, Z.; Liu, J. Identifying the wintertime sources of volatile organic compounds (VOCs) from MAX-DOAS measured formaldehyde and glyoxal in Chongqing, southwest China. Sci. Total Environ. 2020, 715, 136258. [Google Scholar] [CrossRef]
- Li, L.; Che, H.; Derimian, Y.; Dubovik, O.; Luan, Q.; Li, Q.; Huang, X.; Zhao, H.; Gui, K.; Zheng, Y.; et al. Climatology of Fine and Coarse Mode Aerosol Optical Thickness Over East and South Asia Derived From POLDER/PARASOL Satellite. J. Geophys. Res. Atmos. 2020, 125, e2020JD032665. [Google Scholar] [CrossRef]
- Sun, Y.; Yin, H.; Liu, C.; Zhang, L.; Cheng, Y.; Palm, M.; Notholt, J.; Lu, X.; Vigouroux, C.; Zheng, B.; et al. Mapping the drivers of formaldehyde (HCHO) variability from 2015 to 2019 over eastern China: Insights from Fourier transform infrared observation and GEOS-Chem model simulation. Atmos. Chem. Phys. 2021, 21, 6365–6387. [Google Scholar] [CrossRef]
- Zhong, J.; Zhang, X.; Wang, Y.; Wang, J.; Shen, X.; Zhang, H.; Wang, T.; Xie, Z.; Liu, C.; Zhang, H.; et al. The two-way feedback mechanism between unfavorable meteorological conditions and cumulative aerosol pollution in various haze regions of China. Atmos. Chem. Phys. 2019, 19, 3287–3306. [Google Scholar] [CrossRef] [Green Version]
- Wang, H.; Peng, Y.; Zhang, X.; Liu, H.; Zhang, M.; Che, H.; Cheng, Y.; Zheng, Y. Contributions to the explosive growth of PM2.5 mass due to aerosol-radiation feedback and decrease in turbulent diffusion during a red alert heavy haze in Beijing-Tianjin-Hebei, China. Atmos. Chem. Phys. 2018, 18, 17717–17733. [Google Scholar] [CrossRef] [Green Version]
- Zhao, H.; Gui, K.; Ma, Y.; Wang, Y.; Wang, Y.; Wang, H.; Zheng, Y.; Li, L.; Zhang, L.; Che, H.; et al. Climatological variations in aerosol optical depth and aerosol type identification in Liaoning of Northeast China based on MODIS data from 2002 to 2019. Sci. Total Environ. 2021, 781, 146810. [Google Scholar] [CrossRef]
- Gui, K.; Che, H.; Li, L.; Zheng, Y.; Zhang, L.; Zhao, H.; Zhong, J.; Yao, W.; Liang, Y.; Wang, Y.; et al. The Significant Contribution of Small-Sized and Spherical Aerosol Particles to the Decreasing Trend in Total Aerosol Optical Depth over Land from 2003 to 2018. Engineering 2021, in press. [Google Scholar] [CrossRef]
- Zhou, H.; Jiang, M.; Huang, Y.; Wang, Q. Directional spatial spillover effects and driving factors of haze pollution in North China Plain. Resour. Conserv. Recycl. 2021, 169, 105475. [Google Scholar] [CrossRef]
- Sun, H.; Shi, Y.; Liu, L.; Ding, W.; Zhang, Z.; Hu, F. Impacts of Atmospheric Boundary Layer Vertical Structure on Haze Pollution Observed by Tethered Balloon and Lidar. J. Meteorol. Res. 2021, 35, 209–223. [Google Scholar] [CrossRef]
- Zhao, Z.; Xi, H.; Russo, A.; Du, H.; Gong, Y.; Xiang, J.; Zhou, Z.; Zhang, J.; Li, C.; Zhou, C. The Influence of Multi-Scale Atmospheric Circulation on Severe Haze Events in Autumn and Winter in Shanghai, China. Sustainability 2019, 11, 5979. [Google Scholar] [CrossRef] [Green Version]
- Gui, K.; Che, H.; Zheng, Y.; Wang, Y.; Zhang, L.; Zhao, H.; Li, L.; Zhong, J.; Yao, W.; Zhang, X. Seasonal variability and trends in global type-segregated aerosol optical depth as revealed by MISR satellite observations. Sci. Total Environ. 2021, 787, 147543. [Google Scholar] [CrossRef] [PubMed]
- Che, H.; Xia, X.; Zhao, H.; Dubovik, O.; Holben, B.N.; Goloub, P.; Cuevas-Agulló, E.; Estelles, V.; Wang, Y.; Zhu, J.; et al. Spatial distribution of aerosol microphysical and optical properties and direct radiative effect from the China Aerosol Remote Sensing Network. Atmos. Chem. Phys. 2019, 19, 11843–11864. [Google Scholar] [CrossRef] [Green Version]
- Che, H.; Yang, L.; Liu, C.; Xia, X.; Wang, Y.; Wang, H.; Wang, H.; Lu, X.; Zhang, X. Long-term validation of MODIS C6 and C6.1 Dark Target aerosol products over China using CARSNET and AERONET. Chemosphere 2019, 236, 124268. [Google Scholar] [CrossRef]
- Wu, B.; Li, Z.; Ju, T.; Zhang, H. Characteristics of Low-level jets during 2015–2016 and the effect on fog in Tianjin. Atmos. Res. 2020, 245, 105102. [Google Scholar] [CrossRef]
- Shi, Y.; Hu, F.; Fan, G.; Zhang, Z. Multiple technical observations of the atmospheric boundary layer structure of a red-alert haze episode in Beijing. Atmos. Meas. Tech. 2019, 12, 4887–4901. [Google Scholar] [CrossRef] [Green Version]
- Benjamin, S.G.; Schwartz, B.E.; Szoke, E.J.; Koch, S.E. The Value of Wind Profiler Data in U.S. Weather Forecasting. Bull. Am. Meteorol. Soc. 2004, 85, 1871–1886. [Google Scholar] [CrossRef]
- Wang, C.; Shi, H.; Jin, L.; Chen, H.; Wen, H. Measuring boundary-layer height under clear and cloudy conditions using three instruments. Particuology 2016, 28, 15–21. [Google Scholar] [CrossRef]
- Deshpande, S.M.; Raj, P.E. UHF wind profiler observations during a tropical pre-monsoon thunderstorm—A case study. Atmos. Res. 2009, 93, 179–187. [Google Scholar] [CrossRef]
- Cao, B.; Zhang, Y.; Zhao, Y.; Wen, X.; Fan, G.; Xiao, M.; Jin, L. Influence of the low-level jet on the intensity of the nocturnal oasis cold island effect over northwest China. Theor. Appl. Climatol. 2020, 139, 689–699. [Google Scholar] [CrossRef]
- Ren, Y.; Zhang, H.; Wei, W.; Cai, X.; Song, Y.; Kang, L. A study on atmospheric turbulence structure and intermittency during heavy haze pollution in the Beijing area. Sci. China Earth Sci. 2019, 62, 2058–2068. [Google Scholar] [CrossRef]
- Wang, S.; Liao, T.; Wang, L.; Sun, Y. Process analysis of characteristics of the boundary layer during a heavy haze pollution episode in an inland megacity, China. J. Environ. Sci. 2016, 40, 138–144. [Google Scholar] [CrossRef] [PubMed]
- Li, X.; Wang, Y.; Zhao, H.; Hong, Y.; Liu, N.; Ma, Y. Characteristics of Pollutants and Boundary Layer Structure during Two Haze Events in Summer and Autumn 2014 in Shenyang, Northeast China. Aerosol Air Qual. Res. 2018, 18, 386–396. [Google Scholar] [CrossRef]
- Li, L.; Zhou, D.; Wang, Y.; Hong, Y.; Cui, J.; Jiang, P. An observational study of atmospheric ice nuclei number concentration during three fog-haze weather periods in Shenyang, northeastern China. Atmos. Res. 2017, 188, 11–19. [Google Scholar] [CrossRef]
- Ye, S.; Ma, T.; Duan, F.; Li, H.; He, K.; Xia, J.; Yang, S.; Zhu, L.; Ma, Y.; Huang, T.; et al. Characteristics and formation mechanisms of winter haze in Changzhou, a highly polluted industrial city in the Yangtze River Delta, China. Environ. Pollut. 2019, 253, 377–383. [Google Scholar] [CrossRef]
- Miao, Y.; Liu, S.; Zheng, Y.; Wang, S.; Chen, B.; Zheng, H.; Zhao, J. Numerical study of the effects of local atmospheric circulations on a pollution event over Beijing–Tianjin–Hebei, China. J. Environ. Sci. 2015, 30, 9–20. [Google Scholar] [CrossRef]
- Burney, J.; Ramanathan, V. Recent climate and air pollution impacts on indian agriculture. Proc. Natl. Acad. Sci. USA 2014, 111, 16319–16324. [Google Scholar] [CrossRef] [Green Version]
- Agyei, T.; Juráň, S.; Edwards-jonášová, M.; Fischer, M.; Švik, M.; Komínková, K.; Ofori-amanfo, K.K.; Marek, M.V.; Grace, J.; Urban, O. The Influence of Ozone on Net Ecosystem Production of a Ryegrass–Clover Mixture under Field Conditions. Atmosphere 2021, 12, 1629. [Google Scholar] [CrossRef]
- Zhao, H.; Che, H.; Xia, X.; Wang, Y.; Wang, H.; Wang, P.; Ma, Y.; Yang, H.; Liu, Y.; Wang, Y.; et al. Multiyear Ground-Based Measurements of Aerosol Optical Properties and Direct Radiative Effect Over Different Surface Types in Northeastern China. J. Geophys. Res. Atmos. 2018, 123, 13887–13916. [Google Scholar] [CrossRef]
- Yang, G.; Zhao, H.; Tong, D.Q.; Xiu, A.; Zhang, X.; Gao, C. Impacts of post-harvest open biomass burning and burning ban policy on severe haze in the Northeastern China. Sci. Total Environ. 2020, 716, 136517. [Google Scholar] [CrossRef]
- Chen, W.W.; Tong, D.Q.; Dan, M.; Zhang, S.C.; Zhang, X.L.; Pan, Y.P. Typical atmospheric haze during crop harvest season in northeastern China: A case in the Changchun region. J. Environ. Sci. 2017, 54, 101–113. [Google Scholar] [CrossRef] [PubMed]
- Zhang, J.; Liu, L.; Wang, Y.; Ren, Y.; Wang, X.; Shi, Z.; Zhang, D.; Che, H.; Zhao, H.; Liu, Y.; et al. Chemical composition, source, and process of urban aerosols during winter haze formation in Northeast China. Environ. Pollut. 2017, 231, 357–366. [Google Scholar] [CrossRef] [PubMed]
- Zhang, B.; Wang, Y.; Hao, J. Simulating aerosol-radiation-cloud feedbacks on meteorology and air quality over eastern China under severe haze conditionsin winter. Atmos. Chem. Phys. 2015, 15, 2387–2404. [Google Scholar] [CrossRef] [Green Version]
- Li, X.; Dong, S.; Lei, Y.; Li, Y. The effect of stocking density of Chinese mitten crab Eriocheir sinensis on rice and crab seed yields in rice–crab culture systems. Aquaculture 2007, 273, 487–493. [Google Scholar] [CrossRef]
- Xu, Q.; Wang, X.; Xiao, B.; Hu, K. Rice-crab coculture to sustain cleaner food production in Liaohe River Basin, China: An economic and environmental assessment. J. Clean. Prod. 2019, 208, 188–198. [Google Scholar] [CrossRef]
- Huang, W.; Gill, E.; Wu, S.; Wen, B.; Yang, Z.; Hou, J. Measuring surface wind direction by monostatic HF ground-wave radar at the Eastern China Sea. IEEE J. Ocean. Eng. 2004, 29, 1032–1037. [Google Scholar] [CrossRef]
- Han, S.; Yang, H.; Xue, W.; Wang, X. The study of single station inverting the sea surface current by HF ground wave radar based on adjoint assimilation technology. J. Ocean Univ. China 2016, 16, 383–388. [Google Scholar] [CrossRef]
- Doviak, R.J.; Zrnic’, D.S. Reflection and scatter formula for anisotropically turbulent air. Radio Sci. 1984, 19, 325–336. [Google Scholar] [CrossRef]
- Lu, X.; Fung, J.C.H.; Wu, D. Modeling wet deposition of acid substances over the PRD region in China. Atmos. Environ. 2015, 122, 819–828. [Google Scholar] [CrossRef]
- Che, H.; Zhang, X.; Li, Y.; Zhou, Z.; Qu, J.J.; Che, C.; Zhang, X.; Li, Y.; Zhou, Z.; Qu, J.J. Horizontal visibility trends in China 1981–2005. Geophys. Res. Lett. 2007, 34, 24706. [Google Scholar] [CrossRef]
- Wang, M.; Wei, W.; Ruan, Z.; He, Q.; Ge, R. Application of wind-profiling radar data to the analysis of dust weather in the Taklimakan Desert. Environ. Monit. Assess. 2012, 185, 4819–4834. [Google Scholar] [CrossRef]
- Adler, B.; Kalthoff, N.; Kiseleva, O. Detection of structures in the horizontal wind field over complex terrain using coplanar Doppler lidar scans. Meteorol. Zeitschrift 2020, 29, 467–481. [Google Scholar] [CrossRef]
- Liu, D.Y.; Yan, W.L.; Yang, J.; Pu, M.J.; Niu, S.J.; Li, Z.H. A Study of the Physical Processes of an Advection Fog Boundary Layer. Boundary-Layer Meteorol. 2015, 158, 125–138. [Google Scholar] [CrossRef]
- Miao, Y.; Guo, J.; Liu, S.; Liu, H.; Li, Z.; Zhang, W.; Zhai, P. Classification of summertime synoptic patterns in Beijing and their associations with boundary layer structure affecting aerosol pollution. Atmos. Chem. Phys. 2017, 17, 3097–3110. [Google Scholar] [CrossRef] [Green Version]
- Li, Q.; Zhang, H.; Cai, X.; Song, Y.; Zhu, T. The impacts of the atmospheric boundary layer on regional haze in North China. npj Clim. Atmos. Sci. 2021, 4, 9. [Google Scholar] [CrossRef]
- Marley, H.G.; Dirks, K.N.; Neverman, A.J.; McKendry, I.; Salmond, J.A. The relationship between Brown haze, atmospheric boundary layer structure, and air pollution in an urban area of complex coastal terrain. Atmos. Pollut. Res. 2021, 12, 101057. [Google Scholar] [CrossRef]
- Sun, Z.; Zhao, X.; Li, Z.; Tang, G.; Miao, S. Boundary layer structure characteristics under objective classification of persistent pollution weather types in the Beijing area. Atmos. Chem. Phys. 2021, 21, 8863–8882. [Google Scholar] [CrossRef]
- Angevine, W.M.; White, A.B.; Avery, S.K. Boundary-layer depth and entrainment zone characterization with a boundary-layer profiler. Boundary-Layer Meteorol. 1994, 68, 375–385. [Google Scholar] [CrossRef]
- Yi, C.L.; Wu, L. Studies to Determine the Wind Profile Radar SNR Threshold Method. Appl. Mech. Mater. 2015, 740, 744–748. [Google Scholar] [CrossRef]
- Wyngaard, J.C.; Seaman, N.; Kimmel, S.J.; Otte, M.; Di, X.; Gilbert, K.E. Concepts, observations, and simulation of refractive index turbulence in the lower atmosphere. Radio Sci. 2001, 36, 643–669. [Google Scholar] [CrossRef]
- Basu, S. A simple approach for estimating the refractive index structure parameter (Cn2) profile in the atmosphere. Opt. Lett. 2015, 40, 4130–4133. [Google Scholar] [CrossRef] [PubMed]
- De Foy, B.; Zavala, M.; Bei, N.; Molina, L.T. Evaluation of WRF mesoscale simulations and particle trajectory analysis for the MILAGRO field campaign. Atmos. Chem. Phys. 2009, 9, 4419–4438. [Google Scholar] [CrossRef] [Green Version]
- Yu, C.; Yu, C.; Zhao, T.; Bai, Y.; Zhang, L.; Zhang, L.; Kong, S.; Yu, X.; He, J.; Cui, C.; et al. Heavy air pollution with a unique “non-stagnant” atmospheric boundary layer in the Yangtze River middle basin aggravated by regional transport of PM2.5 over China. Atmos. Chem. Phys. 2020, 20, 7217–7230. [Google Scholar] [CrossRef]
- Cheng, Y.; Yu, Q.Q.; Liu, J.M.; Du, Z.Y.; Liang, L.L.; Geng, G.N.; Zheng, B.; Ma, W.L.; Qi, H.; Zhang, Q.; et al. Strong biomass burning contribution to ambient aerosol during heating season in a megacity in Northeast China: Effectiveness of agricultural fire bans? Sci. Total Environ. 2021, 754, 142144. [Google Scholar] [CrossRef]
- Ding, Y.; Lu, J.; Liu, Z.; Li, W.; Chen, J. Volatile organic compounds in Shihezi, China, during the heating season: Pollution characteristics, source apportionment, and health risk assessment. Environ. Sci. Pollut. Res. 2020, 27, 16439–16450. [Google Scholar] [CrossRef]
- Qi, M.; Jiang, L.; Liu, Y.; Xiong, Q.; Sun, C.; Li, X.; Zhao, W.; Yang, X. Analysis of the Characteristics and Sources of Carbonaceous Aerosols in PM2.5 in the Beijing, Tianjin, and Langfang Region, China. Int. J. Environ. Res. Public Health 2018, 15, 1483. [Google Scholar] [CrossRef] [Green Version]
- Wu, J.; Bei, N.; Hu, B.; Liu, S.; Zhou, M.; Wang, Q.; Li, X.; Liu, L.; Feng, T.; Liu, Z.; et al. Aerosol-radiation feedback deteriorates the wintertime haze in the North China Plain. Atmos. Chem. Phys. 2019, 19, 8703–8719. [Google Scholar] [CrossRef] [Green Version]


| Stage | Duration |
|---|---|
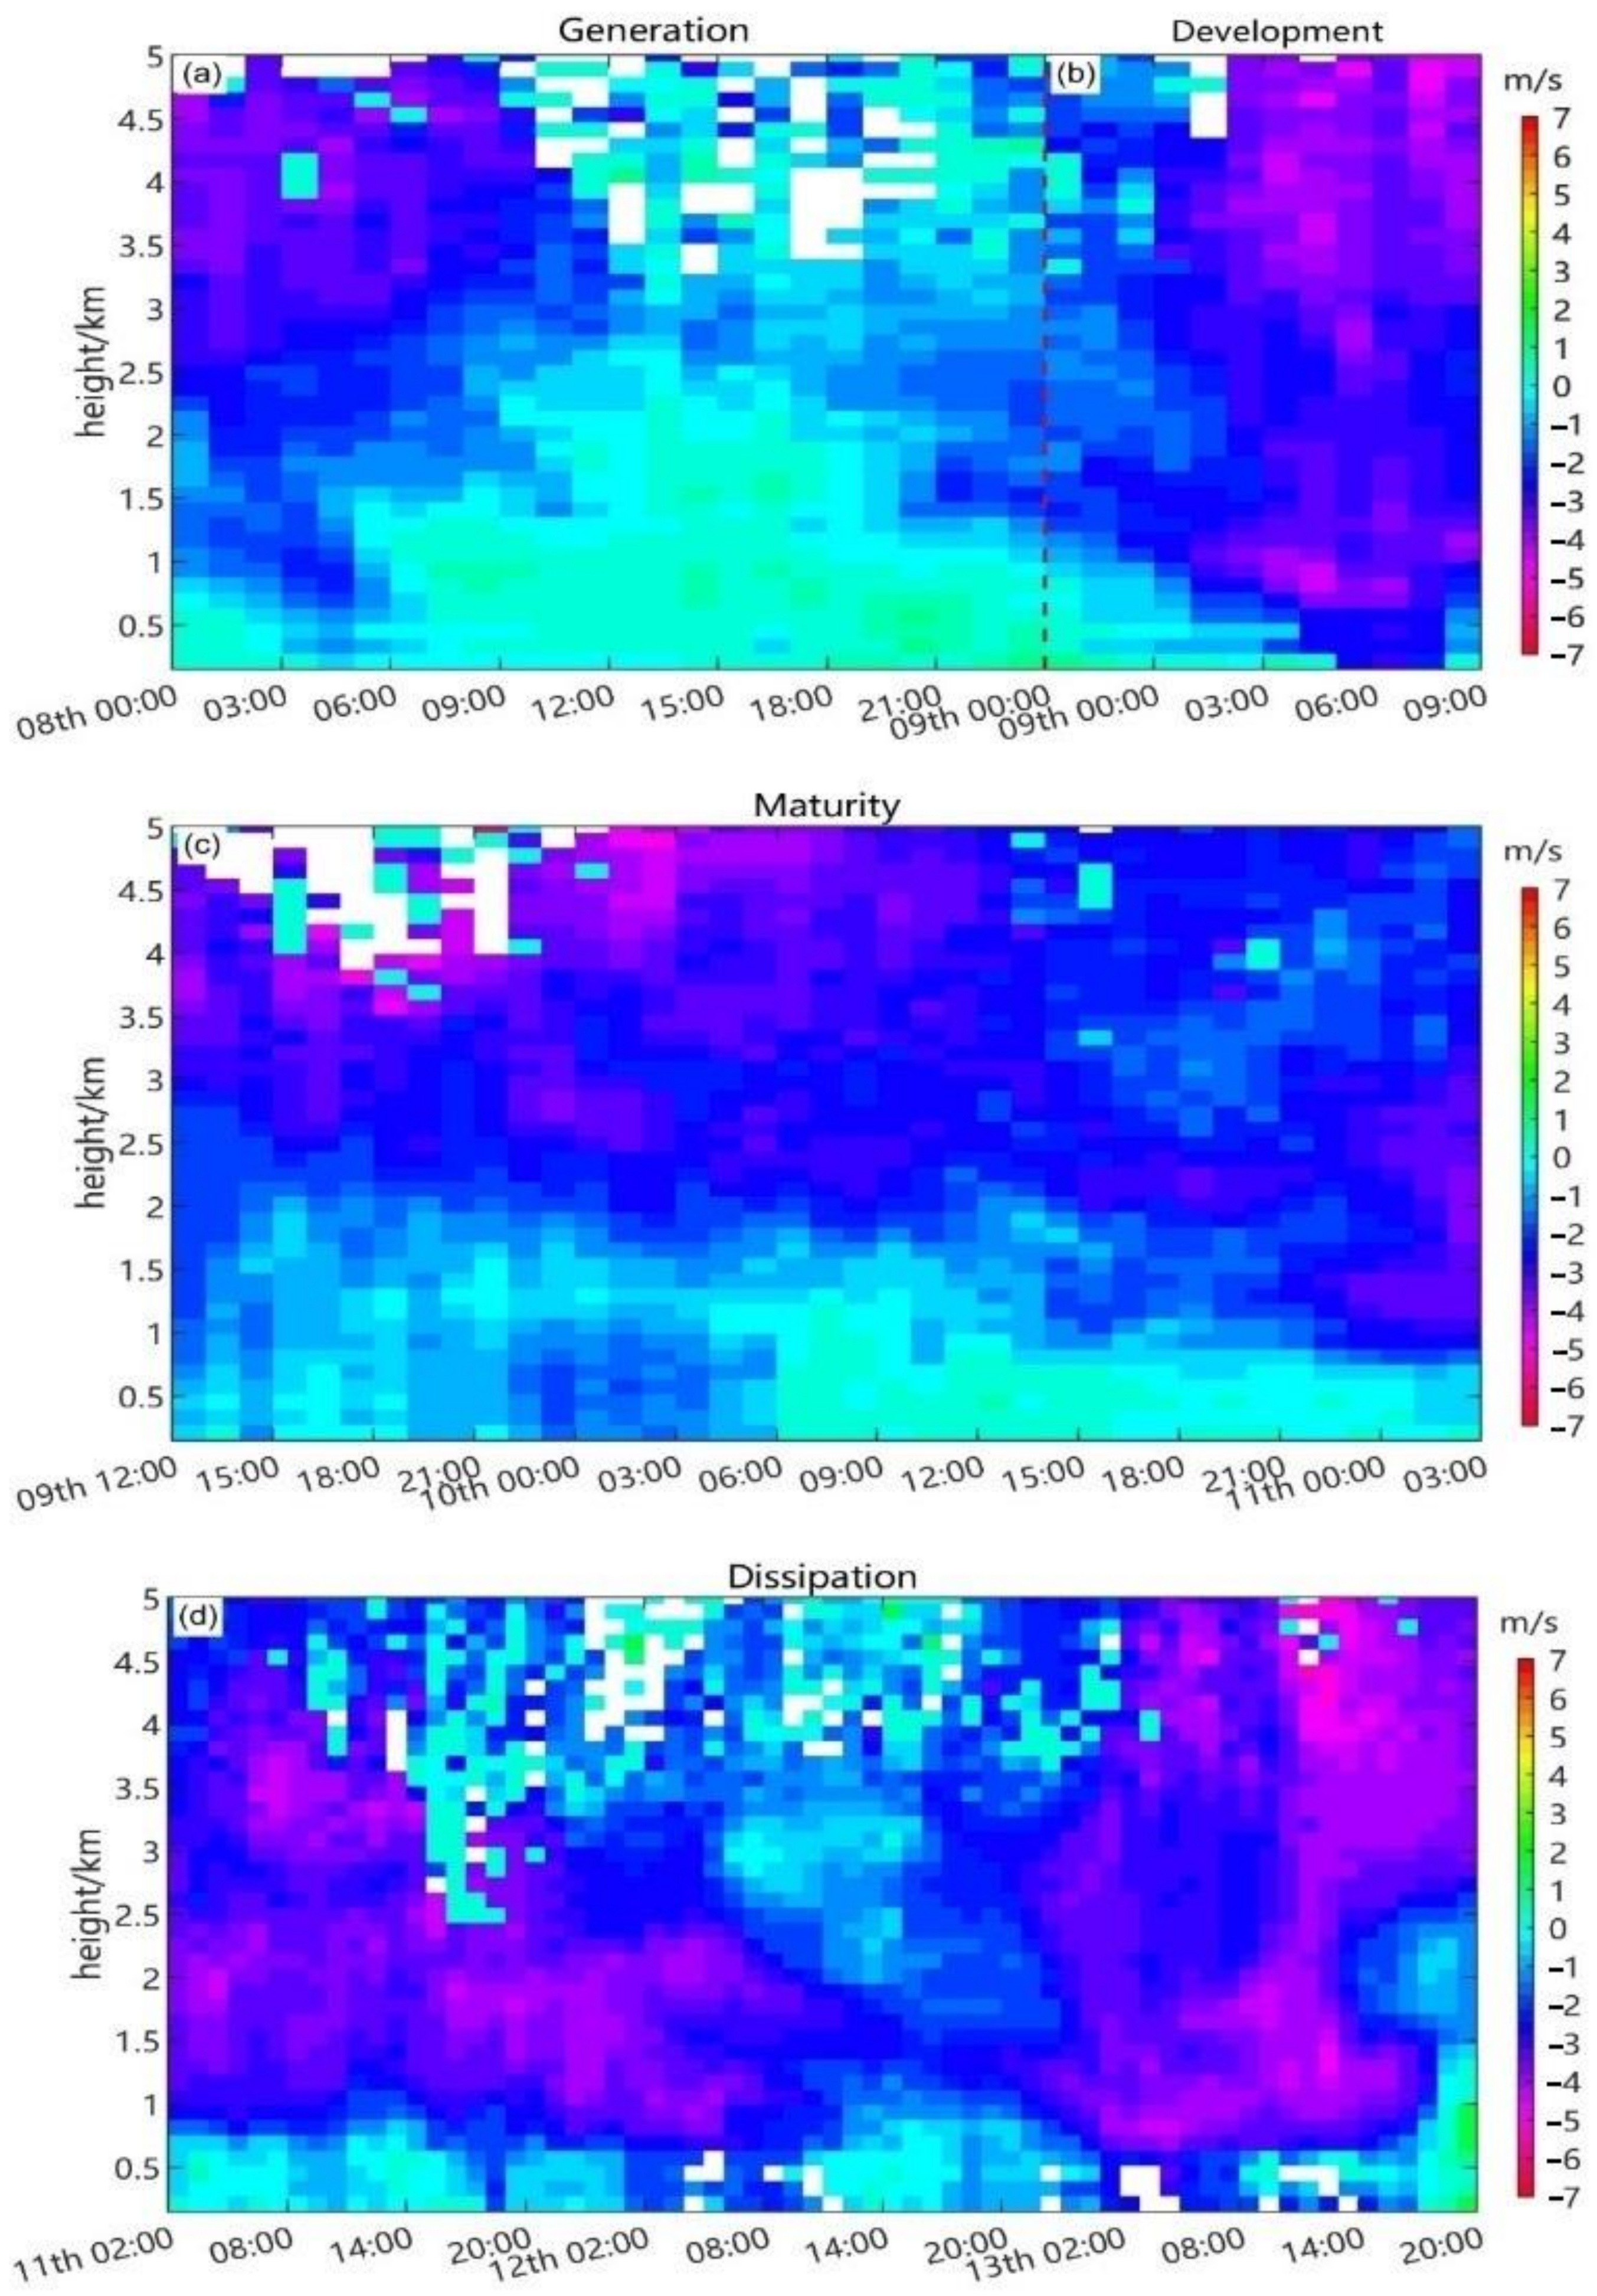
| Generation | 0:00–24:00 8 February |
| Development | 0:00–11:00 9 February |
| Maturity | 11:00 9 February to 02:00 11 February |
| Dissipation | 02:00 11 February to 20:00 13 February |
Publisher’s Note: MDPI stays neutral with regard to jurisdictional claims in published maps and institutional affiliations. |
© 2022 by the authors. Licensee MDPI, Basel, Switzerland. This article is an open access article distributed under the terms and conditions of the Creative Commons Attribution (CC BY) license (https://creativecommons.org/licenses/by/4.0/).
Share and Cite
Kang, B.; Liu, C.; Miao, C.; Zhang, T.; Li, Z.; Hou, C.; Li, H.; Li, C.; Zheng, Y.; Che, H. A Comprehensive Study of a Winter Haze Episode over the Area around Bohai Bay in Northeast China: Insights from Meteorological Elements Observations of Boundary Layer. Sustainability 2022, 14, 5424. https://doi.org/10.3390/su14095424
Kang B, Liu C, Miao C, Zhang T, Li Z, Hou C, Li H, Li C, Zheng Y, Che H. A Comprehensive Study of a Winter Haze Episode over the Area around Bohai Bay in Northeast China: Insights from Meteorological Elements Observations of Boundary Layer. Sustainability. 2022; 14(9):5424. https://doi.org/10.3390/su14095424
Chicago/Turabian StyleKang, Boshi, Chong Liu, Chuanhai Miao, Tiening Zhang, Zonghao Li, Chang Hou, Hongshuo Li, Chenrui Li, Yu Zheng, and Huizheng Che. 2022. "A Comprehensive Study of a Winter Haze Episode over the Area around Bohai Bay in Northeast China: Insights from Meteorological Elements Observations of Boundary Layer" Sustainability 14, no. 9: 5424. https://doi.org/10.3390/su14095424
APA StyleKang, B., Liu, C., Miao, C., Zhang, T., Li, Z., Hou, C., Li, H., Li, C., Zheng, Y., & Che, H. (2022). A Comprehensive Study of a Winter Haze Episode over the Area around Bohai Bay in Northeast China: Insights from Meteorological Elements Observations of Boundary Layer. Sustainability, 14(9), 5424. https://doi.org/10.3390/su14095424