Article

Risk Assessment of Ship Navigation in the Northwest Passage: Historical and Projection

1
Chinese Antarctic Center of Surveying and Mapping, Wuhan University, Wuhan 430079, China
2
State Key Laboratory of Severe Weather, Chinese Academy of Meteorological Sciences, Beijing 100081, China
3
College of Resources and Environment, University of Chinese Academy of Sciences, Beijing 100049, China
*
Author to whom correspondence should be addressed.
Sustainability 2022, 14(9), 5591; https://doi.org/10.3390/su14095591
Submission received: 1 April 2022 / Revised: 29 April 2022 / Accepted: 3 May 2022 / Published: 6 May 2022

Abstract

:
Shipping volumes in the Northwest Passage are likely to increase under climate change due to the distance advantage over traditional routes and the special strategic location of the Arctic. However, the harsh environment and poor channel conditions may pose a considerable risk to ship navigation. To ensure the safety of ships, understand the navigability of the route, and plan the sustainable use of the Northwest Passage, it is crucial to provide a quantitative risk assessment. Here, we present an analysis of several natural risks faced by ships in the Northwest Passage based on available datasets and use climate model simulations to project the navigability changes. The results showed that: (1) The sea-ice risk to ships in the Northwest Passage has been significantly reduced over the period 1979–2019, and the risk for Polar Class 6 (PC6) ships has decreased more rapidly than for general open-water (OW) ships. The difference in ice-breaking capacity further affects the seaworthy season, with the second seaworthy month being August for OW ships and October for PC6 ships, in addition to the commonly best September. (2) Low visibility is a more common form of adverse weather than strong wind for navigation in the Northwest Passage, mainly on the northern route, although pilotage conditions appear to be improving in September. (3) According to the comprehensive risk map, the distribution of risk is dominated by sea ice. The southern route of the Northwest Passage is superior to the northern route in terms of both sea ice and weather conditions, but there is a risk of shallow water. (4) For the northern route, which has greater transport potential, projections suggest that the sea-ice risk will be steadily lower than any extreme light ice year observed historically whether for the ship class OW or PC6 by 2050, with an increase of 50–80 navigable days, and the navigable period could be from June to January of the following year for PC6 ships by 2100. Our results provide valuable information for ships planning to pass through the Northwest Passage.

1. Introduction

Global warming and the abundance of natural resources have made the Arctic an increasingly strategic location. The accelerated melting of Arctic sea ice promises to make the Arctic Sea Routes a convenient “new link” and “highway” between the Atlantic and Pacific Oceans [1], and it will surely promote connectivity, sustainable economic and social development in the Arctic region. As one of the Arctic Sea Routes, the Northwest Passage (NWP) is considered to be the shortest route connecting Asia and eastern North America. It can reduce the distance by ~4700 nautical miles compared to the traditional routes (through the Suez Canal, the Panama Canal, and the Cape of Good Hope), and without congestion, terrorist attacks, piracy, and other anthropogenic security risks, which have a potentially great economic value of maritime transport [2,3]. However, the disadvantages of the NWP are the complicated sea-ice conditions and the harsh natural environment of the Arctic [4], along with the inadequate infrastructure and poor emergency response and rescue capabilities, making it an inaccessible area in history.
The Arctic is an extremely sensitive region to climate change [5], with surface air temperature rising at more than twice the global average [6,7]. In recent decades, sea ice coverage has been drastically reduced [1,8], and the thickness of sea ice is becoming thinner [9,10]. The diminishing ice barriers and the increasing open water [11], as a result, are expected to encourage the NWP to become a stable intercontinental transportation route [12,13]. On the other hand, the NWP is also opening up access for neighboring countries to explore natural resources in the Arctic [14]. It is foreseeable that more commercial transport, scientific research, and exploration ships will sail on the NWP, which will benefit the surrounding communities.
The Canadian Arctic Archipelago (CAA) is the main segment of the NWP (Figure 1); the change in sea ice cover over 40 years period [15,16] has raised concerns about its shipping activities. It appears that the reduction in sea ice has increased the amount of ship activity as well as the distance travelled by ships [17,18]. However, only weak correlations between the variables were identified [19]. The ice thickness is still considered severe in today’s climate [20], and the changes in ice-melt duration [21,22,23] and sea-ice exchange [24,25,26,27] in CAA have likewise not prevented the accumulation of multi-year ice on the route. These investigations suggest that the observed increase in shipping activities is more likely due to non-environmental factors such as the tourism demand, community re-supply needs, and resource exploration trends, rather than implying that the risk of navigation is decreasing. It remains unclear whether the navigational risk of the NWP has been significantly reduced, where the highest risks of the NWP are, and how the navigation risk of the NWP will change in the future, particularly for ships with different ice-breaking capabilities.
Sea ice and other meteorological and hydrological risks such as strong wind, low visibility, low temperature, and shallow water segments serve as major impediments to ship navigation [28,29,30,31,32,33] and present some additional risk-influencing factors of the natural environment: heavy waves mixed with drifting ice, icing of the ship, and prolonged periods of darkness. These factors may have an increasing effect on the number of accidents such as collisions, groundings, and instrument failures, raising worries about transport in the NWP. For instance, a survey by the Transportation Safety Board of Canada (TSB) shows that in 2020 there were 71 marine accidents in the Canada Central Region near the Arctic, 50% of which were collisions, with the majority of reportable incidents involving mechanical or system failures on board [34]. It is widely known that transport systems could perform worse under adverse and extreme weather conditions [35], and the poor infrastructure of the NWP means that the consequences of any accident would be severe. Furthermore, ship accidents are likely to cause serious pollution, for example, oil spills resulting from ship collisions [36]. Complex factors such as the low temperature environment, drift ice and hydrological cycle in the Arctic will make it difficult for oil pollution and other pollutants to dissipate, thus causing significant environmental damage and affecting the ecological sustainability of the NWP. Hence, to avoid the occurrence of ship accidents, the environmental risks of the NWP need to be further understood and effectively assessed.
Navigation risk assessment is based on the probability of risk occurrence and the consequences caused. Several studies have discussed the shipping risks in the Arctic using the risk matrixes [37,38,39,40]; however, such efforts were based on the accident analytical reports and expert opinions, and neither the probability nor the harm severity have been specifically and precisely estimated. Navigation in the NWP requires the aid of accurate weather forecasts and charts that correspond to realistic conditions. In contrast to the real-time or dynamic assessment [41,42,43], a risk map obtained by long-term statistics can provide people with an overall understanding of the distribution of risks in the NWP in advance, which is also essential for safe route selection, sustainable use of the channel, and regional development planning. However, there are few results of such works at present. The International Maritime Organization (IMO) has adopted the International Code for Ships Operating in Polar Waters (Polar Code) in 2015 to assist in the safe operation of ships in polar regions and the protection of the environment [44], which provides a way from the mariner’s point of view to properly assess the risks involved in the anticipated voyage and the readiness of the ship. Associated with the Polar Code, the Polar Operational Limitations Assessment Risk Indexing System (POLARIS) is used to consider the risk of ice [45] and has been widely applied in ship route planning in the Arctic Ocean [46], research on navigation risk [47], and assessment of navigability [48]. Therefore, by building on the risk of ice and further considering the effects of the adverse weather and narrow waterways of the NWP, a comprehensive risk assessment can be provided to aid safe navigation of ships.
Here, we first evaluated the impact and change in various potential navigation risks in the NWP over a 41-year period using multi-source data. The POLARIS is used to illustrate the risk of sea ice, where the Risk Index Outcome (RIO) can directly assess the risk of a ship operating in an ice region. In addition, we divided the intensity grades of the hydrometeorological risks of navigation with reference to the vessel pilotage weather conditions [31,49], air temperature, and channel water depth, and constructed the risk indexes, respectively, to quantify the risks. Secondly, we generated multi-year risk maps of the NWP by assigning weights to each risk factor to calculate a comprehensive risk. Then, the possible future changes in sea-ice risk, as well as navigable days based on Community Earth System Model Large Ensemble (CESM-LE) [50] were estimated. Finally, we discussed the navigation precautions and the sustainable utilization of the NWP.

2. Datasets and Methods

2.1. Datasets

2.1.1. Canadian Ice Service Digital Archive

We use the Canadian Ice Service Digital Archive (CISDA) dataset to assess historical (1979–2019) sea-ice risk changes in the Northwest Passage. CISDA is a compilation of all regional weekly ice charts provided by the Canadian Ice Service (CIS) that integrates all available real-time sea ice information from various satellite sensors, aerial reconnaissance, ship reports, operational model results and the expertise of experienced ice forecasters, spanning from 1968 to the present [51]. During the melt season, the CISDA is more accurate over large areas than the sea ice concentration derived from Scanning Multichannel Microwave Radiometer (SMMR) and Special Sensor Microwave/Imager (SSM/I) passive microwave data using the National Aeronautics and Space Administration (NASA) Team algorithm [52]. Moreover, ice charts include the ice concentration by ice type, such as first-year ice and old ice, which are useful for understanding the major sea ice composition of waterways. The CIS has also established sea ice regime regions (CISIRR) to be used with the CISDA [53], by which we divide the regions of the northern and southern routes of the Northwest Passage.

2.1.2. ERA5 Reanalysis Data

The ERA5 reanalysis data of 10 m wind, 2 m temperature, and specific cloud liquid water content are used to analyze meteorological risks over a period of 41 years (1979–2019). ERA5 is the fifth-generation European Centre for Medium-Range Weather Forecasts (ECMWF) atmospheric reanalysis of the global climate, providing hourly estimates of a large number of atmospheric, land, and oceanic climate variables. Reanalysis combines model data with observations from across the world into a globally complete and consistent dataset using the laws of physics [54], and ERA5 replaces the ERA-Interim reanalysis which stopped being produced on 31 August 2019. In comparison to ERA-Interim, ERA5 has improved from spatial, vertical, and temporal to obtain a better representation of the small-scale features [55].

2.1.3. Water Depth Topographic Data

ETOPO1 data released by the National Geophysical Data Center (NGDC) are used as a reference for assessing the risk of the waterway depth. ETOPO1 is a 1 arc-minute global relief model of the Earth’s surface that integrates land topography and ocean bathymetry. Bathymetric, topographic, and shoreline data used in ETOPO1 were obtained from more than ten institutions including NGDC, NASA, Scientific Committee on Antarctic Research (SCAR), Japan Oceanographic Data Center (JODC), National Snow and Ice Data Center (NSIDC), etc. [56]. In addition, ETOPO1 is vertically referenced to the sea level and horizontally referenced to the World Geodetic System of 1984 (WGS 84), so the bottom of the sea is negative and the mountains are positive.

2.1.4. Community Earth System Model Large Ensemble

We employ the Community Earth System Model Large Ensemble (CESM-LE) to project the future changes in sea-ice risk as well as navigable days for ships. The CESM-LE is a publicly available set of climate model simulations designed to advance the study of variability and change in the internal climate [50]. The Large Ensemble Project includes a 40-member ensemble for the period 1920–2100 and all simulations use a 1-degree version of Community Earth System Model version 1 (CESM1) [57]. Each member is subject to the same radiative forcing scenario with historical emissions from 1920 to 2005 and Representative Concentration Pathway 8.5, an assumption that greenhouse gas emissions will continue to rise, from 2006 to 2100. For sea ice in the model, several studies have shown that CESM-LE reasonably captures the trends and variability related to the Arctic sea ice concentration [11,58,59]. While individual members differ by round-off error in the initial atmosphere state, we averaged over the large number of ensemble members to eliminate this component of uncertainty.

2.2. Calculation of Sea-Ice Risk and Relating to Navigability

The sea-ice risk is represented by the RIO value, which is converted from the concentration of different types of sea ice through POLARIS. POLARIS is a proposed methodology to determine a ship’s capabilities and limitations in sea ice adopted by IMO, and the principle is to assess the risk to ships caused by various ice conditions in combination with the ice class of ship [44,45]. Ice navigation risk indexes of different ice-classes ships are assigned in POLARIS, relating to 12 specified progressing ice types. Each ice type within the ice regime has a risk value (RV), which is determined by the ice class of the ship, and the RIO is the collection of RVs of all types of ice. The specific calculation method is as shown in Equation (1):
RIO = C 1 RV 1 + C 2 RV 2 + C 3 RV 3 + + C n RV n
where C 1 , C 2 , …, C n are the concentrations of sea-ice types within the ice regime and RV 1 , RV 2 , …, RV n are the risk values corresponding to each ice type for a particular ship ice class classification. The concentration of each ice type is reported in tenths, and the range of RV is −8 to +3, yielding RIO values that range from −80 to +30. Three levels of operation are addressed by POLARIS: normal operation, elevated operational risk, and operation subject to special consideration. A negative resulting RIO value indicates a risky condition (elevated operational risk or operation subject to special consideration) for ship navigation in such regions while a positive RIO value presents an acceptable condition (normal operation). Ships with an elevated operational risk should limit their speed, and the provision of additional watch-keeping or use of an icebreaker support is recommended. Operation subject to special consideration means that the ships need to change/adjust the route, further decelerate, and take other special measures. The sea-ice risk area of the entire NWP routes is the sum of the areas of all grid cells with RIO < 0 in the route region, and the individual grid cell area depends on the resolution of data.
Navigability assessment is mainly for the larger regions. We calculate the RIO of the northern route region, and RIO > 0 is used as the threshold for navigable conditions. All the ice types within the northern route are summed together as in Equation (1) to determine the RIO that apply to the route as a whole.

2.3. Classification and Calculation of Meteorological Risks

We classify the weather conditions affecting ship navigation into five grades (Table 1) by reference to past studies and standards [31,49,60]. The influence degree gradually increases from Grade I to Grade V, and ships are generally considered to be at risk when navigating in condition Grade II or above. In addition, we assign a risk value to each grade of weather conditions to facilitate the quantification of the magnitude of the long-term general meteorological risk in the navigation area.
Considering that the meteorological risk is the product of the probability of a severe weather event and the severity of its effect [61], we calculate the risk value by the following equation:
MRV = F I R I + F II R II + F III R III + F IV R IV + F V R V
where MRV represents the meteorological risk value, F I , …, F V are the frequency of each weather condition grade and R I , …, R V are the risk value corresponding to the grade. Among the three meteorological risks, strong wind and low visibility are the main factors that interfere with the navigation, docking, and unberthing behaviors of ship personnel, which are called pilotage risks. Since strong wind weather and foggy weather rarely go hand in hand, the sum of the strong-wind frequency and low-visibility frequency at each grade is the pilotage risk frequency of the corresponding grade.
Different from the wind speed and temperature, visibility does not have a wide range of data that can be directly used. Therefore, we invert the reanalysis data of the cloud liquid water content at 1000 hPa to obtain fog-related atmospheric visibility through a simple method. In the early 1950s, some scholars found that atmospheric visibility was related to the content of liquid water in clouds and the size of cloud droplet particles, and studied the value of the empirical coefficient in the relationship between the three [62]. Much work has been carried out to determine the relationship between the characteristics of fog and the visibility associated with it, most of which is to study the relationship between the liquid water content (LWC) of the fog and the extinction coefficient [63,64,65]. The formula commonly used in numerical research to calculate the horizontal visibility of the atmosphere based on the extinction coefficient is proposed by Stoelinga and Warner [66]:
X vis = ln ( 0.02 ) / β
where X vis is the horizontal visibility (m) and β is the extinction coefficient. In the absence of precipitation, the extinction coefficient of cloud water can be directly used as the extinction coefficient β in Equation (3), and the empirical formula proposed by Kunkel is generally adopted to calculate [64]:
β = 144.7   LWC   0.88
where LWC is the liquid water content. The visibility distribution obtained by this method is proved to be in good agreement with the actual fog area [67].

2.4. Processing of Comprehensive Risk Indicators

We take sea ice, wind, visibility, temperature, and water depth as the comprehensive risk indicators for ships navigating in the Northwest Passage. The risk value is calculated by weighted comprehensive assessment method, specifically:
C = i = 1 n W i X i
where C represents the comprehensive value; X i and W i are the standardized value and weight of risk indicator i, respectively; and n is the number of indicators. As different risk indicators have different dimensions, the min–max normalization method is adopted to normalize the data. According to the risk value from the lowest to the highest, we set the RIO value of the sea-ice indicator range from 0 to −20, and the value of the water depth indicator range from 50 to 0. The risk values of wind, visibility, and temperature fall within the range of 0–1, so no further processing is required. In determining the weight of each indicator, we adopted the result of Wang et al. [60], which is obtained by quantitative comparison of the weight of empirical judgments given by experts through the improved grey correlation method, as shown in Table 2.

3. Results

3.1. Sea-Ice Risk Changes across the Northwest Passage in 1979–2019

To analyze the sea-ice risk, we considered two different classes of ship: Open Water ships (OW; no ice-breaking capability), typically general merchant ships and private yachts; and Category A Polar Class 6 ships (PC6; summer/autumn operation in medium first-year ice which may include old ice inclusions), for example, individual polar research ships and advanced bulk carriers. While the sea-ice risk area of the NWP estimated from the Canadian Ice Service Digital Archive (CISDA) dataset shows a significant decline over the past four decades (Figure 2), the risks faced by ships still vary obviously according to the navigation route and ship classes. During the summer and autumn, the sea-ice risk area along the two main NWP routes, the northern route and the southern route (Figure A1), decreased by an average of 646   ±   170 km2 year−1 and 1231   ±   260 km2 year−1 for OW ships, 1192   ±   280 km2 year−1 and 1238   ±   220 km2 year−1 for PC6 ships, respectively. The risk decline rate of PC6 ships on the northern route is more dramatic than that of OW ships, while the risk decline rate on the southern route is basically the same for the two classes of ships. This difference is primarily related to the predominant ice type along the route. Multi-year ice typically flows into the Western Parry Channel through M’Clure Strait and the Queen Elizabeth Islands [24,25,26], thus the presence of large amounts of old ice on the northern route. These old ices that survived at least one summer’s melt may be subdivided into second-year ice and multi-year ice, and their thickness is usually 2 to more than 3 m. As the old ice in the channel is shrinking under the intensification of global warming, part of the waters along the northern route has gradually met the operating conditions for ships with higher ice-breaking classes, but for non-ice-strengthened ships, the ice in the waters needs to be almost gone before navigation. Similarly, the sea-ice risk of the southern route shows a greater monthly uncertainty because the southern route is dominated by new ice or first-year ice that grows for no more than one winter. The thickness of this ice type is usually only 30 cm to more than 1.2 m; thus, the ice on the southern route easily melts completely in summer or regrows in the fall, changing rapidly from month to month.
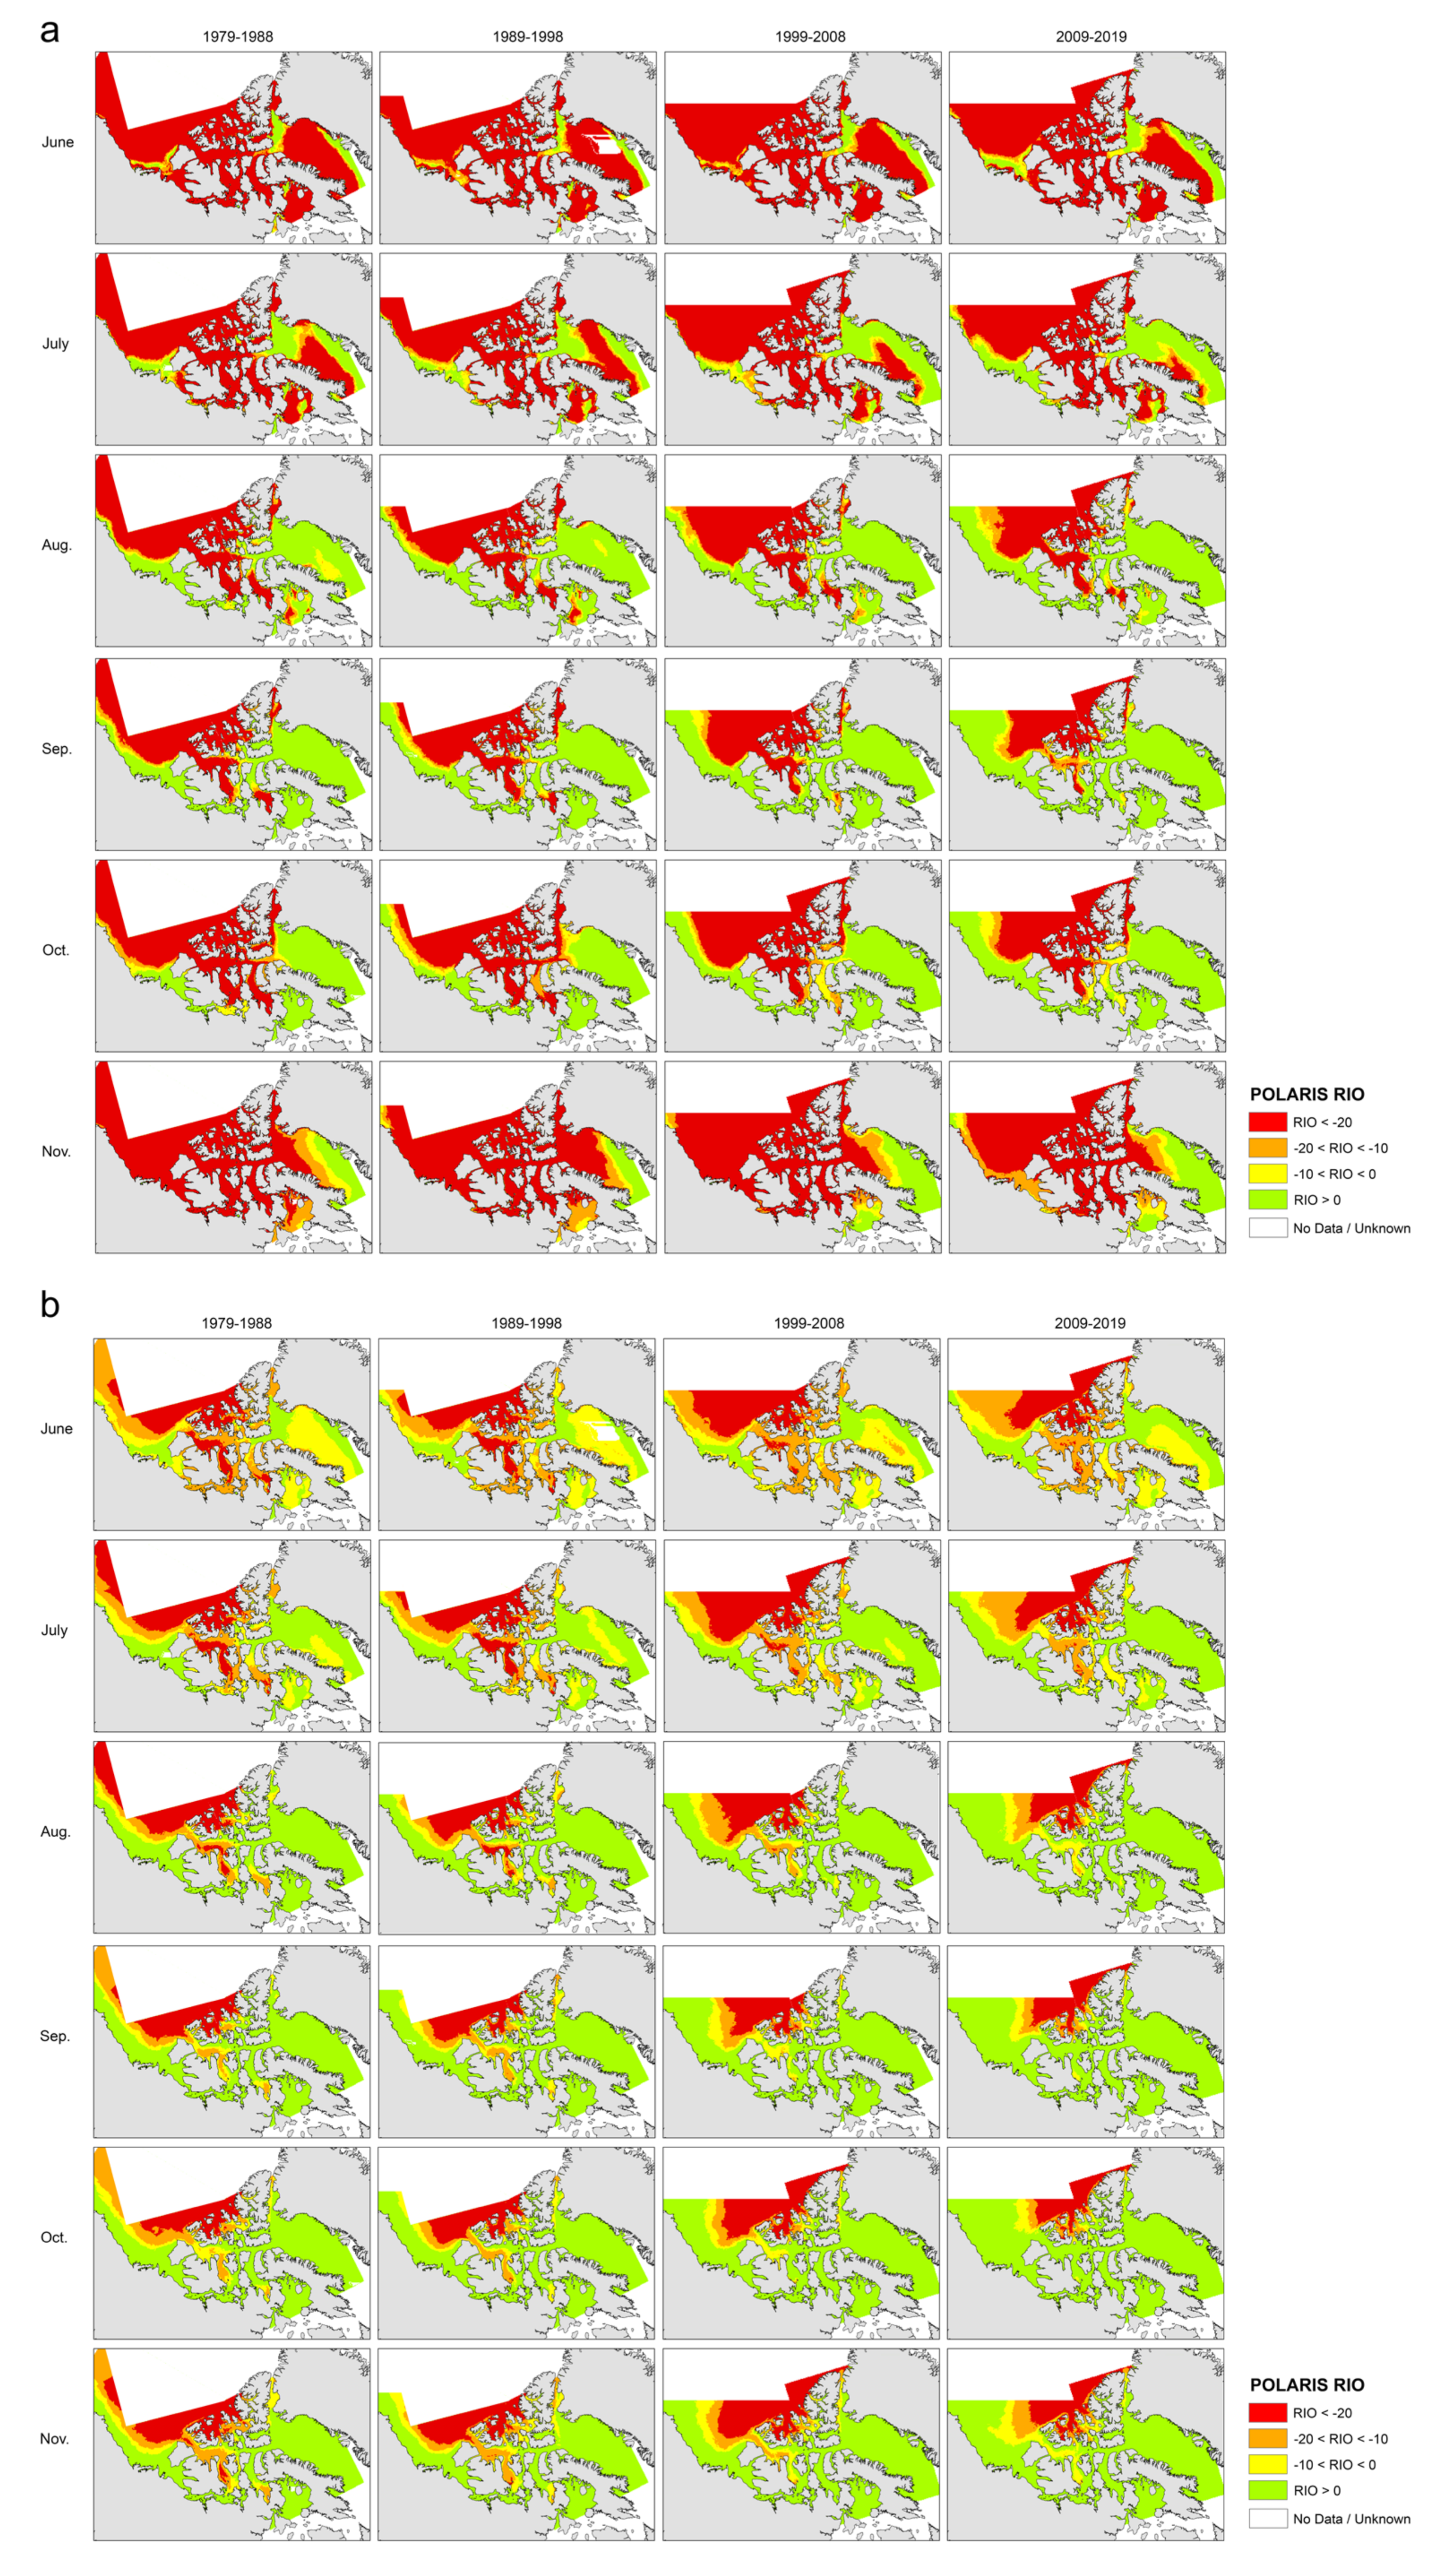
The spatial distribution of sea-ice risk grades also differs drastically between the two types of ships (Figure 3). For ship class OW (Figure 3a), the NWP is far from being a stable route. The September average status of the southern route over the last two decades indicates that it is likely to become fully navigable, depending on the condition of key sea-ice risk regions such as the Barrow Strait and Victoria Strait in the specific year. The northern route remains an impossibility for the OW ships to navigate alone, despite its sea-ice risk grade being notably down in September of the last decade. However, the sea-ice risk experiences a more striking downgrade for PC6 ships (Figure 3b), especially in the fall. This change has reduced the navigate status of PC6 ships on the Western Parry Channel of the northern route from risky to operational in September and October, which is an average for the last decade but unprecedented in history. The southern route appears to have become a sea-ice-risk-free route for ship class PC6 from August to November, although the consumption of ship oil during the ice-breaking process is a consideration. Another effect of a ship’s ice-breaking class is seen in the seaworthiness months. The order of favorable sailing months for OW ships in summer and autumn is September > August > October > July > June > November, while for PC6 ships, it is September > October > November > August > July > June. Yet, even if OW ships sail in September, the risk is much higher than that of PC6 ships sailing from August to November. Setting aside these differences, what can be jointly confirmed is that the M’Clure Strait, Viscount Melville Sound, and M’Clintock Strait are generally the riskiest sections of the NWP, regardless of ship class.

3.2. Impacts and Trends of the Meteorological Risks

Adverse weather conditions may bring additional operational difficulties and hazards to ships but are often ignored. Meteorological risks are mainly manifested in three categories: strong wind, low visibility, and low temperature. We used the ERA5 dataset to investigate the frequency of the three risks from 1979 to 2019 and assess their impacts on ship navigation in the NWP (Figure 4). Low visibility and low temperature appear to be the most significant weather hazards affecting navigation during the summer and autumn. There is a greater-than-50% chance of low visibility throughout the northern route and the Peel Sound to Victoria Strait of the southern route, where sea ice is also predominantly found; low temperature occurs much more frequently and covers almost the entire CAA area, with only the section from the Amundsen Gulf to Coronation Gulf having a relatively suitable condition; the risk from strong wind is milder, with the most likely locations being Lancaster Sound and the Amundsen Gulf. However, there is a slight upward trend in wind frequency over Lancaster Sound and the section from Coronation Gulf to Queen Maud Gulf. Conversely, the frequency of low visibility is characterized by a downward trend from the Dolphin and the Union Strait to Larsen Sound. The frequency of low temperature in the NWP is undoubtedly declining with global warming, except for a small portion of Viscount Melville Sound on the northern route where no trend is evident.
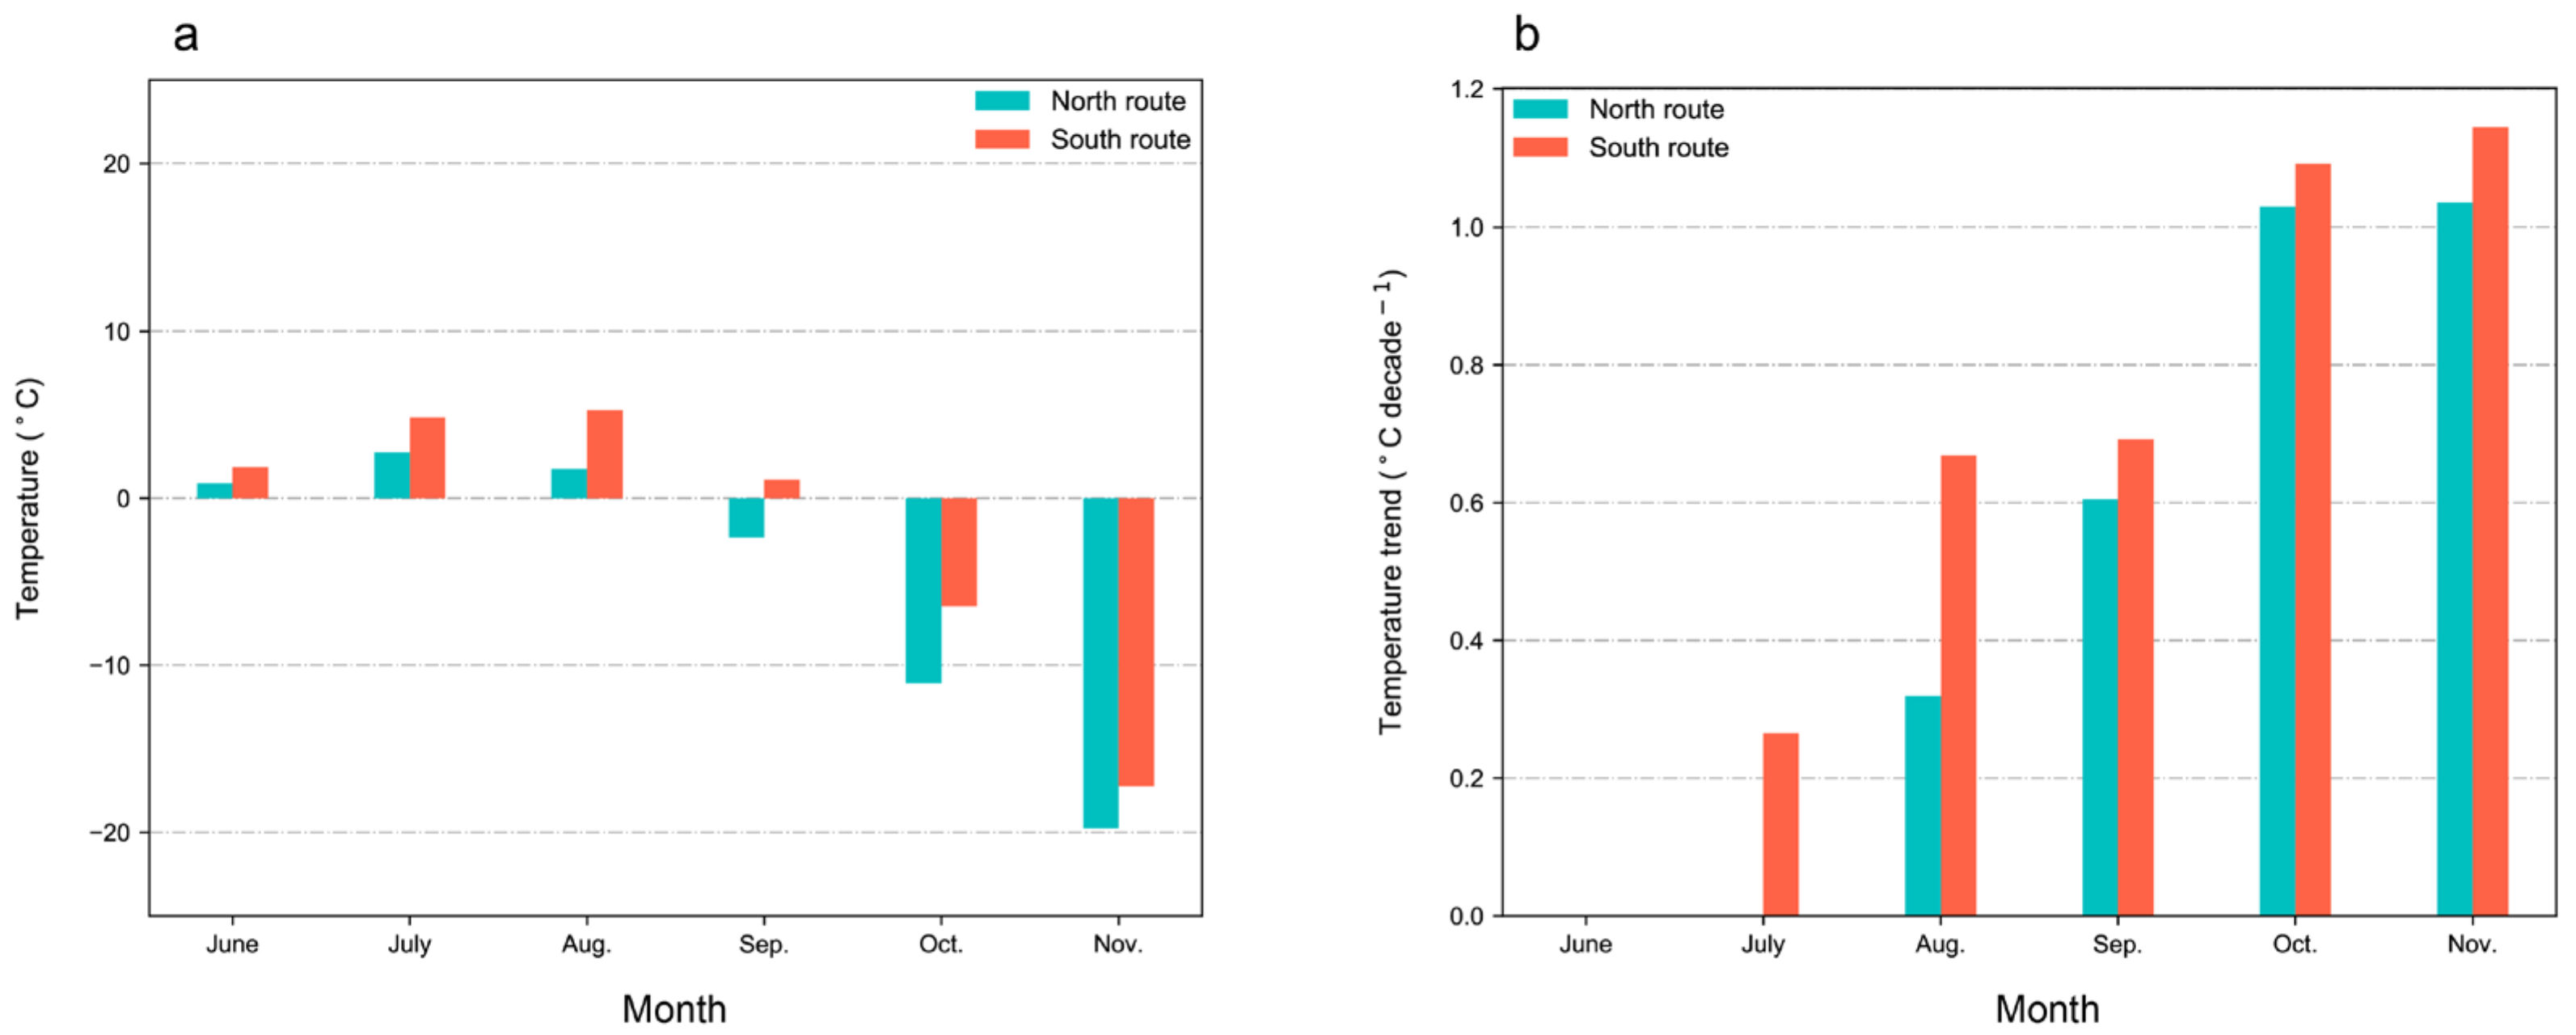
Furthermore, the wind speed and visibility are regarded as important meteorological conditions that restrict ship piloting operations [30,31]. In combination with the grades and corresponding frequencies of the two meteorological risks, the changes in pilotage conditions on the northern route and the southern route of the NWP in each month during 1979–2019 are investigated (Figure 5). In general, the northern route is almost calm from June to August and October with no obvious trend of pilotage risk change, whereas September and November show a significant downward and upward trend, respectively. The situation on the southern route is similar, although the overall risk value is slightly lower than that of the northern route, and additionally with a clear downward trend in October. July and August, however, have the most agreeable temperatures, while October and November are much colder than June to September but show stronger warming rates (Figure 6).

3.3. Comprehensive Risk Assessment

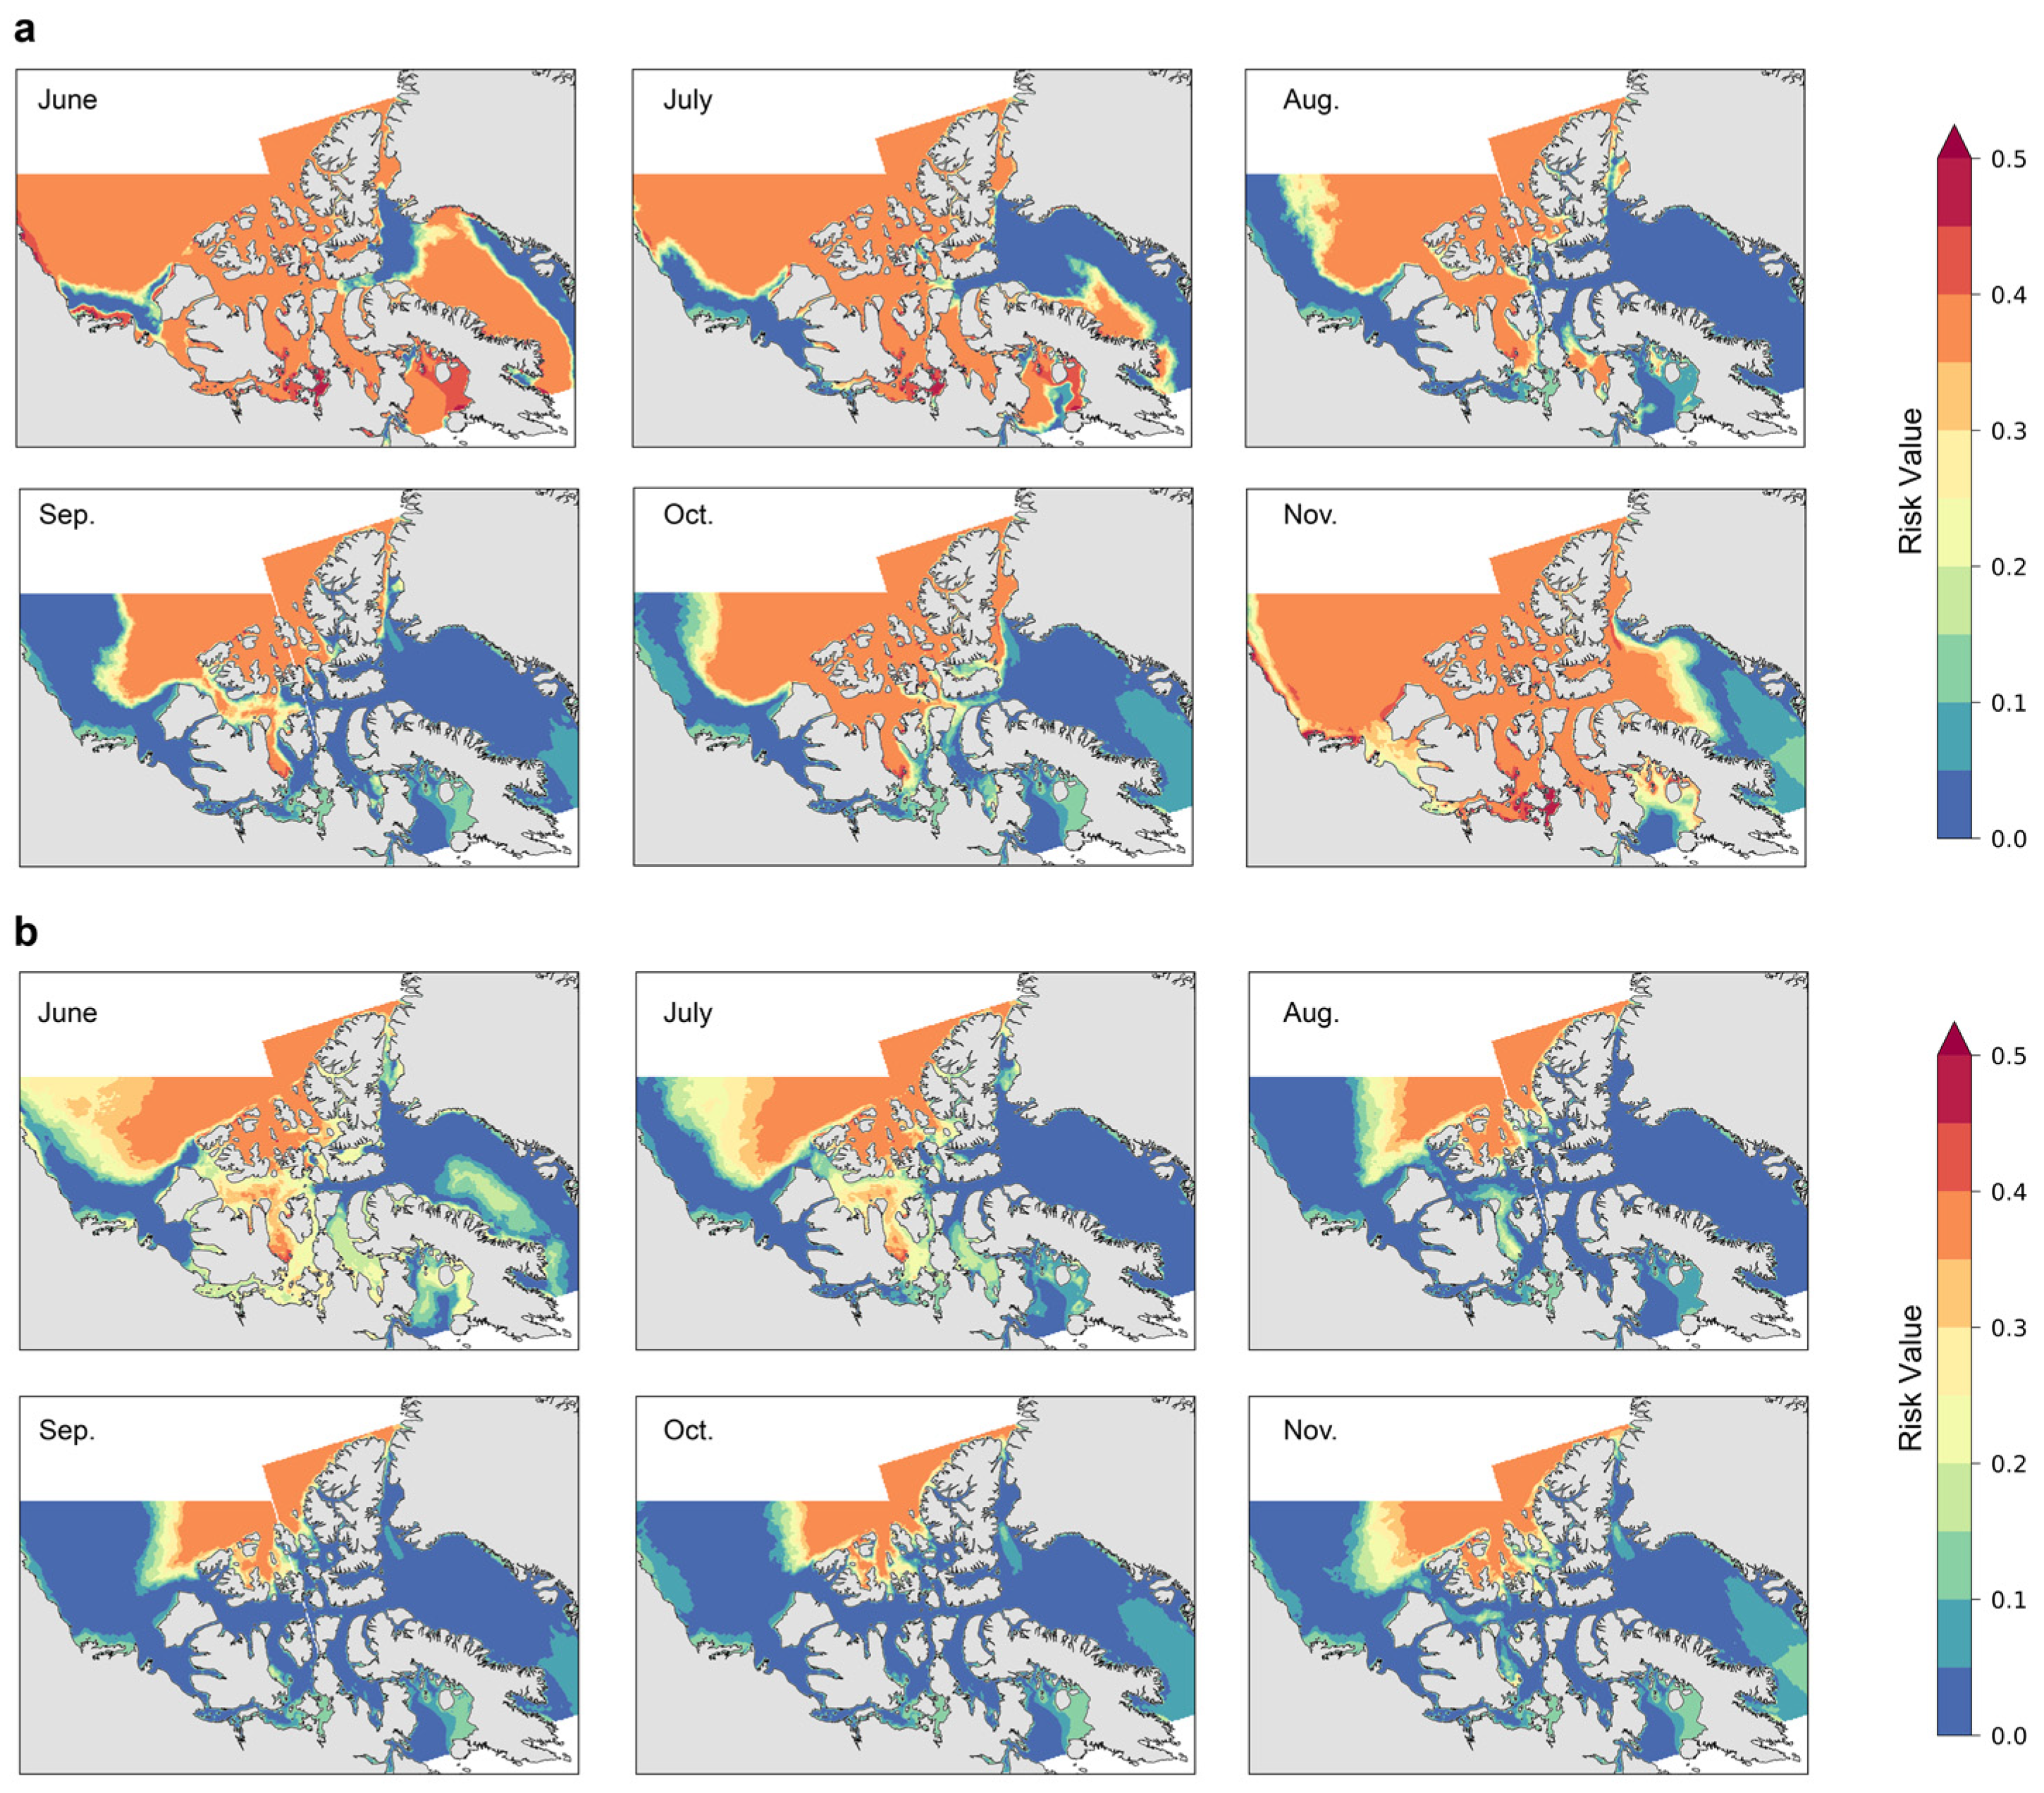
Understanding the current comprehensive risk distribution of the NWP under the influence of various risks is crucial for ships to choose the appropriate navigation month and route, which is also an assessment of the contribution of individual risk factors. The combination of five risk components (sea ice, wind, visibility, temperature, and water depth) provides maps of the comprehensive risk for the NWP in the period 2009–2019 (Figure 7). In the main, the spatial pattern of comprehensive risk matches the spatial distribution of the sea-ice risk, except for several segments. These segments at higher risk than the nearby area are basically located on the southern route, where shoals and rocks limit the draft of ships to less than 10 m [4], typically from James Ross Strait to Simpson Strait and the eastern entrance of the Dolphin and Union Strait. In June, July, and November, the shallow water legs mixed with sea ice can become the riskiest parts of the NWP for OW ships, though the southern route remains the safest overall in other months with less sea ice. For the ship class PC6, the Parry Channel in September and October exhibits a very low risk. As the most direct route through the NWP and with no channel draft restrictions, the northern route seemed to be a better choice for the PC6 ships during this time than the meandering southern route. All meteorological risks have no discernible distribution characteristics in the risk maps, indicating that they do not contribute much to the comprehensive risk of ship navigation.

3.4. Projected Changes in Sea-Ice Risk and the Navigable Days

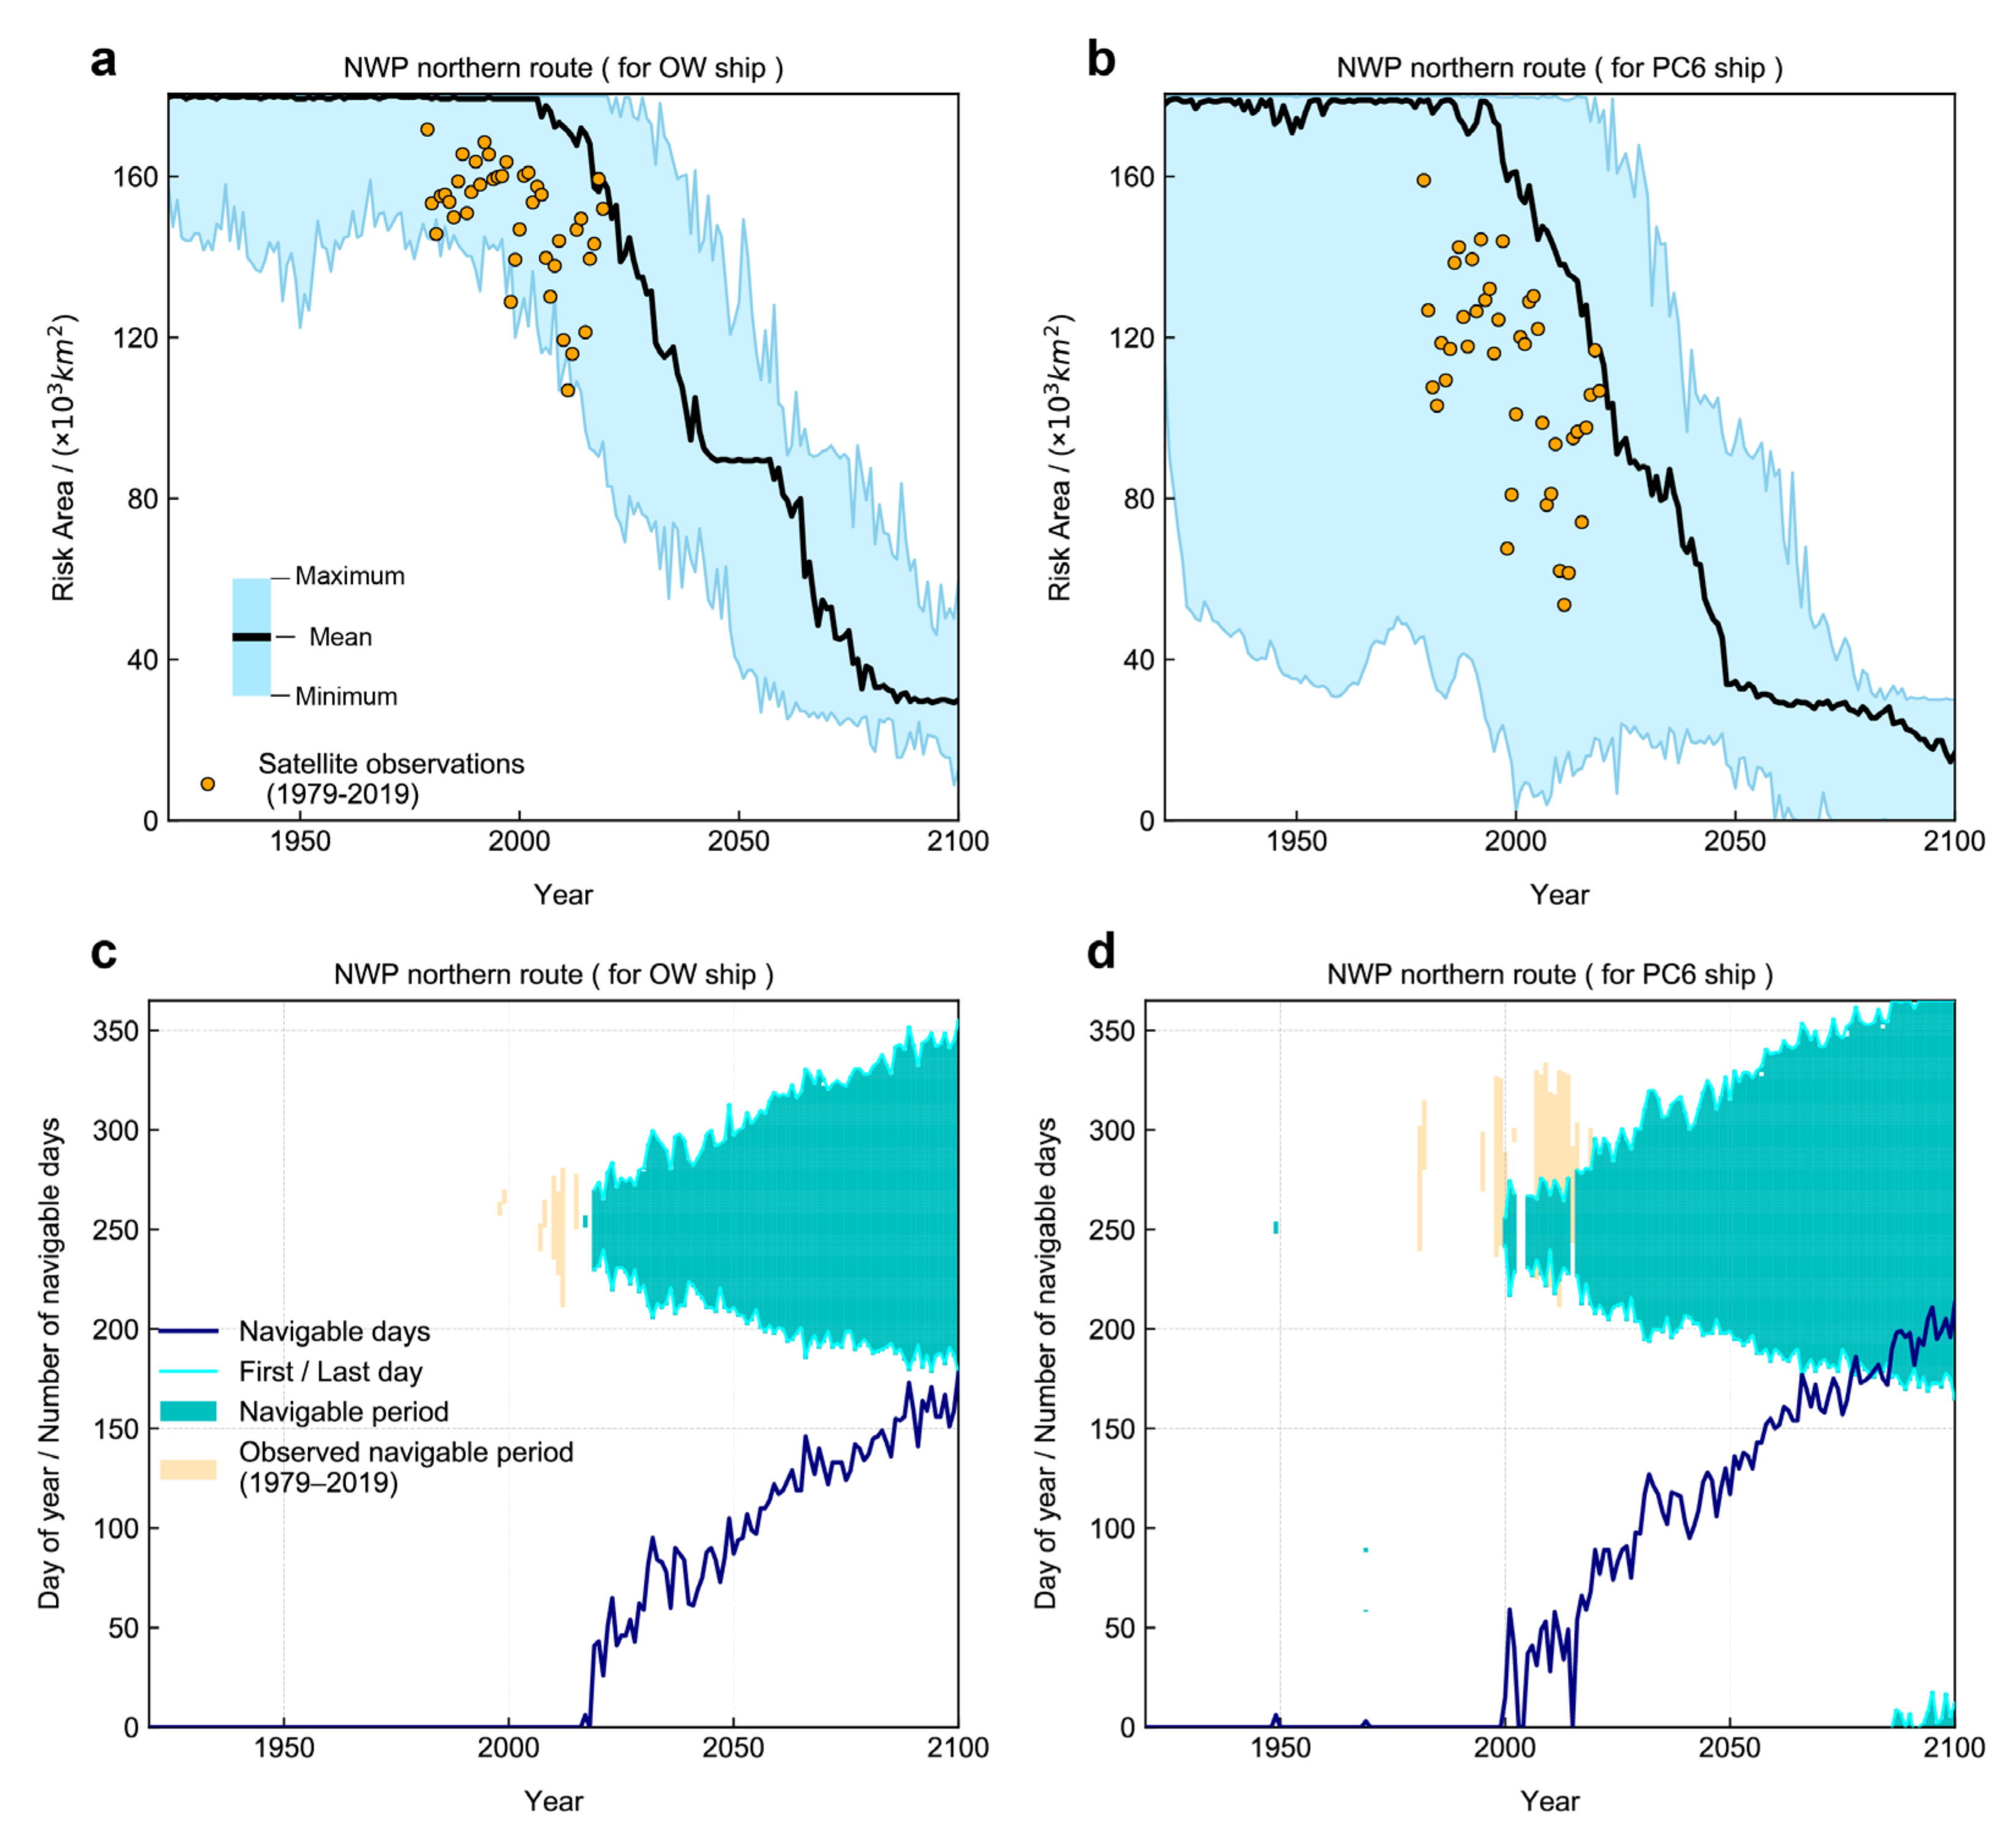
The comprehensive risk maps illustrate the fact that sea ice plays a dominant role in the navigation risk, while meteorological events (including strong wind, low visibility, and low temperatures) have a limited impact. If the depth of the channel is considered to be constant, the northern route with a shorter distance and deeper water certainly has greater shipping potential than the southern route. However, the sea ice on the northern route remains a problem, and its future changes in sea-ice risk and navigability need further consideration. We use the CESM-LE, a publicly available climate model ensemble, to project changes in the sea-ice risk as well as navigable days of the northern route over the period 1920–2100 (Figure 8). Projections show a precipitous decline in the monthly mean sea-ice risk during the summer and fall for the northern route since the 21st century (Figure 8a,b). By 2050, the sea-ice risk of the northern route will be steadily lower than any extreme light ice year observed historically, whether for the ship class OW or PC6, allowing the NWP to potentially enter a new period of trade traffic. After 2050, the northern route appears to have reached a more ideal navigable state for PC6 ships as the sea-ice risk declines slowly, while for OW ships, it will take until about 2080 to reach such a navigation state. Predictions nonetheless seem conservative; the new period is likely to arrive early since all current observations are below the model ensemble mean values, indicating that the actual sea-ice risk decline may be more severe than projected. Models tend to overestimate the historical thickness of multi-year ice [68,69,70] and the RCP 8.5 forcing slightly underestimates the observed emissions [71], resulting in the CESM-LE underestimating the sensitivity of sea ice to global warming. However, it also provides evidence that the projected future downward trend of sea-ice risk along the northern route is reasonable.
Decreased sea-ice risk is bound to support a longer navigable season length, and probably keep the shipping period beyond summer and autumn. Evolutions of the projected navigability of the northern route for two classes of ships in the ensemble average state are shown in Figure 8c,d. Projections indicate that the navigable season for PC6 ships starts and expands from around 2000, and from about 2019 for OW ships. Although the initial navigable period of the northern route is considerably short, usually in September (the 244th to the 273rd days of year), the expansion of the navigable period is almost linear. By 2050, the navigable days in the northern route are projected to increase by about 50 days for OW ships, and by about 80 days for PC6 ships compared to the initial season length. This increase will continue to 2100, when the navigable time of the northern route for OW ships is advanced to July until December, nearly half a year. For PC6 ships, the navigable period will reach up to about 200 days, starting in June and lasting to January of the following year. While the navigability of the northern route differs drastically between the two ship classes, the rates of the projected increase in navigable conditions are approximately the same, with ~1.57 d year−1 for class OW and ~1.58 d year−1 for class PC6. Similar to the sea-ice risk, the projected increase in the navigable period is conservative. The first navigable year observed of the northern route is much earlier than projected for both OW and PC6 ships, and the navigable period is also longer. A larger difference between the observations and projections is found for ship class PC6, as the navigability in autumn is much better than expected. However, observations indicate that the current navigability of the northern route remains unstable and irregular (Figure 8c,d) as recently as 2017 and 2018, for example, when even PC6 ships seem to have no navigable periods.

4. Discussion

In a warming climate, the NWP could change the world’s maritime transport landscape. However, its special geographical location makes it difficult to guarantee the safety of navigation. Understanding the response of navigation risk to rapid climate change is essential for the sustainable utilization and development of the NWP. First of all, sea ice is the principal risk that ships need to consider in the NWP, and this risk is closely related to the class of the navigating ship. Generally speaking, higher-class ships face less risk under the same ice conditions. However, due to the differences in sea-ice type of route channels, ships of various classes respond differently to changes in sea-ice risk. For example, while the sea-ice risk for both OW and PC6 ships in the northern route of the NWP has decreased over the past 40 years (Figure 2), the risk for class PC6 has declined significantly faster. Moreover, the ship class also changes the seaworthy months. In addition to the common best September, the second seaworthy month is August for OW ships and October for PC6 ships. While the trends of sea-ice concentration and thickness seem to indicate less of a need for ice-breaking support in the Arctic region [1,8,9,10], the unpredictable first-year ice and the inflowing multi-year ice in the NWP are prone to forming ice floes or blockages, making navigation dangerous for ordinary ships. Considering the icebreaker services in the NWP are extremely poor both in quantity and quality compared to those offered by Russia in the Northern Sea Route [72], at least for the present, it remains necessary for transport agencies to upgrade ships in the NWP, which can not only greatly reduce the sea-ice risk to navigation but also extend the navigable season length of ships.
Apart from sea ice, other risks such as low temperature, strong wind, and low visibility are not negligible. Such risks usually occur suddenly but last for a short duration, which requires the ship pilots to have the experience and ability to deal with them and be fully prepared. Much of the NWP remains below 0 °C for most of the time in summer and autumn; however, temperatures on both northern and southern routes have risen rapidly in the past few decades, and the last decade has seen more favorable temperatures in summer. In autumn, when sea-ice conditions are more seaworthy, ships and crews would still have to deal with the operational difficulties and instrument failures that may be caused by low temperature. The frequency of low visibility is also quite high in the summer and fall across the NWP, especially in the northern route, which is consistent with the station observations (Figure 1) that the occurrence of fog events peaks during the warm season from May to September and the Resolute Station in the northern route is more frequent than other region stations [73]. Hopefully, the frequency of low visibility risk in the NWP area is decreasing, mainly on the southern route, but the trend is less pronounced in the segment with its own high-risk frequency. The strong wind poses a much smaller threat to navigation, at least in terms of frequency. Even so, Lancaster Sound and Amundsen Gulf are among the areas most vulnerable to winds, and with a slight upward trend in risk frequency, it possibly due to the Beaufort Gyre and the sea level differences at both ends of passage [74]. The pilotage risk, which combined the intensity and the corresponding frequency of strong wind and low visibility, showed the strongest downward trend and upward trend in September and November, respectively. There are many reasons for the trends of pilotage risk associated with fog and wind; a detailed analysis would take much work and effort. In any case, despite pilotage conditions appearing to be improving in September, it could still be risky for ships to navigate without stable and effective management coordination.
The distribution of comprehensive risk in the NWP is largely dominated by sea ice (Figure 7). As a result, the southern route with less sea ice is relatively safe and reliable, and even OW ships have a navigable period in September. The fly in the ointment is that ships passing by the southern route are limited by the depth of draft coupled with the route being too sinuous, so it is more profitable to take the northern route, the most direct route through the NWP, if the sea-ice risk is ignored. However, the northern route is only open in September and October, even for PC6 ships, and it is not stable enough. This situation is likely to improve in the future, as the sea-ice risk on the northern route is expected to continue to decline sharply, leading to a significant increase in navigable days. Specifically, an additional 50 days of navigable time can be gained for OW ships and 80 days for PC6 ships on the northern route by 2050; moreover, the navigable period could be from June to January of the following year for PC6 ships by 2100 (Figure 8). New questions may then be raised as to whether the entire northern route may be able to support huge numbers of ships passing through it and become a seasonal regular route in the future. This is disconcerting because the route is too close to the north-facing coast of the CAA, where the oldest and thickest sea ice in the world lies, even when most of the Arctic Ocean is free of sea ice [75]. There is no guarantee that the old ice will never drift into the passage, as this would require anomalous atmospheric circulation to form an obstacle [76]. Therefore, there is a need for icebreakers to provide timely support on the northern route.
An economic analysis of container shipping through NWP concluded that NWP has an advantage over the traditional and well-established Panama Canal, which depends on its toll fee [3]. Other types of ships, such as passenger ships for tourism, oil/fuel tankers, drill ships, scientific research ships, and so on are taking advantage of the specific route, which is likely to bring direct economic benefits and development to the surrounding communities. Of course, the benefits of the community at the same time assume the responsibility of shipping and share in the risk. Our research shows that the vast majority of CAA waters are fraught with natural risks. It is necessary to strengthen the resupply capacity of the NWP community and improve the infrastructure and real-time information provision to respond to collisions or instrument failures in the event of adverse weather. Turning risk into an available energy resource is also an option [77], for example, by using wind power from Lancaster Sound and Amundsen Gulf. In addition, the total number of available ice-breaking assets is negatively impacting the level of support by the marine transportation system of Canada [72], which is also an area in which efforts need to be accelerated, particularly for the northern route. Given that the projected increase in the navigable period is conservative and considering the lengthy acquisition and production process required for new ice-breaking fleets of Canada, ice-breaking resources in the NWP may not be able to meet the expected demand in the near future. This is certainly a blow to commercial shipping in the NWP, as container shipping is typically a liner service with a pre-determined schedule (e.g., one port call every week), and the strong inter-annual variability of the current NWP sea ice without adequate ice-breaking support compromises the predictability and reliability of this service; hence, it is unlikely that container shipping would be diverted to the Arctic any time soon; rather, tramp services would go first. Assuming that the NWP does not have mature waterway facilities and management until the Arctic sea ice coverage retreats further in summer and autumn, considering its risks and practical benefits, it will presumably be replaced by the Transpolar Sea Route (TSR) [78,79]. If there is now an economically viable plan for completing seasonal commercial traffic on the NWP, it could be tried first on the less risky and more navigable southern route.
The Arctic presents an investment opportunity for many countries to boost their strategic and economic importance and even their international status, with Russia, the US, Canada, Denmark, and Norway all trying to assert jurisdiction over parts of the Arctic. The Arctic Archipelago area of the NWP is considered by Canada to be its internal waters and should be provided with the right to prohibit transit of ships [3], while the United States and a number of countries in the European Union regard the NWP as an international strait according to the United Nations Law of the Sea Convention [80]. This puts the NWP in a political stance and causes resource-allocation disputes. Meanwhile, biological survival, environmental pollution, and other sustainability problems that may be caused by commercial transportation have also triggered scientific discussions [78,81]. Although the number of ships navigating the NWP is not large enough to have a direct and serious impact on the marine and atmospheric environment in the Arctic region at present, the mobility of the marine and atmospheric environment increases the potential for regional pollution from ships. All these issues have brought considerable uncertainty to the future development of the NWP and surrounding communities. Our work aims to provide information on the risks associated with ship navigation in the NWP, help enhance maritime safety and reduce environmental risks, and provide additional support for development policy formulation and waterway facility construction in surrounding communities to refer to. Although the full utilization of the NWP is still facing difficulties, we should prepare for the emergence of new trade route corridors in the face of rapidly advancing climate change.

Author Contributions

Conceptualization, C.W. and M.D.; methodology, C.W., T.W. and M.D.; software, C.W.; validation, C.W., Y.Y. and M.D.; investigation, C.W., M.D. and T.D.; resources, C.W. and T.D.; data curation, C.W.; writing—original draft preparation, C.W.; writing—review and editing, C.W., M.D., Y.Y., T.W.; visualization, C.W.; supervision, M.D.; project administration, M.D.; funding acquisition, M.D. All authors have read and agreed to the published version of the manuscript.

Funding

This study is supported by the National Key Research and Development Program of China (2018YFC1406103), National Science Fund of China (42122047) and Basic Fund of CAMS (2021Z006).

Data Availability Statement

This study is used publicly available datasets. The CISDA data are available at https://iceweb1.cis.ec.gc.ca/ (accessed on 1 November 2020), ERA5 reanalysis data are available at https://cds.climate.copernicus.eu/ (accessed on 6 April 2021), ETOPO1 data are available at https://www.ngdc.noaa.gov/ (accessed on 4 January 2020) and CESM-LE data are available at https://www.cesm.ucar.edu/ (accessed on 25 September 2020).

Conflicts of Interest

The authors declare no conflict of interest.

Appendix A

Figure A1. The Northwest Passage shipping regions. Including two main route regions, the northern route (blue) and the southern route (green).
Sustainability 14 05591 g0a1

References

  1. Comiso, J.C.; Parkinson, C.L.; Gersten, R.; Stock, L. Accelerated decline in the Arctic sea ice cover. Geophys. Res. Lett. 2008, 35, L01703. [Google Scholar] [CrossRef] [Green Version]
  2. Somanathan, S.; Flynn, P.; Szymanski, J. The northwest passage: A simulation. Transp. Res. Part A Policy Pract. 2009, 43, 127–135. [Google Scholar] [CrossRef]
  3. Lu, D.; Park, G.K.; Choi, K.; Oh, S. An economic analysis of container shipping through Canadian Northwest Passage. Int. J. e-Navig. Marit. Econ. 2014, 1, 60–72. [Google Scholar] [CrossRef] [Green Version]
  4. Arctic Council. Arctic Marine Shipping Assessment 2009 Report. Arctic Council, 2009; pp. 20–24. Available online: https://www.pmel.noaa.gov/arctic-zone/detect/documents/AMSA_2009_Report_2nd_print.pdf (accessed on 1 August 2019).
  5. Intergovernmental Panel on Climate Change. Global Warming of 1.5_C. An IPCC Special Report; Intergovernmental Panel on Climate Change: Geneva, Switzerland, 2018; Available online: https://www.ipcc.ch/sr15/ (accessed on 5 September 2021).
  6. Cohen, J.; Screen, J.A.; Furtado, J.C.; Barlow, M.; Whittleston, D.; Coumou, D.; Francis, J.; Dethloff, K.; Entekhabi, D.; Overland, J.; et al. Recent Arctic amplification and extreme mid-latitude weather. Nat. Geosci. 2014, 7, 627–637. [Google Scholar] [CrossRef] [Green Version]
  7. Screen, J.A.; Simmonds, I. The central role of diminishing sea ice in recent Arctic temperature amplification. Nature 2010, 464, 1334–1337. [Google Scholar] [CrossRef] [Green Version]
  8. Stroeve, J.; Holland, M.M.; Meier, W.; Scambos, T.; Serreze, M. Arctic sea ice decline: Faster than forecast. Geophys. Res. Lett. 2007, 34, L09501. [Google Scholar] [CrossRef]
  9. Lindsay, R.; Schweiger, A. Arctic sea ice thickness loss determined using subsurface, aircraft, and satellite observations. Cryosphere 2015, 9, 269–283. [Google Scholar] [CrossRef] [Green Version]
  10. Kwok, R. Arctic sea ice thickness, volume, and multiyear ice coverage: Losses and coupled variability (1958–2018). Environ. Res. Lett. 2018, 13, 105005. [Google Scholar] [CrossRef]
  11. Barnhart, K.R.; Miller, C.R.; Overeem, I.; Kay, J.E. Mapping the future expansion of Arctic open water. Nat. Clim. Chang. 2016, 6, 280–285. [Google Scholar] [CrossRef]
  12. Smith, L.C.; Stephenson, S.R. New Trans-Arctic shipping routes navigable by midcentury. Proc. Natl. Acad. Sci. USA 2013, 110, E1191–E1195. [Google Scholar] [CrossRef] [Green Version]
  13. Khon, V.C.; Mokhov, I.; Latif, M.; Semenov, V.; Park, W. Perspectives of Northern Sea Route and Northwest Passage in the twenty-first century. Clim. Chang. 2010, 100, 757–768. [Google Scholar] [CrossRef]
  14. Borgerson, S.G. Arctic meltdown-The economic and security implications of global warming. Foreign Aff. 2008, 87, 63. [Google Scholar]
  15. Tivy, A.; Howell, S.E.L.; Alt, B.; McCourt, S.; Chagnon, R.; Crocker, G.; Carrieres, T.; Yackel, J.J. Trends and variability in summer sea ice cover in the Canadian Arctic based on the Canadian Ice Service Digital Archive, 1960–2008 and 1968–2008. J. Geophys. Res. Ocean. 2011, 116, C03007. [Google Scholar] [CrossRef] [Green Version]
  16. Sou, T.; Flato, G. Sea ice in the Canadian Arctic Archipelago: Modeling the past (1950–2004) and the future (2041–60). J. Clim. 2009, 22, 2181–2198. [Google Scholar] [CrossRef]
  17. Pizzolato, L.; Howell, S.E.; Dawson, J.; Laliberté, F.; Copland, L. The influence of declining sea ice on shipping activity in the Canadian Arctic. Geophys. Res. Lett. 2016, 43, 12–146. [Google Scholar] [CrossRef]
  18. Dawson, J.; Pizzolato, L.; Howell, S.E.; Copland, L.; Johnston, M.E. Temporal and spatial patterns of ship traffic in the Canadian Arctic from 1990 to 2015. Arctic 2018, 71, 15–26. [Google Scholar] [CrossRef] [Green Version]
  19. Pizzolato, L.; Howell, S.E.; Derksen, C.; Dawson, J.; Copland, L. Changing sea ice conditions and marine transportation activity in Canadian Arctic waters between 1990 and 2012. Clim. Chang. 2014, 123, 161–173. [Google Scholar] [CrossRef]
  20. Haas, C.; Howell, S.E. Ice thickness in the Northwest Passage. Geophys. Res. Lett. 2015, 42, 7673–7680. [Google Scholar] [CrossRef]
  21. Howell, S.E.; Tivy, A.; Yackel, J.J.; Scharien, R.K. Application of a SeaWinds/QuikSCAT sea ice melt algorithm for assessing melt dynamics in the Canadian Arctic Archipelago. J. Geophys. Res. Ocean. 2006, 111, C07025. [Google Scholar] [CrossRef]
  22. Howell, S.E.; Tivy, A.; Yackel, J.J.; Else, B.G.; Duguay, C.R. Changing sea ice melt parameters in the Canadian Arctic Archipelago: Implications for the future presence of multiyear ice. J. Geophys. Res. Ocean. 2008, 113, C09030. [Google Scholar] [CrossRef] [Green Version]
  23. Howell, S.E.; Duguay, C.R.; Markus, T. Sea ice conditions and melt season duration variability within the Canadian Arctic Archipelago: 1979–2008. Geophys. Res. Lett. 2009, 36, L10502. [Google Scholar] [CrossRef]
  24. Howell, S.E.; Tivy, A.; Yackel, J.J.; McCourt, S. Multi-year sea-ice conditions in the western Canadian arctic archipelago region of the northwest passage: 1968–2006. Atmos. Ocean. 2008, 46, 229–242. [Google Scholar] [CrossRef]
  25. Kwok, R. Exchange of sea ice between the Arctic Ocean and the Canadian Arctic Archipelago. Geophys. Res. Lett. 2006, 33, L16501. [Google Scholar] [CrossRef] [Green Version]
  26. Wohlleben, T.; Howell, S.E.; Agnew, T.; Komarov, A. Sea-Ice Motion and Flux within the Prince Gustaf Adolf Sea, Queen Elizabeth Islands, Canada during 2010. Atmos. Ocean. 2013, 51, 1–17. [Google Scholar] [CrossRef]
  27. Howell, S.E.; Wohlleben, T.; Dabboor, M.; Derksen, C.; Komarov, A.; Pizzolato, L. Recent changes in the exchange of sea ice between the Arctic Ocean and the Canadian Arctic Archipelago. J. Geophys. Res. Ocean. 2013, 118, 3595–3607. [Google Scholar] [CrossRef]
  28. Fu, S.; Zhang, D.; Zhang, M.; Yan, X. Identification of environmental risk influencing factors for ship operations in arctic waters. J. Harbin Eng. Univ. 2017, 038, 1682–1688. [Google Scholar]
  29. Li, Z.F.; Liu, B.H.; Xu, M.Q. An Evaluation of the Arctic Route’s Navigation Environment. Adv. Mater. Res. 2012, 518, 1101–1108. [Google Scholar] [CrossRef]
  30. Balmat, J.F.; Lafont, F.; Maifret, R.; Pessel, N. MAritime RISk Assessment (MARISA), a fuzzy approach to define an individual ship risk factor. Ocean. Eng. 2009, 36, 1278–1286. [Google Scholar] [CrossRef]
  31. Ding, F.; Liu, F.; Zhang, J.; Sun, Z. Risk level grading for ship pilotage based on weather conditions. Navig. China 2019, 42, 71–74. [Google Scholar]
  32. Danard, M.; Munro, A.; Murty, T. Storm surge hazard in Canada. Nat. Hazards 2003, 28, 407–434. [Google Scholar] [CrossRef]
  33. Chauvin, C.; Lardjane, S.; Morel, G.; Clostermann, J.P.; Langard, B. Human and organisational factors in maritime accidents: Analysis of collisions at sea using the HFACS. Accid. Anal. Prev. 2013, 59, 26–37. [Google Scholar] [CrossRef] [PubMed]
  34. Transportation Safety Board of Canada. Statistical Summary: Marine Transportation Occurrences in 2020. 2020. Available online: https://www.bst-tsb.gc.ca/eng/stats/marine/2020/ssem-ssmo-2020.pdf (accessed on 3 January 2022).
  35. Koetse, M.J.; Rietveld, P. The impact of climate change and weather on transport: An overview of empirical findings. Transp. Res. Part D Transp. Environ. 2009, 14, 205–221. [Google Scholar] [CrossRef]
  36. Wells, P.G. The iconic Torrey Canyon oil spill of 1967-Marking its legacy. Mar. Pollut. Bull. 2017, 115, 1–2. [Google Scholar] [CrossRef] [PubMed]
  37. Marchenko, N.; Borch, O.J.; Markov, S.V.; Andreassen, N. Maritime activity in the high north-The range of unwanted incidents and risk patterns. POAC 2015, 15, 14–18. [Google Scholar]
  38. Marchenko, N.A.; Borch, O.J.; Markov, S.V.; Andreassen, N. Maritime safety in the High North–risk and preparedness. In Proceedings of the 26th International Ocean and Polar Engineering Conference, Rhodes, Greece, 26 June–2 July 2016. [Google Scholar]
  39. Marchenko, N.; Andreassen, N.; Borch, O.J.; Kuznetsova, S.; Ingimundarson, V.; Jakobsen, U. Arctic shipping and risks: Emergency categories and response capacities. TransNav. Int. J. Mar. Navig. Saf. Sea Transp. 2018, 12, 107–114. [Google Scholar] [CrossRef] [Green Version]
  40. Rasmussen, H.B.; Feldtmann, B. Safe navigation of cruise ships in greenlandic waters-legal frame and practical challenges. TransNav. Int. J. Mar. Navig. Saf. Sea Transp. 2020, 14, 207–212. [Google Scholar] [CrossRef]
  41. Zhang, Y.; Hu, H.; Dai, L. Real-time assessment and prediction on maritime risk state on the Arctic Route. Marit. Policy Manag. 2020, 47, 352–370. [Google Scholar] [CrossRef]
  42. Khan, B.; Khan, F.; Veitch, B. A Dynamic Bayesian Network model for ship-ice collision risk in the Arctic waters. Saf. Sci. 2020, 130, 104858. [Google Scholar] [CrossRef]
  43. Qian, H.; Zhang, R.; Zhang, Y.J. Dynamic risk assessment of natural environment based on Dynamic Bayesian Network for key nodes of the arctic Northwest Passage. Ocean. Eng. 2020, 203, 107205. [Google Scholar] [CrossRef]
  44. International Maritime Organization. International Code for Ship Operating in Polar Waters (POLAR CODE). 2015. Available online: https://wwwcdn.imo.org/localresources/en/MediaCentre/HotTopics/Documents/POLAR%20CODE%20TEXT%20AS%20ADOPTED.pdf (accessed on 13 February 2020).
  45. IMO. Methodology for Assessing Operational Capabilities and Limitations in Ice: Polar Operational Limit Assessment Risk Indexing System (POLARIS). 2016. Available online: https://www.nautinst.org/uploads/assets/uploaded/2f01665c-04f7-4488-802552e5b5db62d9.pdf (accessed on 5 September 2019).
  46. Lee, H.W.; Roh, M.I.; Kim, K.S. Ship route planning in Arctic Ocean based on POLARIS. Ocean Eng. 2021, 234, 109297. [Google Scholar]
  47. An, L.; Ma, L.; Wang, H.; Zhang, H.Y.; Li, Z.H. Research on navigation risk of the Arctic Northeast Passage based on POLARIS. J. Navig. 2022, 75, 455–475. [Google Scholar] [CrossRef]
  48. Mudryk, L.R.; Dawson, J.; Howell, S.E.; Derksen, C.; Zagon, T.A.; Brady, M. Impact of 1, 2 and 4 °C of global warming on ship navigation in the Canadian Arctic. Nat. Clim. Chang. 2021, 11, 673–679. [Google Scholar] [CrossRef]
  49. China Meteorological Administration. Grade of Vessel Pilotage Weather Conditions. 2016. Available online: http://www.cma.gov.cn/root7/auto13139/201702/P020191108657988301261.pdf (accessed on 11 March 2020).
  50. Kay, J.E.; Deser, C.; Phillips, A.; Mai, A.; Hannay, C.; Strand, G.; Arblaster, J.M.; Bates, S.C.; Danabasoglu, G.; Edwards, J.; et al. The Community Earth System Model (CESM) large ensemble project: A community resource for studying climate change in the presence of internal climate variability. Bull. Am. Meteorol. Soc. 2015, 96, 1333–1349. [Google Scholar] [CrossRef] [Green Version]
  51. Canadian Ice Service (CIS). Regional Charts: History, Accuracy, and Caveats; CIS Archive Documentation Series 1; Canadian Ice Service (CIS): Gatineau, QC, Canada, 2007. Available online: http://ice.ec.gc.ca/IA_DOC/cisads_no_001_e.pdf (accessed on 11 September 2019).
  52. Agnew, T.; Howell, S. The use of operational ice charts for evaluating passive microwave ice concentration data. Atmos. Ocean. 2003, 41, 317–331. [Google Scholar] [CrossRef]
  53. Canadian Ice Service (CIS). Regional Charts: Canadian Ice Service Ice Regime Regions (CISIRR) and Sub-Regions with Associated Data Quality Indices; CIS Archive Documentation Series 3; Canadian Ice Service (CIS): Gatineau, QC, Canada, 2007. Available online: http://ice.ec.gc.ca/IA_DOC/cisads_no_003_e.pdf (accessed on 11 September 2019).
  54. Hennermann, K.; Berrisford, P. ERA5 Data Documentation. Copernicus Knowledge Base, 2017. Available online: https://confluence.ecmwf.int/display/CKB/ERA5%3A+data+documentation (accessed on 1 March 2021).
  55. Hersbach, H.; Bell, B.; Berrisford, P.; Hirahara, S.; Horányi, A.; Muñoz-Sabater, J.; Nicolas, J.; Peubey, C.; Radu, R.; Schepers, D.; et al. The ERA5 global reanalysis. Q. J. R. Meteorol. Soc. 2020, 146, 1999–2049. [Google Scholar] [CrossRef]
  56. Amante, C.; Eakins, B.W. ETOPO1 Arc-Minute Global Relief Model: Procedures, Data Sources and Analysis. 2009. Available online: https://repository.library.noaa.gov/view/noaa/1163/noaa_1163_DS1.pdf (accessed on 6 January 2020).
  57. Hurrell, J.W.; Holland, M.M.; Gent, P.R.; Ghan, S.; Kay, J.E.; Kushner, P.J.; Lamarque, J.-F.; Large, W.G.; Lawrence, D.; Lindsay, K.; et al. The community earth system model: A framework for collaborative research. Bull. Am. Meteorol. Soc. 2013, 94, 1339–1360. [Google Scholar] [CrossRef]
  58. England, M.; Alexandra, J.; Lorenzo, P. Nonuniform contribution of internal variability to recent Arctic sea ice loss. J. Clim. 2019, 32, 4039–4053. [Google Scholar] [CrossRef]
  59. Jahn, A.; Kay, J.E.; Holland, M.M.; Hall, D.M. How predictable is the timing of a summer ice-free Arctic? Geophys. Res. Lett. 2016, 43, 9113–9120. [Google Scholar] [CrossRef]
  60. Zhe, W.; Ren, Z.; Shanshan, G. Natural environment risk division of the Arctic northeast channel—Taking the Northern Sea Area of Russia as an example. Ocean. Eng. 2017, 35, 61–70. (In Chinese) [Google Scholar]
  61. Shi, P. Theory and practice of disaster study. J. Nat. Disasters 1996, 4, 6–17. [Google Scholar]
  62. Neiburger, M. Visibility and Liquid Content in Cloud. J. Atmos. Sci. 1953, 10, 401. [Google Scholar] [CrossRef] [Green Version]
  63. Pinnick, R.G.; Hoihjelle, D.L.; Fernandez, G.; Stenmark, E.B.; Lindberg, J.D.; Hoidale, G.B.; Jennings, S.G. Vertical structure in atmospheric fog and haze and its effects on visible and infrared extinction. J. Atmos. Sci. 1978, 35, 2020–2032. [Google Scholar] [CrossRef] [Green Version]
  64. Kunkel, B.A. Parameterization of droplet terminal velocity and extinction coefficient in fog models. J. Clim. Appl. Meteorol. 1984, 23, 34–41. [Google Scholar] [CrossRef] [Green Version]
  65. Eldridge, R.G. The relationship between visibility and liquid water content in fog. J. Atmos. Sci. 1971, 28, 1183–1186. [Google Scholar] [CrossRef] [Green Version]
  66. Stoelinga, M.T.; Warner, T.T. Nonhydrostatic, mesobeta-scale model simulations of cloud ceiling and visibility for an East Coast winter precipitation event. J. Appl. Meteorol. 1999, 38, 385–404. [Google Scholar] [CrossRef]
  67. Fu, G.; Li, X.; Wei, N. Review on the atmospheric visibility research. Period. Ocean. Univ. China 2009, 39, 855–862. [Google Scholar]
  68. Stroeve, J.; Barrett, A.; Serreze, M.; Schweiger, A. Using records from submarine, aircraft and satellites to evaluate climate model simulations of Arctic sea ice thickness. Cryosphere 2014, 8, 1839–1854. [Google Scholar] [CrossRef] [Green Version]
  69. Howell, S.E.L.; Laliberté, F.; Kwok, R.; Derksen, C.; King, J. Landfast ice thickness in the Canadian Arctic Archipelago from observations and models. Cryosphere 2016, 10, 1463–1475. [Google Scholar] [CrossRef] [Green Version]
  70. Laliberté, F.; Howell, S.E.L.; Kushner, P.J. Regional variability of a projected sea ice-free Arctic during the summer months. Geophys. Res. Lett. 2016, 43, 256–263. [Google Scholar] [CrossRef]
  71. Peters, G.; Andrew, R.; Boden, T.; Canadell, J.G.; Ciais, P.; Le Quéré, C.; Marland, G.; Raupach, M.R.; Wilson, C. The challenge to keep global warming below 2 C. Nat. Clim. Chang. 2013, 3, 4–6. [Google Scholar] [CrossRef]
  72. Drewniak, M.; Dalaklis, D.; Christodoulou, A.; Sheehan, R. Ice-Breaking Fleets of the United States and Canada: Assessing the Current State of Affairs and Future Plans. Sustainability 2021, 13, 703. [Google Scholar] [CrossRef]
  73. Hanesiak, M.J.; Wang, X.L. Adverse-weather trends in the Canadian Arctic. J. Clim. 2005, 18, 3140–3156. [Google Scholar] [CrossRef]
  74. Peterson, I.; Hamilton, J.; Prinsenberg, S.; Pettipas, R. Wind-forcing of volume transport through Lancaster Sound. J. Geophys. Res. Ocean. 2012, 117, C11. [Google Scholar] [CrossRef] [Green Version]
  75. Melling, H. Sea ice of the northern Canadian Arctic Archipelago. J. Geophys. Res. Ocean. 2002, 107, 2-1–2-21. [Google Scholar] [CrossRef]
  76. Howell, S.E.L.; Wohlleben, T.; Komarov, A.; Pizzolato, L.; Derksen, C. Recent extreme light sea ice years in the Canadian Arctic Archipelago: 2011 and 2012 eclipse 1998 and 2007. Cryosphere 2013, 7, 1753–1768. [Google Scholar] [CrossRef] [Green Version]
  77. Qian, H.; Zhang, R. Future changes in wind energy resource over the Northwest Passage based on the CMIP6 climate projections. Int. J. Energy Res. 2021, 45, 920–937. [Google Scholar] [CrossRef]
  78. Stevenson, T.C.; Davies, J.; Huntington, H.P.; Sheard, W. An examination of trans-Arctic vessel routing in the Central Arctic Ocean. Mar. Policy 2019, 100, 83–89. [Google Scholar] [CrossRef]
  79. Bennett, M.M.; Stephenson, S.R.; Yang, K.; Bravo, M.T.; De Jonghe, B. The opening of the Transpolar Sea Route: Logistical, geopolitical, environmental, and socioeconomic impacts. Mar. Policy 2020, 121, 104178. [Google Scholar] [CrossRef]
  80. United Nations Oceans and Law of the Sea (UNCLOS). Commission on the Limits of the Continental Shelf. 2013. Available online: http://www.un.org/depts/los/clcs_new/clcs_home.htm (accessed on 28 October 2021).
  81. Lam, S.S.; Foong, S.Y.; Lee, B.H.; Low, F.; Alstrup, A.K.; Ok, Y.S.; Peng, W.; Sonne, C. Set sustainable goals for the Arctic gateway coordinated international governance is required to resist yet another tipping point. Sci. Total Environ. 2021, 776, 146003. [Google Scholar] [CrossRef]
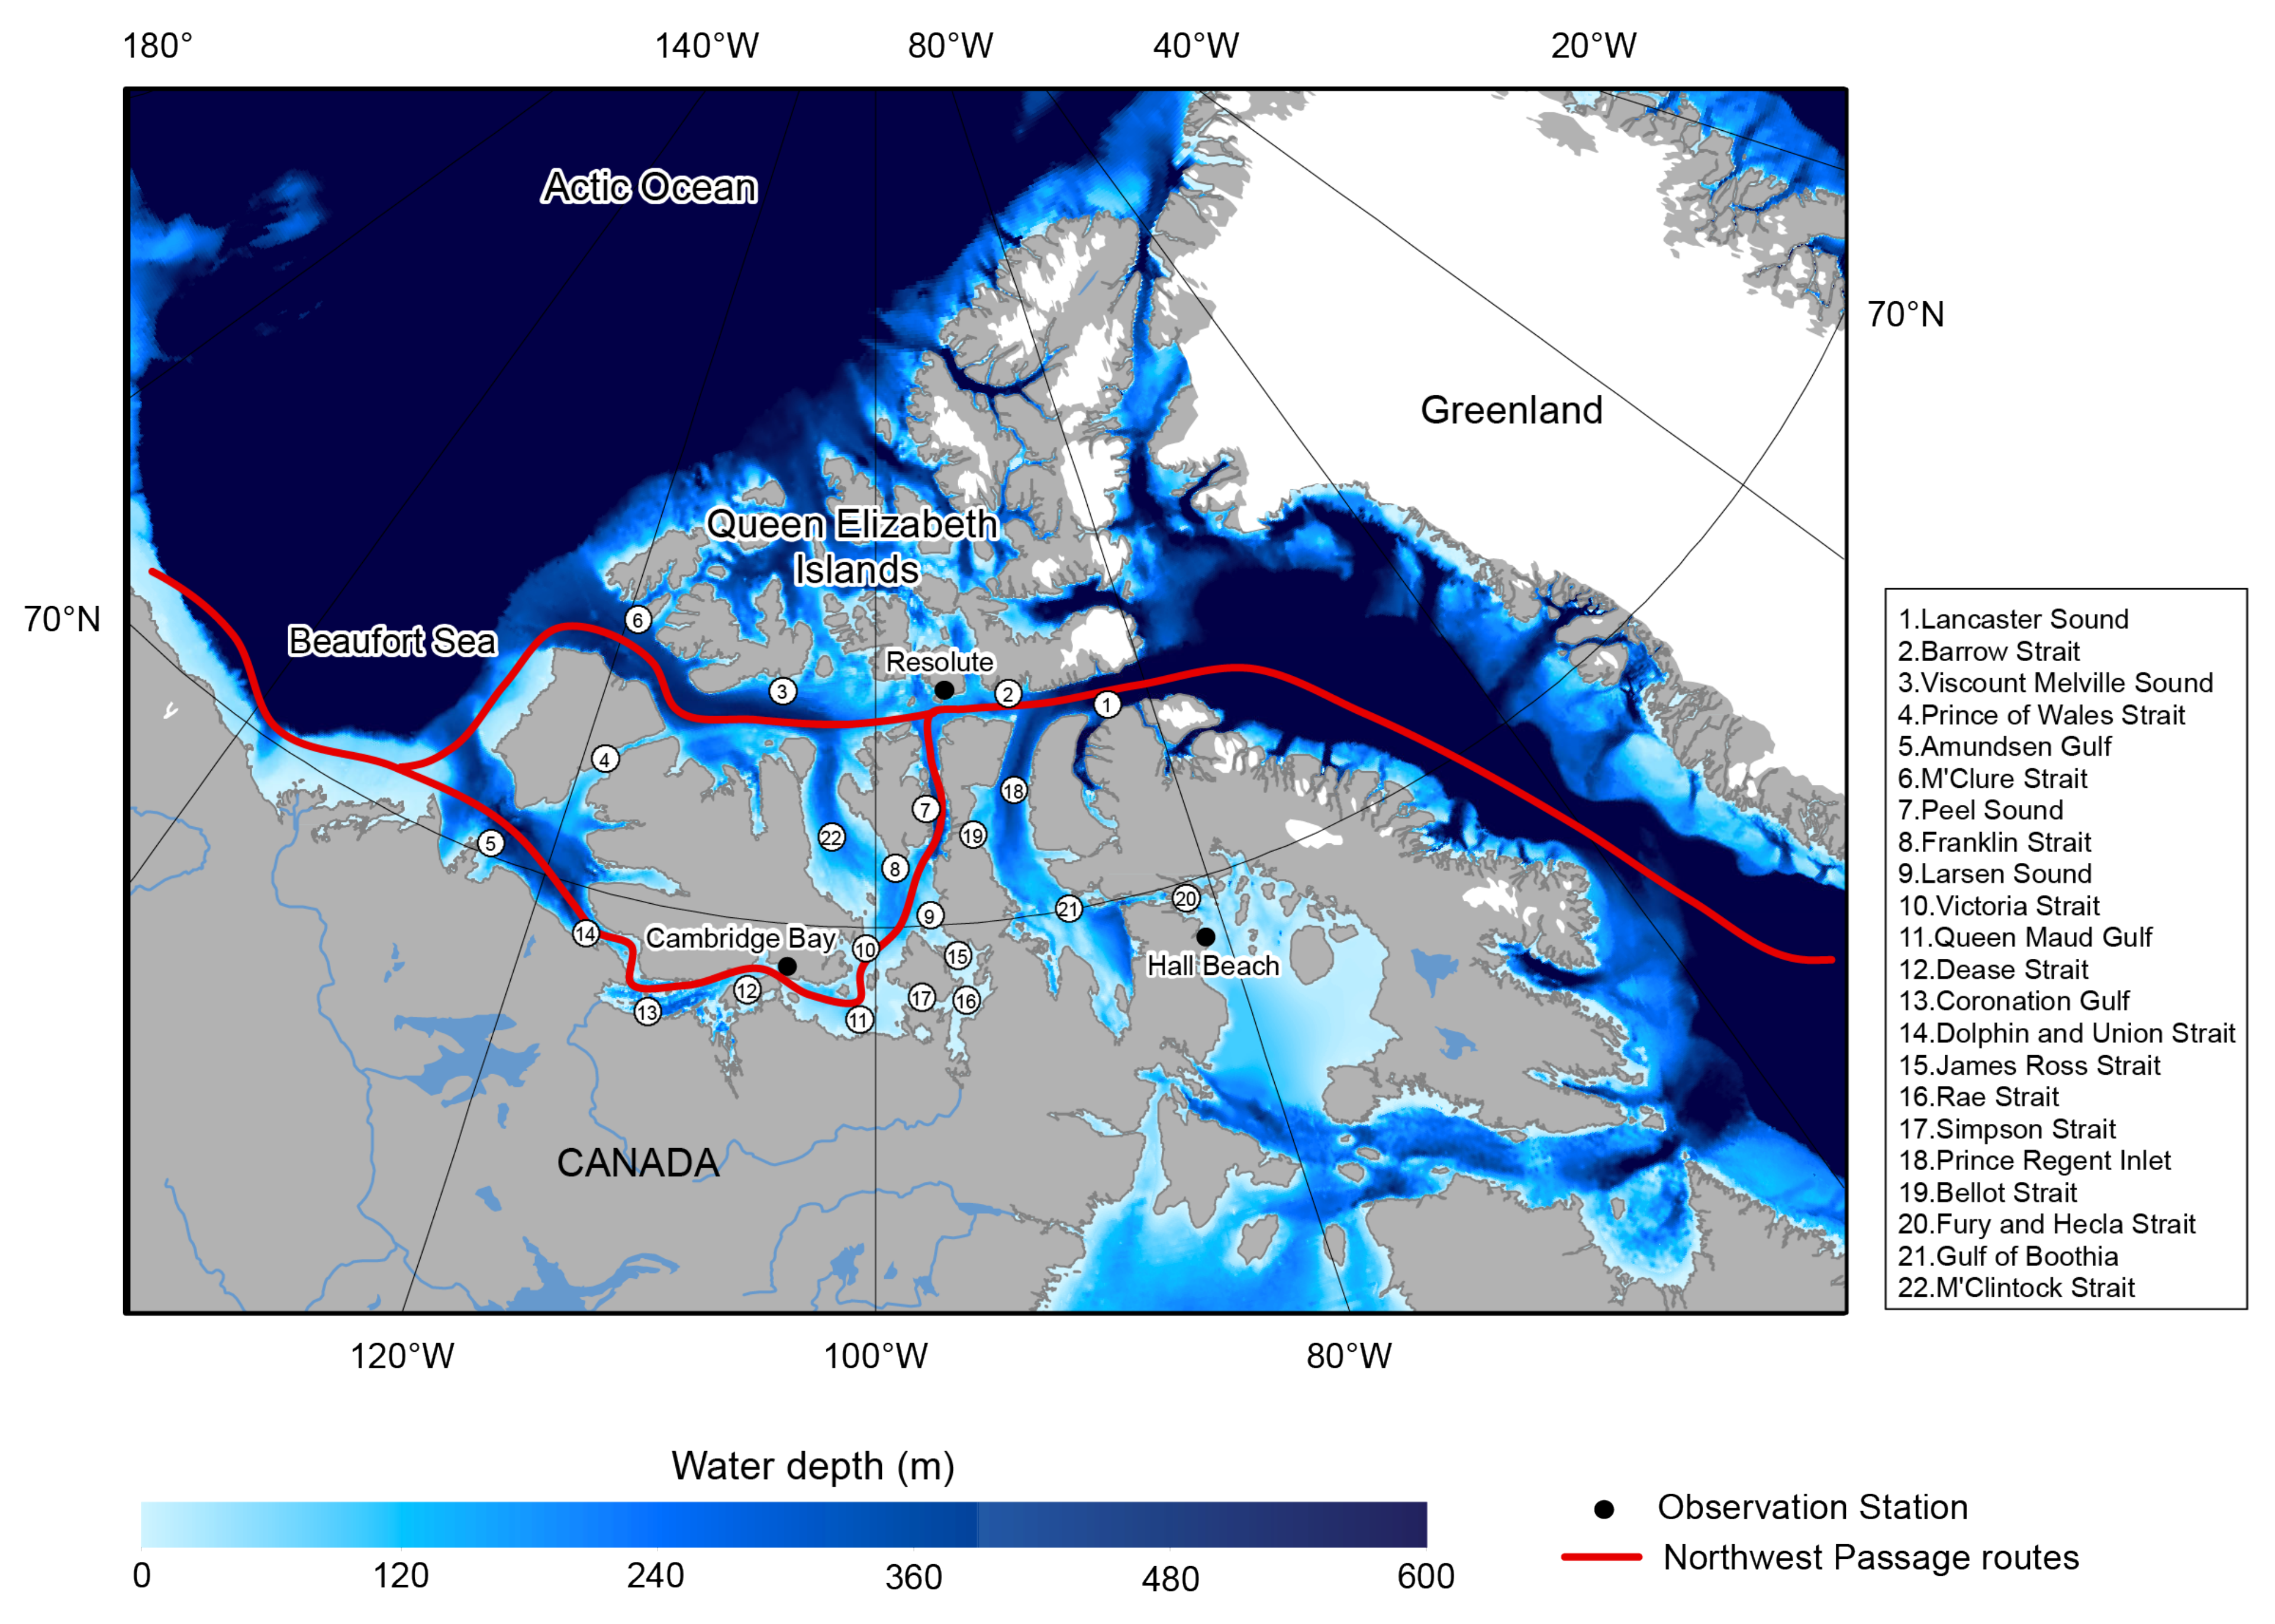
Figure 1. Geographical location of the Northwest Passage through the Canadian Arctic Archipelago. The red lines represent the two main routes of the Northwest Passage, and the black dots represent observation stations along the Northwest Passage.
Sustainability 14 05591 g001
Figure 2. Annual dynamics of summer and autumn monthly mean sea-ice risk area in the Northwest Passage during 1979–2019. (a) Risk area dynamics of the NWP northern route for OW ship, where the RIO < 0 within the shipping area is considered to be a risk. (b) Similar to (a) but for PC6 ship. (c) Risk area dynamics of the NWP southern route for OW ship. (d) Similar to (c) but for PC6 ship. Black solid line shows the monthly mean value of summer and autumn; red solid line shows the trend, all trends are significant with p-values < 0.01; shading shows 1 σ spread of the mean value.
Sustainability 14 05591 g002
Figure 3. Spatial distribution of sea-ice risk in the Northwest Passage for OW ship class and PC6 ship class from 1979 to 2019. (a) Multi-year average risk status of the NWP for OW ships in each month of summer and autumn. (b) Similar to a, but for PC6 ships. The risk status of ship navigation is divided into four grades: RIO > 0 (green, normal operation for both PC6 and OW ships), −10 < RIO < 0 (yellow, elevated operational risk for PC6 ships and operation subject to special consideration for OW ships), −20 < RIO < −10 (orange, operation subject to special consideration for both PC6 and OW ships), RIO < −20 (red, operation subject to special consideration for both PC6 and OW ships).
Sustainability 14 05591 g003
Figure 4. Spatial distribution of risk frequency (a) and frequency trends (b) of strong wind, low visibility, and low temperature in the Northwest Passage. Risk frequency refers to the probability of the risk occurring on the day of the ship navigation, and the meteorological conditions grade II or above is considered a risk, i.e., wind speed > 10.8 m/s, visibility < 4 km, temperature < 0 °C. The statistical period includes summer and autumn from 1979 to 2019.
Sustainability 14 05591 g004
Figure 5. Box plot visualization of variability in pilotage risk for the northern route and southern route of the Northwest Passage from 1979 to 2019. (a) Vessel pilotage risk for the northern route from June to November. (b) Similar to a, but for the southern route. The pilotage risk value is calculated by combining the intensity and frequency of the strong wind and low visibility along the route. Interpolation lines are given for the minimum, lower quartile, mean (thick blue), median, upper quartile, and maximum pilotage risk value of all grid cells on the route; the blue straight line shows the trend of the mean with p-value < 0.05.
Sustainability 14 05591 g005
Figure 6. Temperature condition of the Northwest Passage routes. (a) Average temperature of each month from June to November during 2009–2019. (b) Temperature trends for each month from June to November during 1979–2019 (show trends meeting 95% significance level only).
Sustainability 14 05591 g006
Figure 7. Comprehensive risk of the Northwest Passage from June to November in period 2009–2019. (a) Risk for OW ships. (b) Risk for PC6 ships.
Sustainability 14 05591 g007
Figure 8. Projected changes in sea-ice risk and navigability of the Northwest Passage northern route during summer and autumn. (a,b) Change in summer and autumn monthly mean sea-ice risk area of the northern route for OW ship (a) and PC6 ship (b), where the RIO < 0 within the shipping area is considered to be a risk. The black solid line shows ensemble mean values; shading shows the range between maximum and minimum values of the ensemble. All satellite observations fall within the range of model spread, indicating that the model ensemble and observations are in close agreement. (c,d) Evolution of the navigability of the northern route for OW ship (c) and PC6 ship (d) in the ensemble average state. The blue solid line shows the number of navigable days; the cyan solid line shows the first/last day of navigation; green and yellow shading indicate the navigable period of model ensemble and observations, respectively.
Sustainability 14 05591 g008
Table 1. Ship-navigation weather-condition grades of wind speed, visibility, and temperature.
GradesWind Speed (m/s)Visibility (km)Temperature (°C)Risk Value
I W a < 10.8 V 4.0 T a 00
II 10.8 W a < 13.9 2.0 V < 4.0 10 V < 00.25
III 13.9 W a < 17.2 1.0 V < 2.0 15 V < −100.50
IV 17.2 W a < 20.8 0.5 V < 1.0 20 V < −150.75
V W a 20.8V < 0.5V < −201
W a is the average wind speed; V is the visibility; T a is the average temperature.
Table 2. Indicator weight determination table.
IndicatorsSea IceWater DepthWindVisibilityTemperature
Weights0.350.120.10.230.2
Publisher’s Note: MDPI stays neutral with regard to jurisdictional claims in published maps and institutional affiliations.