Article

Degradation of Organics and Change Concentration in Per-Fluorinated Compounds (PFCs) during Ozonation and UV/H2O2 Advanced Treatment of Tertiary-Treated Sewage

1
Department of Civil and Environmental Engineering, University of Science and Technology, Daejeon 34113, Korea
2
Department of Environmental Research, Korea Institute of Civil Engineering and Building Technology (KICT) School, Goyang-si 10223, Korea
3
Department of Water Environment Research, Seoul Metropolitan Government Research Institute of Public Health and Environment, Seoul 13818, Korea
*
Author to whom correspondence should be addressed.
Sustainability 2022, 14(9), 5597; https://doi.org/10.3390/su14095597
Submission received: 13 April 2022 / Revised: 29 April 2022 / Accepted: 3 May 2022 / Published: 6 May 2022

Abstract

:
This study aimed to investigate the effect of H2O2 addition, ozone feed rate, and UV addition on the change in the concentration of organics such as CODMn, CODCr, TOC, and PFCs in tertiary-treated effluent from a sewage treatment plant (STP) during the O3 and UV/H2O2 process. The degradation of organic pollutants from tertiary effluent is a significant challenge because biological treatment cannot degrade these recalcitrant pollutants. Therefore, the O3/UV/H2O2 process was an effective method for treating recalcitrant organics. Several batch tests were conducted to investigate the direct UV photolysis, UV/H2O2, and ozone-based advanced oxidation process to degrade CODMn, CODCr, TOC, and PFCs. The chemical oxygen demand (COD) and total organic carbon (TOC) with UV irradiation showed 95% and 50% removal efficiency percentages under optimal conditions (initial pH = 6.7, H2O2 dosage = 50 mg/L, ozone feed rate = 5.8 mg/L/min. Moreover, UV irradiation, with the addition of H2O2, and a sufficient dose of ozone, demonstrated the efficient removal of organic compounds by the indication of radical oxidation. (·OH) is the dominant mechanism. However, AOPs are not sufficient to fully treat the PFC compound; thus, additional procedures are required to degrade PFCs. In this study, the removal of organic recalcitrant contaminants and the change in added PFC concentration in tertiary-treated sewage were investigated by applying the ozone-based advanced oxidation process.

1. Introduction

The progression of various organic pollutants and emerging contaminants in municipal wastewater is an ongoing concern. Most of the emerging contaminants are typically present in low concentrations, but the contaminants are potentially highly toxic [1]. For example, aquatic and terrestrial organisms showed a wide range of natural and synthetic chemicals that interfere with the endocrine system and physiology [2]. The presence of organic contaminants in treated municipal wastewater effluents has several adverse effects [3]. Several studies have reported that conventional water treatment processes are inadequate in efficiently removing organic pollutants [4,5].
Therefore, the study required advanced treatment technologies to effectively degrade organic pollutants. The ozone-based advanced oxidation process has widespread attention today. The U.S. National Environmental Protection Agency (EPA) considered O3/UV as one of the most developing potentials in the advanced oxidation process [6]. Organic pollutants can be degraded by this process but cannot be reduced by ozone or ultraviolet radiation alone. Therefore, the hydroxyl radicals (·OH) with strong oxidation produced in the reaction process and the redox potential of (·OH) can degrade organic pollutants without selectivity and have a high degree of mineralization [7,8,9,10].
Perfluorinated chemicals (PFCs), especially perfluorooctanesulfonic acid (PFOS) and perfluorooctanoic acid (PFOA), are stable organic fluorinated compounds that are generally used in consumer products and have been found in tap water and municipal wastewater in Korea [11,12,13], as well as in the sludge of treatment plants [14]. Currently, STPs are considered as one possible source of released PFCs, and PFCs are now recognized as a major emerging pollutant in our environment. These pollutants have been detected all over the world, not only in wastewater, but also in most water environments [15,16,17,18].
In Korea, 28 types of tap water monitoring systems found three perfluorinated compounds (PFOS, PFOA, and PFHxS) [13]. Researchers already confirmed that their major sources are related to industrial activities [19,20,21,22]. These compounds are recalcitrant to most conventional wastewater treatment technologies. PFCs have very high thermal and chemical stability, and can resist degradation by acids, bases, oxidants, reductants, and photolytic processes. Because of their strong carbon-fluoride bonds, biodegradation by microbes and metabolic processes is difficult, and they remain in the environment [23,24,25]. Presently, few treatment technologies have been introduced and developed for removing PFCs from water and wastewater.
A literature review shows that only few technologies were effective in the degradation of PFCs in an aqueous solution. The author of [26] reported that PFOA, with an initial concentration of 20 mg/L, was degraded by 80% under the irradiation of 254 nm of UV light in the presence of 80 μmol/L Fe (III). Photocatalytic methods, such as those under 220–460 nm of UV light irradiation and a homogeneous photocatalyst tungstic heteropoly acid, the use of persulfate as a photochemical oxidant [27,28], ultrasonic irradiation, and vacuum UV light methods have also shown degradation of PFCs [29]. On the other hand, ozonation and UV-based photolytic treatment methods proved ineffective for the degradation and mineralization of PFOS due to the presence of strong carbon–fluoride bonds [30]. However, only a limited amount of research has been performed on PFCs in domestic wastewater treatment plants. Therefore, the research focuses on the degradation of organic pollutants and the change in concentration of PFCs during the AOP process in wastewater treatment plants. AOPs have been one of the most significant processes that can decompose most organic pollutants efficiently via the generation of highly reactive and non-selective hydroxyl radicals [31,32,33,34].
The research aims to identify PFC concentrations from domestic WWTP, and the application of ozone-based advanced wastewater treatment process performance on the removal of PFCs, as well as to demonstrate the effectiveness of the ozone-based advanced oxidation process for the degradation of PFCs in tertiary-treated wastewater with very low (below 1 µg/L) concentrations of PFCs. However, due to the limitations of the AOP process, in future these methods can be applied for the removal of PFOS, such as persulfate activation sonolysis and photocatalysis [35,36,37,38].

2. Materials and Methods

2.1. Experimental Condition

The experimental device shown in Figure 1 was installed, and the tested water was collected from the sewage treatment plant (STP), located in South Korea. The tertiary-treated effluent sewage used for the test with a UV lamp (that emit 185/254 nm) was carried out in a cylindrical stainless-steel reactor. The reactor was 159 cm in length, inner 13.3 cm in diameter, and had an outer circle circumference of 43.5 cm. The lamps had a 145 cm arc length and were protected by a quartz sleeve with a sleeve diameter of 2.7 cm. For this study, the tested water was spiked with 15, 30, and 50 mg/L of an initial concentration of H2O2 (30%, V/V) and circulated to mix before UV irradiation. The reaction time for the tested water was 20 min; samples were taken at 5-min time intervals to analyze the parameters.
On the other hand, another batch experiment was conducted with three different PFC concentrations spiked to the tested water condition with a fixed 50 mg/L H2O2 initial concentration. The reaction time was 40 min; samples were taken at 10-min time intervals to analyze the parameters.

2.2. Characteristics of Wastewater

The process used domestic wastewater from a tertiary effluent, and the composition of the effluent was consistent with the pollutant characteristics of domestic sewage. Water temperature (T) and pH were measured during the sampling process. Detailed properties are shown in Table 1.

2.3. Reagents and Chemicals

In this study, PFC stock solutions were prepared using the perfluoro-organic acid solution into 100 μg/mL of methanol, and then storing it in a polypropylene (PP) bottle at 4 C. PFC standard solutions were prepared by diluting different volumes of stock solutions. These multi-component standards contained the same concentrations of each PFC. As a standard material, Custom Perfluoro Organic Acid Standard (8 composites) was used. The internal standards, MPFOA, and MPFOS, were purchased from Wellington Laboratories and used. All standards purchased in liquid form were diluted with ultrapure water to prepare standard PFC stock solutions.

2.4. Analytical Procedure

The perfluorinated compound test method was carried out using ES 04506.1 (perfluorinated compound liquid chromatography–tandem mass spectrometry), as described in the Water Pollution Process Test Standards [13]. As an analysis instrument, the online SPE HPLC MS/MS (Thermo Scientific, Waltham, MA, USA) of the TSQ Altis model was used.
After filtering the target sample through a 0.8 μm membrane filter, 1 mL of the sample was directly injected into the online SPE by adding an internal standard, followed by pre-treatment and LC-MS/MS analysis.
Online SPE and HPLC analysis conditions are shown in Table 2, and MS/MS analysis conditions are shown in Table 3.
The UV-H2O2 batch experiment was carried out in a reactor, and it was equipped with a UV lamp (lamp intensity 220 W/Mm2). Samples were collected in 5–10 min intervals after starting the UV-AOP process using 1 L of plastic bottles from sampling ports of the reactor. Temperature and pH were measured using the pH meter model (S-610H) immediately after sampling.
CODCr, CODMn, and UV254 were measured using the CMAC standard method by the HACH DR-5000 spectrophotometer. Samples and blanks in test tubes were heated in a block digestor in the presence of dichromate at 150 °C. After two hours, the tubes were removed from the digester, cooled, and measured spectrophotometrically at 350 nm. On the other hand, CODMn was measured using the CMAC potassium permanganate method. Samples and blanks in test tubes were heated in a block digestor in the presence of CODMn solution at 100 °C. After 10 min, the tubes were removed from the digester, cooled, and measured spectrophotometrically at 525 nm. H2O2 was measured using the titanium oxalate spectrophotometric method with the DR-5000 spectrophotometer and spectrophotometrically at 400 nm. For TOC analysis, the total organic carbon high-temperature combustion oxidation method (ES 04311.1b) was applied among the water pollution process test standards. The instrument used for the analysis was the TOC-V CPH (SHIMADZU).

3. Results

3.1. H2O2 Degradation

Hydrogen peroxide is a chemical used in oxidation reactions, treatment of various inorganic and organic pollutants, and for various disinfection applications [39]. As shown in Figure 2a, the increase in H2O2 concentration enhanced the oxidation rate, and this enhancement can be attributed to the photolysis of H2O2, which generates (·OH) radicals. From the graphs, it can be seen clearly that the degradation rate at 50 mg/L H2O2 was higher than 15 and 30 mg/L of the initial H2O2 concentration. This can be explained by the fact that a higher H2O2 concentration results in higher absorption by H2O2, leading to a higher (·OH) radical generation rate, thereby promoting the (·OH) radical oxidation pathway [40]. In these cases, the pollutant degradation rates mainly depended on the rate of (·OH) radical formation, and at H2O2 concentrations of 15, 30, and 50 mg/L, the degradation rate depended on the initial H2O2 concentration. At an H2O2 concentration of 50 mg/L, with the initial concentration of PFCs at 0.01, 0.1, and 1.0 mg/L, the reaction time was 40 min, during this reaction time the degradation rate of H2O2 concentration linearly decreased, as shown in Figure 2b.
The ability of UV/H2O2 to treat trace organic contaminants in wastewater is inhibited by UV-light-absorbing species and hydroxyl radical (·OH) scavenging species. After applying this in the treatment, degradation rates of organics under UV/H2O2 increased according to the reaction time up to 92%, as shown in Figure 2c. Overall, employing the treatment of tertiary treated effluent was shown as a potential strategy to increase the oxidation potential of UV/AOP systems [41].

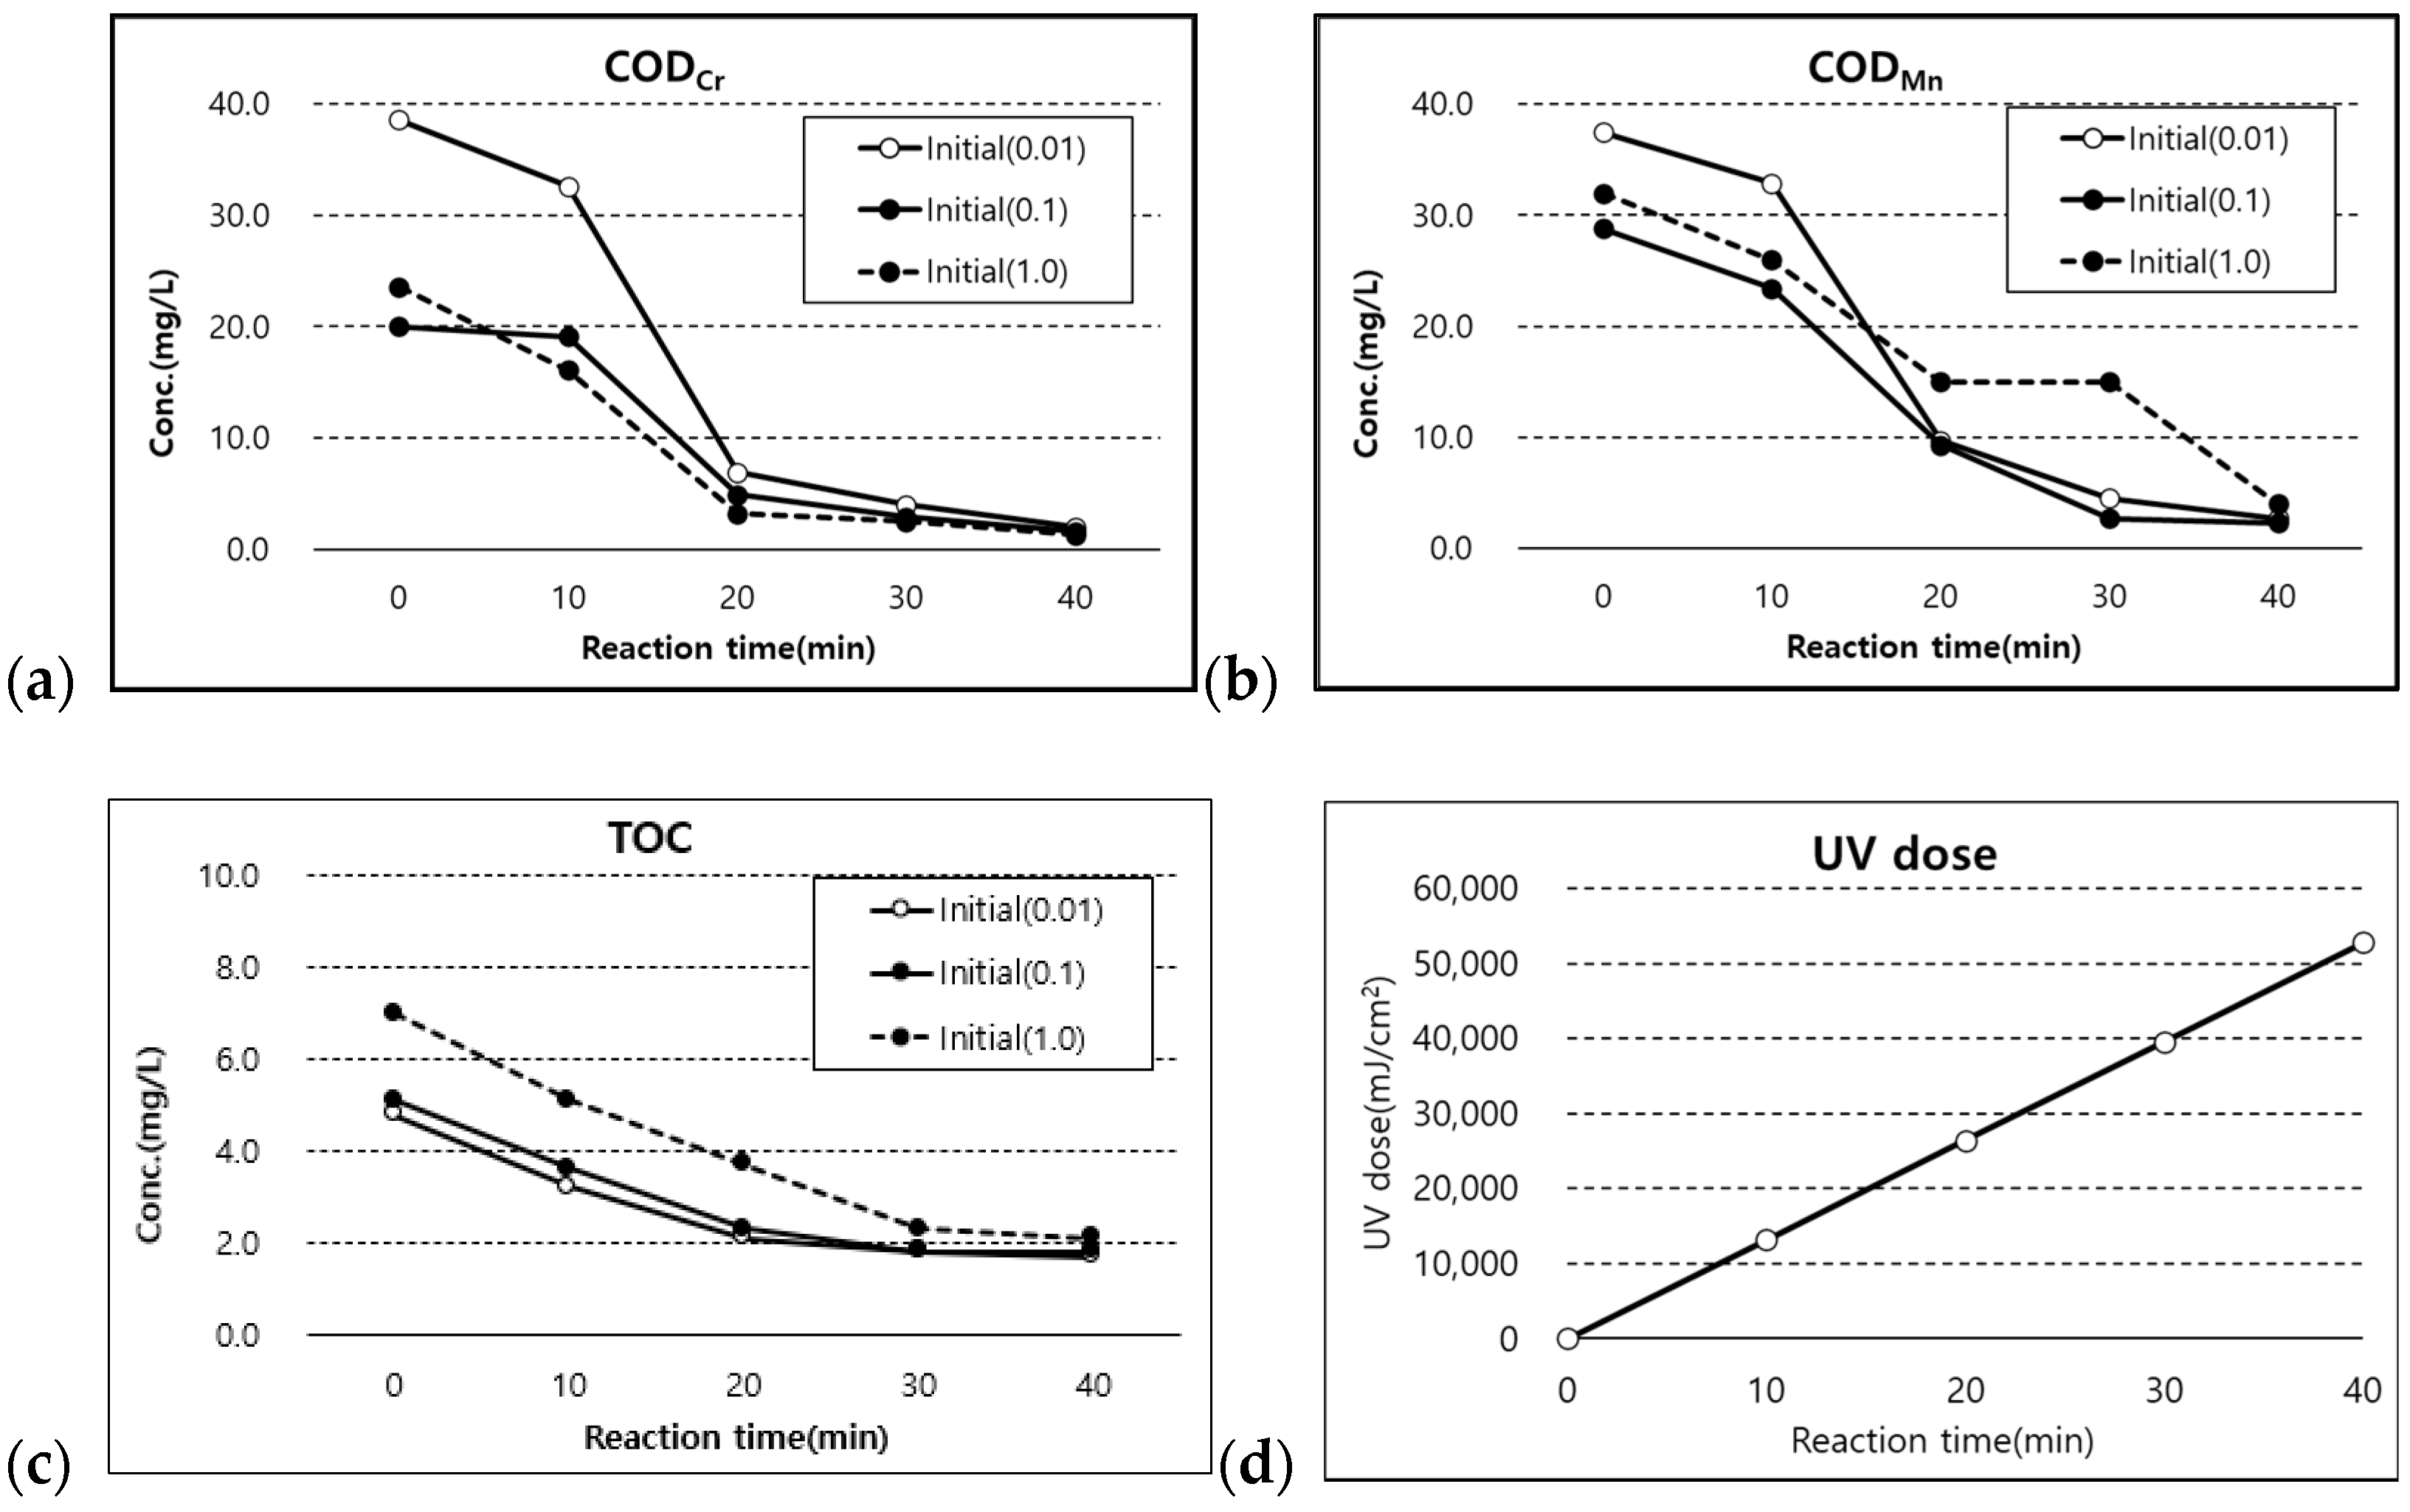
3.2. Degradation of CODMn, CODCr, and TOC with Spiking PFCs

The treatment of tertiary effluent with different concentrations of PFCs was compared in Figure 3. The concentration of CODCr, CODMn, and TOC was almost degraded at an elapsed residence time of 20 min in the system of UV with the addition of H2O2. In the degradation of PFCs, three different concentrations of treatment efficiencies were considered as well. It was found that the 50.2 mg/L H2O2 photocatalysis degraded the organic compound with the highest rate. Therefore, the order of the degradation rate in the case of photocatalysis with the degradation of organic compounds was related to organic species, their concentration, and degradation methods. Degradation aspects of organics and perfluorinated compounds were investigated with UV/H2O2 systems. Of the methods considered, the UV/H2O2 system showed that 92% was demineralized at the residence time of 20 min. It took 40 min of reaction time for H2O2 to degrade with 95% (Figure 3), according to the reported results.
In this experiment, based on the data obtained for CODCr, CODMn, TOC removed, and H2O2 degraded, tertiary-treated sewage observations were made with the additional PFC concentrations in the UV/H2O2 process. Figure 3c shows the association of UV/H2O2 with the removal of TOC and degraded H2O2 in the tested water. In the case of organic removal during the UV-H2O2 process with the UV lamp that emits at 185/254 nm, 70% of total TOC was removed from the final effluent. The present work aims to show the optimal operation conditions in the experiment and H2O2 degradation in tertiary-treated sewage. The tested water used in this study was a sample from sewage effluent. Moreover, the characteristics of water parameters varied depending on the tested water used as a sample.

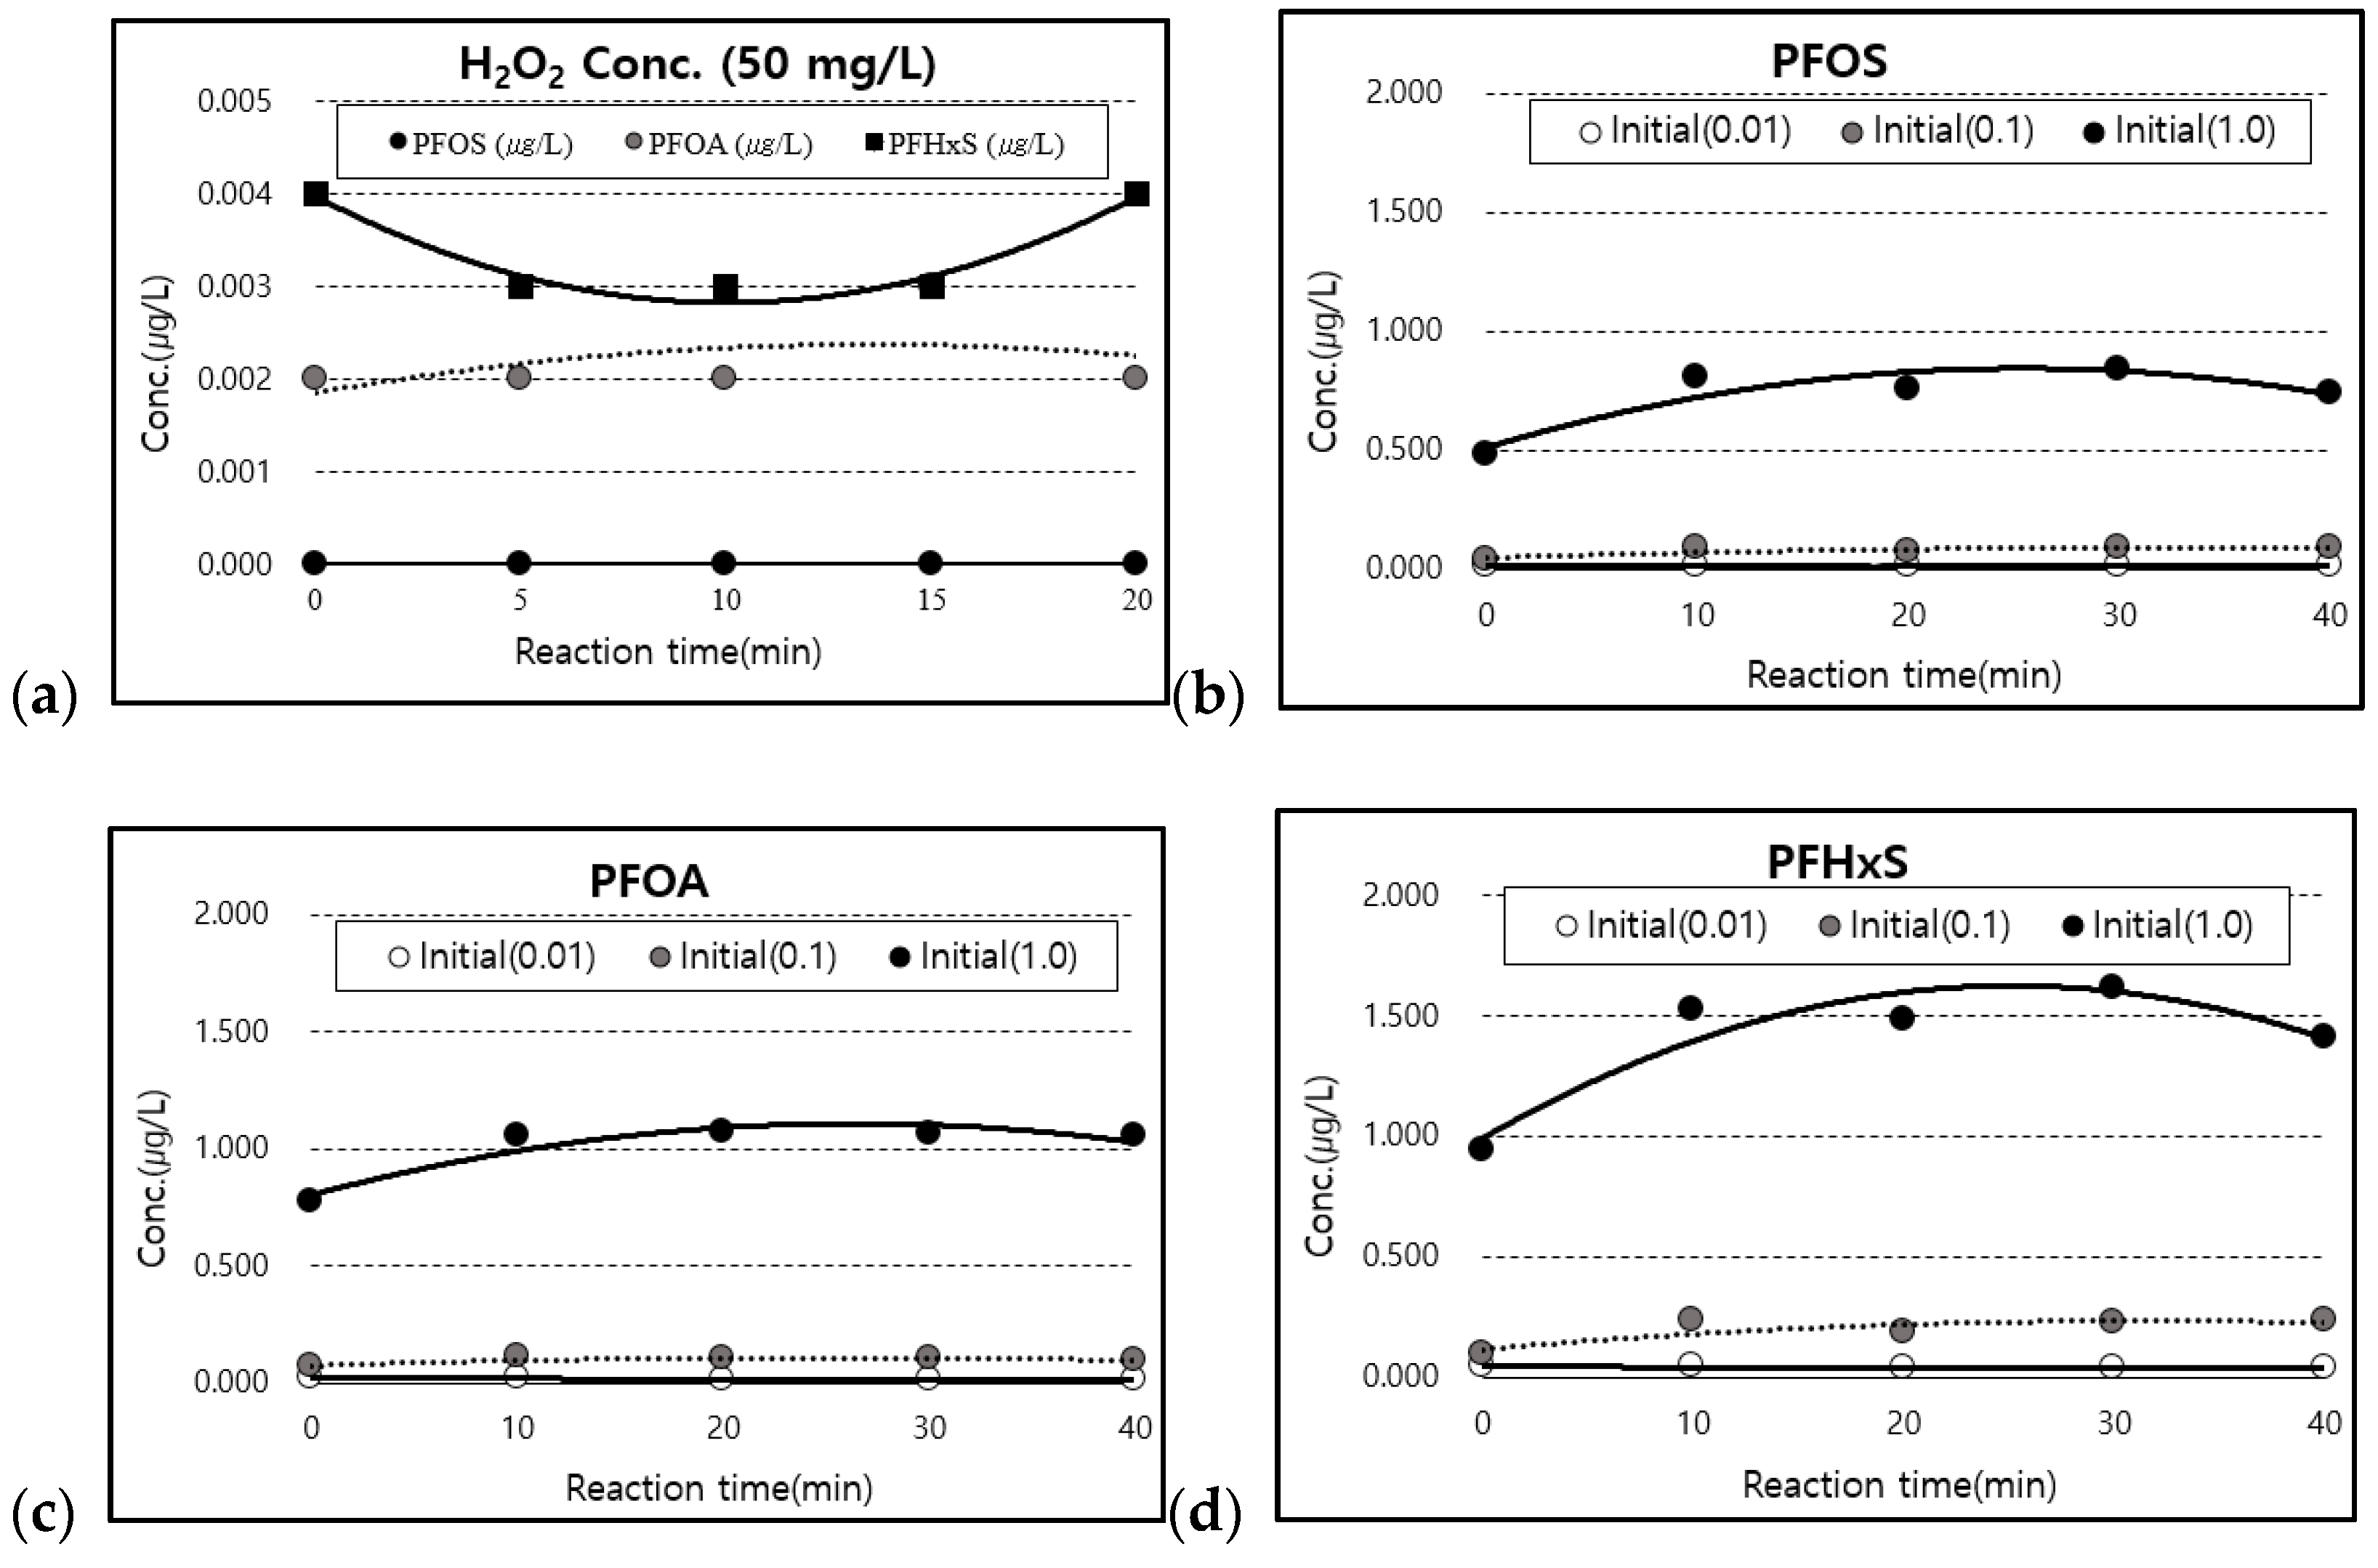
3.3. Change in PFCs by UV/H2O2 with and without Spiking PFCs

Perfluorinated compounds (PFCs) are fully fluorinated organic compounds, which have been used in many industrial processes and detected in wastewater and sludge from municipal wastewater treatment plants (WWTPs) around the world [6]. The experiment was conducted in an STP using tertiary-tested water, and very low PFCs were detected in most samples, except perfluorohexanesulphonic acid (PFHxS). The dominant PFCs were PFOS, PFOA, and PFHxS, while other PFCs were not detected. The concentrations of PFOS were zero in the actual tested water, and after spiking PFCs with a standard acid solution, the tested water was measured in the range of 0.012–0.8 μg/L. The highest concentration was detected in effluent samples, indicating almost no removal of PFOS in this treatment process. PFOA detected in the actual water was very low, measuring around (0.001–0.003 μg/L). After spiking the solution, the range of concentration detected in the effluent was (0.017–1.073 μg/L). The removal percentage for PFOS was also very low, measuring about 7%. PFHxS was accumulated in effluent with a concentration of 0.004 μg/L, and PFHxS was detected to be the highest PFC in tertiary-treated water. Therefore, the contamination of PFCs from an STP effluent could originate from various sources, such as domestic wastewater (possibly from cleaning and care of surface-treated products). The investigation between the relation of PFOS, PFOA, and PFHxS contaminants using domestic wastewater-related items should be checked. Figure 4 shows concentration patterns of PFCs in the STP effluent with and without the addition of the PFC solution. The contribution patterns of both PFOS and PFOA loads were quite similar, and PFHxS was different. It was likely that significant sources of PFHxS in contaminated STP effluents were from non-domestic wastewaters going to the STPs. The graph also shows the H2O2 effect on the degradation of PFC concentrations.

3.4. Effect of O3 and O3/UV on the Change in CODMn and CODCr

Ozone (O3) and the ozone ultraviolet (O3/UV) combined advanced oxidation process (AOP) can decompose organic matter, and hydroxyl radicals (·OH) with strong oxidation are generated in the reaction process to remove organics. Three different ozone feed rates were applied: 2.7, 4.8, and 5.8 mg/L/min, and the ozone consumption increased according to the ozone feed rate. Figure 5a,b show the removal effect of CODCr and CODMn by the ozone process. When the ozone feed rate was 5.8 mg/L/min, the degradation of CODCr and CODMn was the highest (89.8% and 74.3%, respectively); however, when O3/UV was applied, these removal efficiencies increased to 91.6% and 77.2%, respectively. The combination of O3/UV is much more efficient than processes involving ozonation alone. However, the ozone feed rate and ozone reaction time affect the decomposition of organic pollutants and can achieve high removal efficiencies. On the other hand, the O3/UV process can generate more hydroxyl radicals to degrade organic pollutants [42]. The combination process of ozonation and UV radiation generates a large amount of hydroxyl radicals, and the degradation rate also increased accordingly.

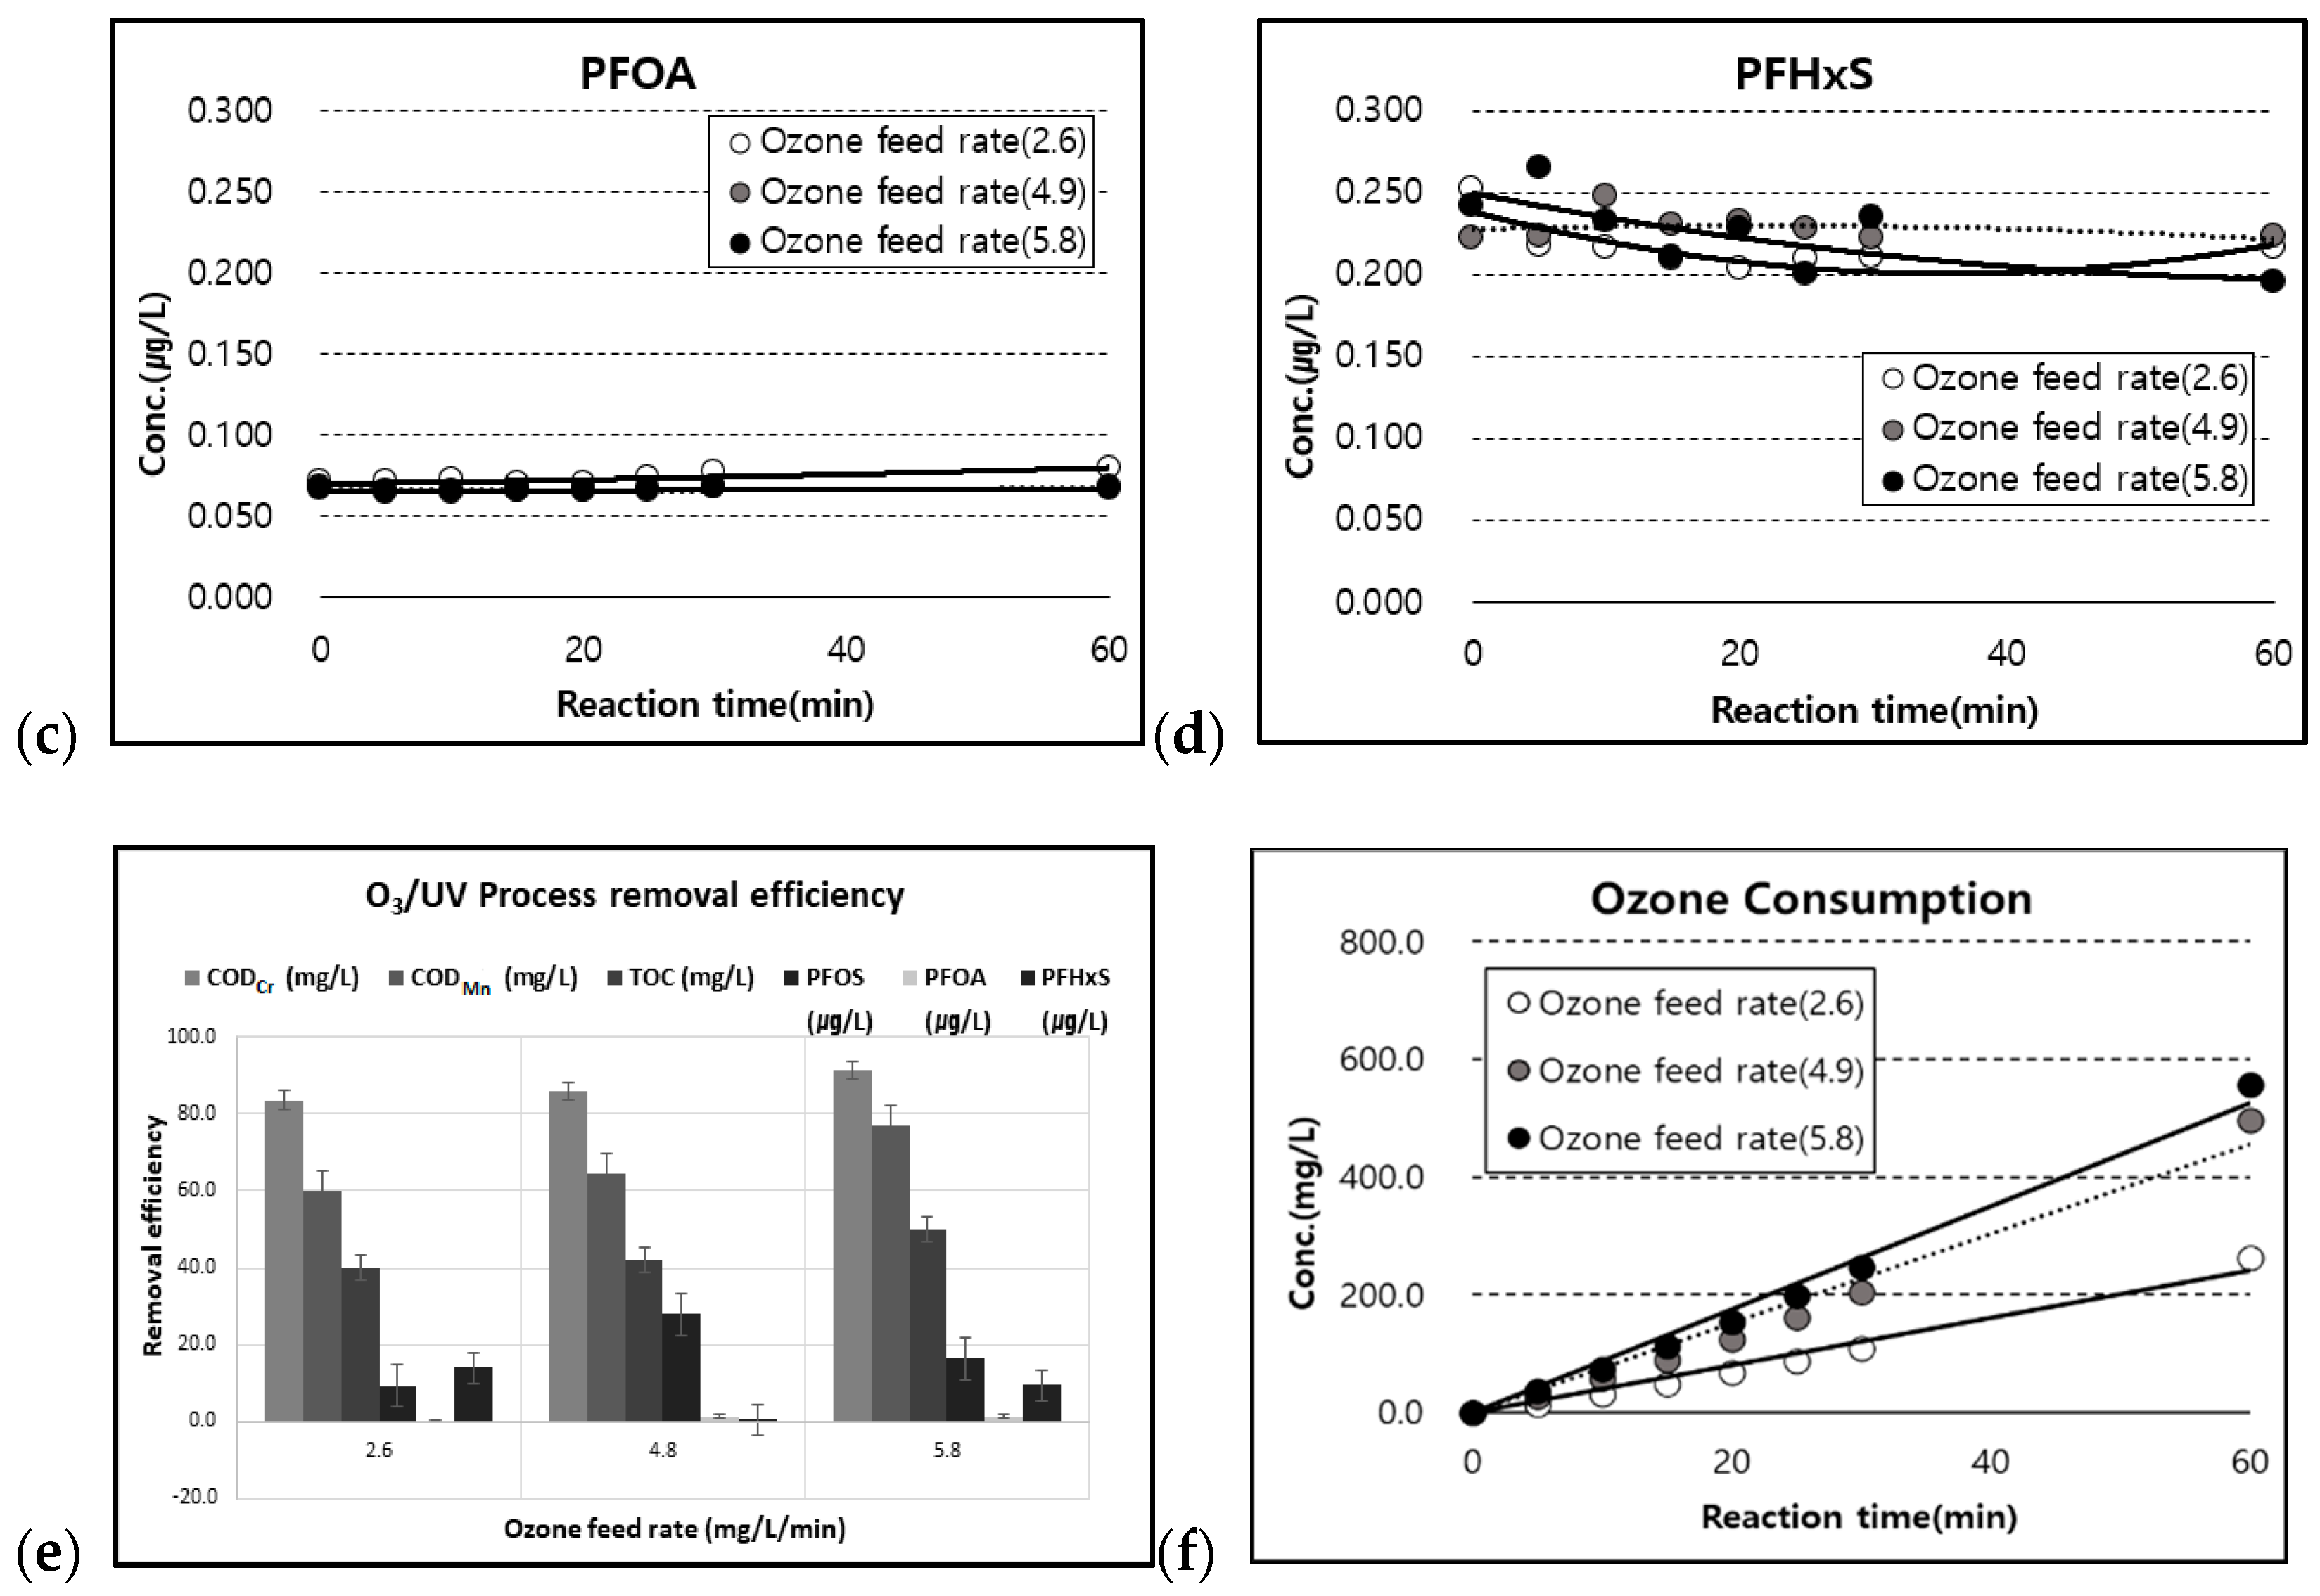
3.5. Effect of O3 on the TOC and PFCs Concentration

Figure 6 shows that when the O3 dosage increased from 2.7 to 5.8 mg/L/min, the efficiency of removing TOC increased from 34.5 to 50%. The degradation of total organic carbon reached up to half compared to the ozone feed rate. Although the comparative experiment showed that there was a similar mineralization effect when PFOs were treated with O3 and O3/UV alone, the degradation rate of PFOs by the above methods was proportional to the initial concentration. It is well known that PFOSs have high chemical and thermal stability [30,43], and these properties make PFOSs non-biodegradable pollutants that are difficult to be removed by the ozone oxidation process.

3.6. Effect of O3/UV on the TOC and PFC Concentration

Figure 7 shows the increment of ozone consumption and the degradation of TOC concentration. The experimental results showed that the progress of removing TOC by O3 alone was not pronounced. In the process of O3 reaction alone, TOC reached about 38.5% mineralization after 30 min, However, nearly 50% mineralization was achieved after 30 min using O3/UV. The degradation rate of the O3/UV process increased with the increase in the ozone feed rate and reaction time. The effect of O3/UV can realize the efficient and stable decomposition of organic pollutants in complex water bodies, and the treatment capacity is considerably improved compared to the single ozone oxidation process [44]. From this O3/UV process, refractory organics can be degraded, and the biodegradability of wastewater can be increased, making it difficult to degrade and remove POF compounds [13]. As a result, it is possible to convert the carcinogenic and harmful contaminants in an aquatic environment [45,46]. Presently, trace organic pollutants are frequently detected in domestic sewage treatment plant effluent. They are stable and difficult to degrade, and traditional biological processes cannot guarantee the removal rate. Since O3 and O3/UV are known strong oxidants, the AOPs can effectively control the micro pollution of organic compounds. Consequently, ozonation and UV-based photolytic treatment methods showed less effectiveness for the degradation and mineralization of PFOS due to the presence of strong carbon–fluoride bonds [30]. Therefore, the effect of ozone-based advanced oxidation with H2O2 is expected to assist the degradation of TOC. The results were obtained on a domestic wastewater treatment plant in a pilot system at high degradation efficiency by O3/H2O2 of tertiary-treated effluent.

4. Conclusions

The degradation of organic pollutants and change in concentration of PFCs in tertiary-treated sewage effluent using different initial H2O2 concentrations during the UV/H2O2 process were investigated. The effects of UV, the addition of H2O2, and the reaction time effects on the removal efficiency of organic compounds were demonstrated in the present work during the UV/H2O2 process. The organic parameters (CODCr, CODMn, and TOC) show 91%, 77%, and 50% removal efficiency, respectively. Additionally, the degradation rate of UV254 and H2O2 with UV energy for UV/H2O2, both UV254 and TOC show good removal efficiency. In the present work, the potentiality of ozone-based advanced oxidation process treatment of wastewater samples contaminated with low concentrations of PFC (below 1 µg/L) was experimentally investigated. The final effluent was also evaluated according to the PFC parameters (PFOS, POFA, PFHxS) and their change in concentration reported during the process. The PFCs were detected in a very low range and, due to PFCs’ non-biodegradable property, were ineffective in removing the PFCs in WWTPs in most cases. A similar phenomenon was observed in the change concentration of PFCs during this process. Among the similar reaction time length of PFOS and PFOA, PFHxS had to increase in concentration. The concentration of PFCs increased after the UV/H2O2 processes could be identified due to the degradation of the PFC precursors.

Author Contributions

J.A.: sample collection, sample analysis, writing, and original draft preparation; J.-y.L.: conceptualization, investigation, methodology, and resources; H.-J.H., I.G.Y., D.-H.H., C.-M.P. and M.-Y.L.: analysis and investigation; I.K.: conceptualization, investigation, methodology, resources, supervision, and funding acquisition. All authors have read and agreed to the published version of the manuscript.

Funding

The authors are very grateful for the funds [Project, NRF-2021K1A4A8A01079319] provided by the “National R&D Program through the National Research Foundation of Korea (NRF) funded by the Ministry of Science and ICT”.

Institutional Review Board Statement

Not applicable.

Informed Consent Statement

Not applicable.

Data Availability Statement

Not applicable.

Conflicts of Interest

The authors declare no conflict of interest.

Abbreviations

CODCrchemical oxygen demand by dichromate
CODMnchemical oxygen demand by permanganate
TOCtotal organic carbon
AOPadvanced oxidation process
UVultraviolet
STPsewage treatment plant
PFCperfluorinated compound
PFHxSperfluorohexanesulphonic acid
PFOSperfluorooctanesulfonic acid
PFOAperfluorooctanoic

References

  1. Escher, B.I.; Fenner, K. Recent advances in environmental risk Assessment of transformation products. Environ. Sci. Technol. 2011, 45, 3835–3847. [Google Scholar] [CrossRef] [PubMed]
  2. Brucker-Davis, F.; Thayer, K.; Colborn, T. Significant effects of mild endogenous hormonal changes in humans: Considerations for low-dose testing. Environ. Health Perspect. 2001, 109, 21. [Google Scholar] [PubMed] [Green Version]
  3. Hutchinson, T.H.; Ankley, G.T.; Segner, H.; Tyler, C.R. Screening and testing for endocrine disruption in fish-biomarkers as “signposts,” not “traffic lights,” in risk assessment. Environ. Health Perspect. 2006, 114, 106. [Google Scholar] [CrossRef] [PubMed] [Green Version]
  4. Huerta-Fontela, M.; Galceran, M.T.; Ventura, F. Occurrence and removal of pharmaceuticals and hormones through drinking water treatment. Water Res. 2011, 45, 1432–1442. [Google Scholar] [CrossRef] [PubMed]
  5. Kolpin, D.W.; Barbash, J.E.; Gilliom, R.J. Occurrence of pesticides in shallow groundwater of the United States: Initial results from the National Water-Quality Assessment Program. Environ. Sci. Technol. 1998, 32, 558–566. [Google Scholar] [CrossRef] [Green Version]
  6. Lu, H.; Li, Q.; Feng, W. Application Progress of O3/UV Advanced Oxidation Technology in the Treatment of Organic Pollutants in Water. Sustainability 2022, 14, 1556. [Google Scholar] [CrossRef]
  7. Rizzo, L.; Malato, S.; Antakyali, D.; Beretsou, V.G.; Gernjak, W. Consolidated vs. new advanced treatment methods for the removal of contaminants of emerging concern from urban wastewater. Sci. Total Environ. 2019, 655, 986–1008. [Google Scholar] [CrossRef]
  8. Wang, J.; Zhuan, R. Degradation of antibiotics by advanced oxidation processes: An overview. Sci. Total Environ. 2019, 701, 135023. [Google Scholar] [CrossRef]
  9. Lee, Y.; Gerrity, D.; Lee, M.; Bogeat, A.E.; Salhi, E.; Gamage, S.; Trenholm, R.A.; Wert, E.C.; Snyder, S.A.; Gunten, U.V. Prediction of micropollutant elimination during ozonation of municipal wastewater effluents: Use of kinetic and water specific information. Environ. Sci. Technol. 2013, 47, 5872–5881. [Google Scholar] [CrossRef]
  10. Cerreta, G.; Roccamante, M.A.; Patricia, P.B.; Oller, I.; Aguera, A.; Malato, S.; Rizzo, L. Advanced treatment of urban wastewater by UV-C/free chlorine process: Micro-pollutants removal and effect of UV-C radiation on trihalomethanes formation. Water Res. 2019, 169, 115220. [Google Scholar] [CrossRef]
  11. Boulanger, B.; Vargo, J.D.; Schnoor, J.L.; Hornbuckle, K.C. Evaluation of perfluorooctane surfactants in a wastewater treatment system and in a commercial surface protection product. Environ. Sci. Technol. 2005, 39, 5524–5530. [Google Scholar] [CrossRef] [PubMed]
  12. Schultz, M.M.; Higgins, C.P.; Huset, C.A.; Luthy, R.G.; Barofsky, D.F.; Field, J.A. Fluorochemical mass flows in a municipal wastewater treatment facility. Environ. Sci. Technol. 2006, 40, 7350–7357. [Google Scholar] [CrossRef] [PubMed] [Green Version]
  13. Lim, C.; Kim, H.; Han, G.; Kim, H.; Hwang, Y.; Kim, Y. Behavior of perfluorinated compounds in advanced water treatment plant. J. Korean Soc. Water Wastewater 2020, 34, 323–334. [Google Scholar] [CrossRef]
  14. Higgins, C.P.; Field, J.A.; Criddle, C.S.; Luthy, R.G. Quantitative determination of perfluorochemicals in sediments and domestic sludge. Environ. Sci. Technol. 2005, 39, 3946–3956. [Google Scholar] [CrossRef]
  15. Giesy, J.P.; Kannan, K. Global distribution of perfluorooctane sulfonate in wildlife. Environ. Sci. Technol. 2001, 35, 1339–1342. [Google Scholar] [CrossRef] [PubMed]
  16. Berger, U.; Järnberg, U.; Kallenborn, R. Perfluorinated alkylated substances (PFAS) in the European Nordic environment. Organohalogen Compd. 2004, 66, 4046–4052. [Google Scholar]
  17. Saito, N.; Harada, K.; Inoue, K.; Sasaki, K.; Yoshinaga, T.; Koizumi, A. Perfluorooctanoate and perfluorooctane sulfonate concentrations in surface water in Japan. J. Occup. Health 2004, 46, 49–59. [Google Scholar] [CrossRef] [Green Version]
  18. Sinclair, E.; Taniyasu, S.; Yamashita, N.; Kannan, K. Perfluoroctanoic acid and perfluorooctane sulfonate in Michigan and New York waters. Organohalogen Compd. 2004, 66, 4069–4073. [Google Scholar]
  19. Hansen, K.J.; Johnson, H.O.; Eldridge, J.S.; Butenhoff, J.L.; Dick, L.A. Quantitative characterization of trace levels of PFOS and PFOA in the Tennessee River. Environ. Sci. Technol. 2002, 36, 1681–1685. [Google Scholar] [CrossRef]
  20. Taniyasu, S.; Kannan, K.; So, M.K.; Gulkowska, A.; Sinclair, E.; Okazawa, T.; Yamashita, N. Analysis of fluorotelomer alcohols, fluorotelomer acids, and short- and long-chain perfluorinated acids in water and biota. J. Chromatogr. A 2005, 1093, 89–97. [Google Scholar] [CrossRef]
  21. Lien, N.P.H.; Fujii, S.; Tanaka, S.; Nozoe, M.; Tanaka, H. Contamination of perfluorooctane sulfonate (PFOS) and perfluorooctanoate (PFOA) in surface water of the Yodo River basin (Japan). Desalination 2008, 226, 338–347. [Google Scholar] [CrossRef]
  22. Yuan, F.; Hu, C.; Hu, X.; Qu, J.; Yang, M. Degradation of selected pharmaceuticals in aqueous solution with UV and UV/H2O2. Water Res. 2009, 43, 1766–1774. [Google Scholar] [CrossRef] [PubMed]
  23. Parsons, J.R.; Saez, M.; Dolfing, J.; de Voogt, P. Biodegradation of perfluorinated compounds. Rev. Environ. Contam. Toxicol. 2008, 196, 53–71. [Google Scholar] [PubMed]
  24. Stahl, T.; Mattern, D.; Brunn, H. Toxicology of perfluorinated compounds. Environ. Sci. Eur. 2011, 23, 38–52. [Google Scholar] [CrossRef] [Green Version]
  25. Bliss, J. Removal of PFOA from Water Using UV Treatment, Chemical Oxidation and Adsorption by Activated Carbon and Zeolites; Major Qualify Project, Worcester Polytechnic Institute: Worceste, MA, USA, 2012. [Google Scholar]
  26. Hori, H.; Hayakawa, E.; Einaga, H. Decomposition of environmentally persistent perfluorooctanoic acid in water by photochemical approaches. Environ. Sci. Technol. 2004, 38, 6118–6124. [Google Scholar] [CrossRef] [PubMed]
  27. Hori, H.; Yamamoto, A.; Hayakawa, E. Efficient decomposition of environmentally persistent perfluorocarboxylic acids by use of persulfate as a photochemical oxidant. Environ. Sci. Technol. 2005, 39, 2383–2388. [Google Scholar] [CrossRef]
  28. Chen, J.; Zang, P.; Liu, J. Photodegration of perfluorooctanoic acid 185nm vacuum ultraviolet light. J. Environ. Sci. 2007, 19, 387–390. [Google Scholar] [CrossRef]
  29. Pędziwiatr, P.; Mikołajczyk, F.; Zawadzki, D.; Mikołajczyk, K.; Oktan, A.B.S.K.N. Decomposition of Hydrogen Peroxide-Kinetics and Review of Chosen catalysts. Acta Innov. 2018, 26, 45–52. [Google Scholar] [CrossRef] [Green Version]
  30. Trojanowicz, M.; Bojanowska-Czajka, A.; Bartosiewicz, I.; Kulisa, K. Advanced Oxidation/Reduction Processes treatment for aqueous perfluorooctanoate (PFOA) and perfluorooctanesulfonate (PFOS)–A review of recent advances. Chem. Eng. J. 2018, 336, 170–199. [Google Scholar] [CrossRef]
  31. Aziz, K.H.H. Application of different advanced oxidation processes for the removal of chloroacetic acids using a planar falling film reactor. Chemosphere 2019, 228, 377–383. [Google Scholar] [CrossRef]
  32. Aziz, K.H.H.; Miessner, H.; Mueller, S.; Mahyar, A.; Kalass, D.; Moeller, D.; Khorshid, I.; Rashid, M.A.M. Comparative study on 2, 4-dichlorophenoxyacetic acid and 2, 4-dichlorophenol removal from aqueous solutions via ozonation, photocatalysis and non-thermal plasma using a planar falling film reactor. J. Hazard. Mater 2018, 343, 107–115. [Google Scholar] [CrossRef] [PubMed]
  33. Lado Ribeiro, A.R.; Moreira, N.F.F.; Li Puma, G.; Silva, A.M.T. Impact of water matrix on the removal of micropo lutants by advanced oxidation technologies. J. Hazard. Mater. 2019, 363, 155–173. [Google Scholar]
  34. Aziz, K.H.H.; Miessner, H.; Mahyar, A.; Mueller, S.; Kalass, D.; Moeller, D.; Omer, K.M. Removal of dichloroacetic acid from aqueous solution using non-thermal plasma generated by dielectric barrier discharge and nano-pulse corona discharge. Sep. Purif. Technol. 2019, 216, 51–57. [Google Scholar] [CrossRef]
  35. Liu, C.; Higgins, C.; Wang, F.; Shih, K. Effect of temperature on oxidative transformation of perfluorooctanoic acid (PFOA) by persulfate activation in water. Sep. Purif. Technol. 2012, 91, 46–51. [Google Scholar] [CrossRef]
  36. Campbell, T.Y.; Vecitis, C.D.; Mader, B.T.; Hoffmann, M.R. Perfluorinated surfactant chain-length effects on sono-chemical kinetics. J. Phys. Chem. A 2009, 113, 9834–9842. [Google Scholar] [CrossRef]
  37. Wang, S.; Yang, Q.; Chen, F.; Sun, J.; Luo, K.; Yao, F.; Wang, X.; Wang, D.; Li, X.; Zeng, G. Photocatalytic degradation of perfluorooctanoic acid and perfluorooctane sulfonate in water: A critical review. J. Environ. Sci. 2017, 328, 927–942. [Google Scholar] [CrossRef]
  38. Chen, M.-J.; Lo, S.-L.; Lee, Y.-C.; Kuo, J.; Wu, C.-H. Decomposition of perfluorooctanoic acid by ultraviolet light irradiation with Pb-modified titanium dioxide. J. Hazard. Mater. 2016, 303, 111–118. [Google Scholar] [CrossRef]
  39. Shu, Z.; Singh, A.; Klamerth, N.; McPhedran, K.; Bolton, J.B.; Belosevic, M.; El-Din, M.G. Pilot-scale UV/H2O2 advanced oxidation process for municipal reuse water: Assessing micropollutant degradation and estrogenic impacts on goldfish (Carassius auratus L.). Water Res. 2016, 101, 157–166. [Google Scholar] [CrossRef]
  40. Ulliman, S.; Miklos, D.; Hubner, U.; Drewes, J.E.; Linden, K.G. Improving UV/H2O2 performance following tertiary treatment of municipal wastewater. Environ. Sci. Water Res. Technol. 2018, 4, 1321–1330. [Google Scholar] [CrossRef]
  41. Kunacheva, C.; Tanak, S.; Fujii, S.; Boontanon, S.K.; Musirat, C.; Wongwattana, T.; Shivakoti, B.R. Mass flows of perfluorinated compounds (PFCs) in central wastewater treatment plants of industrial zones in Thailand. Chemosphere 2011, 83, 737–744. [Google Scholar] [CrossRef]
  42. Lu, D.; Sha, S.; Luo, J.; Huang, Z.; Zhang Jackie, X. Treatment train approaches for the remediation of per-and polyfluoroalkyl substances (PFAS): A critical review. J. Hazard. Mater. 2020, 386, 121963. [Google Scholar] [CrossRef]
  43. Derco, J.; Gotvajn, A.Z.; Cizmarova, O.; Dudas, J.; Sumegova, L. Removal of Micropollutants by Ozone-Based Process. Process 2021, 9, 1013. [Google Scholar] [CrossRef]
  44. Glaze, W.H. Drinking-water treatment with ozone. Environ. Sci. Technol. 1987, 21, 224–230. [Google Scholar] [CrossRef]
  45. Gao, P.; Cui, J.; Deng, Y. Direct regeneration of ion exchange resins with sulfate radical-based advanced oxidation for enabling a cyclic adsorption–regeneration treatment approach to aqueous perfluorooctanoic acid (PFOA). Chem. Eng. J. 2021, 405, 126698. [Google Scholar] [CrossRef]
  46. Nguyen, V.-H.; Smith, S.M.; Wantala, K.; Kajitvichyanukul, P. Photocatalytic remediation of persistent organic pollutants (POPs): A review. Arab. J. Chem. 2020, 13, 8309–8337. [Google Scholar] [CrossRef]
Figure 1. Schematic diagram of experimental setup.
Sustainability 14 05597 g001
Figure 2. (a) H2O2 degradation rate by initial H2O2 conc. (b) H2O2 degradation rate after spiking PFCs. (c) H2O2 degradation pattern by UV254.
Sustainability 14 05597 g002
Figure 3. (a) CODMn, (b) CODCr, (c) TOC degradation pattern by initial PFCs conc; and (d) UV dose according to the reaction time.
Sustainability 14 05597 g003
Figure 4. (a) PFC concentration changes in tertiary-treated effluent, (b) PFOS, (c) PFOA, and (d) PFHxS by UV/H2O2 (with spiking PFCs).
Sustainability 14 05597 g004
Figure 5. (a) Effect of ozone feed rate on the changes in CODMn and (b) CODCr, as well as the (c) effect of O3/UV on the change in CODMn and (d) CODCr.
Sustainability 14 05597 g005
Figure 6. Effect of ozone feed rate on the (a) TOC, (b) PFOS, (c) PFOA, and (d) PFHxS concentration.
Sustainability 14 05597 g006aSustainability 14 05597 g006b
Figure 7. The effect of ozone/UV on the (a) TOC, (b) PFOS, (c) PFOA, (d) PFHxS concentration; (e) the removal efficiency of the O3/UV process; and (f) ozone consumption.
Sustainability 14 05597 g007aSustainability 14 05597 g007b
Table 1. Characteristics of influent.
ParameterConcentration
pH6.80
Temp20–25 °C
CODCr (mg/L)23–27
CODMn (mg/L)21–32
TOC (mg/L)5.5–6.0
EC (μS/cm)350–355
PFOS (μg/L)0.000
PFOA (μg/L)0.001–0.002
Table 2. Analytical conditions of HPLC with online solid phase extraction (SPE).
PumpSPE PumpAnalytical Pump
ColumnBDS Hypersil C8
(I.D. 3.0 mm, × L 50 mm, 3.0 μm)
Accucore RP-MS
(I.D. 2.1 mm, × L 100 mm, 2.6 μm)
Mobile phaseA: Ammonium acetate
B: Methanol
A: Ammonium acetate
B: Methanol
Time (min)A %B %Time (min)A %B %
0–1.29820–1.2982
1.2–2.040601.2–1.3982
2.0–12.05951.3–15.0982
12.0–15.059515.0–15.1982
15.0–15.1982
Injection volume1 mL
Table 3. Analytical conditions in MS-MS.
ItemCondition
SourceElectrospray ionization (ESI)
PolarityNegative
Spray voltage (V)3500
Sheath gas (Arb)40
Vaporizer temperature (°C)325
Aux gas (Arb)10
Ion sweep gas (Arb)1
Collision energy (V)16.79, 10.27
Publisher’s Note: MDPI stays neutral with regard to jurisdictional claims in published maps and institutional affiliations.

