Article

A Framework of the Value Co-Creation Cycle in Platform Businesses: An Exploratory Case Study

1
Graduate Institute of Technology, Innovation and Intellectual Property Management, National Chengchi University, Taipei City 11605, Taiwan
2
Bachelor Degree Program of Digital Marketing, College of Business, National Taipei University, New Taipei City 23741, Taiwan
*
Author to whom correspondence should be addressed.
Sustainability 2022, 14(9), 5612; https://doi.org/10.3390/su14095612
Submission received: 31 March 2022 / Revised: 1 May 2022 / Accepted: 4 May 2022 / Published: 6 May 2022
(This article belongs to the Special Issue Sustainability and Artificial Intelligence)

Abstract

:
Platform businesses, linking producers and consumers, have emerged as a very important industry. Meanwhile, value co-creation has become one of the critical issues concerning the operation of platform enterprises and the focus of researchers in this area. Platform businesses usually need to strengthen the interactions between all participants to maximize the commercial value. However, the majority of the literature has concentrated on the “platform business–consumer” interaction only, i.e., both “platform business–producer” and “platform producer–consumer” interactions have been almost completely neglected. Consequently, this study aims to fill the research gap by investigating “all-around interactions” and the relationships between the interaction with the value co-creation performance. A holistic framework of the value co-creation cycle is developed and validated. One of the largest platform businesses in Taiwan was examined, and Google Analytics (GA) code was embedded into its information system for data generation. The results confirmed the proposed framework and hypotheses. The study concludes that platform businesses need to gain insight into producers and consumers through data tracking and analysis as well as to provide innovative services that elevate satisfaction, user loyalty, and usage frequency, with a final goal of establishing a cycle of value co-creation.

1. Introduction

Numerous industries (e.g., those involving social networks, big data, platforms, and the Internet of things) have emerged in the current era of explosive Internet growth [1]. Among them, platform businesses have emerged as a very important industry that significantly affects global economy. For example, almost all of the top-ten companies in the world in terms of market value, such as Google, Apple, Amazon, Facebook, etc., have platform-related businesses. In addition, among the worldwide top-five start-up firms in terms of estimated future market value, four out of five are platform enterprises. Therefore, we can see the importance of platform businesses. Uber and Airbnb are well-known examples.
Platform enterprises link the markets from different sides, mainly producers and consumers [2]. Technological advances have facilitated the formation of an information value loop involving value creation, and the Internet has been both a catalyst and stage for numerous new businesses that explored the possibilities of value co-creation [3]. As defined by Prahalad and Ramaswamy [4], value co-creation is the collaboration between customers and suppliers in the co-conceptualization, co-design, and co-development of new products [4,5,6]. Although it is sometimes mentioned that value co-creation is a broad and abstract concept [7], a good example may let us easily understand it. de Oliveira and Cortimiglia [7] illustrated the value co-creation process of the DesignStyle platform, a clothes production network. The platform offers a place for fashion designers (as one side) to publicize their designs. On the other side, users and consumers of the community, can vote for the designs they enjoy the most, give comments for design modification, suggest for more creative ideas, etc. Through the interaction process, the designers receive useful feedback from the community and then make improvements and return better designs back to consumers and the community. Consumers not only gain access to innovative and exclusive fashion items but also even participate in the profits accrued from the platform and the production network. Here, a process of value co-creation can be observed.
The context of platform businesses can also be found in other industries. The increasing reliance of consumers on co-created content such as online postings or recommendations when making purchasing decisions [8] also affects the operation of platform businesses. Specifically, integrated functions promote consumer interactions in the purchasing process [9]. Platform environments should be conducive to value co-creation such that products can be leveraged to create activities that offer value to consumers [10,11].
The development of the platform economy model facilitates the development of a linear chain of industry value into a structure comprising multivalent value networks, such as a commercial loop in which the overall value chain involves symbiotic connections that drive enterprises to take market-driven and customer-driven approaches. Value co-creation refers to the generation of value that emphasizes various supplier–consumer interactions in the established network [12]. In contrast with producers, platform businesses may encounter bilateral or multilateral participants and must establish activities that effectively stimulate same-side or cross-side network effects such that the operational scale can expand and profits can be made as intended.
As indicated earlier, value co-creation activities include the conceptualization, co-design, and co-development of new product activities. Two main concepts or objectives are involved: first, co-creation of consumption experiences is the core of the value created by the business and the consumer, and second, the interaction between the participants in the value network is the fundamental path to the realization of value co-creation [4]. Numerous studies have examined consumers’ motivations for participating in the value co-creation process (e.g., [13,14,15]). In addition, some studies from the perspective of the impact of technology application and resource integration on value co-creation [3,16]. There are also some studies that consider value co-creation as a part of business-model innovation or the strengthening of network externalities [12,17]. These studies reveal how enterprises and consumers create value together and explore its effects on firm performance.
Yu et al. [18] emphasized that value co-creation activities can strengthen the interactions between and co-creation among all the platform participants and gain maximal commercial value if platform enterprises can effectively manage them. However, it can be observed that studies on value co-creation in enterprises have mainly focused on “platform business–consumer” experiences and interactions according to the description above [13,19,20,21,22]. That means that both “platform business-producer” interaction and “producer–consumer” interaction have been ignored. Furthermore, how all stakeholders participate in value co-creation activities on a platform, as well as how the created value can be transferred back to the participants, is even less well understood. To bridge this research gap, we thus herein present a framework of the value co-creation cycle in platform businesses. This framework outlines the interaction effects among value co-creation activities and reflects the complex relationships in the commercial environment [23]. The feasibility of the framework is verified using actual data.
The remainder of this paper is organized as follows. Section 2 is a literature review of publications concerning the platform economy model and value co-creation. The developed framework and the hypotheses are presented in Section 3. The research design and methods are addressed in Section 4. The data analysis and summary of the results are in Section 5, and the conclusions and implications are in Section 6. Finally, we advance several strategic recommendations for enterprises interested in establishing a cycle of value co-creation.

2. Literature Review

2.1. Platform Economy Model

The platform economy model, which is relatively new, connects people, organizations, and resources to form an interactive ecosystem network of value creation [2]. Another essential function is the formation of linkages between or transactions among users to generate network effects. For example, the Uber platform connects drivers and passengers, the Airbnb platform connects hosts and guests, and the LinkedIn platform connects companies with job seekers. Such network effects are also called network externalities or demand-side economies of scale, meaning that the value of products or services rises with an increase in the number of customers using them. Van Alstyne et al. [2], based on the targets of networks, further categorize network effects into two types: same-side and cross-side effects. The same-side network effects are created when drawing users to one side helps attract more users to that side. For instance, as more people buy SONY’s PlayStation consoles, more new users will find it easier to trade games with their friends or find partners for online play [8]. Cross-side network effects imply that increasing the number of users on one side of the network makes it more (or less) valuable to the users on the other side. For example, in the transportation service platform, with more taxi drivers available, more new taxi riders will be expected. Shy [24] indicated that the first-mover advantage and winner-takes-all mechanisms are derived from network effects. Most platform businesses pay a high premium for the benefits of big data, the collection and application of which create a powerful and protective competitive barrier [25].
Van Alstyne et al. [2] listed three critical reasons why platform businesses succeed in replacing original industry players: First, platform businesses guide resources, whereas conventional businesses control them. Second, platform businesses place a premium on external interactions, whereas conventional businesses place a premium on internal activities. Third, platform businesses place a premium on ecosystem value, whereas conventional businesses do the same but for customer value. The researchers also articulated the relationships between ecosystem participants from an ecosystem perspective. As shown in Figure 1, the owner and the providers remain at the core of the platform ecosystem, and the producers and consumers are responsible for creating and using products, respectively.
Some other studies focused on the issue of business models and strategies of the platform enterprises. Eisenmann et al. [26] addressed the platform’s strategies for pricing and envelopment. Ali et al. [27] investigated one of the major characteristics of the platform business models- particularity. Cusumano et al. [28] analyzed how small platform start-ups can leverage external resources to create large economic rents and how incumbent firms need to conduct a “smart” portfolio management for both traditional and platform economies. Rietveld et al. [29] addressed the strategic thinking of leveraging complementors. Other researchers took the perspectives of ecosystems. Basoleand and Karta [30] looked specifically at the mobile system platform as a major research setting. Gawer [31] combined the concept of traditional engineering design and technology platforms and those of platform enterprises under new economies, emphasizing competition, and then was able to analyze dynamic changes between technology- and competition-based platforms, with another supply chain platform in the middle. The other research stream focused on the interactive relationship between platform enterprises and the stakeholders, particularly the complementors and partners. Zhu [32] mainly concerned how the platform businesses might “invade” the markets of complementors. Boudreau [33] investigated the degree to which the platform controls the stakeholders under the platform ecosystem, strictly or loosely?

2.2. Value Co-Creation

The products offered by most platforms are actually services. A study by Ramírez [34] on the service industry noted that “the service process needs to be established on the basis of collaboration between the producers and consumers,” suggesting that both producers and consumers contribute to service value creation in terms of both the process and outcomes. According to Grönroos and Voima [35], interaction is the behavioral track of value co-creation. The concept grounding service-dominant logic is that the consumers, enterprises, and other stakeholders are all resource integrators among whom the interaction process enables value creation [36].
As defined by Prahalad and Ramaswamy [4], value co-creation is the collaboration between customers and suppliers in the co-conceptualization, co-design, and co-development of new products [4,5,6]. In customer relationship marketing, value co-creation further manifests the paradigm shift in transitioning toward a consumer-centric product logic [37]. The researchers also advocated that the consumer is the driving force of firm capacity expansion, suggesting that instead of focusing on creating core products, enterprises should devote more efforts to the provision of resources and activities to maintain their collaborative relationships with consumers in the long term. Sheth [38] distinguishes seven different forms of value co-creation according to the value created by different participants.

2.2.1. Consumers Evolve Gradually from Users to Participants in Value Creation

As Prahalad and Ramaswamy [4] noted, as the business environment changes and networks develop, firm–consumer interactions become increasingly proactive. Through numerous channels, consumers can share their thoughts and opinions as well as resources such as time, knowledge, and skills with businesses, thereby promoting firm performance. This process gives both sides the opportunity to learn and grow. According to the service-dominant logic developed by Vargo and Lusch [5], consumers are starting to be regarded as value co-creators. The roles they play and the effects they generate have received considerable scholarly attention.

2.2.2. Higher Levels of Consumer Need and Satisfaction Are the Key Source of Power in Value Co-Creation

Theory Z, advanced by Maslow [39], presented the concept of the sixth level of needs, which transcends humanity and spiritual needs. Maslow asserted that physiological needs, safety needs, belonging and love needs, and social needs (levels 1–4 in his hierarchy of needs) can be met through product purchases and service use. For example, buying everyday products can satisfy one’s physiological needs, whereas buying luxury products can satisfy social needs. By contrast, these actions cannot easily result in self-actualization or self-transcendence, which are attained through actual experiences. The incentivization of consumer behaviors such as participation, creation, sharing, and altruism by platform businesses enables consumers to channel their resources into value co-creation.

2.2.3. The Level of Consumer Participation Affects Value Cocreation and Firm Competitiveness

As Lovelock and Wirtz [40] noted, the processes of service production and consumer participation are inseparable because of the co-occurrence of production and consumption, meaning that consumers participate in the transfer process of the services they receive. In platform businesses, the role of co-creator is naturally assumed when consumer participation is high; consumers’ preferences, interests, behaviors, and satisfaction (or lack thereof) are directly involved in the operational process. Firms are given real-time system feedback on consumer responses, allowing them to make timely adjustments. In short, this means that service value is co-created by the platform business and the consumers.

2.2.4. Sharing among Consumers Gives Rise to New Value Creation Models

As Basole and Rous [41] asserted, numerous researchers believe that end-consumers, who dominate the behaviors in the value network to maximize co-created value for their own interests, are the most essential part of value creation; furthermore, numerous activities in the value network are generated for value realization by end-consumers [42]. Thus, the one-way generation of consumer value should not be among enterprises’ operational goals. Instead, consumers should be encouraged to create the value they require by taking advantage of services on offer from firms; this in turn elevates the value the enterprise derives. However, if companies fail to properly handle consumer behavior (especially complaints), in addition to being unable to create value with consumers, Value co-destruction is more likely [43]. Yu et al. [18] pointed out that enterprises can use platforms and mechanisms to create platform participants to obtain better performance and feedback.

2.3. Summary and Research Gap

According to the literature review, we can observe that the majority of the literature has concentrated on the “platform business–consumer” interaction only, i.e., both “platform business–producer” and “platform producer–consumer” interactions have been almost completely neglected. In addition, most of the studies in this area are either conceptual or story-based articles without concrete evidence and data to support them. Consequently, this study aims to fill the research gap by investigating “all-around interactions”, including “platform business–consumer”, “business–producer”, and “producer–consumer” interactions and the relationships between each of interactions and the value co-creation performance. Thus, the research would develop a holistic framework of the value co-creation cycle in platform businesses. This effort and research direction echo the appeal by Yu et al. [18] that platform businesses should try to strengthen the interactions between and value co-creation among all platform participants in order to gain the maximal commercial value.

2.4. Development of Hypotheses

2.4.1. Platform Business and Platform Consumers

The incorporation of social, consumer-oriented features (e.g., ratings and suggestions for improvement) into platforms has gradually become an effective approach for increasing platform–consumer participation and interaction [18]. Through these social interactions, enterprises motivate consumer participation in similar activities to increase platform loyalty [44]. As Lin and Lu [45] observed, active network externalities attract more members and add value to the platform. Therefore, the following hypothesis is formulated.
Hypothesis 1 (H1).
Sustained efforts by platform businesses to innovate and optimize consumer-oriented functions and services effectively increase consumer satisfaction.

2.4.2. Platform Businesses and Platform Producers

The thinking of Vargo and Lusch [46,47,48,49] gradually evolved until they presented their conceptualization of a service ecosystem, which differs critically from past theories of value co-creation in that the focus is on stake-holders’ needs for co-created value within a diverse service system. Vargo and Lusch [36] argued that value co-creators act as resource integrators in the value co-creation process. Thus, resources are one of the critical elements in the value co-creation process. Therefore, the following hypothesis is presented.
Hypothesis 2 (H2).
The coordination of internal resources and external participants by platform businessesbased on producer needs motivates producers to provide more and better services.

2.4.3. Platform Producers and Platform Consumers

As Berghman et al. [50] advised, enterprises must build three competencies for new customer value creation: marketing practices for the absorption of external knowledge, organization-building capacity (according to consumer needs), and supply-chain and network development capabilities that reflect the importance of firm–consumer communication and interaction. Kim et al. [51] identified five critical elements: platform content, consumer support, user interface, brand reputation, and activity reward. The more abundant these resources are, the more effective they are in helping enterprises establish a digital brand on their platforms. Thus, the following hypothesis is advanced.
Hypothesis 3 (H3).
The more resources producers channel into a platform, the higher the level of consumer support is. Conversely, fewer resources correspond to lower consumer support.

2.4.4. Value Co-Creation Performance and Platform Businesses

The key differences between the platform economy model and conventional business models are in data collection, response, and application, as well as data externalities [52]; hence, platform businesses can effectively interact with consumers and create value through consumer experience and usage. Data externalities may serve to create new value for enterprises through organizational learning. Therefore, the following hypothesis is posited.
Hypothesis 4 (H4).
Because the resources they invest positively affect valueco-creation, platform businesses are provided with feedback on valueco-creation performance.

2.4.5. Value Co-Creation Performance and Platform Producers

Value co-creation can be defined as a series of implemented activities [11]. Underservice-dominant logic, value co-creators are resource integrators who support co-creation activities and interactions when services are rendered [53,54]. Therefore, the following hypothesis is postulated.
Hypothesis 5 (H5).
Because the resources they invest positively affect valueco-creation, platform producers are provided with feedback on valueco-creation performance.

2.4.6. Value Co-Creation Performance and Platform Consumers

Personal learning by consumers and organizational learning within enterprises are both essential components of the formation of the value co-creation system [11], meaning that the learning on both sides is instrumental in the construction of the value loop. Driven by the desire to derive maximum value from platform interactions, consumers increase their level of resource investment, learning and accumulating experience in the value co-creation process. This is similar to how enterprises strive to maximize the value of the co-creation system loop through continual learning. Thus, the following hypothesis is developed.
Hypothesis 6 (H6).
As the resources they invest positively affect valueco-creation, platform consumers are provided with feedback on valueco-creation performance.

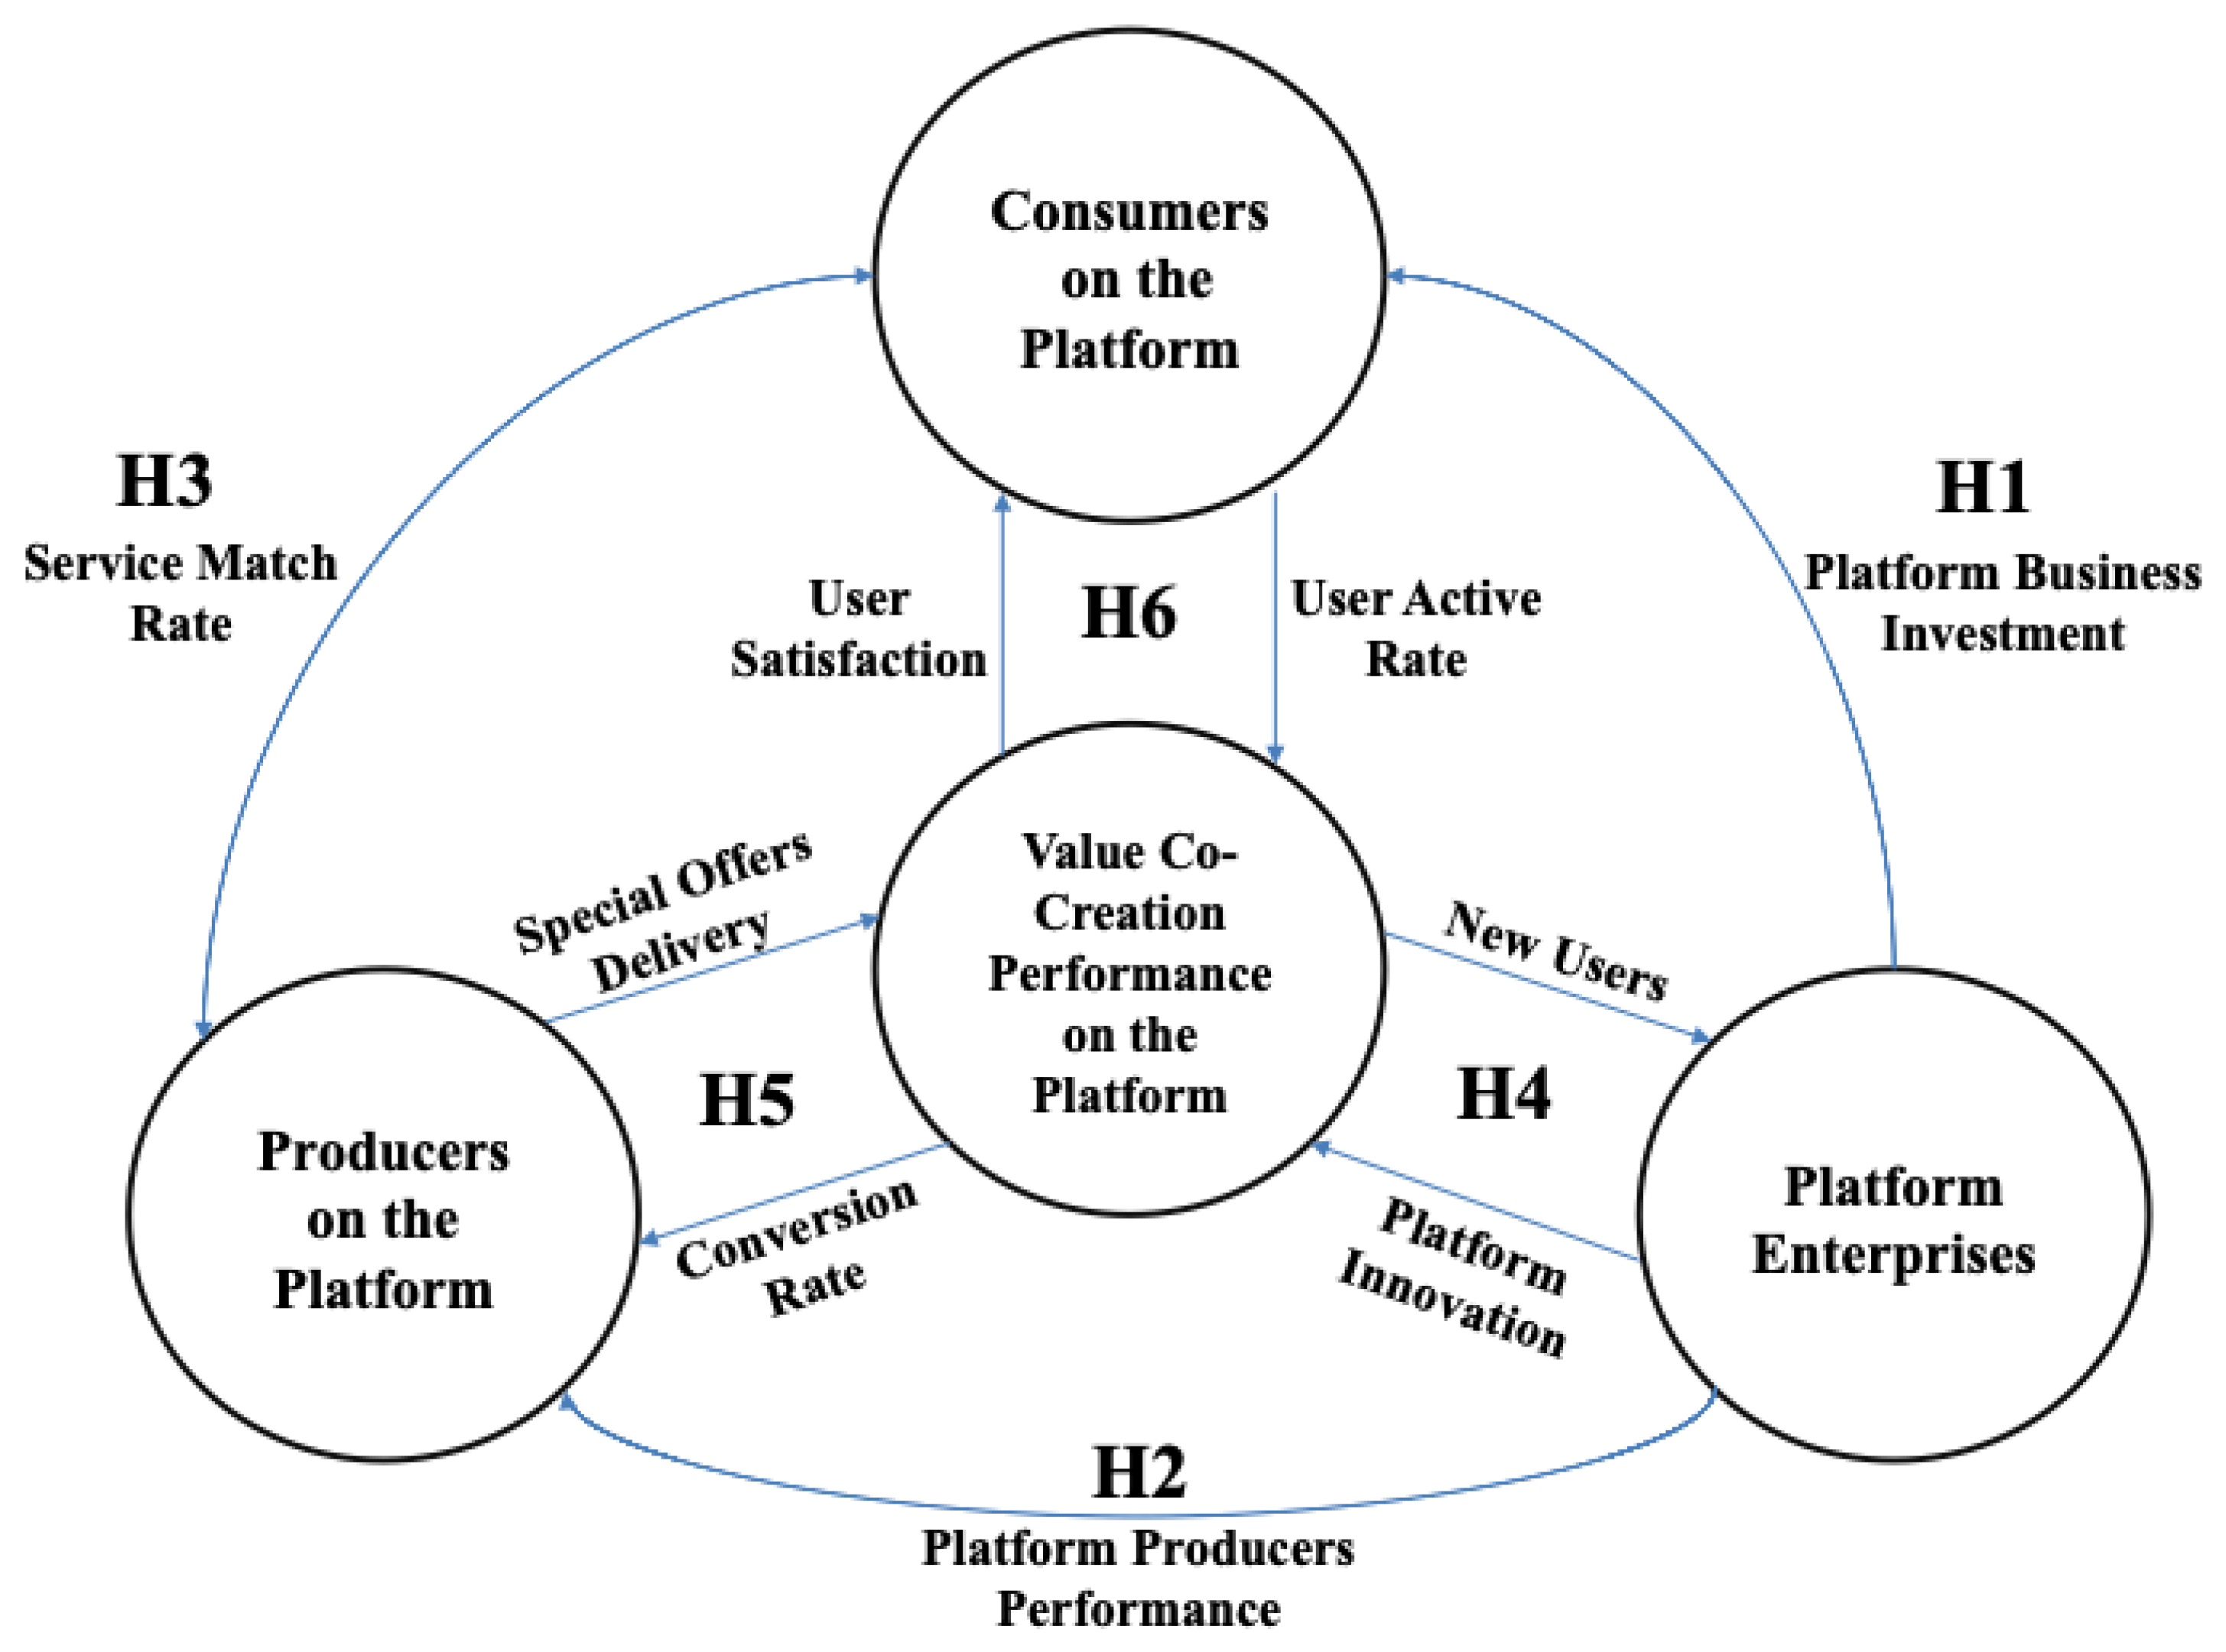
3. Research Framework

On the basis of the literature review, a cycle of value co-creation was established (Figure 2). This framework clearly illustrates how value co-creation can be realized through the interaction between the platform itself and platform participants (producers and consumers). Additionally, we formulated six hypotheses (H1–H6) to explain the relationship between the value co-created by platform businesses, platform participants, and the value co-creation cycle.

4. Research Methods

4.1. Research Design

Since the major goal of this study is to investigate “how” all stakeholders participate in value co-creation activities on platform enterprises, a qualitative approach is preferred for this type of “how”-oriented research [55,56]. Among the normal qualitative methods—case study, historical analysis, observation, and archive research—the first one, i.e., a case study method, was selected due to the requirement of extracting a detailed picture of the case regarding the mechanism of the value co-creation cycle. Yin [55] indicated that there are three types of case study: interpretive, descriptive, and explorative. Since the subject of this research has been little discussed, the study is viewed as exploratory in nature. Thus, a research process similar, but with modification, to the one suggested by Eisenhardt [56] for the exploratory study was employed. The research also adopted a purposive and theoretical sampling approach to select a platform enterprise that could best fit the specifications of the study [57,58]. We then further set four major criteria for the selection of the platform case: (1) a platform with digitization, (2) a platform enterprise with more than 5 years after its establishment (with sufficient data to be collected), (3) a platform firm with high economic and social impact, and (4) a platform company willing to intensively cooperate with the investigators and to provide the necessary data.

4.2. Case Background

The main subject of this study was Taiwan Taxi, one of the largest platform businesses in Taiwan. Bridging the “markets” on both sides of taxi services (i.e., the drivers and the passengers), this enterprise has generated same-side and cross-side network externalities through a considerable amount of effort. Taiwan Taxi’s market share is more than 25% of the domestic ride-hailing market, and more than 12 million unique passengers have used its services, making it the largest taxi fleet in Taiwan.
In 2016, Taiwan Taxi began to realize the importance of digital platforms to consumers and the convenience they bring, so it began to invest resources (including setting up a dedicated team and providing with necessary funds, etc.) to shift the focus of operation to the application (App). According to company statistics, its mobile application, 55688 App, has been downloaded more than 4.5 million times and membership exceeds 3.5 million individuals, of whom 2.5 million are active members. In 2018, its original App name was officially changed to 55688 Life Aid App, which means that not only are travel services provided on the App, but also other services for daily life are provided.

4.3. Sources and Collection of Data

The sources and methods used to collect data were as follows: (1) annual, quarterly, and monthly corporate reports, online articles, and commercial reports; (2) 12 in-depth interviews with senior managers of Taiwan Taxi; (3) repeat semi-structured interviews with the management personnel; (4) nonofficial follow-up interviews conducted by email or phone as well as observations; and (5) detailed operational data. Regarding the results, triangulation was used to ensure the factual accuracy, sensibility, and credibility of the data [59].
We interviewed the 10 heads of the departments associated with the decision-making and implementation of value co-creation in the company, which involved the use of outlines of the functions and decisions of which they are in charge. Specifically, triangulation was performed through the comparison and verification of interview content, corporate reports, online articles, and commercial reports. Since we have the intention to collect data for hypothesis test, we also worked very closely with the managers of Taiwan Taxi concerning the methods of the data collection (embedding Google Analytics code into the information system) and data items for the purpose of research.

4.4. Google Analytics

Google Analytics (GA), a free web analytics service provided by Google, has a user-friendly interface that allows for easy goal configuration and analysis. To analyze website data by using the GA tool, website managers are only required to embed GA code into the codes of the websites or applications of interest [60]. For website managers, the most vital and frequently used functions are those linked to the understanding of user behavior. This helps enterprises better understand the needs of online consumers, their core target segment.
The two fundamental purposes of GA are to measure the volume of traffic in each service category of company websites, including that of advertisements (i.e., view count), and determine the effectiveness of the conversion funnel—that is, tracking the conversion rate at each node when consumers enter platforms, with enterprises making timely adjustments to optimize the user experience. Collecting data through GA is an objective and accurate approach that is widely accepted by most firms [60]. The large amount of data collected by GA provides insight into the attributes of different users, thereby helping to increase the model conversion efficiency. Furthermore, cause–effect relationships among data analysis, service-specific conversion, value dimensions, and commercial value can be revealed by using large volumes of data [61].
The consumer purchase process is highly complex; steps before the completion of transactions include the generation of interest in products and the initiation of interactions with enterprises. This is the customer conversion rate. In offline situations, tracking the entire purchase process is challenging, inefficient, and error prone. By contrast, in the online world, which is characterized by advances in technology, numerous tools can be used to track user behavior, collect and analyze webpage browsing behavior data, compile data, and construct charts on relevant statistics. GA offers more than 100 types of charts—more than 1000 after cross-analysis—in its default settings and functions [62]. As Van Alstyne et al. [2] asserted, platform businesses that seek to optimize value creation must establish observation indicators such as interaction rate, participation level, and matching rate. We have embedded the GA code to the company’s 55688 App information system since 2016 in order to collect necessary research data. The following sections describe how GA code was embedded into the 55688 application for data collection.

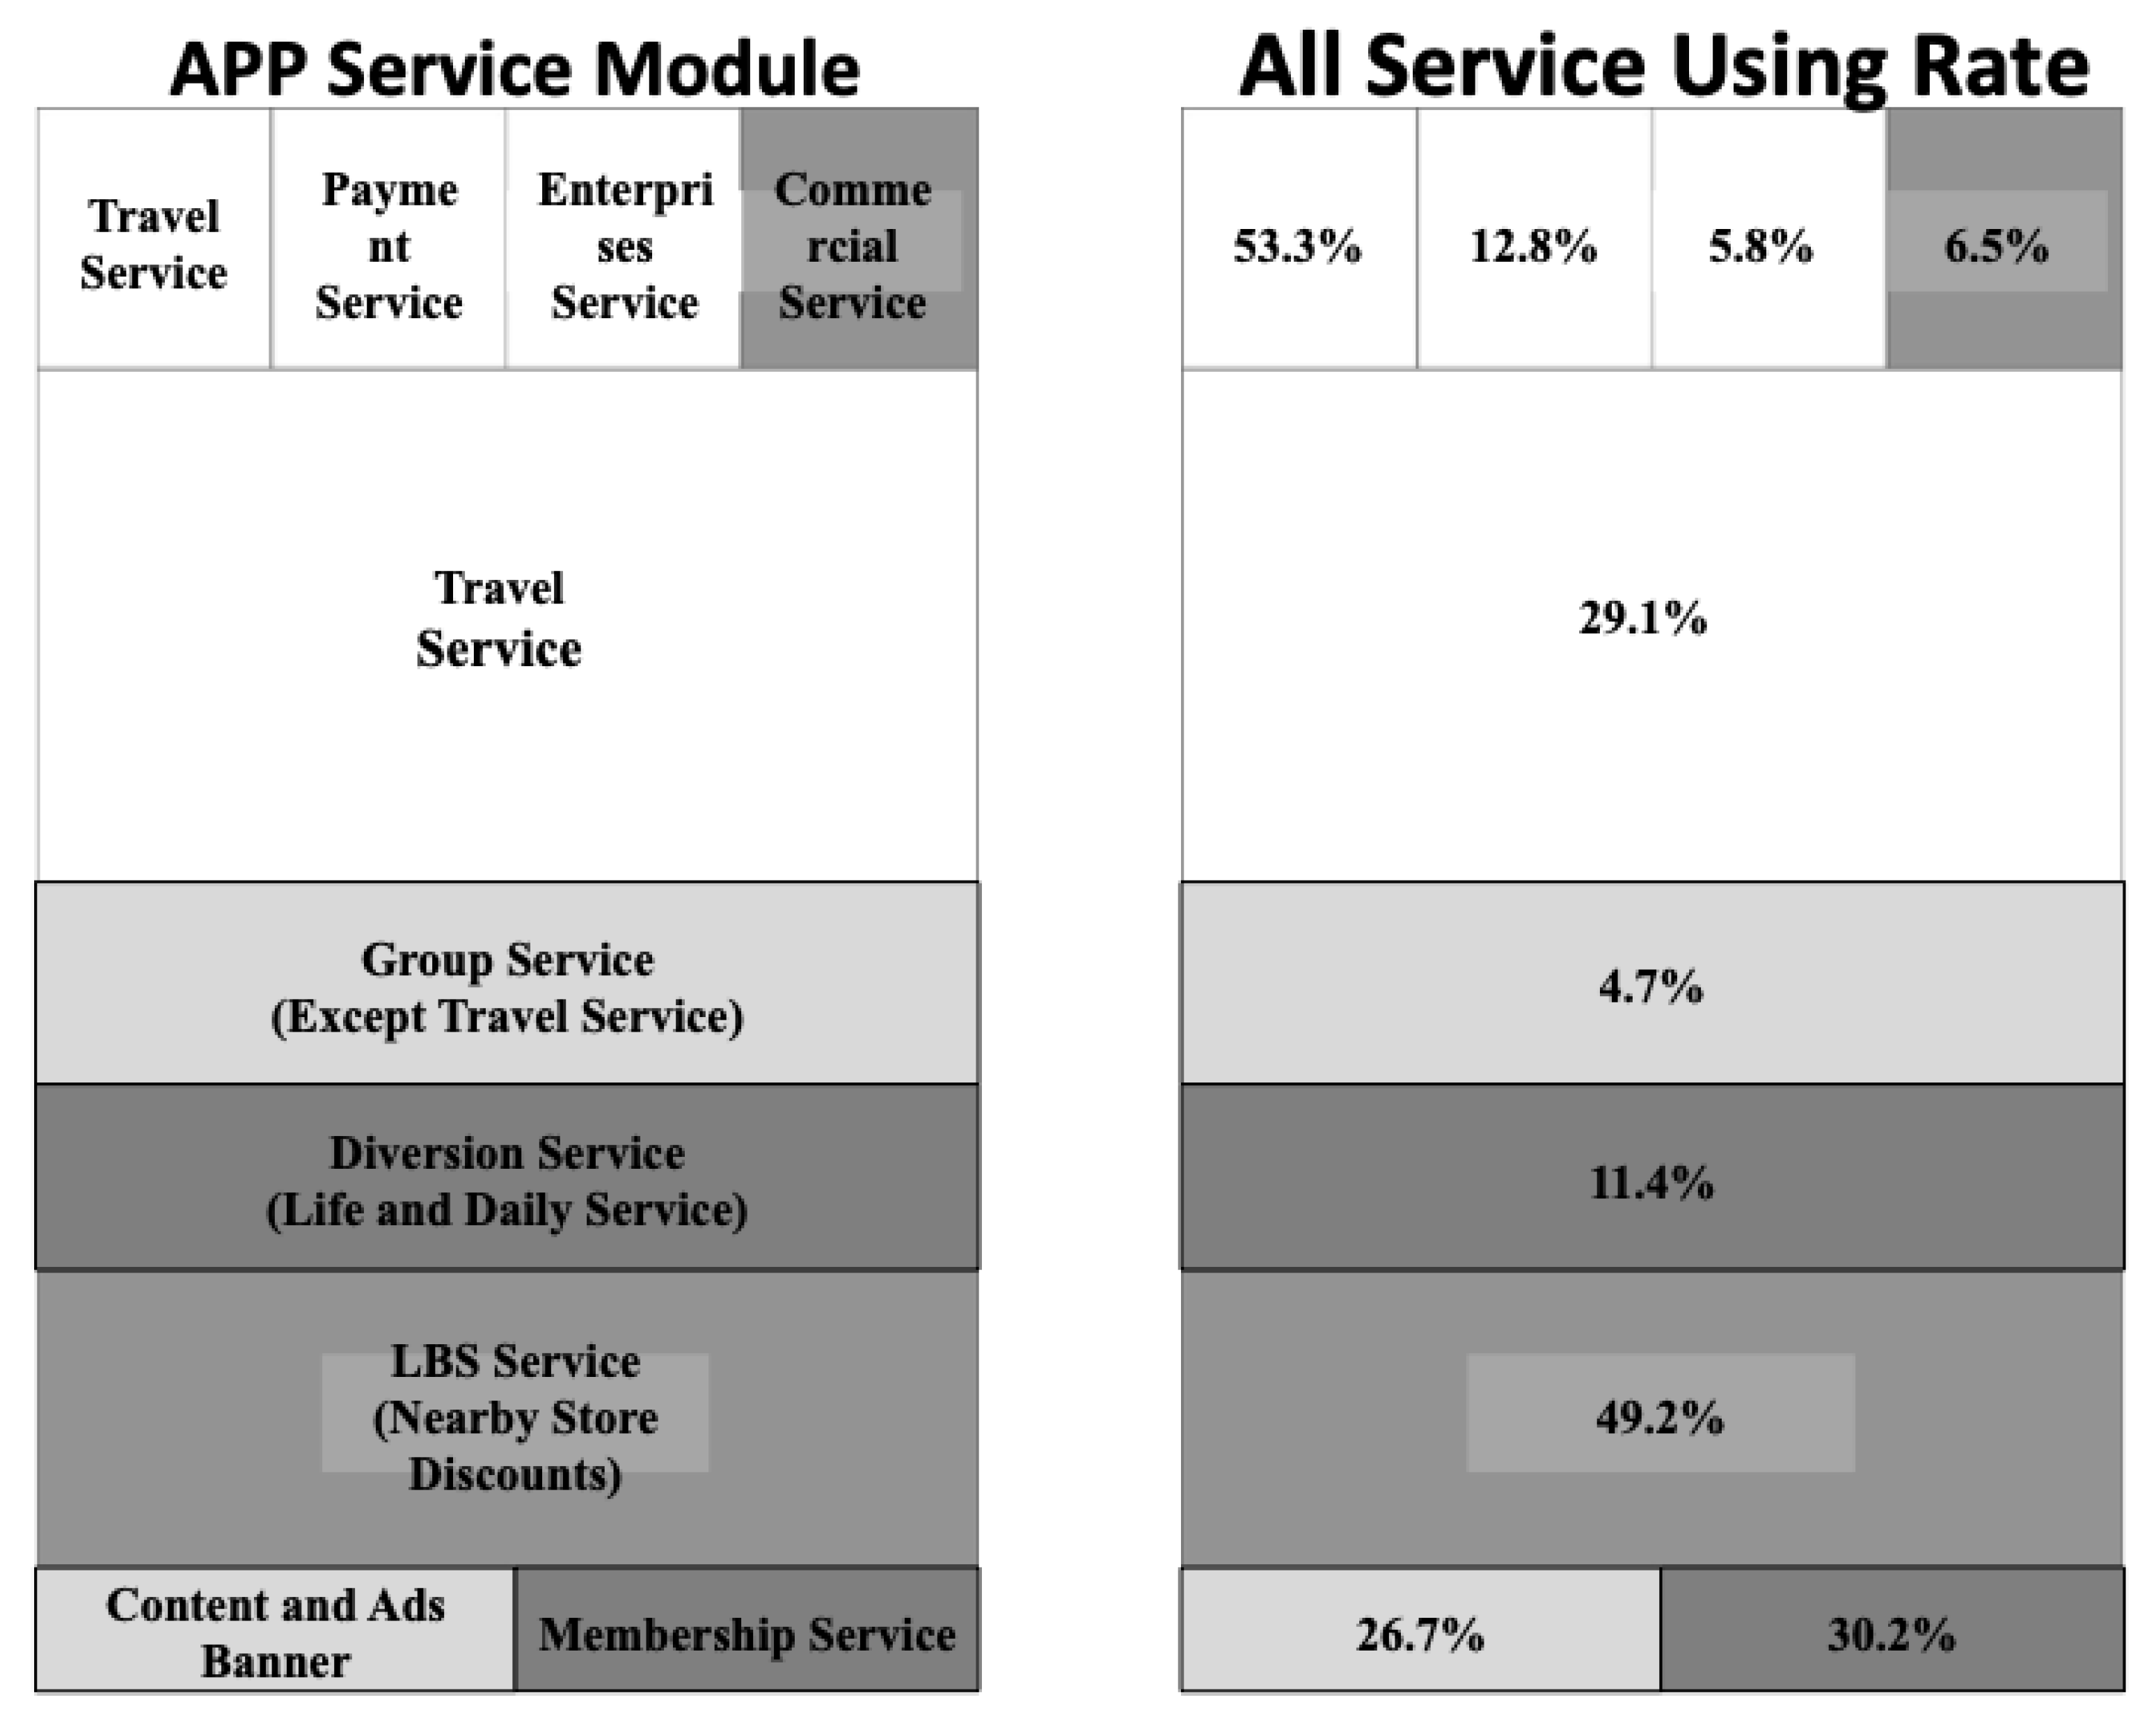
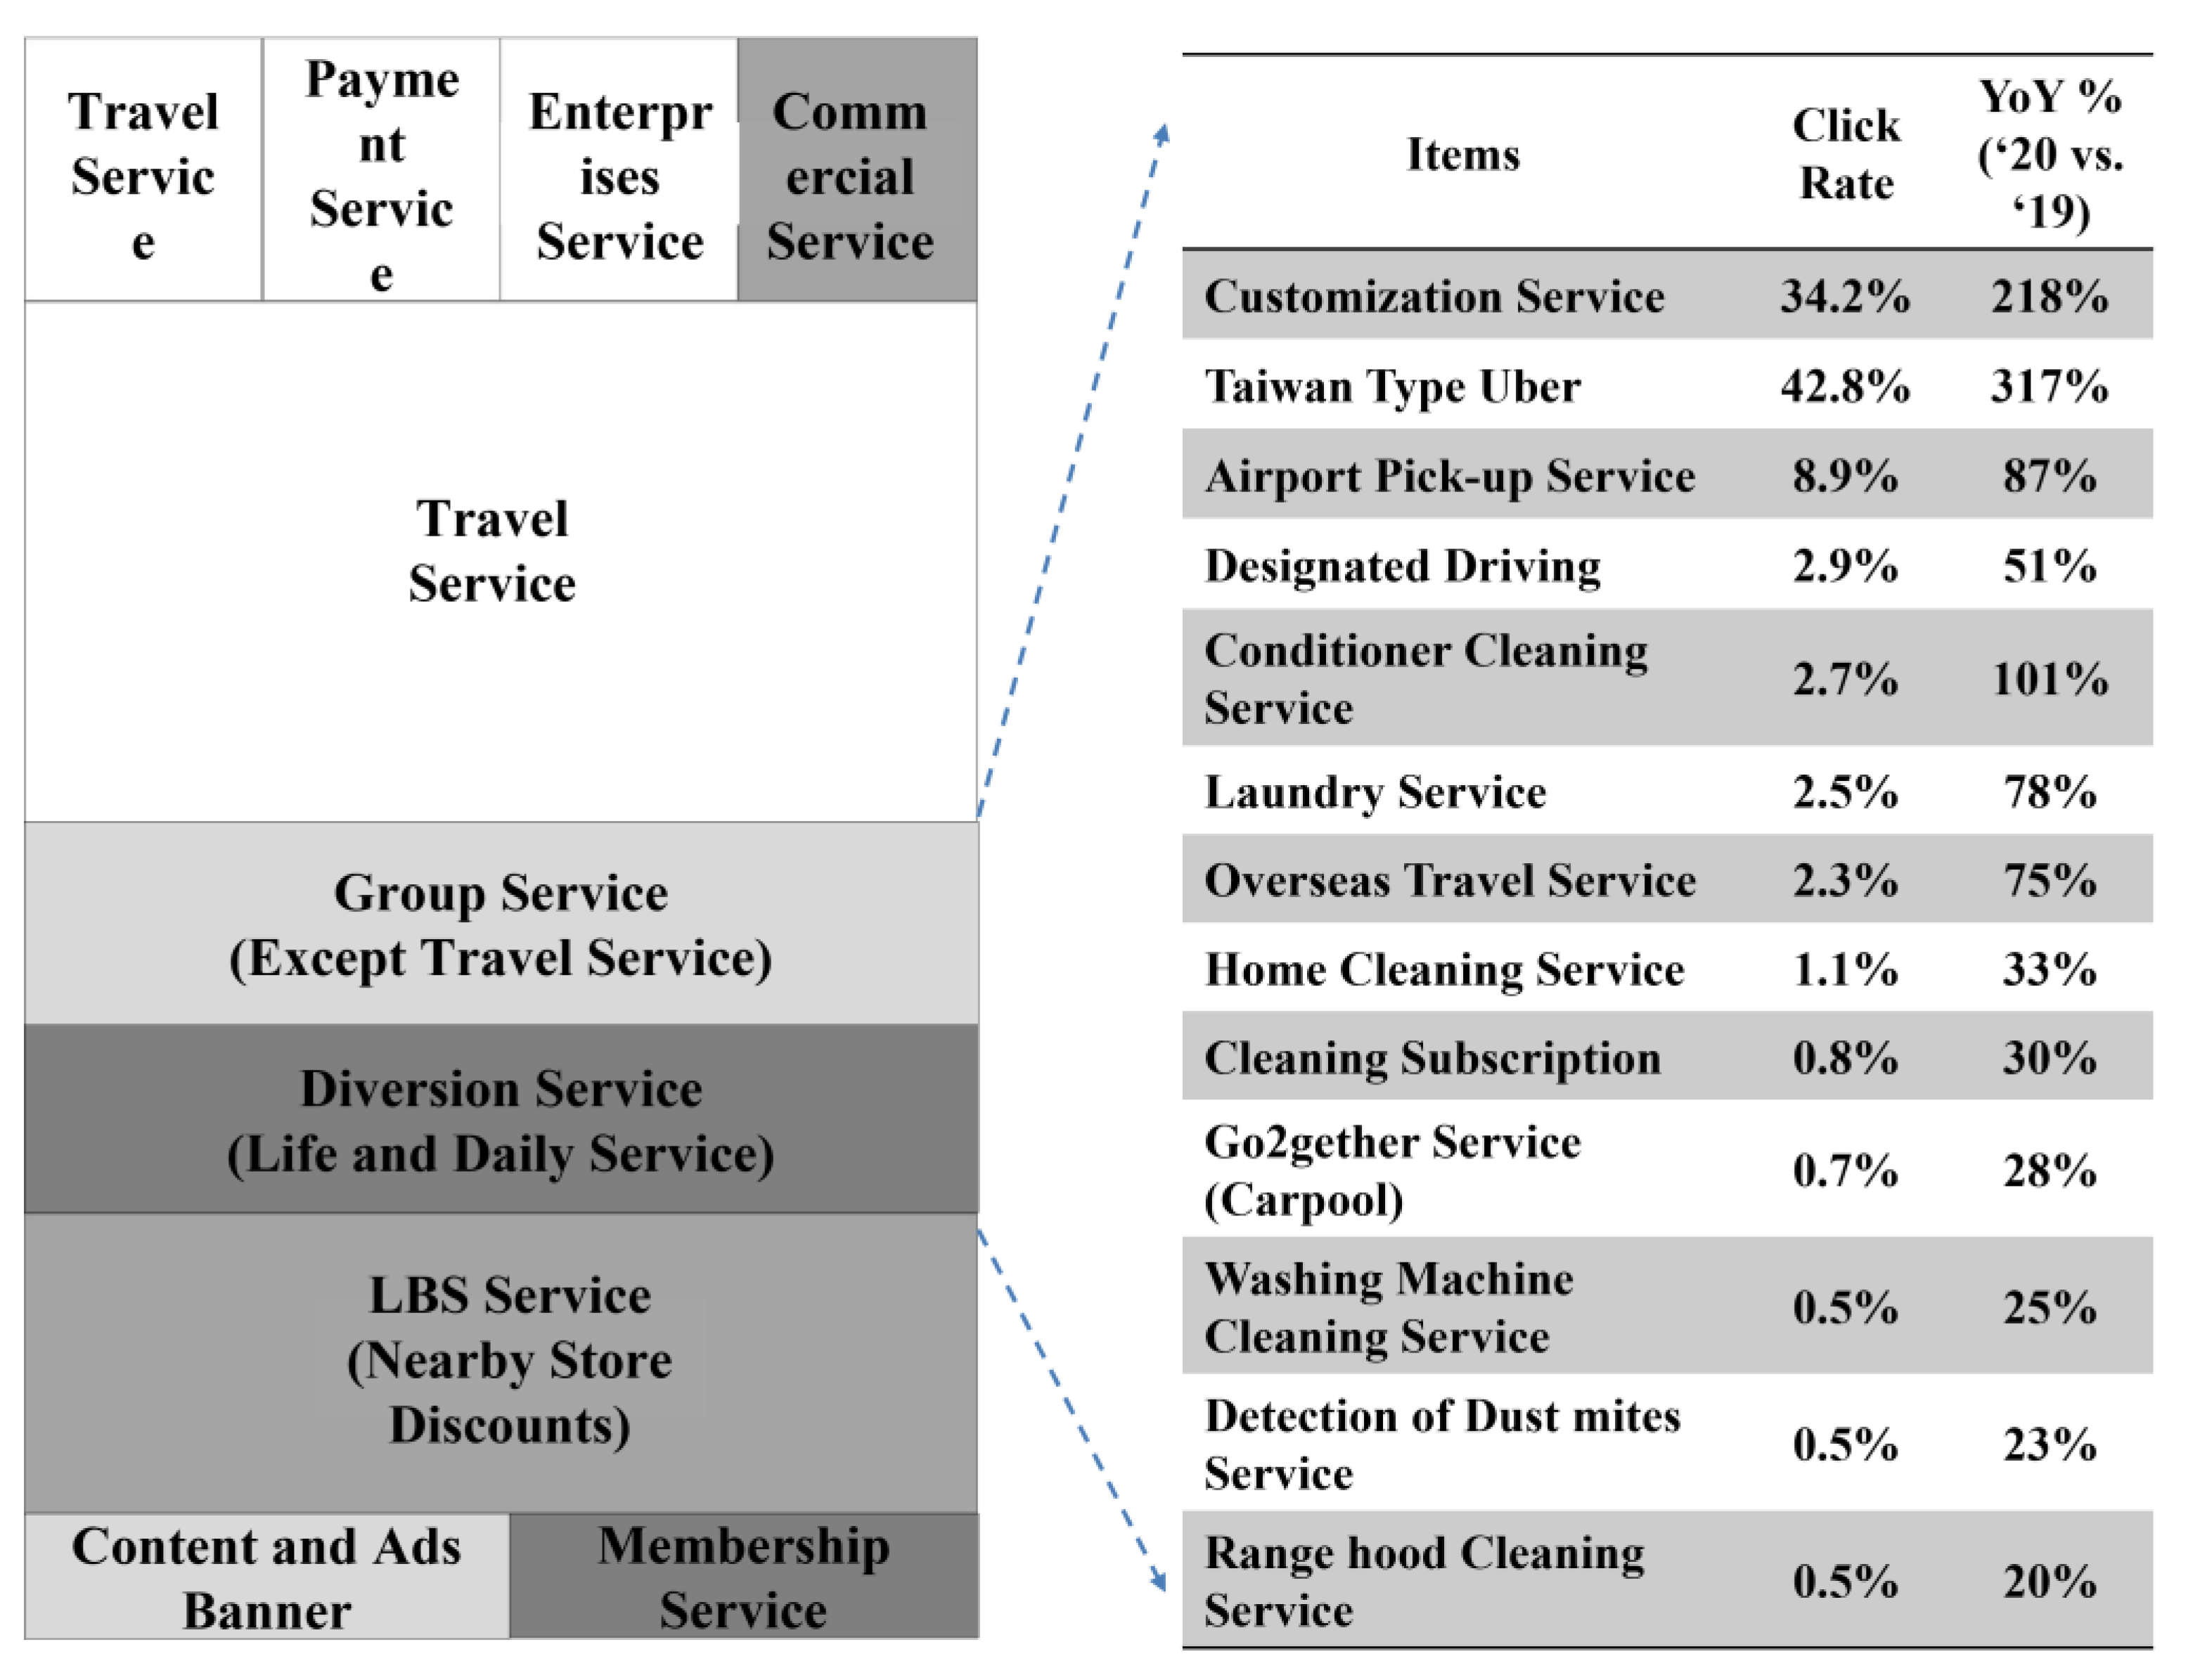
4.4.1. Relevant Data on 55688 Application Performance

The data were analyzed to determine which service categories, advertisements, and merchants (with value proposition) garnered the most interest. Application users include not only taxi passengers but also individuals who require any of the more than 40 assorted services offered, such as housekeeping, Wi-Fi rental, booking (for subsequent shoots), and car wash services. Other users may wish to rate drivers and merchants, share gifts, or collect premiums (e.g., discount codes and coupons offered by nearby merchants). Therefore, the overall application usage is substantially higher than when it only offered ride-hailing services. Furthermore, because consumer behavior varies with individual preferences, platform data are considerably diverse. The following data were collected on the 55688 application: (1) daily number of users, (2) daily click-through rate (CTR) of the homepage and each service category on the application, (3) daily CTR of the advertisement banners on the homepage and in each service category, (4) daily CTR of the co-op merchants on application maps, and (5) daily level of user satisfaction.

4.4.2. Basic Information on 55688 Application Users

Basic visitor data, along with trend observations, were used to investigate platform use and changes in user behavior. The benefits derived from value cocreation on the platform were explored through the understanding of usage frequency, return rate, and variations in usage time. The various services and differences in behavior among users can be analyzed by using GA data. The data from the start of collaborations between the platform owner and the producers (i.e., platform service suppliers) inform subsequent real-time adjustments and are also provided as feedback to producers. The goal is the optimization of platform services by the business and producers to address consumer needs and optimize the user and value creation experience. The following data on application users were collected: (1) daily locations, (2) daily segment attributes (e.g., gender, age group, and interests), (3) daily split ratio of existing and new users, (4) daily usage time, (5) daily usage frequency, (6) daily return visit rate, and (7) devices (e.g., mobile phones, landline telephones, tablet computers) or operating systems (e.g., Android, iOS, Windows) used to access the application on a daily basis.

4.4.3. Data on New Users of the 55688 Application

The data were used to determine the source of new users, the ratio of the new users referred by existing users, and the number of new users attracted through promotional activities by each platform producer (i.e., service supplier). The increase in new users is a critical indicator for platform businesses in general. In the past, new users were mainly attracted through marketing and advertising or recruited through subsidies, and recruitment outcomes and the proportion of new users referred by existing users were analyzed. The benefits users derive from promotions offered by producers are essential for evaluating value cocreation performance, as is as the number of new users attracted by the platform itself and the producers. The following data were collected on new application users: (1) daily number of new users, (2) daily number of new users referred by existing users, (3) daily number of new users attracted through application keywords, and (4) daily number of new users attracted through application promotion.

4.4.4. Application Data on Value Conversion

The number of members acquired through value cocreation, the increase in member usage frequency and the consumption of various services, the number of users who become members, and the number of linked credit cards can all be regarded as part of the benefits generated through value cocreation. Platform businesses strive to optimize the user experience as well as to prompt consumers to spend more or become members. Thus, the linking of credit cards may reflect consumers’ willingness to provide relevant feedback before engaging in value creation. The following application data on value conversion were collected: (1) daily number of users, (2) daily CTR of the homepage and each service category, (3) daily CTR of the advertisement banners on the homepage and in each service category, (4) daily CTR of the co-op merchants on the application, (5) daily user satisfaction level, (6) daily number of user to member conversions, and (7) daily number of credit cards linked to the application.

4.5. Measures and Analysis

The hypothesis 1 is concerned with the relationship between the sustained efforts of platform business and consumer satisfaction. The measures for the sustained efforts by platform businesses include the App team workforce, App upgrade frequency, ratio of taxi-booking via the App, and user satisfaction. Both the App upgrade frequency and App team workforce in 2018 and in 2019 will be compared with the averages of the previous year to see whether hypothesis 1 will be supported or not. Hypothesis 2 is concerned with the relationship between the efforts of platform business and the performance of producers (service producers). The consumers’ clicking frequency of non-taxi services will be measured as a proxy parameter for the efforts of platform business towards producers. The diversion ratio of App traffic to other non-travel services (number of services category) will be measured as an indicator of the platform producer performance. These two measures will be compared to check whether or not hypothesis 2 will be supported. Hypothesis 3 is concerned with the relationship between the efforts of platform producers and the user satisfaction. Considering the exclusion of the influence of seasonal factors, we will compare whether the proportion of users clicking on non-travel services has increased significantly in 2018 and 2019 to evaluate whether or not hypothesis 3 will be supported.
Hypothesis 4 is concerned with the relationship between the efforts of the platform enterprise and feedback on the value co-creation performance. The main measures of the value co-creation performance of the platform enterprise are the numbers of new users, new members, and new users bound with a credit card. We will see whether the aforementioned numbers in 2018 and 2019 are significantly higher than the averages of the previous year to judge whether or not hypothesis 4 will be supported. Hypothesis 5 is concerned with the relationship between the efforts of platform producers and feedback on the value co-creation performance. In this part, we will select a representative platform producer, i.e., ShopBack.com, and use actual marketing campaign result indicators, including the conversion rate, click-through rate, and marketing cost, and compare them with the usual benchmark results to see whether there is a significant gap and whether or not hypothesis 5 will be supported. Hypothesis 6 is concerned with the relationship between the efforts of consumers and feedback on the value co-creation performance. The key measures of the value co-creation of the platform consumers will be the numbers of active App users and the percentage. We will mainly use the active users’ activities and see whether the average active App users and the percentage are significantly higher than the previous averages to determine whether or not hypothesis 6 will be supported.

5. Results and Discussion

5.1. Platform Businesses and Platform Consumers

In 2020, Taiwan Taxi overhauled its application. The original application allowed only taxi booking services; by contrast, the current application (version 7.x) is the product of the consolidation of life services offered and these services include laundry, accommodation, education, and entertainment services. Dedicated operational and research and development units are responsible for continual upgrades and optimization to meet the needs of platform consumers; meeting such needs raises the application usage frequency and increases the satisfaction levels. As shown in Table 1, Taiwan Taxi invested substantially in the development of the application between 2014 and 2020 and upgraded it progressively more frequently each year. Moreover, the proportion of taxi bookings made from the application spiked from 20% in 2014 to 75% in 2020, and the level of user satisfaction was maintained at between 4.6 and 4.7 in 2019 and 2020. Thus, hypothesis 1 is supported.

5.2. Platform Businesses and Platform Producers

In Figure 3, the hit rate is the total hit rate in a given year, the number of individuals who made the hits represents those who accessed a particular service in a particular month, and the individual hit rate is the number of hits made by an individual divided by the total number of users. The last column presents the growth rate in 2018 and 2020. From the data on the right side of the figure, it is clear that various services, including multipurpose taxis, airport transport (including that for travel to and from Japan), designated driving, air-conditioner cleaning, laundry, overseas travel, and housekeeping, have seen considerable growth within the span of 1 year, as indicated by hit rates between the thousands and the tens of thousands. The consolidation of the application platform and application members for value co-creation with platform producers has achieved impressive results—that is, the original taxi-booking web traffic has been redirected to the services offered by platform producers. Thus, hypothesis 2 is supported.

5.3. Platform Producers and Platform Consumers

As shown in Figure 4, the application is customer centric; users can customize service shortcuts according to their individual needs in a block group. For example, they can place the most essential and frequently used service shortcuts on the application homepage. Furthermore, Taiwan Taxi allows users to customize the layout of the services relevant to them, thereby allowing for interactions between users and platform producers (i.e., service providers). This function has the highest overall usage rate, apart from the taxi-booking function. Thus, hypothesis 3 is supported.

5.4. Platform Businesses and Value Cocreation Performance

The feedback on value creation in platform businesses (Table 2) can be summarized as follows. First, the application membership grew substantially in 2018 and, at the end of 2020, reached 4.6 million. Second, the number of taxi bookings (the primary source of company revenue) made on the application increased considerably, from 1.2 million in 2014 to 10 million in 2020. Third, the number of people with credit cards linked to the application has increased to 650,000 people as of 2020, behind only those for the mobile payment services Line Pay and JkoPay. Fourth, the increase in membership has allowed Taiwan Taxi to acquire data on the corresponding increase in usage frequency, and the increase in the number of linked credit cards has elevated the quality of company data. Consequently, the business has experienced benefits and growth beyond increases in taxi bookings and the revenue they have generated. Thus, hypothesis 4 is supported.

5.5. Platform Producers and Value Cocreation Performance

The value co-created by Taiwan Taxi and the producer ShopBack.com in communication with platform consumers—specifically, online shopping enthusiasts—is shown in Figure 5. ShopBack, the number-one rewards-and-discovery platform in the Asia-Pacific region, enables shoppers across the region to shop ‘The Smarter Way”. It is a one-stop rewards-and-discovery platform for users to earn cashback while delivering performance-based marketing to merchants. Taiwan Taxi identified consumers suitable for communication through GA data analysis, placing advertisements and messages in appropriate locations in the 55688 application. The platform producers designed event pages and incentive mechanisms on the basis of recommendations from the platform business. In the final part of the cycle, the target segment (i.e., platform consumers) interacted through the event page.
The whole campaign with ShopBack attracted 1500 new members, and there were up to 6.7% of consumers who downloaded 55688 App, became members, and bound their credit card within the first week. Formerly, Taiwan Taxi took six months and spent more than USD 30,000 to reach a similar level of performance. The hit rate of CTR is usually between 0.1% and 0.2%. However, the hit rate of CTR in this campaign reached a high of 1.5%, indicating a significant difference. Thus, hypothesis 5 is supported.

5.6. Platform Consumers and Value Cocreation Performance

As shown in Table 3, the number of taxi bookings made on the application, as well as the number of taxi bookings made per person, increased substantially from 2018 onwards. This indicates that platform consumers are willing to continually invest their resources (e.g., time, money, and feedback) to engage in value co-creation on the platform. Given that the proportion of active application members has reached 76% (as of 2020), platform consumers appear to invest more in the platform as their level of satisfaction increases.
The high platform usage frequency allows the business to learn from the data and roll out new versions of the application that better fit user needs. The continual mutual learning between the two participants is instrumental in the formation of the value co-creation cycle. Thus, hypothesis 6 is supported.

5.7. Discussion

The study emphasizes the importance of “all-around interaction and value co-creation” in platform businesses and develop a holistic framework of a value co-creation cycle, with six hypotheses followed. Based on the collected data and analysis, this study has preliminarily validated all of the six hypotheses. Nevertheless, there are still several issues that need to be further discussed and interpreted.

5.7.1. All-Around Interactions in Platform Businesses Make Sense

The study has emphasized the importance of “all-around interaction and value co-creation” in platform businesses and developed a holistic framework of a value co-creation cycle, with six hypotheses followed. The preliminary support for each hypothesis means that participants on both sides can gain value from the interaction between each other and co-creation process. That means that the platform business needs to broaden its efforts and targets to gain the maximal value. The results preliminarily validate the concept suggested by Yu et al. [18]. Only focusing on “business–consumer” interaction in platform businesses may be too narrow for both academic researchers and industrial practitioners. In fact, Vargo and Lusch [47] also emphasize that the value should be looked at in terms of multi-dimensional and broader aspects.

5.7.2. Interaction Is Critical and Is a Part of Value Co-Creation Process

Six hypotheses of this study can be categorized into two parts. H1–H3 are related to the issue of interaction. H4–H6 are related to the issue of value co-creation. The support of all six hypotheses may suggest that both interaction and value co-creation are important. By looking back through previous studies, we can find both original research by Prahalad-Ramaswamy and Vargo-Lusch [4,5] that emphasize the importance of interactions for value co-creation. The former focused on “interaction via dialog”, the latter on “impact of interaction on service experiences”. Based on the results of this study, we would argue that interaction is only part of the value co-creation process and participants on each side have to contribute resources (such as knowledge, skill, concept, time, etc.) in order to drive the value co-creation process with feedback and with iterations and cycles. The relationship between interaction and the value co-creation might be conceptualized as a continuous process of “(side A) effort → interaction → value gained (side B) → efforts (interaction with-, and feedback to side A) → value gained (side A)”. The iterative, positive, and cyclic value co-creation process will make the accumulated value gain in not only an additive but also a multiplicative or even exponential way. In fact, de Oliveira and Cortimiglia [3] also emphasize the process perspective of value co-creativity.

6. Conclusions and Implications

The contributions of the present study are twofold. First, the cycle of value co-creation we established allows platform businesses to clearly understand the flow and circulation of value between participants. Going beyond an outline of the cycle or conceptual structure of value co-creation, as numerous investigations have been carried out, the present study validated each of the components of the cycle by using the concrete data. We also demonstrated that both platform consumers and producers constitute both the start and end of the value co-creation cycle.
Second, the findings serve as a valuable reference for the development of a value co-creation cycle in platform businesses. The results indicate that web traffic should not be the sole focus of these enterprises; high user loyalty stemming from high satisfaction, which can be developed through repeat usage or consumption, is the critical competitive factor.
Three strategic recommendations for the successful realization of the value co-creation cycle are presented as follows.

6.1. Data Tracking Such as GA and Behavioral Analysis Facilitate the Understanding of the Services That Platform Consumers Require

Notably, the present data were not sourced from observations or interviews but rather records of user behavior, which represent a reasonable basis from which to optimize the traffic flow of platform businesses through immediate responses and service adjustments. These changes generate more data to reveal the data externalities of the platform. Data and user externalities in networks are complementary in that they capitalize on the inherent competitive advantage of platform businesses. Studies have identified network externalities in organization technology or innovative adaptation [63,64,65,66,67]. The bilateral network externalities also constitute the phenomenon of economies of scale, which represents the product benefits derived by consumers gained from an increase in the number of producers (i.e., service providers), which in turn increases user satisfaction and usage frequency. Therefore, externalities in data and user networks can serve to generate more value in the co-creation cycle.

6.2. Increase Platform Loyalty through Service Innovation

Numerous studies (e.g., [68,69]) have noted that service innovation influences the perceived value of and user loyalty toward a website. To maintain a favorable level of user participation in value co-creation, platform businesses must devote themselves to the development of innovative services, which can be realized through the continual improvement of platform functions; function optimization can attract more new users.

6.3. Platform Businesses, Platform Producers, and Platform Consumers Should All Contribute to Value Creation, Transference, and Acquisition

Platform businesses should delegate the functions of value creation, transference, and acquisition to platform producers and consumers by using a well-designed structure of flow between each process. This would optimize the cycle of value co-creation, from generation to sharing to symbiosis.

6.4. Gain Sustained Advantage with the Facilitation of AI-Based Machine Learning Techniques

Although the information system, embedded with GA code, provides the platform enterprise with the capability to continuously monitor the customer behaviors, it still needs some personnel to periodically access the “backstage” to proceed the analysis manually. With the facilitation of AI-based machine-learning techniques, the information system can automatically execute the analysis and provide timely important analytic results, thereby elevating the platform enterprise’s sustained advantages.
Finally, because the study was subject to time and personnel limitations, we advise future researchers to adopt the following approaches.
(1)
Examine various types of platform businesses
In contrast with numerous platforms (e.g., e-commerce), the 55688 application caters to more rigid demands. Therefore, the investigation and comparison of various types of platform businesses is warranted.
(2)
Broaden interview scope
To increase the applicability of their findings, future researchers should broaden the scope of interviews with platform participants (e.g., producers or suppliers and consumers).

Author Contributions

Conceptualization, F.-S.W. and C.-C.T.; methodology, F.-S.W. and C.-C.T.; software, C.-C.T.; validation, F.-S.W. and C.-C.T.; formal analysis, F.-S.W. and C.-C.T.; investigation, C.-C.T.; resources, C.-C.T.; data curation, C.-C.T.; writing—original draft preparation, C.-C.T.; writing—review and editing, F.-S.W.; visualization, C.-C.T.; supervision, F.-S.W.; project administration, F.-S.W. and C.-C.T. All authors have read and agreed to the published version of the manuscript.

Funding

This research received no external funding.

Institutional Review Board Statement

Not applicable.

Informed Consent Statement

Not applicable.

Data Availability Statement

Not applicable.

Conflicts of Interest

The funders had no role in the design of the study; in the collection, analyses, or interpretation of data; in the writing of the manuscript, or in the decision to publish the results.

References

  1. French, A.M.; Shim, J.P. The digital revolution: Internet of things, 5G, and beyond. Commun. Assoc. Inform. Syst. 2016, 38, 38–40. [Google Scholar] [CrossRef] [Green Version]
  2. Van Alstyne, M.W.; Parker, G.G.; Choudary, S.P. Pipelines, platforms, and the new rules of strategy. Harv. Bus. Rev. 2016, 2016, 54–60. [Google Scholar]
  3. Payne, E.H.M.; Peltier, J.; Barger, V.A. Enhancing the value co-creation process: Artificial intelligence and mobile banking service platforms. J. Res. Interact. Market. 2021, 15, 68–85. [Google Scholar] [CrossRef]
  4. Prahalad, C.K.; Ramaswamy, V. Co-creation experiences: The next practice in value creation. J. Interact. Market. 2004, 18, 5–14. [Google Scholar] [CrossRef] [Green Version]
  5. Vargo, S.L.; Lusch, R.F. Evolving to a new dominant logic for marketing. J. Market. 2004, 68, 1–17. [Google Scholar] [CrossRef] [Green Version]
  6. Payne, A.; Storbacka, K.; Frow, P. Managing the co-creation of value. J. Acad. Market. Sci. 2008, 36, 83–96. [Google Scholar] [CrossRef]
  7. De Oliveira, D.T.; Cortmiglia, M.N. Value co-creation in web-based multisided platforms: A conceptual framework and implications for business model design. Bus. Horiz. 2017, 60, 747–758. [Google Scholar] [CrossRef]
  8. Tse, Y.K.; Zhang, M.; Doherty, B.; Chappell, P.; Garnett, P. Insight from the horsemeat scandal: Exploring the consumers’ opinion of tweets toward Tesco. Indus. Manag. Data Syst. 2016, 116, 1178–1200. [Google Scholar] [CrossRef]
  9. Hajli, N.; Wang, Y.; Tajvidi, M.; Hajli, M.S. People, technologies, and organizations interactions in a social commerce era. IEEE Trans. Eng. Manag. 2017, 64, 594–604. [Google Scholar] [CrossRef] [Green Version]
  10. Cayla, J.; Arnould, E.J. A cultural approach to branding in the global marketplace. J. Interact. Market. 2008, 16, 88–114. [Google Scholar] [CrossRef] [Green Version]
  11. Wang, C.; Zhang, P. The evolution of social commerce: The people, management, technology, and information dimensions. Commun. Assoc. Inform. Syst. 2012, 31, 105–127. [Google Scholar] [CrossRef]
  12. Cova, B.; Salle, R. Marketing solutions in accordance with the S-D logic: Co-creating value with customer network actors. Indus. Market. Manag. 2008, 37, 270–277. [Google Scholar] [CrossRef]
  13. Payne, A.; Storbacka, K.; Frow, P.; Know, S. Co-creating brands: Diagnosing and designing the relationship experience. J. Bus. Res. 2009, 62, 379–389. [Google Scholar] [CrossRef]
  14. Roberts, D.; Hughes, M.; Kertbo, K. Exploring consumers’ motivations to engage in innovation through co-creation activities. Eur. J. Market. 2014, 48, 147–169. [Google Scholar] [CrossRef] [Green Version]
  15. Xie, C.; Bagozzi, R.P.; Troye, S.V. Trying to prosume: Toward a theory of consumers as co-creators of value. J. Acad. Market. Sci. 2008, 36, 109–122. [Google Scholar] [CrossRef]
  16. Schreieck, M.; Wiesche, M. How Established Companies Leverage IT Platforms for Value Co-creation- Insights from Banking. In Proceedings of the 25th European Conference on Information Science (ECIS), Guimaracs, Portugal, 5–10 June 2017. [Google Scholar]
  17. Fu, W.; Wang, Q.; Zhao, X. The influence of platform service innovation on value co-creation activities and the network effect. J. Serv. Manag. 2017, 28, 348–388. [Google Scholar] [CrossRef]
  18. Yu, C.H.; Tsai, C.C.; Wang, Y.; Lai, K.K.; Tajvidi, M. Towards building a value co-creation circle in social commerce. Comput. Hum. Behav. 2020, 108, 105476. [Google Scholar] [CrossRef] [Green Version]
  19. Hatch, M.J.; Schultz, M. Toward a theory of brand co-creation with implications for brand governance. J. Brand Manag. 2010, 17, 590–604. [Google Scholar] [CrossRef]
  20. Ramaswamy, V.; Ozcan, K. Brand value co-creation in a digitalized world: An integrative framework and research implications. Int. J. Res. Market. 2016, 33, 93–106. [Google Scholar] [CrossRef]
  21. Schau, H.J.; Muñiz, A.M., Jr.; Arnould, E.J. How brand community practices create value. J. Market. 2009, 73, 30–51. [Google Scholar] [CrossRef]
  22. Nadeem, W.; Al-Imamy, S. Do ethics drive value co-creation on digital sharing economy platforms? J. Retail. Consum. Serv. 2020, 55, 102095. [Google Scholar] [CrossRef]
  23. Díaz-Chao, A.; Sainz-González, J.; Torrent-Sellens, J. The competitiveness of small network-firm: A practical tool. J. Bus. Res. 2016, 69, 1769–1774. [Google Scholar] [CrossRef]
  24. Shy, O. The Economics of Network Industries; Cambridge University Press: Cambridge, UK, 2001. [Google Scholar]
  25. Viktor, M.S.; Kenneth, C. Big Data: A Revolution That Will Transform How We Live, Work, and Think; Eamon Dolan/Mariner Books: London, UK, 2014. [Google Scholar]
  26. Eisenmann, T.; Parker, G.; van Allstyne, W. Strategies for two-sided markets. Harv. Bus. Rev. 2006, 84, 92–101. [Google Scholar]
  27. Ali, S.A.; Wang, S.; Ming, X. Platform enterprise business model: Their essence and particularity. J. Res. Bus. Econom. Manag. 2018, 10, 1882–1889. [Google Scholar]
  28. Cusumano, A.; Gawer, A.; Yoffie, D.B. The Businesses of Platforms: Strategy in the Age of Digital Competition, Innovation, and Power; Harper Business School: Boston, MA, USA, 2019. [Google Scholar]
  29. Rietveld, J.; Schilling, M.; Bellavitis, C. Platform strategy: Managing ecosystem value through selective promotion of complements. Organ. Sci. 2019, 6, 1125–1163. [Google Scholar] [CrossRef]
  30. Basoleand, R.C.; Karta, J. On the evolution of mobile platform ecosystem: Structure and strategy. Bus. Inform. Syst. Eng. 2011, 5, 313–322. [Google Scholar] [CrossRef]
  31. Gawer, A. Building different perspectives on technological platforms: Towards an integrative framework. Res. Policy 2014, 43, 1239–1249. [Google Scholar] [CrossRef] [Green Version]
  32. Zhu, F. Friends or foes? Examining platform owners’ entry into complementors’ spaces. J. Econom. Manag. Strat. 2019, 28, 23–28. [Google Scholar] [CrossRef] [Green Version]
  33. Boudreau, K. Open platform strategies and innovation: Granting access vs. devolving control. Manag. Sci. 2020, 56, 1849–1872. [Google Scholar] [CrossRef] [Green Version]
  34. Ramírez, R. Value co-production: Intellectual origins and implications for practice and research. Strateg. Manag. J. 1999, 20, 49–65. [Google Scholar] [CrossRef]
  35. Grönroos, C.; Voima, P. Critical service logic: Making sense of value creation and co-creation. J. Acad. Market. Sci. 2013, 41, 133–150. [Google Scholar] [CrossRef]
  36. Vargo, S.L.; Lusch, R.F. Service-dominant logic: Continuing the evolution. J. Acad. Market. Sci. 2008, 36, 1–10. [Google Scholar] [CrossRef]
  37. Prahalad, C.K.; Ramaswamy, V. Co-opting customer competence. Harv. Bus. Rev. 2000, 78, 79–90. [Google Scholar]
  38. Sheth, J.N. Customer value propositions: Value co-creation. Indus. Market. Manag. 2019, 87, 312. [Google Scholar] [CrossRef]
  39. Maslow, A.H. Theory Z. J. Trans. Psychol. 1969, 1, 31–47. [Google Scholar] [CrossRef] [Green Version]
  40. Lovelock, C.; Wirtz, J. Services Marketing: People, Technology, Strategy, 5th ed.; Prentice-Hall: Englewood Cliffs, NJ, USA, 2004. [Google Scholar]
  41. Basole, R.C.; Rouse, W.B. Complexity of service value networks: Conceptualization and empirical investigation. IBM Syst. J. 2008, 47, 53–68. [Google Scholar] [CrossRef]
  42. Zeithaml, V.; Rust, R.; Lemon, K. The customer pyramid: Creating and serving profitable customers. Calif. Manag. Rev. 2001, 43, 118–142. [Google Scholar] [CrossRef]
  43. Dolan, R.; Seo, Y.; Kemper, J. Complaining practices on social media in tourism: A value co-creation and co-destruction perspective. Tour. Manag. 2019, 73, 35–45. [Google Scholar] [CrossRef]
  44. Islam, J.U.; Rahman, Z. The impact of online brand community characteristics on customer engagement: An application of Stimulus-Organism-Response paradigm. Telemat. Inform. 2017, 34, 96–109. [Google Scholar] [CrossRef]
  45. Lin, K.Y.; Lu, H.P. Why people use social networking sites: An empirical study integrating network externalities and motivation theory. Comput. Hum. Behav. 2011, 27, 1152–1161. [Google Scholar] [CrossRef]
  46. Vargo, S.L.; Lusch, R.F. From repeat patronage to value co-creation in service ecosystems: A transcending conceptualization of relationship. J. Bus. Market Manag. 2010, 4, 169–179. [Google Scholar] [CrossRef]
  47. Vargo, S.L.; Lusch, R.F. It’s all B2B…and beyond: Toward a systems perspective of the market. Indus. Market. Manag. 2011, 40, 181–187. [Google Scholar] [CrossRef]
  48. Vargo, S.L.; Lusch, R.F. Service-Dominant Logic: Premises, Perspectives, Possibilities; Cambridge University Press: Cambridge, UK, 2014. [Google Scholar]
  49. Vargo, S.L.; Lusch, R.F. Institutions and axioms: An extension and update of service-dominant logic. J. Acad. Market. Sci. 2016, 4, 5–23. [Google Scholar] [CrossRef]
  50. Matthyssens, P.; Vandenbempt, K.; Berghman, L. Value innovation in business markets: Breaking the industry recipe. Indus. Market. Manag. 2006, 356, 751–761. [Google Scholar] [CrossRef]
  51. Kim, C.; Oh, E.; Shin, N. An empirical investigation of digital content characteristics, value, and flow. J. Comput. Inform. Syst. 2010, 50, 79–87. [Google Scholar] [CrossRef]
  52. Agrawal, A.; Choudhary, A. Perspective: Materials informatics and big data: Realization of the fourth paradigm of science in materials science. APL Mater. 2016, 4, 053208. [Google Scholar] [CrossRef] [Green Version]
  53. Edvardsson, B.; Tronvoll, B.; Gruber, T. Expanding understanding of service exchange and value co-creation: A social construction approach. J. Acad. Market. Sci. 2011, 39, 327–339. [Google Scholar] [CrossRef] [Green Version]
  54. Lusch, R.F.; Vargo, S.L. Service-dominant logic: Reactions, reflections and refinements. Market. Theory 2006, 6, 281–288. [Google Scholar] [CrossRef]
  55. Yin, R.K. Case Study Research, Design & Methods, 4th ed.; Sage Publication: London, UK, 2009. [Google Scholar]
  56. Eisenhardt, K.M. Building theories from case study research. Acad. Manag. Rev. 1989, 14, 68–101. [Google Scholar] [CrossRef]
  57. Patton, M.Q. Qualitative Evaluation and Research Methods, 2nd ed.; Sage Publication: London, UK, 1990. [Google Scholar]
  58. Strauss, A.; Corbin, J. Grounded Theory in Practice; Sage Publication: London, UK, 1997. [Google Scholar]
  59. Jick, T.D. Mixing qualitative and quantitative methods: Triangulation in action. Admin. Sci. Q. 1979, 24, 602–611. [Google Scholar] [CrossRef] [Green Version]
  60. Nicholas, C.D.; Jamali, H. Evaluating information seeking and use in the changing virtual world: The emerging role of Google analytics. Learn. Publ. 2014, 27, 185–194. [Google Scholar] [CrossRef] [Green Version]
  61. Wang, Y.; Kung, L.; Wang, W.Y.C.; Cegielski, C.G. An integrated big data analytics-enabled transformation model: Application to health care. Inform. Manag. 2018, 55, 64–79. [Google Scholar] [CrossRef] [Green Version]
  62. Choi, J.P.; Thum, M. Market structure and the timing of technology adoption with network externalities. Eur. Econom. Rev. 1998, 42, 225–244. [Google Scholar] [CrossRef] [Green Version]
  63. Clifton, B. Successful Analytics: Gain Business Insights by Managing Google Analytics, 1st ed.; Advanced Web Metrics Ltd.: Brighton, UK, 2016. [Google Scholar]
  64. Fabiani, S.; Schivardi, F.; Trento, S. ICT adoption in Italian manufacturing: Firm-level evidence. Ind. Corp. Chang. 2005, 14, 225–249. [Google Scholar] [CrossRef]
  65. Frambach, R.T.; Schillewaert, N. Organizational innovation adoption: A multi-level framework of determinants and opportunities for future research. J. Bus. Res. 2002, 55, 163–176. [Google Scholar] [CrossRef]
  66. Wang, E.T.G.; Seidmann, A. Electronic data interchange: Competitive externalities and strategic implementation policies. Manag. Sci. 1995, 41, 401–418. [Google Scholar] [CrossRef]
  67. Zena, M.S.; Hadisumarto, A. The study of the relationships among experiential marketing, service quality, customer satisfaction and customer loyalty. ASEAN Market. J. 2013, 4. [Google Scholar] [CrossRef]
  68. Yang, H.E.; Wu, C.C.; Wang, K.C. An empirical analysis of online game service satisfaction and loyalty. Exp. Syst. Appl. 2009, 36, 1816–1825. [Google Scholar] [CrossRef]
  69. Biemer, P.P.; Dowd, K.; Webb, M.B. Study Design and Methods; Oxford UP: New York, NY, USA, 2010. [Google Scholar]
Figure 1. Diagram of the relationships between participants in the platform ecosystem.
Sustainability 14 05612 g001
Figure 2. The framework of value co-creation cycle in platform businesses.
Sustainability 14 05612 g002
Figure 3. Performance chart of the redirection of web traffic to platform producers by platform businesses.
Sustainability 14 05612 g003
Figure 4. Illustration of interactions between platform producers and consumers.
Sustainability 14 05612 g004
Figure 5. Value co-creation performance of platform producers.
Sustainability 14 05612 g005
Table 1. Platform business investments and platform consumer outputs.
Year2014201520162017201820192020
Application team workforce2222102025
APP upgrade frequency671123425865
Ratio of taxi-booking via APP20%30%32%35%60%73%75%
Level of satisfaction (scale of 1 to 5)3.13.13.23.44.54.64.7
Table 2. Platform businesses and value co-creation performance.
Year2014201520162017201820192020
Number of APP Members (‘000)700100013501750310040004600
Increase in Number of APP Members (‘000)--3003504001350900600
Number of Taxi-Booking made via APP (‘000)12,00021,00025,60031,50060,00087,600100,600
Number of Credit-Card Bound by APP (‘000)--------250350650
Table 3. Platform consumers and value co-creation performance.
Year2014201520162017201820192020
APP active # (‘000)70180330550210030003500
APP active %10%18%24%30%68%75%76%
Average number of rides per person1.82.32.83.58.79.610.1
Publisher’s Note: MDPI stays neutral with regard to jurisdictional claims in published maps and institutional affiliations.

